Abstract
Objective:
To longitudinally assess and predict on-road driving safety in Parkinson disease (PD).
Methods:
Drivers with PD (n = 67) and healthy controls (n = 110) drove a standardized route in an instrumented vehicle and were invited to return 2 years later. A professional driving expert reviewed drive data and videos to score safety errors.
Results:
At baseline, drivers with PD performed worse on visual, cognitive, and motor tests, and committed more road safety errors compared to controls (median PD 38.0 vs controls 30.5; p < 0.001). A smaller proportion of drivers with PD returned for repeat testing (42.8% vs 62.7%; p < 0.01). At baseline, returnees with PD made fewer errors than nonreturnees with PD (median 34.5 vs 40.0; p < 0.05) and performed similar to control returnees (median 33). Baseline global cognitive performance of returnees with PD was better than that of nonreturnees with PD, but worse than for control returnees (p < 0.05). After 2 years, returnees with PD showed greater cognitive decline and larger increase in error counts than control returnees (median increase PD 13.5 vs controls 3.0; p < 0.001). Driving error count increase in the returnees with PD was predicted by greater error count and worse visual acuity at baseline, and by greater interval worsening of global cognition, Unified Parkinson's Disease Rating Scale activities of daily living score, executive functions, visual processing speed, and attention.
Conclusions:
Despite drop out of the more impaired drivers within the PD cohort, returning drivers with PD, who drove like controls without PD at baseline, showed many more driving safety errors than controls after 2 years. Driving decline in PD was predicted by baseline driving performance and deterioration of cognitive, visual, and functional abnormalities on follow-up.
Parkinson disease (PD) impairs motor function, cognition, vision, sleep, and alertness1 and is associated with lower performance and safety on road tests.2–20 Using a standardized road test in an instrumented vehicle, we have shown that drivers with PD commit significantly more errors than aging control drivers without neurologic disease.6 Total number of road safety errors at baseline predicted future driving cessation and moving violations in our cohort study.8 Recently, we have demonstrated stability of road safety error counts in neurologically healthy aging drivers over 2 years.21 In this article, we describe the evolution of road safety error counts over 2 years in drivers with PD in comparison to changes in neurologically healthy drivers of similar age.
We hypothesized that (1) drivers with PD would show a significant decline in their driving based on safety error counts on a standardized road test, (2) this decline will be larger than in comparison drivers without PD, (3) and the decline in road safety in the PD group can be predicted by cognitive, visual, and motor dysfunction.
METHODS
Participants.
All participants were community-dwelling, independently living, and licensed active drivers with driving experience of greater than 10 years. Their driving licenses had been renewed within the last 5 years before enrolling in the study. Participants with PD were recruited from the Movement Disorders Clinics at the Department of Neurology, University of Iowa, and Veterans Affairs Medical Center, both in Iowa City, to participate in a longitudinal study of driving safety in PD. The controls were participants of a longitudinal study on prediction of driving safety in middle-aged and older adults. Exclusion criteria included cessation of driving prior to encounter; presence of acute illness or active, confounding medical or psychiatric condition; other neurologic disease leading to dementia and motor dysfunction; secondary parkinsonism; Parkinson-plus syndromes; recent treatment with centrally acting dopaminergic blockers or investigational drugs; and diseases of the optic nerve, retina, or ocular media with corrected visual acuity less than 20/50. In spring 2007, all road drives in our laboratory were reviewed in a standardized manner as described below. To ensure opportunity for 2 years follow-up, only participants who had their baseline drive by March 2005 were included, resulting in 67 drivers with PD and 110 control drivers.
Standard protocol approvals, registrations, and patient consents.
The study was approved by the institutional review board of the University of Iowa. Written informed consent was obtained from all participants in the study.
Off-road testing battery.
The battery methodology is explained in detail in our past work.2–6,8 For all tests, raw scores were used for analysis.
Cognitive testing.
Basic visual sensory functions.
Near visual acuity (NVA), far visual acuity, and contrast sensitivity (CS) were tested.
Visual perception.
Useful field of view (UFOV) for information processing speed and attention, structure from motion for motion, and Judgment of Line Orientation (JLO) were used.
Visuospatial construction.
Complex Figure Test–Copy Version (CFT-Copy), Block Design, was used.
Memory.
Rey Auditory Verbal Learning Test (AVLT) (anterograde verbal memory), CFT–Recall administered 30 minutes after the CFT-Copy (visual memory), and Benton Visual Retention Test–errors (BVRT) were used.
Executive functions.
Trail Making Test (TMT) (B-A) was used for measurement of set shifting. Controlled Oral Word Association Test (COWA), also a measure of language, tested fluency.
Global.
Mini-Mental State Examination (PD group only) and a composite measure of cognition (COGSTAT), calculated by assigning and summing standard T scores (mean 50, SD 10) to 8 tests from the cognitive test battery (CFT-Copy, CFT-Recall, Block Design, BVRT, TMT, AVLT, JLO, and COWA), were used.
Depression.
Geriatric Depression Scale was used.
Motor function/parkinsonism.
Unified Parkinson's Disease Rating Scale (UPDRS) and Functional Reach for balance were used. PD medications were recorded and total levodopa equivalents daily dose was calculated for each visit. The UPDRS is an ordinal scale with all items scored from 0 = normal function to 4 = very severely disabled. It has 3 sections: (1) mental, behavior, and mood (including a question about motivation/apathy); (2) the activities of daily living (ADL) subscale is based on interview; (3) the UPDRS motor section is based on physical examination to evaluate different aspects of parkinsonism.
Driving history.
Driving Habits Questionnaire was used to collect information on driving history (e.g., crashes within the last year) and exposure.
The road test.
The 18-mile road test was conducted aboard an instrumented vehicle, usually within a few weeks of cognitive and visual testing, sometimes on the same day. The test began after a brief acclimation period to the vehicle; a trained experimenter sat in the front passenger seat to give instructions, and to operate the dual controls and terminate the drive if needed for safety reasons. The vehicle (Automobile for Research in Ergonomics and Safety) is a midsized car with an automatic transmission and sensors that record electronic data at 10 Hz (e.g., steering wheel position, vehicle speed).2–4,6,21 Miniature lipstick-sized cameras captured the driver's face, pedal use, lane position of the driver-side front wheels, and forward view of the road. The participants drove across residential city streets, suburban commercial strips, rural 2-lane highways, and a 4-lane 65 mph speed limit freeway. Drivers were instructed to drive as they would in their usual life and were tested in the medication “on” state, under good visibility and road conditions.
Safety errors.
A professional driving instructor, different from the person who administered the drive, reviewed tapes with a multiplex view using 4 channels of video with superimposed digital driving data (e.g., speed) that showed the driver's face, pedal use, lane position of the driver-side front wheels, and forward view of the road enabling standardized and reproducible detection of lane deviation errors, noncompliance with traffic signs, and speed limit violations at any time of the drive.6,21,22 The reviewer assessed the number and type of safety errors committed by the participants using a classification based on the Iowa Department of Transportation's Drive Test Scoring Standards (September 7, 2005, version). The taxonomy of 76 error types (e.g., incomplete stop, straddles lane line) were organized into 15 categories (e.g., stop signs, lane observance); 30 of those errors were classified as serious (e.g., entering an intersection on a red light, failure to observe one way, no passing signs, straddling the center line while taking curves) due to their potential to give rise to accidents or disruptions in traffic flow and correspond to failure errors in the Iowa Department of Transportation classification. The driving instructor's intrarater reliability was 0.95 for total error counts, and interrater reliability against another certified driving instructor on a random subsample of 30 drives was 0.73.6,21,22
Statistical analysis.
The main outcome measure in this study was total driving error counts and their difference 2 years after baseline testing. Basic descriptive statistics (means, SD, and in some cases medians) were calculated for the variables in the study. Baseline demographics were compared between groups using the Wilcoxon rank-sum test and Fisher exact test. Partial Spearman rank correlations were used to compare neuropsychological measures and driving outcomes between groups, adjusting for baseline demographics.
Among participants with PD only, we used multiple linear regression to predict the total number of safety errors at follow-up as a function of baseline or changes in neuropsychological test scores, adjusting for baseline safety errors, age, and education. We did not adjust for sex in this set of analyses, as it was not a significant factor in predicting cognitive, visual, motor, or driving outcomes. All predictors from these analyses with a p value <0.05, plus age, education, and baseline driving errors, were included as potential covariates in an overall model and maximizing the adjusted R2 was used as a model selection criterion. Analyses were performed in SAS (SAS Institute, Cary, NC) and SPSS (SPSS Inc., Chicago, IL).
RESULTS
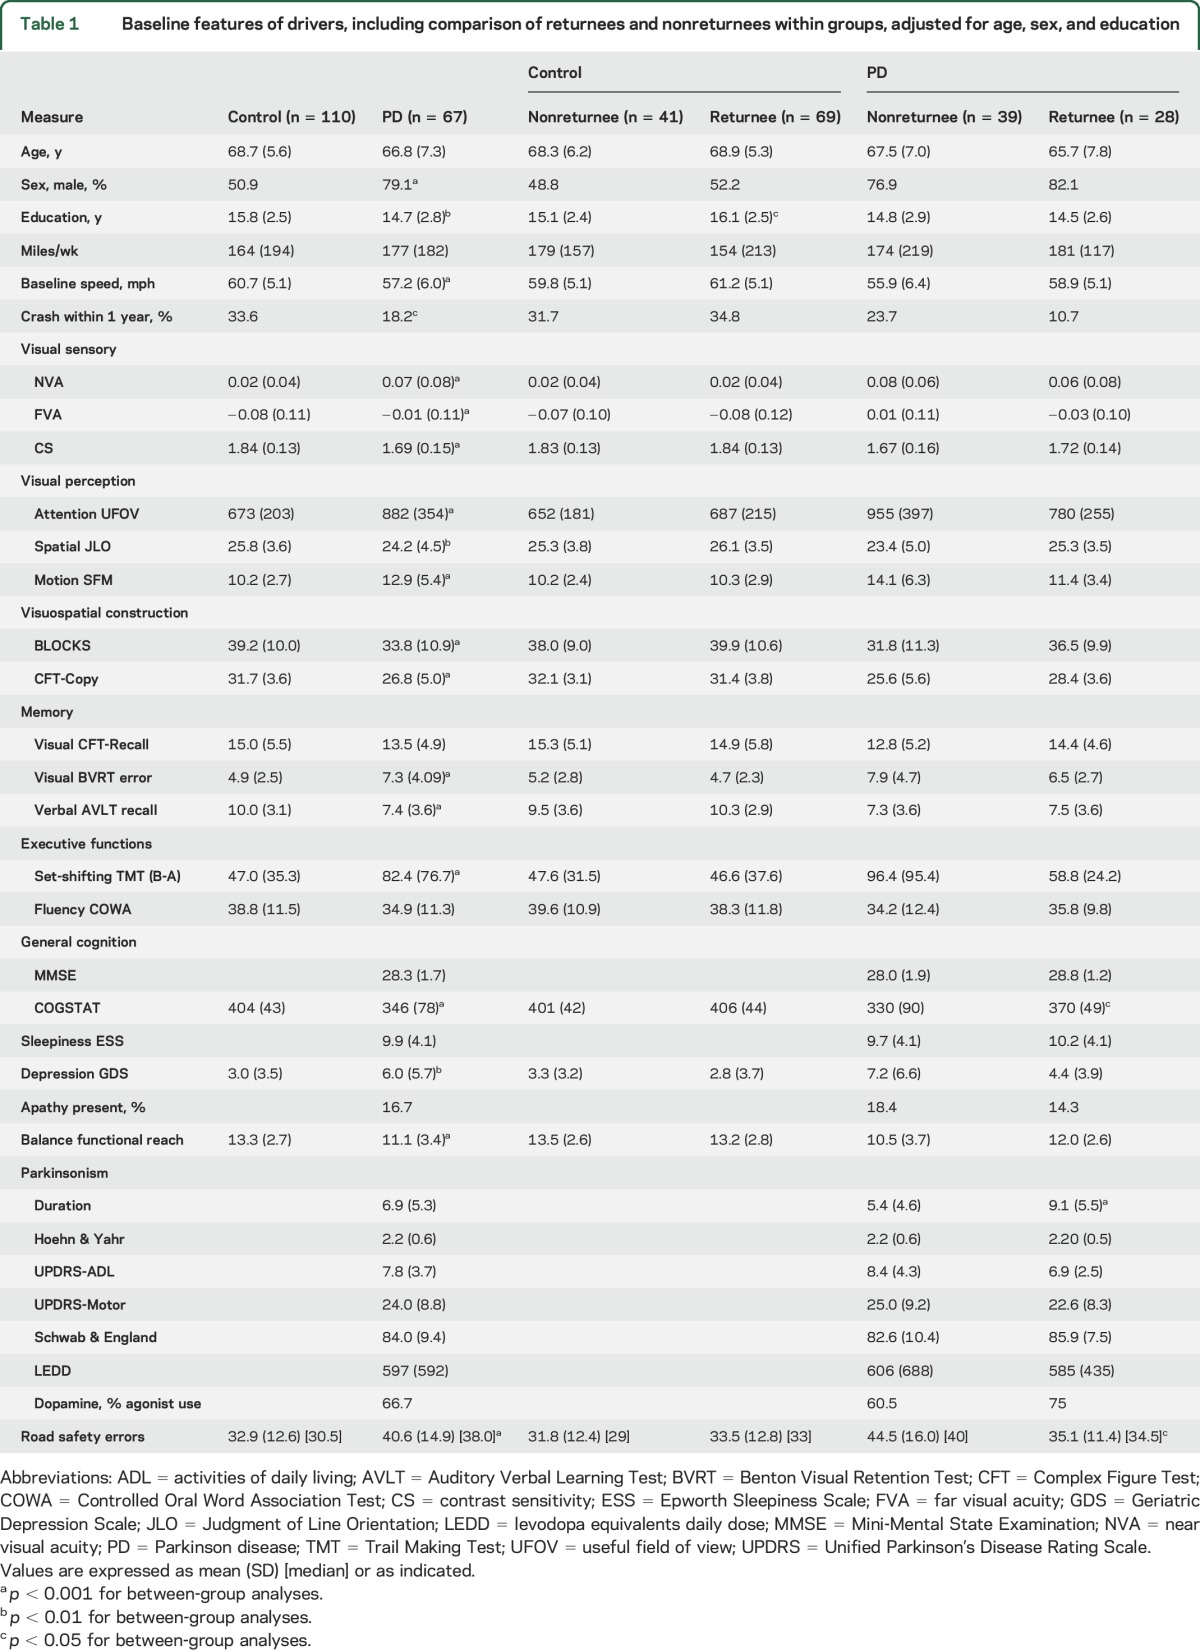
Compared to controls, the PD driver cohort was slightly less educated, and skewed more to male. Drivers with PD performed worse on visual, cognitive, and motor tests, scored higher on depression scale, drove slower, and committed more total road safety errors at baseline (table 1).
Table 1.
Baseline features of drivers, including comparison of returnees and nonreturnees within groups, adjusted for age, sex, and education
Two years later, 28 (42.8%) drivers with PD and 69 (62.7%) control drivers returned for repeat road testing (p < 0.01, Fisher exact test). The causes for not returning included driving cessation (12 PD, 1 control), death (1 PD, 3 control), and declination of the invitation (26 PD, 47 control) due to various reasons such as non-PD health concerns, limitations of driving to local region, or lack of interest.
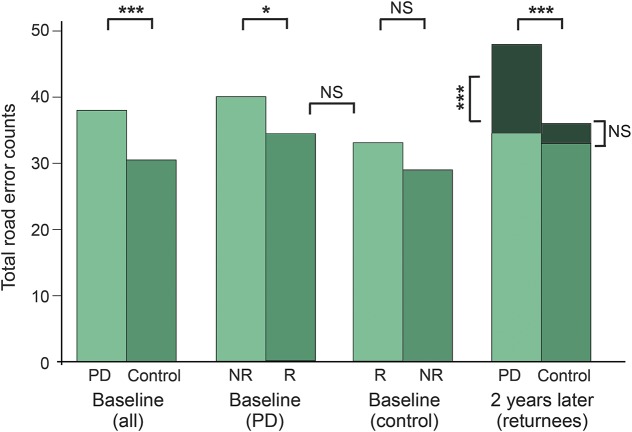
The baseline total driving error counts of returnees with PD (median 34.5) was similar to control returnees (median 33), but significantly less than nonreturnees with PD (median 40). There was no significant difference in error counts between returnees and nonreturnees within the control group (table 1 and figure). There were no demographic differences between returnees and nonreturnees in the PD group at baseline. The returnees with PD had a higher global cognition (COGSTAT) score despite having longer disease duration (table 1). There were no significant baseline differences between the returnees and nonreturnees in the control group except higher education in the returnees.
Figure. Total error counts (medians) at baseline and after 2-year follow-up.
At baseline, the Parkinson disease (PD) group performed worse compared to controls. The baseline counts of returnees (R) with PD were lower (better) than those of nonreturnees (NR) with PD, and similar to those of control returnees. There were no significant differences between control returnees and control nonreturnees. Two years later, PD-R had much higher error counts than control-R. The increase in error counts in PD-R (median 13.5) was highly significant, whereas the control-R had only a minor nonsignificant (NS) increase in error counts (median 3.0). * p < 0.05; *** p < 0.001.
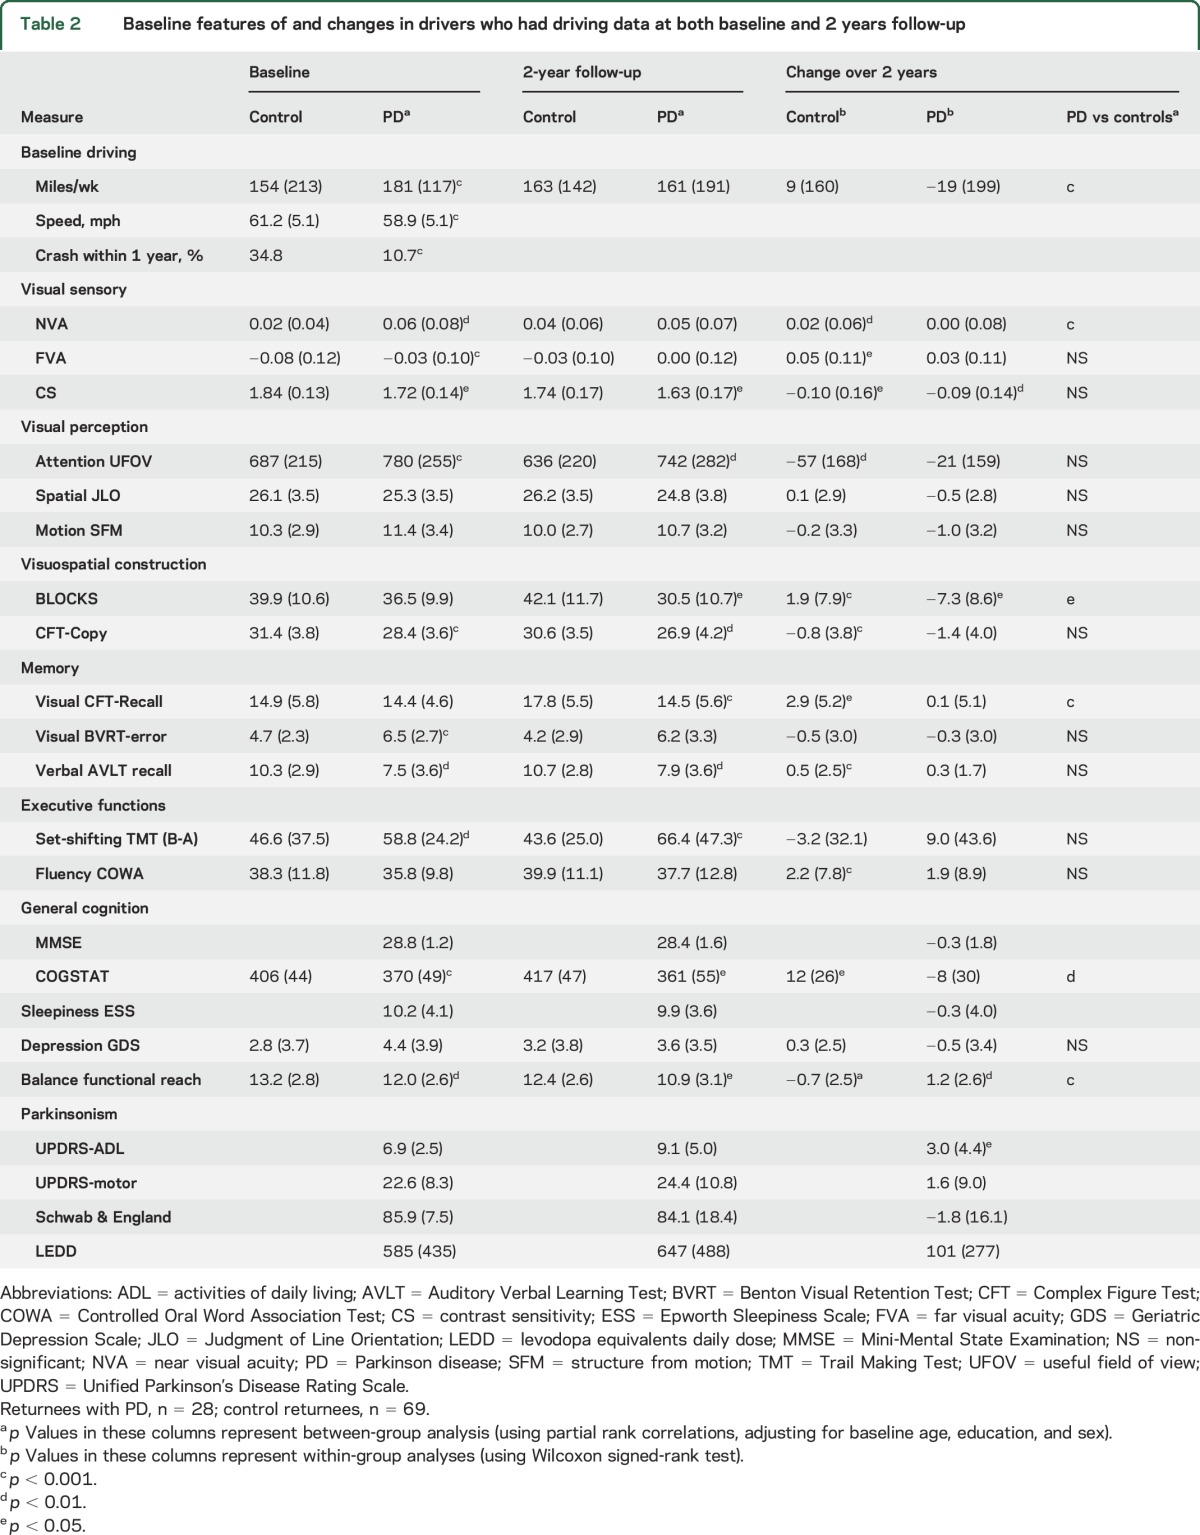
Compared to control returnees, returnees with PD scored worse on several visual and cognitive tests and balance at baseline (table 2). These differences on vision, cognitive, and balance tests were still present 2 years later between the groups and the deficits became more prominent in the PD group (table 2). Within-group analysis showed improvements in some tests in the control group, but deterioration of performance for various visual, cognitive, and motor tests in PD, in particular CS, BLOCKS, functional reach, and UPDRS-ADL scores (table 2). Comparison of changes in visual, cognitive, and motor test performances revealed that the PD group had significantly higher worsening in global cognition (COGSTAT), predominantly driven by deterioration of visuospatial construction (BLOCKS) and memory (CFT-Recall), as seen in table 2.
Table 2.
Baseline features of and changes in drivers who had driving data at both baseline and 2 years follow-up
Comparison of driving performance between returnees of both groups at baseline showed no significant difference in the total driving error counts (median 34.5 vs 33.0) and in most error categories except a higher count for stop signs in the PD group (table 3). However, 2 years later, the results markedly favored the control group: the PD group committed significantly more errors than the control group in total counts (median 46.5 vs 33.0; p < 0.001, figure), as well in the subcategories of serious, lane observance, overtaking, stop sign, and turn errors (table 3). Comparison of change in driving performance revealed a sharp increase of total error counts in the PD group vs the control group (medians 13.5 vs 3.0; p < 0.001, table 3 and figure). The PD group also showed significantly more increase in the following error categories: serious errors, turns, lane observance, miscellaneous, and overtaking (table 3). However, termination of the on-road research drive for safety reasons was not required for any of the drivers in the present study.
Table 3.
Baseline values and changes in road safety errors in returnees at baseline and 2 years follow-up
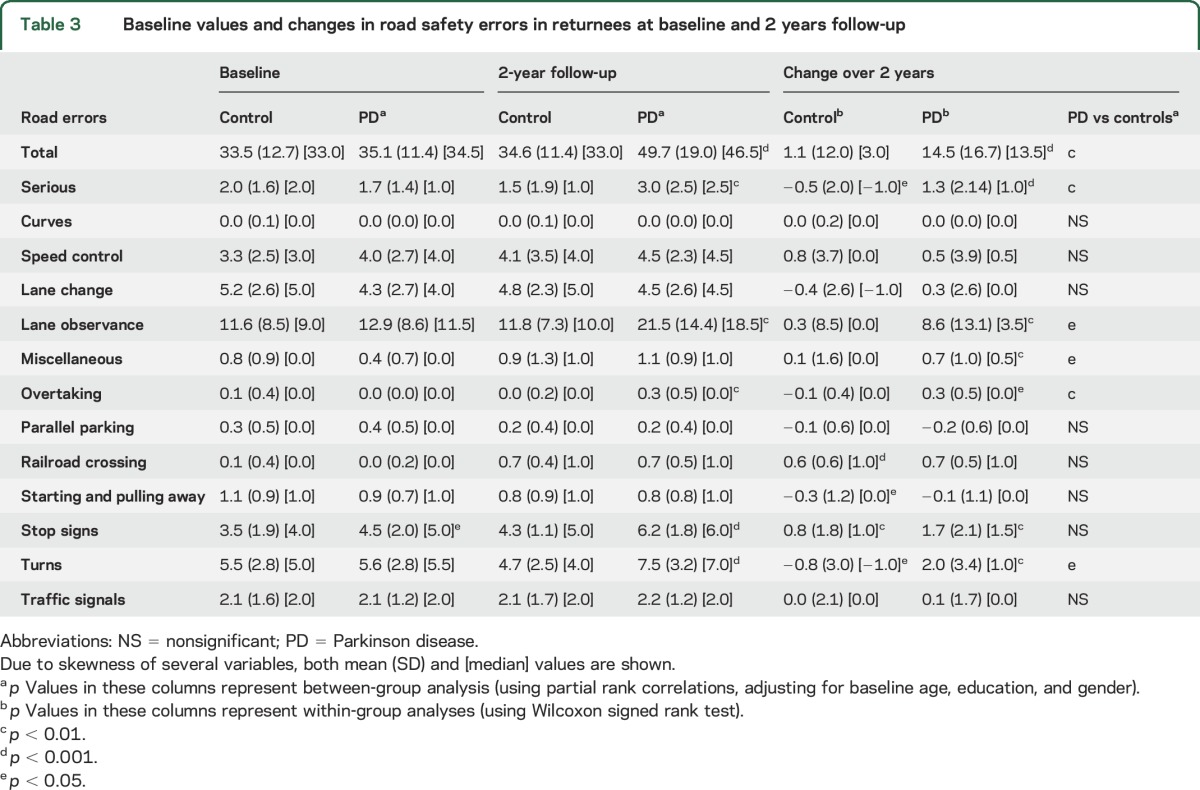
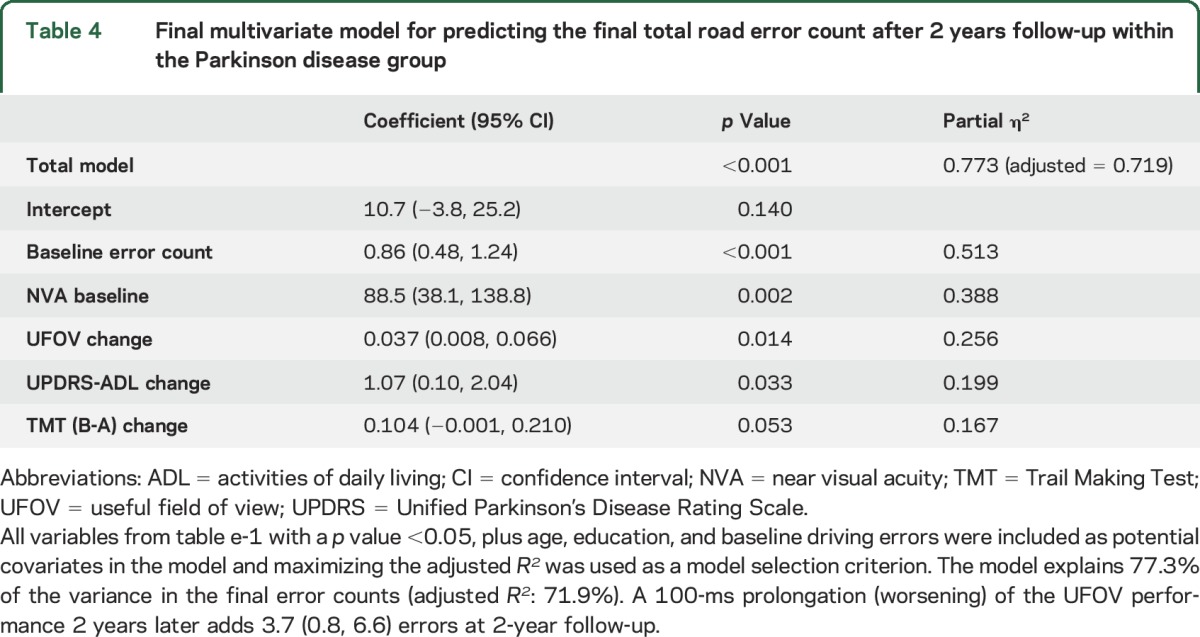
Table e-1 at Neurology.org shows general linear model regression coefficients for the baseline value and change in each variable in predicting final total driving error counts after 2 years follow-up within the PD group, while controlling for age, education, sex, and baseline total error counts. The baseline value of NVA, and change values on visual speed of processing/attention (UFOV), visual working memory (BVRT error), set shifting (TMT [B-A]), global composite cognitive score (COGSTAT), and the UPDRS-ADL score, predicted final error counts at 2 years. The most parsimonious final multivariate model included baseline error counts and NVA, and change values of UFOV, TMT (B-A), and UPDRS-ADL (table 4). This model accounted for 71.9% of variance (adjusted R2) in the final error counts at 2 years.
Table 4.
Final multivariate model for predicting the final total road error count after 2 years follow-up within the Parkinson disease group
We analyzed the association of various additional baseline factors that can be associated with driving safety in response to reviewer comments.
Driving speed.
We found that speed (mph) of drivers with PD on a straight uneventful freeway segment3 was slower than that of controls (table 1).
Recent history of crashes.
A significantly larger proportion of controls were involved in crashes (fault status unknown) within 1 year before enrollment in the study compared to the PD group.
PD drug category.
We did not have a measure of impulse control disorders (ICD) in our off-road battery, but considering that ICD are more often seen in patients on dopamine agonists,23 we performed subgroup analyses in the PD group comparing those on a dopamine agonist (alone or with other antiparkinsonian agents) vs not.
Apathy.
We used the motivation question of UPDRS I subscale (score ≥2)24 to determine if apathy was present in patients with PD. None of these baseline factors predicted returnee status (table 1) or worsening of driving errors over time among the PD group except the baseline speed (table e-1). One mile per hour increase in baseline speed predicted 1.36 (95% confidence interval 0.11, 2.62; p = 0.035) more errors during the follow up drive, suggesting that slower driving could represent a compensatory mechanism to reduce driving errors.
DISCUSSION
The principal findings of our longitudinal cohort study are that driving safety in PD (1) was worse than controls at baseline as shown before,6 (2) declined significantly and more profoundly than in controls after 2 years (despite attrition of PD drivers with poorer performance at baseline), and (3) that poor baseline performance and progression over time in various cognitive, visual, and PD characteristics predicted worsening of road safety in PD.
There was significantly larger attrition in the PD cohort compared to controls due to driving cessation, death, and dropping out, consistent with our finding of increased driving cessation in the PD group.8 The returnees in the PD group showed better performance on total driving error counts and global cognition than PD nonreturnees at baseline. However, baseline motor function scores and demographic features did not differ between PD returnees and nonreturnees. Thus, a clinic visit only concentrating on motor aspects of the disease may not signal the neurologist about potential driving problems in the near future for patients with PD.
At baseline, the performance on the road test did not significantly differ between the returnees with PD and the control group returnees on total error counts and all subcategories except for more problems with stop signs in the PD group. Returnees with PD performed worse on tests of cognition, vision, and motor function compared to control returnees at baseline. These findings suggest that the returnees with PD were in a compensated state of driving safety at baseline despite their relative cognitive, visual, and motor deficits compared to controls. The precipitous decline in their driving safety 2 years later, along with deterioration in cognition and vision, suggests that their driving ability decompensated during this period. However, termination of the drive for safety reasons was not required for any of the returnees, indicating that all drivers retained the ability to drive under the conditions of the test, i.e., daylight hours, good weather, and mild to moderately demanding traffic conditions.
The main categories of decline in road performance within PD represented impairments in complex and critical maneuvers such as turns at intersections and overtaking, emphasizing the importance of visual processing speed, attention, visuospatial abilities, and executive functions in for safe driving. However, lane observance also deteriorated more in the PD group, consistent with underlying poor vehicle control during uneventful straightaway driving.
In addition to worsening of global cognition, deterioration of error counts was predicted by poor baseline visual sensory function (near visual acuity) and worsening of visual processing speed and attention, visual working memory, cognitive flexibility and set shifting, and ADL score. These predictors are consistent with the most frequent nonmotor deficits in mild to moderate PD, and reflect impairments in primary neural demands of driving (visual function across all levels and executive functions25). The UPDRS-ADL score, but not the UPDRS motor score, was also an important predictor of driving cessation in our cohort,8 suggesting a measure of function over a period of time, rather than a snapshot of severity of parkinsonism, is a better metric of decline of driving safety over time.
Limitations of our study included lack of measures for anxiety and ICD that could have affected driving. However, clinical interviews with our participants did not reveal evidence of ICD, and being on a dopamine agonist was not associated with driving outcomes in our study.
Our findings show increasing risk for driving safety errors associated with progression of PD and suggest that even normal current drivers with PD are vulnerable to significant decline in safety over a short period of time. Thus, health care providers for patients with PD should routinely inquire about their driving status and make necessary referrals for evaluation of driving fitness as needed. However, caution must be exercised in deriving generalized driving recommendations for patients with PD from this experimental study. Performance deficits and rate of progression vary greatly across patients. These findings underscore that driving safety recommendations must be based on individualized patient evaluations, not diagnosis alone. Our multivariate model suggests several tests can predict increasing driver errors. Individualized recommendations can consider the patient's cognitive, perceptual, and motor performance and types of driving conditions encountered. For example, a patient with mild deficits might be advised to restrict driving to low-speed familiar roads in daylight and good weather conditions. Interviewing the patient and a collateral regarding crashes, near crashes, traffic violations, and safety concerns of the patient, family, and health care providers should be combined with standardized assessment. The evidence from this longitudinal study suggests the need for periodic cognitive evaluations by a neuropsychologist and driving safety evaluations by a state licensing agency (e.g., Department of Transportation in Iowa) or a certified driving rehabilitation specialist17 (if insurance coverage is available) to update clinical recommendations. These periodic evaluations (e.g., annual) could occur more or less frequently based on individual characteristics, e.g., rapid progression vs relative stability. Thus, health care providers for patients with PD should routinely inquire about driving status and make necessary referrals for evaluation of driving fitness as needed. Further research is needed to determine if improvement of underlying impairments in visual perception, executive function, and motor abilities through physical exercise and cognitive training can preserve driving ability in PD for a longer time.26
Supplementary Material
GLOSSARY
- ADL
activities of daily living
- AVLT
Auditory Verbal Learning Test
- BVRT
Benton Visual Retention Test
- CFT
Complex Figure Test
- COWA
Controlled Oral Word Association Test
- CS
contrast sensitivity
- ICD
impulse control disorders
- JLO
Judgment of Line Orientation
- NVA
near visual acuity
- PD
Parkinson disease
- TMT
Trail Making Test
- UFOV
useful field of view
- UPDRS
Unified Parkinson's Disease Rating Scale
Footnotes
Supplemental data at Neurology.org
AUTHOR CONTRIBUTIONS
Ergun Y. Uc: drafting/revising the manuscript, study concept or design, analysis or interpretation of data, accepts responsibility for conduct of research and final approval, acquisition of data, statistical analysis, study supervision, and obtaining funding. Matthew Rizzo: drafting/revising the manuscript, study concept or design, analysis or interpretation of data, accepts responsibility for conduct of research and final approval, and study supervision. Amy M.J. O'Shea: analysis or interpretation of data, accepts responsibility for conduct of research and final approval, and statistical analysis. Steven W. Anderson: drafting/revising the manuscript, study concept or design, analysis or interpretation of data, accepts responsibility for conduct of research and final approval. Jeffrey D. Dawson: drafting/revising the manuscript, study concept or design, analysis or interpretation of data, accepts responsibility for conduct of research and final approval, statistical analysis, and obtaining funding.
STUDY FUNDING
Supported by NINDS R01 NS044930 (E.Y.U.), NIA R01 AG17717, and NIA R01 AG15071 (M.R.).
DISCLOSURE
E. Uc has received research support from the NIH, Department of Veterans Affairs, Michael J. Fox Foundation, Parkinson's Disease Foundation, and Parkinson Study Group. M. Rizzo has received research support from the NIH and the VA (S.W.A., J.D.D.). A. O'Shea has received research support from the NIH and the VA (S.W.A., J.D.D.). S. Anderson has received research support from the NIH and the VA (S.W.A., J.D.D.). J. Dawson has received research support from the NIH and the VA (S.W.A., J.D.D.). Go to Neurology.org for full disclosures.
REFERENCES
- 1.Uc EY, Rizzo M, Anderson SW, Qian S, Rodnitzky RL, Dawson JD. Visual dysfunction in Parkinson disease without dementia. Neurology 2005;65:1907–1913. [DOI] [PubMed] [Google Scholar]
- 2.Uc EY, Rizzo M, Anderson SW, Sparks J, Rodnitzky RL, Dawson JD. Impaired visual search in drivers with Parkinson's disease. Ann Neurol 2006;60:407–413. [DOI] [PubMed] [Google Scholar]
- 3.Uc EY, Rizzo M, Anderson SW, Sparks JD, Rodnitzky RL, Dawson JD. Driving with distraction in Parkinson disease. Neurology 2006;67:1774–1780. [DOI] [PubMed] [Google Scholar]
- 4.Uc EY, Rizzo M, Anderson SW, Sparks JD, Rodnitzky RL, Dawson JD. Impaired navigation in drivers with Parkinson's disease. Brain 2007;130:2433–2440. [DOI] [PubMed] [Google Scholar]
- 5.Uc EY, Rizzo M, Anderson SW, Dastrup E, Sparks JD, Dawson JD. Driving under low-contrast visibility conditions in Parkinson disease. Neurology 2009;73:1103–1110. [DOI] [PMC free article] [PubMed] [Google Scholar]
- 6.Uc EY, Rizzo M, Johnson AM, Dastrup E, Anderson SW, Dawson JD. Road safety in drivers with Parkinson disease. Neurology 2009;73:2112–2119. [DOI] [PMC free article] [PubMed] [Google Scholar]
- 7.Rizzo M, Uc EY, Dawson J, Anderson S, Rodnitzky R. Driving difficulties in Parkinson's disease. Mov Disord 2010;25(suppl 1):S136–S140. [DOI] [PMC free article] [PubMed] [Google Scholar]
- 8.Uc EY, Rizzo M, Johnson AM, et al. Real-life driving outcomes in Parkinson disease. Neurology 2011;76:1894–1902. [DOI] [PMC free article] [PubMed] [Google Scholar]
- 9.Devos H, Vandenberghe W, Nieuwboer A, Tant M, Baten G, De Weerdt W. Predictors of fitness to drive in people with Parkinson disease. Neurology 2007;69:1434–1441. [DOI] [PubMed] [Google Scholar]
- 10.Devos H, Vandenberghe W, Nieuwboer A, et al. Validation of a screening battery to predict driving fitness in people with Parkinson's disease. Mov Disord 2013;28:671–674. [DOI] [PubMed] [Google Scholar]
- 11.Devos H, Vandenberghe W, Tant M, et al. Driving and off-road impairments underlying failure on road testing in Parkinson's disease. Mov Disord 2013;28:1949–1956. [DOI] [PubMed] [Google Scholar]
- 12.Ranchet M, Paire-Ficout L, Uc EY, Bonnard A, Sornette D, Broussolle E. Impact of specific executive functions on driving performance in people with Parkinson's disease. Mov Disord 2013;28:1941–1948. [DOI] [PubMed] [Google Scholar]
- 13.Ranchet M, Paire-Ficout L, Marin-Lamellet C, Laurent B, Broussolle E. Impaired updating ability in drivers with Parkinson's disease. J Neurol Neurosurg Psychiatry 2011;82:218–223. [DOI] [PubMed] [Google Scholar]
- 14.Ranchet M, Broussolle E, Poisson A, Paire-Ficout L. Relationships between cognitive functions and driving behavior in Parkinson's disease. Eur Neurol 2012;68:98–107. [DOI] [PubMed] [Google Scholar]
- 15.Classen S, Witter DP, Lanford DN, et al. Usefulness of screening tools for predicting driving performance in people with Parkinson's disease. Am J Occup Ther 2011;65:579–588. [DOI] [PubMed] [Google Scholar]
- 16.Classen S, Holmes J. Executive functions and driving in people with Parkinson's disease. Mov Disord 2013;28:1909–1911. [DOI] [PubMed] [Google Scholar]
- 17.Crizzle AM, Classen S, Uc EY. Parkinson disease and driving: an evidence-based review. Neurology 2012;79:2067–2074. [DOI] [PMC free article] [PubMed] [Google Scholar]
- 18.Classen S, Brumback B, Monahan M, et al. Driving errors in Parkinson's disease: moving closer to predicting on-road outcomes. Am J Occup Ther 2014;68:77–85. [DOI] [PMC free article] [PubMed] [Google Scholar]
- 19.Crizzle AM, Classen S, Lanford DN, et al. Postural/gait and cognitive function as predictors of driving performance in Parkinson's disease. J Parkinson's Dis 2013;3:153–160. [DOI] [PubMed] [Google Scholar]
- 20.Classen S. Consensus statements on driving in people with Parkinson's disease. Occup Ther Health Care 2014;28:140–147. [DOI] [PubMed] [Google Scholar]
- 21.Aksan N, Anderson SW, Dawson JD, Johnson AM, Uc EY, Rizzo M. Cognitive functioning predicts driver safety on road tests 1 and 2 years later. J Am Geriatr Soc 2012;60:99–105. [DOI] [PMC free article] [PubMed] [Google Scholar]
- 22.Dawson JD, Anderson SW, Uc EY, Dastrup E, Rizzo M. Predictors of driving safety in early Alzheimer disease. Neurology 2009;72:521–527. [DOI] [PMC free article] [PubMed] [Google Scholar]
- 23.Weintraub D, Siderowf AD, Potenza MN, et al. Association of dopamine agonist use with impulse control disorders in Parkinson disease. Arch Neurol 2006;63:969–973. [DOI] [PMC free article] [PubMed] [Google Scholar]
- 24.Starkstein SE, Merello M. The Unified Parkinson's Disease Rating Scale: validation study of the mentation, behavior, and mood section. Mov Disord 2007;22:2156–2161. [DOI] [PubMed] [Google Scholar]
- 25.Ranchet M, Broussolle E, Paire-Ficout L. Longitudinal executive changes in drivers with Parkinson's disease: study using neuropsychological and driving simulator tasks. Eur Neurol 2016;76:143–150. [DOI] [PubMed] [Google Scholar]
- 26.Devos H, Ranchet M, Emmanuel Akinwuntan A, Uc EY. Establishing an evidence-base framework for driving rehabilitation in Parkinson's disease: a systematic review of on-road driving studies. Neurorehabilitation 2015;37:35–52. [DOI] [PubMed] [Google Scholar]
Associated Data
This section collects any data citations, data availability statements, or supplementary materials included in this article.


