

Summary
Faithful chromosome segregation in meiosis requires crossover (CO) recombination, which is regulated to ensure at least one CO per homolog pair. We investigate failure to ensure COs in juvenile male mice. By monitoring recombination genome-wide using cytological assays and at hotspots using molecular assays, we show that juvenile mouse spermatocytes have fewer COs relative to adults. Analysis of recombination in the absence of MLH3 provides evidence for greater utilization in juveniles of pathways involving structure-selective nucleases and/or alternative complexes, which can act upon precursors to generate noncrossovers (NCOs) at the expense of COs. We propose that some designated CO sites fail to mature efficiently in juveniles owing to inappropriate activity of these alternative repair pathways, leading to chromosome mis-segregation. We also find lower MutLγ focus density in juvenile human spermatocytes, suggesting that weaker CO maturation efficiency may explain why younger men have higher risk of fathering children with Down syndrome.
Graphical Abstract
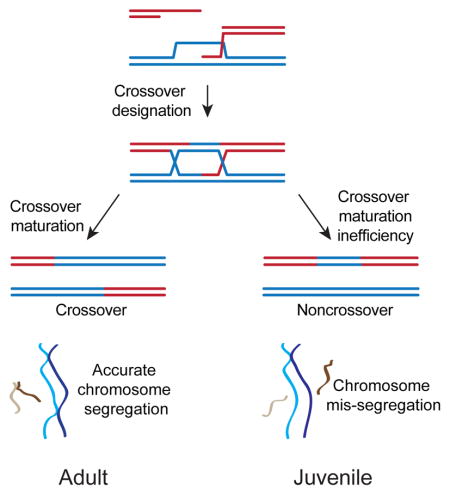
A lower incidence of efficient meiotic crossover recombination in young males attributed to the preferred utilization of pathways involving structure-selective endonucleases and/or alternative complexes that generate non-crossovers at the expense of crossovers.
Introduction
Meiosis generates haploid gametes for sexual reproduction. Accurate segregation requires homologs recombine generating crossovers (COs) (Hunter, 2015). Meiotic recombination is highly regulated to ensure at least one CO per homolog pair and failures in this process cause human aneuploidies, such as Down syndrome.
Meiotic recombination is induced by programmed DNA double-strand breaks (DSBs) that form at preferred sites, or hotspots. Resection of DSBs generates 3′ single-stranded tails, which with RAD51 and DMC1, form nucleoprotein filaments to promote strand invasion into the homolog. These initial steps are generally required for homologs to pair and establish the synaptonemal complex (SC).
A fraction of strand exchange intermediates form double Holliday junctions (dHJs) that can be cleaved by the putative meiosis-specific resolvase activity of the MLH1/3 complex to generate COs (Zakharyevich et al., 2012). In mouse spermatocytes, only 10% of DSBs result in COs, implying a high level of regulation. The remaining DSBs are likely repaired as noncrossovers (NCOs) that convert the broken chromatid to its homologous sequence with no exchange of flanking markers. NCOs generally arise by synthesis-dependent strand annealing (SDSA) (Hunter, 2015), but also result from alternative pathways including resolution by structure-selective nucleases (SSNs) (Blanco and Matos, 2015) or convergent branch-migration and decatenation of dHJs (dissolution) (Bizard and Hickson, 2014).
In budding yeast, single-end invasion intermediates form prior to full synapsis and likely represent designated CO sites from which patterning is regulated (Borner et al., 2004; Hunter and Kleckner, 2001). These intermediates later become dHJs, which in yeast are processed into MLH1/3-dependent COs. Analysis of SC-associated recombination intermediates that share similar distribution with COs, suggests that CO designation occurs prior to full synapsis in mice and humans ((Zhang et al., 2014) and references therein). Thus CO distribution is primarily regulated at designation. Later, during CO maturation, resolvases and ligases act at these sites to form COs.
In contrast to human oocytes, in which 25% of COs are inferred to fail to mature (Wang et al., 2017) adult human spermatocytes have efficient CO maturation. Yet, the offspring of young fathers are more likely to have Down syndrome (Roecker and Huether, 1983; Steiner et al., 2015). The basis for this correlation is unknown, but may be related to the finding that spermatocytes from juvenile mice display fewer MLH1 foci, a marker for MutLγ-dependent crossing over, than do adult mice (Vrooman et al., 2014; Vrooman et al., 2015).
We used cytological and molecular assays to monitor recombination genome-wide and in depth at specific hotspots and found that juvenile mouse spermatocytes have fewer COs. In analysis of mice lacking MLH3, we found greater SSN activity and more NCO-specific pathway products in juveniles. We propose higher activity of these alternate recombination pathways causes CO maturation inefficiency and leads to chromosome mis-segregation in juveniles. In an extension of our studies into humans, we found lower density of MLH1 foci in human spermatocytes from juveniles, on par with the density in human oocytes (Wang et al., 2017). We suggest weaker CO maturation efficiency is conserved between juvenile human and mouse spermatocytes and human oocytes and may explain why younger men have higher risk of fathering a child with Down syndrome.
Results
Spermatocytes from juvenile mice have altered processing of recombination intermediates and fewer COs
To investigate whether spermatocytes from juvenile mice have fewer COs and when during meiosis an alteration in recombination occurs, we compared recombination intermediates during the 1st and adult rounds of spermatogenesis. Spermatocytes were isolated from WT C57BL/6J (B) x DBA/2J (D) F1 hybrid mice at 19–21 days post partum (dpp) for surface spreading and cytological analysis.
Early recombination intermediates are marked by RAD51 foci (Plug et al., 1996), which remain unchanged between 1st round and adult spermatocytes (Vrooman et al., 2014). Meiotic recombination also requires DMC1 (Cloud et al., 2012; Tarsounas et al., 1999). DMC1 foci peak during zygonema when the SC begins to form between homologs. We found that spermatocytes from juveniles had the same number of DMC1 foci as adults, indicating that early recombination intermediates and likely DSB formation are similar at both stages (Figure 1A). Early recombination intermediates are also marked by RPA2, which facilitates recombination (Ribeiro et al., 2016). While RPA2 foci peak during zygonema, half of early intermediates remain marked in pachynema, when RPA2 is thought to mark stable interhomolog interactions. In contrast to RAD51 and DMC1, spermatocytes from 1st round vs. adult spermatogenesis had 40% fewer RPA2 foci during pachynema and significantly fewer foci at all stages of meiotic prophase I (Figure 1B). These results indicate that processing of recombination intermediates is altered after RAD51 and DMC1 foci are formed in zygonema.
Figure 1. 1st round spermatocytes have altered processing of recombination intermediates and fewer crossovers.

(A) DMC1 foci at zygonema (N=2). Mean ± SD: Adult 230 ± 73, 1st round 216 ± 64.
(B) RPA2 foci at pachynema and quantification of RPA2 foci at zygonema and pachynema; EZ, early zygonema, LZ, late zygonema, P, pachynema, (N=2). Mean ± SD: Adult EZ 290 ± 78, Adult LZ 264 ± 63, Adult P 163 ± 54, 1st round EZ 164 ± 53, 1st round LZ 206 ± 55, 1st round P 98 ± 55.
(C) MLH1 foci at mid-pachynema; white arrowheads, unsynapsed X and Y chromosomes, (adults N=5, 1st round N=3). Mean ± SD: Adult 22.9 ± 2.4, 1st round 21.8 ± 1.9.
(D) Metaphase I cells and quantification of the fraction of nuclei containing univalents (any), sex chromosome univalents only (XY), autosome univalent only (Auto.), and sex and autosome univalents (XY+auto); black arrowheads, unpaired X and Y chromosomes (univalents), arrows, unpaired small autosomes (adults N=7, 1st round N=3). P value is Fisher’s exact test, two tailed.
(E) Left, fraction of nuclei in which all bivalents have MLH1 foci (0) or one, two, three, and four or more bivalents lack an MLH1 focus in adult and 1st round spermatocytes. Right, fraction of bivalents lacking an MLH1 focus on the longest (Chr1 and Chr2) and shortest (Chr16, 17, 18, 19) chromosomes, (N=3). P value is Fisher’s exact test, two tailed. Note: sample size for the longest autosomes is insufficient to determine whether there is more bivalents lacking an MLH1 focus in 1st round compared to adult spermatocytes. Scale bar 10 μm. Except where noted, P values, Mann-Whitney, two tailed. For multiple comparisons, Kruskal-Wallis test followed by Dunn’s correction. Black bars are mean ± SD and numerical values are reported above.
In mid-pachynema, MLH1, a component of the putative, CO-specific resolvase marks the location of ~95% of COs (Anderson et al., 1999). Consistent with other reports (Vrooman et al., 2014; Vrooman et al., 2015), we saw an average of one less MLH1 focus in 1st round vs. adult spermatocytes (Figure 1C). This loss was not due to a shorter SC, which is correlated with MLH1 focus numbers (Lynn et al., 2002). We conclude that while the number of DMC1 foci is similar between adult and 1st round spermatocytes, the fewer RPA2 and MLH1 foci suggests recombination intermediate processing is altered in juveniles.
Mouse spermatocytes average only 24 MLH1 foci on average per 20 homolog pairs; yet, all homologs are usually connected via chiasmata as bivalents (Hunter, 2015). In the absence of crossing over, homologs lacking chiasmata (achiasmate) are evident as univalents in metaphase I. Intriguingly, the percent of metaphase I cells harboring univalents was 2-fold higher in spermatocytes from juveniles (Figure 1D). Congruent with fewer chiasmata, only 33% of 1st round spermatocytes had MLH1 foci on all bivalents (Figure 1E). Only the shortest autosomes (45%) and sex chromosomes (65%) were univalent suggesting that longer chromosomes are more likely to have COs. Indeed, we found the shortest autosomes more frequently lacked an MLH1 focus in 1st round spermatocytes (Figure 1E). Taken together, we propose that 1st round spermatocytes have altered processing of recombination intermediates leading to occasional failure to form chiasma, particularly amongst the shortest chromosomes.
The 59.5 hotspot is enriched for crossing over
To compare recombination between juvenile and adult developmental stages and fertile and infertile mice, we isolated spermatocytes at the end of meiotic prophase I by flow cytometry (Figure 2A) to enrich for 4C spermatocytes (Cole et al., 2014). Greater than 90% of sorted cells were in late meiotic prophase I (0% leptonema, 6.1 ± 8.0% zygonema, 26.2 ± 21.0% pachynema, 62.5 ± 20.8% diplonema, 5.2 ± 8.0% metaphase I, 539 cells, N=11 mice).
Figure 2. Molecular and cytological analysis of purified 4C spermatocytes from multiple rounds of spermatogenesis.

(A) Representative FACS profiles of testicular cells from Mlh3+/−and Mlh3−/− animals; note the lack of Mlh3−/− 2C and 1C populations.
(B) Molecular assays for detecting recombination outcomes. Testicular cells from BxD F1 hybrid mice were isolated and subjected to FACS to isolate 4C cells. Extracted DNA was used in CO and NCO assays; filled circles, polymorphisms on the B (blue) or D (red) chromosomes; open circles, either B or D polymorphisms; blue/red arrowheads, primers specific to either the B or D allele, respectively; black arrowheads, universal primers (U).
(C) Comparison of CO and NCO frequency and distribution at A3 (N=6) and 59.5 (N=2) in adult Mlh3+/− 4C spermatocytes. Top, CO breakpoint frequency. Bottom, NCO gene conversion frequency at specific polymorphisms. Top ticks, genotyped polymorphisms. Frequency is mean ± SD. cM/Mb, centimorgans per megabase.
(D) Diagram depicting key events in testicular development in the 1st three rounds of spermatogenesis. Color change from rose to blue symbolizes a temperature shift from 37°C to 33°C.
(E) RPA2 foci at pachynema during the indicated rounds of spermatogenesis (N=2). Mean ± SD: Adult 163 ± 54, 1st round 98 ± 55, 2nd round 94 ± 46, 3rd round 145 ± 58.
(F) MLH1 foci during the indicated rounds of spermatogenesis (adult N=5, 1st round N=3, 2nd round N=7, 3rd round N=2). Mean ± SD: Adult 22.9 ± 2.4, 1st round 21.8 ± 1.9, 2nd round 20.7 ± 2.5, 3rd round 21.2 ± 2.3. P values, Kruskal-Wallis test followed by Dunn’s correction.
(G) Fraction of nuclei in which all bivalents have MLH1 foci (0) or one, two, three, and four or more bivalents lack an MLH1 focus in the indicated rounds of spermatogenesis. Black bars are mean ± SD. Adult and 1st round data are reproduced from Figure 1. See also Figure S1.
Spermatocyte DNA was purified and used in both a NCO assay (e.g., B to universal (U) PCR), which non-selectively amplifies both COs and NCOs and a CO assay, which specifically amplifies CO recombinants (e.g., B to D PCR) (Figure 2B) (Cole and Jasin, 2011) at two meiotic hotspots: A3 on the longest mouse autosome (Chr1) and 59.5 on the shortest mouse autosome (Chr19) (Figure 2C) (Cole et al., 2014; Cole et al., 2010; Getun et al., 2016; Getun et al., 2012; Kelmenson et al., 2005).
Recombination ratios in sorted spermatocytes and sperm were similar at both hotspots [(Cole et al., 2010) and Figure S1)]. The A3 hotspot displayed a ratio of 11:1 NCOs to COs (Figure 2C), comparable with the estimated global ratio of DSBs to COs measured by cytological markers (Figure 1A, 1C). COs can always be identified as they involve multiple polymorphisms across the hotspot, whereas NCOs are short and frequently involve only a single polymorphism. The high ratio of NCOs to COs likely reflects the high polymorphism density between B and D haplotypes in the BxD F1 hybrid (1.65%, 33 polymorphisms/2 kb).
In principle, if COs are not actively promoted, but form at a fixed percentage of DSBs, then any hotspot with sufficiently dense polymorphisms should show a similar ratio of NCOs to COs. The 59.5 hotspot has a similar polymorphism frequency (1.65%) and distribution as A3; however, the ratio of NCOs to COs was much lower (1.7 to 1) (Figure 2C). This indicates that COs are highly enriched at 59.5 compared to A3, consistent with studies showing that DSB and CO frequency do not correlate well (de Boer et al., 2015; Lange et al., 2016). We propose that regulation at 59.5 promotes CO formation relative to both A3 and the genome as a whole.
COs are less frequent in early spermatogenesis
To investigate why spermatocytes from juveniles have fewer MLH1 foci and more univalents at metaphase I, we mapped COs at A3 and 59.5 (Table 1). Consistent with fewer global MLH1 foci in spermatocytes from the 1st vs. adult rounds of spermatogenesis, COs were 1.2 and 1.3-fold less frequent at A3 and 59.5, respectively.
Table 1. Crossover frequencies at A3 and 59.5 in juvenile and adult mouse spermatocytes with and without MLH3.
Total numbers of COs detected with the number of haploid genome equivalents tested in brackets. Number (N) of animals tested is below the Mlh3 genotype in brackets. Note for juvenile 1st round Mlh3−/−, 2 animals were tested for A3 and 4 were examined for 59.5. Poisson-corrected frequencies per 10,000 amplifiable molecules (± SD) are reported; P value, Fisher’s exact test. Fold change confidence intervals (CI) were calculated by the method of EC Fieller.
| Stage | Mlh3 (N animals) | Hotspot | |||||||||
|---|---|---|---|---|---|---|---|---|---|---|---|
| A3 (Chr1) | 59.5 (Chr19) | ||||||||||
| COs (molecules tested) | Frequency (x10−4) | Fold reduced (vs. +/−) | Fold change (CI, 95%) (vs. adult) | P value | COs (molecules tested) | Frequency (x10−4) | Fold reduced (vs. +/−) | Fold change (CI, 95%) (vs. adult) | P value | ||
| Adult | +/− (6/2) | 90 (34,529) | 27.2 ± 8.88 | 305 (50,397) | 76.4 ± 27.2 | ||||||
| −/− (3/4) | 3 (66,468) | 0.45 ± 0.17 | 60 | 3 (171,288) | 0.18 ± 0.13 | 435 | |||||
| Juvenile first round | +/− or +/+ (2/4) | 109 (54,200) | 21.8 ± 7.62 | −1.25 (−1.24 to −1.25) | 0.0346 | 338 (69,813) | 58.1 ± 18.3 | −1.31 (−1.31 to −1.32) | 0.0025 | ||
| −/− (2/3) | 6 (123,172) | 0.49 ± 0.36 | 44 | +1.1 | n.s. | 7 (110,176) | 0.64 ± 0.38 | 91 | +3.56 (3.54 to 3.58) | 0.0278 | |
| Juvenile third round | +/− (−/5) | n.d. | n.d. | 225 (44,820) | 55.9 ± 18.6 | −1.37 (−1.36 to −1.37) | 0.0181 | ||||
| −/− (−/5) | n.d. | n.d. | 6 (90,764) | 0.66 ± 0.61 | 85 | +3.67 (3.64 to 3.69) | 0.0364 | ||||
The 1st–3rd rounds of mouse spermatogenesis take place in conditions distinct from those of adult spermatogenesis. In 1st round spermatocytes, meiosis is initiated by prospermatogonial rather than spermatogonial stem cells (Figure 2D) (Yoshida et al., 2006). Further, early spermatogenesis occurs either wholly (1st round) or partially (2nd round) at 37°C rather than 33°C, as the testes have not fully descended (O’Shaughnessy and Sheffield, 1991). Finally, testicular support cell development is incomplete until after the 3rd round of spermatogenesis (Wu et al., 2010).
To determine whether testicular development contributes to alterations in recombination intermediate processing, we cytologically investigated recombination intermediate dynamics in the 2nd (30dpp) and 3rd (35 to 38dpp) round spermatocytes (Figure 2) and molecularly investigated crossover recombination in the 3rd round of spermatogenesis (Table 1). 2nd round spermatocytes, like 1st round spermatocytes, had 40% fewer RPA2 foci than adult spermatocytes, but foci number was comparable by the 3rd round (Figure 2E, S2). However in the 3rd round, portions of cells clustered at both the lower numbers observed in the 1st and 2nd round and the higher numbers of adult rounds (Figure S3). This bimodal distribution suggests that the 3rd round may represent a transition between juvenile and adult modes of processing RPA2 foci. In contrast to RPA2, there were fewer MLH1 foci in all 3 early rounds of spermatogenesis (Figure 2F) and only 36% of nuclei had MLH1 foci on all bivalents (Figure 2G). Consistent with fewer MLH1 foci, CO recombination at 59.5 was 1.4-fold lower in 3rd round spermatocytes (Table 1).
The similarity between 1st and 2nd round spermatogenesis indicates that stem cell identity (established after the 1st round) does not cause fewer COs. Similarly, the change in RPA2 foci between the 2nd and 3rd rounds of spermatogenesis may result from the higher temperature in undescended testes and/or overall testicular development. Nonetheless, as all three rounds are similarly lower in MLH1 foci and the 1st and 3rd rounds are similarly lower for COs at 59.5, we favor that incomplete testicular development accounts for the global decrease in COs in juveniles.
Fewer NCOs at 59.5 suggest less interhomolog recombination in the 1st round of spermatogenesis
Given that CO recombination accounts for only 5–10% of DSBs, the 40% fewer RPA2 foci in the 1st and 2nd rounds of spermatogenesis suggests lower overall interhomolog recombination. To test this, we performed high-resolution analysis of NCO recombination at both A3 and 59.5.
We detected no change in NCO recombination at A3, when comparing 1st round to adult spermatocytes. By contrast, at 59.5 we observed 41% fewer singletons, which have a gene conversion encompassing only one polymorphism (p ≤ 0.0003, Fisher’s exact test) (Table 2) in 1st round spermatocytes mirroring the 40% loss of RPA2 foci at pachynema (Figure 1B). Similarly, neither the number of RPA2 foci nor NCO frequencies were lower in the 3rd round of spermatogenesis (Table 2, Figures 2E, S2). This suggests that overall interhomolog recombination is lower during the 1st round of spermatogenesis resulting in fewer NCOs at specific loci such as 59.5.
Table 2. Noncrossover frequencies at A3 and 59.5 in juvenile and adult mouse spermatocytes with and without MLH3.
| Stage |
Mlh3 (N animals) |
Hotspot | ||||||||||
|---|---|---|---|---|---|---|---|---|---|---|---|---|
| A3 (Chr1) | 59.5 (Chr19) | |||||||||||
| NCOs (molecules tested) |
Singletons (x10−4) |
P value (vs. adult) |
Co- conversions (x10−4) |
P value (vs. +/−) |
NCOs (molecules tested) |
Singletons (x10−4) |
P value (Fold change CI, 95%) (vs. adult) |
Co- conversion s (x10−4) |
P value (vs. +/−) |
P value (Fold change CI, 95%) (vs. adult) |
||
| Adult | +/− (2) | 67 (4,619) | 106 ± 37.9 | 46.8 ± 19.5 | 96 (15,470) | 65.9 ± 19.5 | 0 | |||||
| −/− (4) | 95 (7,814) | 92.4 ± 32.6 | 35.4 ± 15.4 | n.s. | 309 (43,886) | 65.5 ± 16.8 | 9.23 ± 3.03 | <0.0001 | ||||
| Juvenile first round | +/− & +/+ (4) | 76 (5,643) | 103 ± 44.4 | n.s. | 35.9 ± 18.9 | 84 (22,693) | 38.6 ± 13.9 | 0.0003 (−1.70 to −1.72) | 0 | |||
| −/− (3/6) | 93 (7,587) | 96.4 ± 37.2 | n.s. | 30.8 ± 15.0 | n.s. | 224 (34,553) | 49.5 ± 16.3 | 0.0043 (−1.32 to −1.33) | 17.9 ± 7.43 | <0.0001 | 0.0006 (1.93 to 1.95) | |
| Juvenile third round | +/− & +/+ (4) | n.d. | n.d. | 46 (8,534) | 56.3 ± 22.6 | n.s. | 0 | |||||
| −/− (4) | n.d. | n.d. | 166 (23,161) | 57.6 ± 18.1 | n.s. | 17.6 ± 7.12 | <0.0001 | 0.0023 (1.90 – 1.92) | ||||
More MLH3-independent COs in juveniles than adults
During meiosis, most COs are MLH3-dependent, precluding evaluation of alternative pathways (Figure 3A). However, in Mlh3−/− spermatocytes the remaining COs can be attributed to SSNs. Mlh3−/− spermatocytes properly pair homologs, but crossing over is ~95% lower with concomitantly fewer chiasmata (Holloway et al., 2008) (Figure 3C). As such, SSN-dependent resolvase activity does not substantially compensate for loss of MLH3.
Figure 3. Higher SSN activity in 1st round spermatocytes.

(A) Model of the proposed DSB repair pathways during meiotic recombination. SDSA, synthesis-dependent strand annealing; dHJ, double-Holliday junction; SSNs, structure-selective nucleases.
(B) DMC1 foci at zygonema (N=2, except Mlh3−/− 1st round N=3) and RPA2 foci at pachynema (WT N=2, Mlh3−/− N=3) in WT (gray) and Mlh3−/− (blue) adult and 1st round spermatocytes. DMC1 foci mean ± SD: Adult Mlh3+/+ 230 ± 73, Adult Mlh3−/− 224 ± 60, 1st round Mlh3+/+ 216 ± 64, 1st round Mlh3−/− 244 ± 51. RPA2 foci mean ± SD: Adult Mlh3+/+ 163 ± 54, Adult Mlh3−/− 152 ± 51, 1st round Mlh3+/+ 98 ± 55, 1st round Mlh3−/− 117 ± 52. WT data is reproduced here from Figure 1. P values, Kruskal-Wallis test followed by Dunn’s correction. Black bars are mean ± SD.
(C) Top, metaphase spreads from the indicated stages and genotypes. Black arrowheads, bivalents. Bottom left, bivalents in metaphase I (adult N=7, Mlh3−/− adult N=4, Mlh3−/− 1st round N=4). Mean ± SD: Adult 20 ± 0.3, Adult Mlh3−/− 1.7 ± 1.2, 1st round Mlh3−/− 1.9 ± 1.6. Bottom right, distribution of bivalents per nucleus in Mlh3−/− adult and 1st round spermatocytes. P value, Chi-squared, two-tailed. Black bars are mean ± SD. See also Figure S2 and S3.
We compared dynamics of recombination in WT and Mlh3−/− mice in 1st round and adult spermatocytes. Like WT, DMC1 foci were not altered between Mlh3−/− spermatocytes of any stage (Figure 3B), but there were 23% fewer RPA2 foci in Mlh3−/− spermatocytes from 1st round vs. adult spermatogenesis. There were also fewer RPA2 foci in Mlh3−/− spermatocytes from adults in zygonema, suggesting a potential role for MLH3 in early recombination processing (Figure S2). However, by pachynema, the number of RPA2 foci was equivalent between WT and Mlh3−/− adult spermatocytes (Figure 3B, S2). We conclude that, in general, Mlh3−/− spermatocytes have recombination intermediate dynamics similar to WT spermatocytes.
Next we examined CO frequency in Mlh3−/− spermatocytes and found that COs were lower at A3 and 59.5 (Table 1), consistent with fewer COs in the absence of MLH1 and MLH3 at another hotspot, Psmb9 (Guillon et al., 2005; Svetlanov et al., 2008). Although, we saw fewer COs overall, the fold change was greater at 59.5 than A3 in adult spermatocytes (435- vs. 60-fold). Intriguingly, the fold change in COs at 59.5 was lower in the 1st and 3rd round (91- and 85-fold, respectively) than in adult spermatocytes (435-fold). Much of the change was due to 3.6- and 3.7-fold higher MLH3-independent COs in 1st and 3rd round spermatocytes, respectively. This suggests that recombination intermediates formed at 59.5 may be more readily resolved by SSNs in juveniles.
Metaphase spreads of spermatocytes from juveniles indicated that the higher level of MLH3-independent COs was not restricted to 59.5. While the mean number of bivalents in Mlh3−/− spermatocytes from 1st round and adult spermatogenesis was the same (Figure 3C), their distribution was different (Figure 3C). Over 10% of Mlh3−/− 1st round spermatocytes had 5 or 6 bivalents per nucleus, whereas adult Mlh3−/− spermatocytes had no more than 4, suggesting a bias toward SSN-dependent crossing over in juvenile spermatocytes.
SSN-dependent resolution likely generates a substantial number of NCOs (De Muyt et al., 2012; Zakharyevich et al., 2012). Congruent with this activity and given that SSNs only act at limited sites, 1st round spermatocytes had 10% more nuclei lacking bivalents than adult spermatocytes (Figure 3C). Combined with the molecular data, we suggest that in the absence of MLH3, a subset of 1st round spermatocytes uses SSN pathways more frequently than adult spermatocytes.
Fewer singleton NCOs at 59.5 in Mlh3−/− 1st round spermatocytes
Loss of MLH3 resulted in fewer COs at A3 and 59.5 (Table 1); however, neither the distribution nor frequency of NCOs was altered at A3 in Mlh3−/− spermatocytes (Table 2, Figure S4), consistent with findings at Psmb9 (Svetlanov et al., 2008). We mapped two classes of NCOs at A3: singletons (conversion of a single polymorphism) and co-conversions (conversion of two or more polymorphisms) (Figure S4B (Cole et al., 2010)). Singletons peaked in frequency at the A3 hotspot center, but spanned its entire 2kb, whereas co-conversions were nearly exclusive to the center. By contrast, we recovered only singletons at 59.5 in WT spermatocytes (Figure 4A), with a spatial distribution resembling singletons at A3 (Figure S4). Importantly, there were no differences in the frequency and distribution of singletons at 59.5 between WT and Mlh3−/− at any stage (Table 2, Figure 4A, 4B). However, between adult and 1st round spermatocytes, we observed 41% and 24% fewer singletons in WT and Mlh3−/− spermatocytes (p = 0.0003 and 0.0043, respectively, Fisher’s exact test) (Table 2, Figure 4A, 4B), suggesting a loss of NCOs, and mirroring the loss of RPA2 foci in WT (40%, Figure 1B) and Mlh3−/− (23%, Figure 3B) 1st round pachytene spermatocytes. However, singleton NCO frequencies, like RPA2 foci, were not lower in the 3rd round of spermatogenesis (Table 2, Figure 4A, 4B, S5). These findings suggest that interhomolog recombination is lower during the 1st but not 3rd round of spermatogenesis, resulting in fewer singleton NCOs in WT and Mlh3−/− spermatocytes.
Figure 4. Altered frequency and distribution of noncrossovers at 59.5 with age and genotype.

(A) Top, histogram of total NCO frequency at specific polymorphisms (ntot) (adult N=2, 1st round N=6, 3rd round N=4); Bottom, plots of representative NCOs (nplot) from the indicated ages in WT and Mlh3+/− spermatocytes. All NCOs observed, regardless of age, are short conversions of a single polymorphism (singletons). Here and elsewhere unless noted, the number of nplot shown and corresponding length of the plotted maps is proportional to the NCO frequencies.
(B) Frequency and distribution of singleton NCOs were unaltered between spermatocytes with and without MLH3 (compare A with B).
(C) In Mlh3−/− males, a second class of long NCOs were also observed. 1st and 3rd round spermatocytes had more long NCOs. Mean average tract lengths ± SD are indicated. Asterisks, cloned NCOs. See also Figure S5, S6, and S7.
Loss of MLH3 leads to long noncrossovers
In budding yeast, resolution of dHJs by SSNs generates equal shares of COs and NCOs (De Muyt et al., 2012; Zakharyevich et al., 2012). If this is true in mouse spermatocytes, then residual SSN activity does not substantially compensate for lost COs at 59.5 in the absence of MLH3. We asked whether the remaining CO intermediates may be alternatively processed and identified an NCO class in Mlh3−/− spermatocytes with distinctly longer gene conversion tracts and different distributions than those from WT spermatocytes.
In WT spermatocytes, the mean NCO gene conversion tracts were 108 ± 51bp and 86 ± 49bp at 59.5 and A3, respectively. In adult Mlh3−/− spermatocytes, the frequency and distribution of singleton NCOs were unaltered at both hotspots (Table 2). However, we identified a new class of long NCOs at 59.5 with a mean tract length of 300 ± 193bp (177 ± 179 minimum and 423 ± 213 maximum average). (Table 2, Figure 4C, S5).
Given that MLH3 also plays a semi-redundant role in mismatch repair, loss of this function could lead to retention of heteroduplex DNA during SDSA. Our assay (STAR methods) cannot distinguish between fully converted NCOs and heteroduplex strands. To determine whether retained heteroduplex contributes to the new NCO class, we cloned and genotyped individual DNA strands (Figure S6)(Cole and Jasin, 2011). We found that 11/13 NCO clones were fully converted containing two identical strands (Figure S6). The others contained either two independent, co-converted NCOs or a single heteroduplex-containing NCO. Although these events cannot be distinguished, if we assume a Poisson distribution of events, the chance of two independent co-conversions per reaction is 0.05%. Therefore, these NCOs likely represent single recombination events with retained heteroduplex. Taken together, the new NCO class likely derives from gene conversion rather than compromised mismatch repair during SDSA.
In WT spermatocytes, NCOs peaked at hotspot centers but were distributed across the flanking +/−1kb (Figure 4, S1, S4, S5). Specifically, 35% and 48% of NCOs were located in the central 200bp of 59.5 and A3, respectively. By contrast, 82.3% of the new NCO class spanned the central 200bp of 59.5 (Figure 4, S5).
Finally, in WT spermatocytes we observed singleton NCOs on both the B and D chromosome of 59.5 (Figure S1). We did not detect the new NCO class on the D homolog of 59.5 in Mlh3−/− spermatocytes isolated during either adult or juvenile rounds of spermatogenesis (expected: 8 and 16, observed: 0, n=65, Figure S7).
Intriguingly, the new class of NCOs shares many features with CO-dependent gene conversion, raising the possibility that both are derived from a common intermediate. The estimated gene conversion tract length owing to COs was 548bp at 59.5 (Figure S1) and 566 ± 277bp at Psmb9 and A3 by direct measurement (Cole et al., 2014), showing that the new NCO class has a gene conversion tract length more similar to COs than SDSA-dependent NCOs (which at 59.5 are singletons). The longer gene conversions in COs are due, at least in part, to more extensive heteroduplex DNA contained within the dHJ precursor (Figure 3A). Also, COs and the new NCO class share similar distributions: direct measurement of reciprocal CO breakpoints by tetrad analysis at Psmb9 and A3 showed that ~75% of CO-dependent gene conversions span the central ~200bp (Cole et al., 2014) as do 82.3% of the new NCO class (Figure 4, S5). Finally, as inferred from strong reciprocal CO asymmetry at 59.5, both CO-dependent gene conversion (Figure S1) and the new NCO class are strongly biased to the B homolog (Figure S7).
In large-scale experiments, we have observed long NCOs in adult spermatocytes (data not shown), suggesting that the new NCO class could form at low frequencies in WT meiosis. Taken together, we propose the long NCOs are derived from an intermediate common to MLH3-dependent COs and suggest they represent products of a rarely utilized back-up pathway(s) in canonical meiosis.
The frequency of long NCOs is higher in spermatocytes from juveniles lacking MLH3
To investigate whether this putative back up pathway is differentially utilized in spermatocytes from juvenile mice, we assessed NCO recombination in the 1st and 3rd rounds of spermatogenesis in Mlh3−/− mice and found a ~2-fold higher frequency of long NCOs (Table 2, Figure 4C, S5). As this pathway appears to generate NCOs exclusively, higher pathway activity in juveniles could lead to CO maturation inefficiency and achiasmate chromosomes. However, as we failed to observe long NCOs in WT juvenile mice (n = 130, frequency ≤0.008), further experimentation is required to investigate this possibility.
Juvenile human spermatocytes have lower MLH1 focus density
Compared to adult human spermatocytes, human oocytes have unique cytological features consistent with altered processing of recombination intermediates: the SC is ~two-fold longer with concomitantly more RAD51 foci (Gruhn et al., 2013); and MLH1 foci appear earlier during zygonema (Lenzi et al., 2005), are more numerous, and are more variable in number from cell-to-cell (Gruhn et al., 2013; Lenzi et al., 2005). Human oocytes were recently suggested to have inefficient CO maturation compared to spermatocytes (Wang et al., 2017) resulting in lower MLH1 focus density along the SC and more frequent absence of MLH1 foci on homolog pairs.
We characterized testicular samples from two juvenile males (15- and 16-years old) and compared them to published data (Gruhn et al., 2013; Wang et al., 2017). Similar to human oocytes, MLH1 foci were frequently associated with the SC in zygonema (36%, n=149) (Figure 5A). In pachynema, 13% more MLH1 foci were present relative to adult spermatocytes (55.4 vs. 49.1), but were still fewer than in oocytes (69.2), and SC lengths were 1.6-fold longer than in adult spermatocytes (Figure 5B). Consequently, MLH1 focus density along the SC was ~30% lower in spermatocytes from juveniles than from adults, similar to that seen in oocytes. Therefore it is likely that juvenile human spermatocytes share CO maturation inefficiency with human oocytes.
Figure 5. Juvenile human spermatocytes have a lower density of MLH1 foci.

(A) Representative images at the indicated stages and quantification of MLH1 foci at pachynema for individual A (A), B (B), and the average (A & B). Mean ± SD: A 56.9 ± 6.5, B 54.3 ± 8.4. Black bars are mean ± SD.
(B) Comparison of spermatocytes from adults, oocytes, and spermatocytes from juveniles for MLH1 foci and total SC per nucleus, mean ± SD, and MLH1 foci per μm SC (MLH1 focus density), mean ± confidence interval. P values for MLH1 foci and total SC are derived by ANOVA with Tukey HSD Post-hoc test. P values for MLH1 focus density are derived from the confidence interval. Data from oocytes and adult spermatocytes are from (Gruhn et al., 2013; Wang et al., 2017).
(C) Model of juvenile crossover maturation inefficiency.
In adults, designated CO precursors are efficiently matured into COs by MLH1/3-dependent resolution. In juveniles, a fraction of designated CO precursors may be inappropriately targeted for 1: resolution by SSNs to generate both COs and NCOs or 2: acted upon by alternative NCO-specific pathways. Shorter chromosomes usually have only a single designated CO between homologs, whereas longer chromosomes often have more than one. Thus, CO maturation inefficiency will disproportionately cause mis-segregation of shorter chromosomes.
Discussion
By systematically investigating adult and juvenile rounds of meiosis in WT and Mlh3−/− mouse spermatocytes, we found that recombination intermediate processing is altered in juveniles resulting in fewer COs and more achiasmate chromosomes. In addition, we infer higher SSN-dependent resolution and higher frequency of long NCOs in spermatocytes from juvenile mice lacking MLH3. These pathways can act on CO precursors to generate NCOs. We propose a model that in juvenile mouse spermatocytes inappropriate activity of alternate DNA repair pathways causes designated CO sites to fail to mature and form NCOs instead, which cannot connect homologs at the meiosis I spindle (Figure 5C). Finally, we show that spermatocytes from human juveniles have a lower MLH1 focus density, on par with that of human oocytes, and consistent with a crossover maturation defect. Therefore, we propose that spermatocytes from juveniles have inefficient crossover maturation causing chromosome mis-segregation and fetal aneuploidies.
Juvenile mouse spermatocytes likely have robust CO regulation
Although DMC1 foci were unchanged between adult and juvenile mouse spermatocytes, stabilized interhomolog interactions were lower in juveniles, as manifested by fewer RPA2 foci at pachynema (Figure 1B, 2E, S2). Fewer RPA2 foci could be due to fewer overall interactions and/or shorter lifespan of intermediates. We propose there are fewer overall interhomolog interactions in juveniles as the number of RPA2 foci is always lower than in adults, even during early meiotic prophase. Further, in addition to fewer COs at both A3 and 59.5 in juveniles, we observed fewer NCOs at 59.5, suggesting less recombination, at least at some sites (Table 1, 2).
During meiotic prophase, stable interhomolog engagement is required to halt the local production of meiotic DSBs (Hunter, 2015). In addition, COs are maintained, despite variation in the number of interhomolog interactions, by altering the number of NCOs via CO homeostasis. Absence of designated CO sites for each homolog pair delays meiotic progression in C. elegans, suggesting a surveillance mechanism to ensure CO designation (Rosu et al., 2013; Stamper et al., 2013; Woglar et al., 2013; Machovina et al., 2016). In this way, cells can compensate for disruption of early steps of CO formation. As such, it is unclear whether a 40% loss of RPA2 foci directly contributes to loss of COs. By comparison, reducing early recombination intermediates by 50% causes non-homologous synapsis (Kauppi et al., 2013), which we did not see in juvenile mouse spermatocytes, suggesting they can compensate for loss of RPA2 foci. Congruently, spermatocytes from juvenile mice compensate for ~20% fewer early recombination intermediates, suggesting a robust homeostatic mechanism (Cole et al., 2012).
As with RPA2 foci, we found commensurately fewer NCOs at 59.5 in juvenile rounds of spermatogenesis, whereas COs were not as highly affected, providing evidence for CO homeostasis. Unlike 59.5, we did not expect to see fewer NCOs at A3 due to CO homeostasis owing to the high frequency of NCOs at this site (Cole et al., 2012). We suggest that homeostatic mechanisms compensate for fewer interhomolog interactions in juvenile spermatogenesis. As a consequence, all three rounds of juvenile spermatogenesis had similar numbers of MLH1 foci, albeit lower than adults, but only the 1st two rounds had fewer RPA2 foci (Figure 2E). Fewer foci may indicate an alteration in processing that contributes to lower COs in all rounds of juvenile spermatogenesis. However, it is unlikely that failure of CO homeostasis alone accounts for fewer COs in juveniles.
Why not regulate CO maturation?
We found that SSN and alternative NCO-specific pathways were more active in juvenile mouse spermatocytes lacking MLH3. Further, this higher activity occurs at 59.5 where COs are highly dependent upon MLH1/3 in adults. Consequently, greater activity of both pathways could produce NCOs at the expense of COs in juveniles (Figure 5C).
A critical feature of this proposed mechanism is that designated CO sites, which have the capacity to form NCOs rather than actual COs, are the final metric that is accounted for by homeostatic mechanisms. This is congruent with findings in budding yeast (Borner et al., 2004), where CO designated sites can be detected as single-end invasion intermediates (Hunter and Kleckner, 2001).
Given the importance of COs for segregation, a feedback network that incorporated CO maturation would seem highly worthwhile. A counterpoint, however, is that CO maturation is delayed until homologs have completely synapsed along their lengths and DSBs have ceased, precluding de novo recombination. Complete synapsis is brought about by dispersed allelic recombination along homologs, which can suppress non-allelic recombination (Goldman and Lichten, 2000). COs between illegitimate loci are a substantial risk to germ line genome stability, particularly within the repetitive mammalian genome. Thus, waiting until homologs are synapsed to mature COs could outweigh the risks associated with CO maturation inefficiency, as it may limit COs between non-allelic loci.
Where have the COs gone?
If all dHJs destined to become MLH3-dependent COs became long NCOs in Mlh3−/− spermatocytes, we would expect their frequency to approach that of COs. However, we observed only 9.2 × 10⁻⁴ long NCOs in adult spermatocytes instead of the expected 76 × 10−4 (Table 1, 2). In contrast, the frequency of singleton NCOs was unaltered between WT and Mlh3−/− spermatocytes (65.9 vs. 65.5). We cannot determine why all recombination is not accounted for in the absence of MLH3. It could be that MLH3 plays an earlier role in establishing interhomolog interactions and that in it’s absence many DSBs are repaired by pathways that we cannot distinguish (e.g., intersister repair). Another not exclusive possibility is that our samples contained mostly pachynema and diplonema (89%) and that the remaining MLH3-independent repair of dHJs takes place later in meiotic prophase. Indeed, analysis of synchronized spermatocytes lacking MLH3 shows that long NCOs form during diplonema (RK and FC, unpublished observations). As such, we interpret our results to reflect meiotic recombination in late pachynema to diplonema - when WT spermatocytes have completed DNA repair - rather than the end point of meiotic prophase I.
We found long NCOs at 59.5, but not at A3 (Table 2 and compare Figure 4, S5 with S4). This was expected because the frequency of MLH3-dependent crossing over is much lower at A3 than 59.5 (Table 1). Based upon the number of molecules tested, we would expect to see only 2.6 long NCOs in adult Mlh3−/− spermatocytes and 1 in the juvenile samples. Unlike 59.5, one third of NCOs at A3 are short co-conversions, which are likely due to structural features of the DNA (Cole et al., 2010). As such and with the variability of gene conversion tract lengths (Figure 4C, S5), any mild alteration of long NCOs at A3 would not be distinguishable.
What are the long NCOs?
NCOs derived from SSN-dependent resolution of each HJ independently are predicted to be longer than SDSA-dependent NCOs (Figure 5C). In budding yeast, and likely mammals, this process generates an equal share of COs and NCOs (De Muyt et al., 2012; Zakharyevich et al., 2012). The frequency of long NCOs is markedly higher than SSN-dependent COs (51-, 28-, and 27-fold in adult, 1st, and 3rd round spermatocytes, respectively, Table 1, 2). Additionally, SSN-dependent resolution is predicted to alter the recipient and donor chromosomes as observed in budding yeast (Oke et al., 2014) at some frequency. However, we did not detect alteration of the donor chromosome at 59.5 (Figure S7), suggesting the mechanism generating long NCOs is unidirectional and is not consistent with expected outcomes for canonical SSN-dependent resolution of each HJ independently. Instead we think it likely that the long NCOs are derived from pathway(s) that mostly produce NCOs (Figure 5C). One such pathway is dHJ dissolution (Bizard and Hickson, 2014; Martini et al., 2011; Wu and Hickson, 2003), but alternative pathways could account for this class of NCOs, such as resolution of a single HJ followed by branch migration (Gilbertson and Stahl, 1996; Radford et al., 2007) and two-end engagement, in which both DSB ends engage and use a homolog as a repair template and then dissociate (Crown et al., 2014). Depending upon the orientation of HJs and/or invaded strands, each of these pathways could generate long NCOs with distributions similar to CO gene conversions. Higher frequency of any of these alternative pathways in juveniles would be predicted to reduce CO maturation efficiency (Figure 5C).
Another, non-exclusive possibility is that these long NCOs are aberrant events due to absence of MLH3, which coincidentally take place more often in juvenile rounds of spermatogenesis. This could include persistent, unresolved dHJ intermediates. In principle, our PCR-based assay should amplify intact strands within a dHJ, which would appear as long NCOs. MLH3-dependent COs form in pachynema, whereas the long NCOs form later, in diplonema (RK and FC, unpublished observations). We see no evidence of earlier dHJ-like intermediates in mutant or WT spermatocytes, suggesting these intermediates are not amplifiable, perhaps because they are nicked or gapped (Heyer, 2004). However, it is possible that in the absence of MLH3, dHJs become fully ligated during diplonema and that in juvenile spermatogenesis these ligases have more access to intermediates as observed for SSNs. Importantly, aberrant events specific to Mlh3−/− spermatocytes would not contribute to achiasmate chromosomes or CO maturation inefficiency in juvenile mouse spermatocytes.
While our data do not exclude any of these models, we favor two-end engagement as it can explain both long NCO distribution and our inability to amplify dHJs. Further, recombination outcomes in the absence of mismatch repair in Drosophila meiosis (Crown et al., 2014) and during gap repair in yeast mitosis (Mitchel et al., 2013) are consistent with two-end engagement.
Consequences of fewer COs
Given the substantial differences between human and mouse testicular development, one should be careful about extrapolating findings between organisms. For example, the longer SC length we observe in juvenile human spermatocytes is not conserved in juvenile mouse spermatocytes (Figure 1C). As a consequence, we suggest weaker CO maturation efficiency in mice leads to fewer overall MLH1 foci, whereas in juvenile human spermatocytes we observe higher overall MLH1 foci, but lower MLH1 focus density. Despite the differences young men, like juvenile mice, have a higher risk of transmitting a mis-segregated chromosome to their children (Roecker and Huether, 1983; Steiner et al., 2015).
We present a model that spermatocytes from juvenile mice have lower CO maturation efficiency resulting in achiasmate chromosomes, particularly of the shortest chromosomes. Human oocytes were shown to have inefficient CO maturation that primarily affects the shortest autosomes (Wang et al., 2017). We show that human oocytes and juvenile human spermatocytes have similarities that suggest they share CO maturation inefficiency, and karyotyping data from others shows human spermatocytes disproportionately mis-segregate the shortest chromosomes (Martin et al., 1991; Martin and Rademaker, 1990; Templado et al., 2011). These parallels raise the question of whether the mechanism we propose for CO maturation inefficiency in juvenile mouse spermatocytes also leads to chromosome mis-segregation in younger men and/or human oocytes.
In women, the incidence of aneuploid pregnancies is higher for teenagers than young adults (for example, (Hassold and Chiu, 1985)). In particular, sex chromosome monosomy appears to negatively correlate with age in direct opposition to autosomal aneuploidy, which increases with age. Importantly, parent of origin was not identified in these studies and where determined, 70% to 80% of sex chromosome monosomy is attributable to paternal meiotic errors ((Templado et al., 2013) and references therein). Taken together, we suggest that the greater risk of chromosome mis-segregation correlated with young mothers could be attributed to a paternal, rather than maternal age effect, as parental ages covary. It will be important to determine whether the mechanism proposed here for a paternal age effect in mouse spermatocytes is conserved in human spermatocytes and oocytes as well as its relative contribution to human aneuploidies.
STAR Methods
Key Resources Table
| REAGENT or RESOURCE | SOURCE | IDENTIFIER |
|---|---|---|
| Antibodies (dilution used) | ||
| Mo anti-Scp3 (1:200) | Santa Cruz Biotechnology | Cat# sc-74569 |
| Rb anti-Scp3 (1:200) | Santa Cruz Biotechnology | Cat# sc-33195 |
| Rb anti-Dmc1 (1:200) | Santa Cruz Biotechnology | Cat# sc-22768 |
| Rat anti-RPA2 (1:100) | Cell Signaling Technology | Cat# 2208S |
| Mo anti-Mlh1 (1:20) | BD Pharmingen | Cat# 551092 |
| Rb anti-Scp1 (1:200) | Abcam | Cat# ab15090 |
| 594 Goat anti-mouse (1:200) | Life Technologies | Cat# A11029 |
| 594 Goat anti-rabbit (1:200) | Life Technologies | Cat# A11037 |
| 594 Donkey anti-rabbit (1:200) | Life Technologies | Cat# A21207 |
| 488 Goat anti-mouse (1:200) | Life Technologies | Cat# A11029 |
| 488 Goat anti-rabbit (1:200) | Life Technologies | Cat# A11034 |
| 488 Donkey anti-rat (1:200) | Life Technologies | Cat# A21208 |
| Biological Samples | ||
| Chemicals, Peptides, and Recombinant Proteins | ||
| acetic acid, glacial | Sigma | Cat# 695092 |
| ammonium sulfate | Sigma | Cat# A4915 |
| beta-mercaptoethanol (BME) | Sigma | Cat# 63689 |
| BSA (Fraction V) | Sigma | Cat# A7906 |
| BSA, ultrapure | Ambion/Life Technologies | Cat# AM2616 |
| Chloroform | Fisher Sci | Cat# C298500 |
| Cloned Pfu DNA polymerase | Agilent | Cat# 600154 |
| collagenase | Worthington | Cat# LS004189 |
| D-glucose | Sigma | Cat# G5767 |
| dithiothreitol (DTT) | Sigma | Cat# 43815 |
| DNAse I | Roche | Cat# 104159 |
| Easy Tides ATP (γ-32P)ATP | Perkin Elmer | Cat# BLU502Z250UC |
| EDTA, ~0.5M | Sigma | Cat# 03690 |
| Ficoll 400 | Sigma | Cat# F2637 |
| Fish gelatin | Sigma | Cat# G-7765 |
| Gey’s balanced salt solution (GBSS) | Sigma | Cat# G9779 |
| Giemsa Stain, Modified Solution | Sigma | Cat# 48900 |
| Goat Serum | Jackson ImmunoResearch | Cat# 005-000-121 |
| Hoechst 33342 | Invitrogen | Cat# H1399 |
| IgG-free BSA | Jackson ImmunoResearch | Cat# 001-000-161 |
| Kapa Taq polymerase | VWR | Cat# BK1002 |
| KCl | Sigma | Cat# P9541 |
| KH2PO4 | Sigma | Cat# P3786 |
| MgCl2 | Sigma | Cat# M9272 |
| MgSO4 | Sigma | Cat# 230391 |
| Na2HPO4 | Sigma | Cat# S9390 |
| NaH2PO4 | Sigma | Cat# S9638 |
| Nylon Membranes, positively charged | Roche | Cat# 11 417 240 001 |
| Nylon membranes, Amersham Hybond-XL (82mm) | GE Healthcare | Cat# RPN82S |
| orcein | Fisher Sci | Cat# O26810 |
| Paraformaldehyde (PFA) | Sigma | Cat# P6148 |
| Pellet Paint NF Co-precipitant | VWR | Cat# 70748-3 |
| Phenol:Chloroform:Isoamyl Alcohol 25:24:1, Saturated with 10mM Tris, pH 8.0 | Sigma | Cat# P3803 |
| Photo-Flo 200 | Kodak | Cat# 1464510 |
| polyvinyl pyrrolidone | Sigma | Cat# P5288 |
| Prolong Gold Antifade reagent with DAPI | Life Technologies | Cat# P36935 |
| Propidium Iodide, 1 μg/μl | Sigma | Cat# P4864 |
| proteinase K, 20 μg/μl | Qiagen | Cat# 19131 |
| S1 Nuclease | Life Technologies | Cat # 18001-016 |
| Set of deoxynucleotides, 100mM | Sigma | Cat# DNTP100-1KT |
| Slides, Fisherbrand SuperFrost Plus | Fisher Sci | Cat# 12-550-15 |
| sodium acetate | Sigma | Cat# 32318 |
| sodium citrate | Sigma | Cat# W302600 |
| sodium lactate | Sigma | Cat# 71720 |
| sodium pyruvate | Sigma | Cat# P8574 |
| sonicated salmon sperm DNA | Agilent | Cat# 201190 |
| spermidine trichloride | Sigma | Cat# S2501 |
| T4 polynucleotide kinase | New England Biolabs Inc. | Cat# M0201L |
| TMAC, 5M | Sigma | Cat# T3411 |
| Triton X-100 | Sigma | Cat# T8787 |
| Trizma base | Fluka | Cat# 08656 |
| trypsin | Sigma | Cat# T9935 |
| trypsin inhibitor | Sigma | Cat# T9003 |
| yeast RNA | Life Technologies | Cat# AM7118 |
| zinc acetate | Sigma | Cat# 96459 |
| Critical Commercial Assays | ||
| TOPO TA cloning kit | Invitrogen | |
| TOP10 chemically competent cells | Invitrogen | |
| Deposited Data | ||
| Experimental Models: Cell Lines | ||
| Experimental Models: Organisms/Strains | ||
| Mouse: DBA/2J | The Jackson Laboratory | JAX:000671 |
| Mouse: C57BL/6J | The Jackson Laboratory | JAX:000664 |
| Mouse: MLH3tm1Lpkn | Cohen Lab, (Lipkin et al., 2002) | JAX:018845 |
| Recombinant DNA | ||
| Sequence-Based Reagents | ||
| Allele-specific primers (ASP), used for PCR amplifying 59.5, see Table S1 | This paper | N/A |
| Allele-specific oligonucleotides (ASO), used for genotyping for 59.5, see Table S2 | This paper | N/A |
| Allele-specific primers (ASP), used for PCR amplifying A3, see Table S3 | This paper and Table S2 from Cole et al., 2010 | N/A |
| Allele-specific oligonucleotides (ASO), used or genotyping A3, see Table S4 | This paper and Table S3 from Cole et al., 2010 | N/A |
| Software and Algorithms | ||
| ImageJ64 1.47v | NIH | |
| Prism6 | GraphPad Software | |
| FlowJo v.9.7.6 | FlowJo, LLC | |
| Zen Pro | Zeiss | |
| Other | ||
| dbSNP database | NCBI | https://www.ncbi.nlm.nih.gov/SNP/ |
Contact for Reagent and Resource Sharing
Further information and requests for reagents should be directed to the corresponding author: Francesca Cole (fcole@mdanderson.org).
Experimental Model and Subject Details
Mice
C57BL/6J (B) x DBA/2J (D) F1 hybrid mice were bred from parental strains purchased from the Jackson Laboratory. Mice carrying the Mlh3 null allele were a kind gift from P. Cohen (Lipkin et al., 2002) and were introgressed into the B and D lines for a minimum of 4 generations prior to interbreeding to generate F1 hybrids. F1 hybrids in this study are identified as BxD, regardless of the sex of the parent of origin. Animals were housed in standard rodent-approved cages, with ad libitum access to food and water and 12:12 light/dark cycle. All experiments were approved by the University of Texas MD Anderson Cancer Center Institutional Animal Care and Use Committee (protocol no. 00001132-RN01).
Human samples
Testicular samples from 15- and 16-year old cadaveric organ donors were acquired from BioreclamationIVT. Frozen samples were stamped and squashed onto slides containing 65μl of warm 1% PFA (pH 9.2)/0.1%Triton X-100 solution. Slides were rinsed with milliQ H2O, and twice with 1:250 Photo-Flo 200 and stained as described below. Importantly, squashed spermatocytes are more likely to preserve chromosome axis structure than spreads, which hypotonically swell nuclei (see below). As such, the axis lengths are more likely to be artificially shorter than those derived from spreads rather than longer as observed here.
Spermatocyte spreads and immunofluorescence
Testis or a portion of a testis was decapsulated into 2ml testis isolation medium (TIM: 104mM NaCl, 45mM KCl, 1.2mM MgSO4, 0.6mM KH2PO4, 0.1% (w/v) glucose, 6 mM sodium lactate, 1 mM sodium pyruvate, pH 7.3, filter sterilized) containing 2mg/ml collagenase at 32°C for 55′ with shaking (500rpm). Next, tubules were washed three times with 15ml of TIM, resuspended in 2ml of TIM/0.7mg/ml trypsin/4μg/ml DNaseI and shaken for 15′ at 32°C. Next, 500μl of trypsin inhibitor solution (freshly prepared: 20mg/ml of trypsin inhibitor in TIM) and 50μl DNaseI (0.4μg/μl) solution was added. Cells were separated by repeatedly pipetting up and down for 2′ with plastic transfer pipet and filtered thru 70μm BD cell strainer to a new tube and centrifuged for 5′ at ~600g. After removal of supernatant, 15μl of DNaseI was added, the cell pellet was dislodged, and washed with 15ml TIM. Pelleting was repeated and resuspended in 15μl of DNaseI and 12ml of 1xPBS. 1ml of cell suspension was then transferred to eppendorf tubes and centrifuged at 200g, RT for 5′. After carefully removing the supernatant, cells were resuspended with P200 pipet tip in 80μl of 0.1M sucrose pre-warmed to 37°C and left at RT for 3–5′. Meanwhile, in a moist flat chamber 65μl of warm 1% PFA (pH 9.2)/0.1%Triton X-100 solution was placed on positively charged, precleaned glass slides and spread out with the pipet tip (to cover about half of the slide area). A droplet ~20μl sucrose suspension was dropped on each slide within the PFA solution. Slides were then dried: in moist, closed chamber for 2.5h, then ajar for 30′ and then open for 30′. Slides were rinsed with milliQ H2O, and two times with 1:250 Photo-Flo 200 solution. Slides were air dried for prolonged storage (−80°C).
Staining of slides was originally described in (Cole et al., 2012). Briefly, slides were blocked for 30′ at 37°C with 100μl Antibody Dilution Buffer (ADB: 10% goat serum, 3% BSA, 0.05% Triton X-100, 1xPBS) covered with cut parafilm in a humidified flat chamber. Next, slides were incubated with 100μl of 1° antibody diluted in ADB overnight at room temperature. After incubation slides were washed for 5′ with 1xPBS/0.4% PhotoFlo in a coplin jar on a platform shaker and washed again for 5′ with 1xPBS/0.4% PhotoFlo/0.01% Triton X-100 and blocked with ADB as before for 10′ at 37°C. Next, slides were incubated with 100μl of 2° antibody diluted in ADB (1:200) for 1h at 37°C. After incubation washes with 1xPBS/0.4% PhotoFlo and 1xPBS/0.4% PhotoFlo/0.01% Triton X-100 were repeated as described above. Slides were then dried in the dark and mounted with Prolong® Gold antifade with DAPI.
Images were acquired on a Zeiss Axio Imager M2 with a Plan-Apochromat 100x/1.4 oil immersion objective.
Axis lengths were measured in ImageJ.
Metaphase I spreads
Testis or a portion of a testis was decapsulated in 2.9% isotonic sodium citrate solution at room temperature. The seminiferous tubules were pulled out and with fine, straight forceps their contents thoroughly teased out. Empty tubules were allowed to settle, and the supernatant fluid was transferred into a 15ml centrifuge tube, avoiding transferring the tubules. The cell suspension obtained was centrifuged at 200g for 5′. The supernatant was discarded and pellet resuspended in 3ml of 1% hypotonic sodium citrate solution and left for 12′ at room temperature. Cells were then divided into two aliquots and centrifuged at 200g for 5′. After removing supernatant, the cells were resuspended in the remainder by flicking the tube. 250ml of fixative was added, direct onto the suspended cells. The tube was thoroughly mixed with the fixative. More fixative was added down the side of the tube (in 250ml increments), while flicking to maintain the mixing process. After 5′ incubation, cells were centrifuged at 200g for 5′ and resuspended in fresh fixative. A portion (~100μl) of cell suspension was taken with a pipet. A droplet was allowed to fall on a grease-free slide and then air-dried.
Dry slides were stained with lactic-acetic orcein or with a Giemsa staining kit, according to manufacturer’s protocol. For orcein: 2–3 drops of lactic-acetic orcein were added onto each slide, covered with a rinzyl coversip and warmed to 50°C for 30′ in a humidified chamber, allowing at least 30′ for staining. Next, slides were rinsed in running water for 5′ on the back of the slide, rinsed in distilled water, air-dried, and mounted. Slides were visualized on a Zeiss Axio Scope.A1 with Axiocam 506 color camera and with Zeiss Plan Apochromat 100x/1.3 oil DIC M27 objective.
Polymorphism Identification
Polymorphisms identified by the Wellcome Trust Sanger Institute Mouse Genome Project and published in (Cole et al., 2010; Kelmenson et al., 2005), were verified by sequencing genomic DNA from parental mouse strains from The Jackson Laboratory (primers in Table S1).
Isolation of 4C Spermatocytes by Flow Cytometry
The protocol was previously published in (Cole et al., 2014). Briefly, testes were dissected from males of different age groups (1st round: 17–20dpp; 3rd round: 32–37dpp; adults: 2–5mo). After decapsulation, seminiferous tubules were incubated in Gey’s Balanced Salt Solution (GBSS) with 0.5mg/ml collagenase at 33°C for 15′ with shaking (500rpm). After removal of supernatant and washing with 10ml GBSS, tubules were incubated in GBSS/0.5mg/ml trypsin/1mg/ml DNaseI at 33°C for 15′ with shaking (500rpm). Subsequently, 0.5ml UV-irradiated Newborn Calf Serum (NCS) was added and repeatedly pipetted up and down for 3′ with plastic transfer pipet to separate cells. The cell suspension was then filtered with a 70μm BD cell strainer and centrifuged for 3′ at ~500–600g. After removal of supernatant, 25μl DNAseI (0.4μg/μl) was added to the cell pellet and tapped to resuspend, followed by addition of 10ml of GBSS/5% NCS. Centrifugation and wash steps were repeated. For mutant and juvenile samples with low number of testicular cells, the pellet was resuspended in 3ml of GBSS/5% NCS/8μl DNaseI, and Hoechst 33342 (2.5μg/μl in DMSO and stored at 4°C without light) was added to a final concentration of 5μg/ml. For WT/Het animals, the cell pellet was resuspended in 6ml GBSS/5% NCS/16μl DNaseI and Hoechst 33342 at 5μg/ml. Cell suspensions were stained for 45′ at 33°C/500rpm. Finally, propidium iodide was added to the cell suspension at 0.2μg/ml and cells were filtered through a 70μm cell strainer. Cells were sorted on an Aria or Fusion flow cytometer (BD) with a 350nm argon laser. Dead cells were gated and removed based on propidium iodide staining. Live cells with the highest blue (4C DNA content) and red (chromatin compaction) fluorescence intensities were sorted (for the gating strategy used, see Figure 2A).
After sorting, cells were counted with a hemocytometer, washed with 1xPBS, centrifuged for 5′ at 600g and snap frozen in dry ice/ethanol for storage at −80°C. A portion of the sorted cells was surface-spread and stained with antibodies that recognize the synaptonemal complex components SYCP3 and SYCP1 and DAPI to allow staging and purity assessment. Sorted splenic cells from the same mice were used as a somatic control.
Genomic DNA Isolation
Cell pellets were resuspended in 500μl 0.2X SSC with vortexing. Next, 60μl β-mercaptoethanol, 10μl of 20μg/μl Proteinase K and 50μl of 10% SDS were added sequentially. The tube was incubated for 1h at 55°C, with mixing. Phenol/chloroform/isoamyl alcohol extraction was performed using an equal volume of commercially prepared reagent. The aqueous phase was transferred to a new tube, 4μl of linear polyacrylamide as DNA carrier was added, and two volumes of ice-cold 100% ethanol added to precipitate the genomic DNA. The sample was kept for 20′ on dry ice/ethanol and 1–2h in −20°C then centrifuged (15′ at 15,000g). After the supernatant was carefully removed the DNA pellet was washed with one volume of 70% ethanol and centrifuged again for 5′. After air-drying for ~5′, the pellet was resuspended overnight in 35–50μl of 5mM Tris (pH 7.5) at +4°C.
Determination of Amplifiable DNA Concentration
An aliquot of DNA was used to quantify DNA concentration by nanodrop and a dilution series (0.01, 0.05, 0.1μg) was run on a 0.8% agarose gel to compare band intensity and quality of the DNA with high quality mouse genomic DNA of known concentration. The number of amplifiable DNA molecules/pg was determined for each hotspot and DNA sample by performing 12–24 PCR reactions per sample seeded with 12pg per reaction (equivalent of 2 amplifiable molecules/well) using 2 rounds of nested allele specific primers (ASPs) on one side of the hotspot and universal primers on the other as described in detail in (Cole and Jasin, 2011). PCR was performed with conditions and ASPs used for the CO or NCO assays as described below. PCR products were run on an agarose gel and the number of positive (Npos) and negative (Nneg) wells was used to calculate the average number of amplifiable molecules per reaction (μamp) according to this formula: μamp = −ln Nneg/Npos
CO Assay
CO assays for A3 were described in detail previously (Cole and Jasin, 2011; Cole et al., 2010). In this study, sperm or 4C DNA was assayed in small pools per well: 200–750 and 100–400 input DNA molecules for A3 and 59.5, respectively. D to B amplification for A3 used the following primer pairs: 1° Df3 to Br4020; 2° Df4.1 to Br3938; 3° Df4.1 to A3r3917. B to D amplification for 59.5: 1° Bf14590.1 to Car19881; 2° Bf14913.1 to Car19683; 3° Bf15239 to Car19683. All annealing temperatures were empirically determined for each new batch of 11.1x buffer. Each 8μl reaction PCR mix contained: 1x buffer (10x: 450mM Tris-HCl pH 8.8, 110mM (NH4)2SO4, 45mM MgCl2, 67mM BME, 44μM EDTA, 10mM each: dATP, dTTP, dGTP, and dCTP, and 1.13mg/ml non-acetylated BSA), 12.5mM Tris-base, 0.2μM of each primer, 0.25U of Taq, and 0.05U of Pfu polymerase. 0.5μl of 1° PCR reaction was added to 5μl of S1 nuclease mix (0.7U/μl S1 nuclease in 1x buffer: 20mM sodium acetate, 1mM Zn acetate, 0.1M NaCl), diluted with 45μl of dilution buffer (10mM Tris-HCl pH 7.5 and 5μg/ml sonicated salmon sperm DNA), and amplified using the 2° pair of primers in an 8μl reaction. PCR conditions were denaturation (1min at 96°C) followed by multiple cycles of amplification (20s at 96°C, 30s at the optimized annealing temperature and 60s/kb at 65°C for extension); after S1 digestion and dilution, 2° PCR conditions were the same. 27 cycles of amplification were used for A3 1° and 2° PCR. 26 and 31 cycles of amplification were used for 59.5 1° and 2° PCR, respectively. PCR reactions containing COs were identified by running 1/10 of the 2° PCR on a 0.8% agarose gel. Positive wells were then PCR amplified in a 3° reaction, alongside B and D positive and negative well controls (conditions for both A3 and 59.5 hotspots were identical for 3° PCR: denaturation (1 min at 96°C) followed by 6 cycles of amplification (20s at 96°C, 30s at the highest optimized annealing temperature and 60s/kb at 65°C for extension), followed by 15 cycles of amplification (20s at 96°C, 30s at 2°C below the highest optimized annealing temperature, and 60s/kb at 65°C for extension). Next, reactions in a 96-well format were dot-blotted onto nylon hybridization membrane and genotyped by Southern blotting with allele specific oligonucleotide (ASO) probes. Somatic DNA from the same animal was used at total DNA input equivalents or higher to germline DNA as a negative control.
NCO Assay
NCO assays for A3 were described in detail previously (Cole and Jasin, 2011; Cole et al., 2010). In this study, sperm or 4C DNA was assayed in small pools per well (30–40 input DNA molecules for both A3 and 59.5). D to U amplification for A3 was done with following primer pairs: 1° Df3 to A3r3917; 2° Df4.1 to A3r3588. B to U amplification for 59.5: 1° Bf14590.1 to U5r19063; 2° Bf14913.1 to U5r19001. All annealing temperatures were empirically determined for each new batch of buffer. PCR mix constitution was identical to that described for CO assays; volumes and subsequent dilutions were as follows: The 8μl 1° PCR was diluted with 35μl of dilution buffer and 1.6μl of 1° PCR was used to seed a 35μl 2° PCR. 1° and 2° PCR conditions for both A3 and 59.5 hotspots were identical to those for CO assays described above, except 59.5 2° PCR: denaturation (1min at 96°C) followed by 35 cycles of amplification (20s at 96°C, 30s at the optimized annealing temperature and 60s/kb at 65°C for extension). Next, reactions with appropriate positive controls derived from amplified B and D genomic DNA were dot-blotted in 96-well format onto nylon hybridization membrane and genotyped by Southern blotting with ASO probes. Somatic DNA from the same animal was used at total DNA input equivalents to germline DNA as a negative control.
Genotyping with ASO probes
A detailed version of this protocol for A3 was described in (Cole and Jasin, 2011; Cole et al., 2010). The ASO labeling 1x kinase reaction was assembled in a final volume of 10μl per two blots and contained: 70mM Tris-HCl, pH 7.5, 10mM MgCl2, 5mM spermidine trichloride, 2mM dithiothreitol; 8ng of appropriate ASO; 0.35μl T4 polynucleotide kinase (10U/μl), 0.2μl (γ-32P) ATP (10mCi/ml). Reactions were then incubated at 37°C for 45′, and subsequently stopped by adding 20μl of Kinase Stop Solution (25mM EDTA, 0.1% SDS, 10μM ATP) and 20μl of unlabeled ASO of the opposite genotype (8μg/ml).
Dot-blot membranes, first washed in 3x SSC buffer (20x: 3M NaCl and 0.3M citric acid trisodium salt dihydrate, pH 7.0) were then pre-hybridized in a rotisserie hybridization oven with 3ml of prewarmed TMAC hybridization buffer (3M TMAC, 0.6% SDS, 10mM NaPO4 pH 6.8, 1mM EDTA, 4μg/ml yeast RNA, in 5x Denhardt’s solution) at 56°C for 10–15′. 50x Denhardt’s solution: 1% (w/v) Ficoll 400, 1% (w/v) polyvinyl pyrrolidone, 1% (w/v) BSA (Fraction V); filter sterilized. Next, TMAC buffer was removed and 2.5ml of fresh TMAC hybridization buffer supplemented with 7μl of 3mg/ml sonicated salmon sperm DNA was added; blots were incubated for an additional 10′ at 53°C in the oven before labeled probes were added and then incubated for 45′–60′ at 53°C. Next, the membranes were washed three times with 2.5ml of prewarmed TMAC wash buffer (3M TMAC, 0.6% SDS, 10mM NaPO4 pH 6.8, 1mM EDTA) over 20′ with rotation at 56°C. A final wash with 4ml TMAC wash buffer for 15′ was followed by rinsing the membranes two times with 3x SSC in the bottle. If more than one membrane was hybridized per bottle, buffers and probe were scaled up accordingly. Excess liquid was blotted off before wrapping membranes in plastic, and expose for 3–5h on a phosphorimager screen. Screens were scanned using Typhoon FLA 9500 phosphorimager (GE Healthcare) at PMT set to 750V.
Confirmation of NCOs by Cloning
A detailed version of this protocol is available (Cole and Jasin, 2011). After identifying wells with NCOs of interest, 0.6μl from the 1° PCR was used to seed a 2° PCR in a total volume of 15μl (as described for NCO assays above). Next, 1μl from the 2° PCR was used to perform a TOPO® TA ligation reaction, following the manufacturer’s instructions: reactions were mixed gently and incubated for 30′ at RT. Next, reactions were placed on ice and 1–2μl of the ligation reaction was used to transform into competent cells (e.g., TOP10® chemically competent) on ice for 30′. Bacteria were heat-shocked for 30s at 42°C and transferred to ice. 250μl of room temperature S.O.C. medium (supplied with the kit) was added and tubes were shaken horizontally (200rpm) at 37°C for 1h. 50–100μl from each transformation was spread on a prewarmed ampicillin selective plate and incubated overnight at 37°C. Next day, dry 82mm disc nylon membranes (Hybond-XL, 82mm) were placed on the plates and left for 30s. The membranes were then placed colony side-up on Whatman filter paper soaked with cloning denaturation buffer (0.5M NaCl, 0.5M NaOH) for 2–5′, followed by two subsequent incubations on Whatman filter paper soaked with cloning neutralization buffer (1.5M NaCl, 0.5M Tris-HCl, pH 7.5) for 3′. Membranes were washed in 2x SSC, dried and crosslinked in a Stratalinker, according to manufacturer’s recommendations. At this point membranes were subjected to ASO hybridization to genotype NCOs.
Experimental Design
The molecular analysis has not been blinded, since lack of COs was apparent and would defeat any attempts to blind. All immunofluorescence quantifications were blinded to age, however in some cases, where lack of COs was apparent (as MLH1 foci or bivalent quantification), these studies were not blinded. Sample sizes were not predetermined by statistical methods; minimal number of studied animals per experimental group was 2 non-littermates, in most cases at least 3 animals per group were analyzed. For analyses in which comparison between animals of different Mlh3 genotypes was made, −/− and +/− or +/+ animals from the same litters were included in the analysis. Experiments were not randomized.
Quantification and Statistical Analysis
All data are shown as means with standard deviation (SD), standard error, or confidence interval as noted. For comparing recombination frequencies and metaphase spreads we used the Fisher’s exact test. For foci counting we used the non-parametrical Mann-Whitney U test or for multiple comparisons, the Kruskal-Wallis test followed by Dunn’s post-hoc analysis, because normal distribution could not be assumed. We report the number of analyzed animals per group as N and the number of quantified data points (e.g., molecules or nuclei) as n; both values can be found in the appropriate table or figure legend. Sample sizes were not predetermined using any statistical methods.
Supplementary Material
Recombination at 59.5 in BxD F1 hybrid sperm.
Top panel: Cumulative fraction of COs in both orientations: B to D (squares) and D to B (circles); vertical lines represent the midpoint for each orientation. Note that the distributions of each orientation are offset from each other, a hallmark of reciprocal CO asymmetry. Reciprocal CO asymmetry is due to DSBs forming preferentially on only one of the two homologs, here the B homolog. Owing to CO-dependent gene conversion, COs in the recipient to donor orientation (B to D) cluster to the left and COs in the donor to recipient orientation (D to B) cluster to the right of the hotspot center (schematic above). As such, the distance between midpoints is an estimate of the mean CO gene conversion tract length (548bp).
Middle panel: CO breakpoint maps in the B to D (top) and D to B (bottom) orientations.
Tickmarks represent polymorphisms tested. N=5 each.
Bottom panel: histogram of NCO distribution. Consistent with reciprocal CO asymmetry, ~3-fold more NCOs are found on chromosome B vs. D. Tickmarks as above. B chromosome, N = 5; D chromosome, N = 4.
RPA2 foci dynamics in adult and juvenile mouse spermatocytes with and without MLH3.
Top panel, representative images and quantification of RPA2 foci for each experimental group and stage. Scale bar = 10μm.
Bottom panel, quantification for each experimental group (N=2; except Mlh3−/− Adult and 1st round N=3). Z, zygonema, P, pachynema. Mean ± SD: Adult Mlh3+/+ Z 277 ± 71, Adult Mlh3+/+ P 163 ± 54, Adult Mlh3−/− Z 207 ± 59, Adult Mlh3−/− P 152 ± 51, 1st round Mlh3+/+ Z 187 ± 58, 1st round Mlh3+/+ P 98 ± 55, 1st round Mlh3−/− Z 217 ± 71, 1st round Mlh3−/− P 117 ± 52, 3rd round Mlh3+/+ P 144 ± 58, 3rd round Mlh3−/− P 144 ± 57. Some data are reproduced from Figures 1, 2, and 3. P values, Kruskal-Wallis test followed by Dunn’s correction, black bars are mean ± SD.
Distribution of RPA2 foci in adult and juvenile mouse spermatocytes with and without MLH3.
Histograms displaying binned RPA2 foci data (25 foci/bin) of nuclei for each age and genotype.
No alterations in the frequency or distribution of noncrossovers at the A3 hotspot in juveniles or adults or with and without.
(A) Top, histogram of singleton NCO frequencies at specific polymorphisms (ntot) at each genotype and round of spermatogenesis (Mlh3+/− adult N=2, Mlh3+/+ or +/− 1st round N=3, Mlh3−/− adults N=3, Mlh3−/− 1st round N=1).
Bottom, plots of representative NCOs (nplot). Here and elsewhere unless noted, the number of nplot shown and corresponding length of the plotted maps is proportional to the alterations in NCO frequencies among experimental groups.
Tickmarks represent SNPs tested.
(B) Frequency and distribution of co-converted NCOs were unaltered between spermatocytes with or without MLH3 (compare A with B). Mean average tract lengths ± SD are indicated.
All noncrossovers detected at 59.5.
Top panel: All NCOs detected in Mlh3+/− spermatocytes from the indicated rounds of spermatogenesis. The number in smaller point size to the left of each NCO category denotes the number of NCOs detected at this position; ntot = total number of NCOs detected.
Middle panel: All singleton NCOs in Mlh3−/− spermatocytes from the indicated rounds of spermatogenesis.
Bottom panel: All co-conversions detected in Mlh3−/− mice from the indicated rounds of spermatogenesis.
Most long noncrossovers do not contain retained heteroduplex DNA.
Top, depiction of expected outcomes from different NCO configurations after cloning and and probing with specific polymorphisms (poly).
Bottom, analysis of 13 cloned long NCOs. 11 were consistent with single, continuous molecules with patterns described in A (single co-conversion). Two clones (designated with *) appeared to represent two independent molecules. Two independent clones could mean that either two independent NCO events were detected in one well (B, top), or that these represent retained heteroduplex (C, top), which after PCR amplification appears as two independent recombinants. In both cases, a different pattern of D-positive colonies was observed for neighboring polymorphisms. Retained heteroduplex is more likely because the number of wells estimated to contain two independent, co-converted NCOs was well below that observed here (0.28). In some cases, after several rounds of probing and stripping we were unable to confirm a signal for some polymorphisms, which are indicated with a gray box for untested SNP.
None of the long noncrossovers are observed at 59.5 on the D chromosome.
Plots of all NCOs isolated from the D chromosome in the indicated genotypes. No co-converted NCOs were recovered, regardless of the genotype, or round of spermatogenesis from more than 25,000 haploid genomes (Mlh3+/− adults N=1, Mlh3+/− 1st round N=1, Mlh3−/− adults N=2, Mlh3−/− 1st round N=3). Assuming a similar percentage of co-conversions among all NCOs, as observed on the B chromosome in spermatocytes from Mlh3−/− adults (~13%), we would expect 9–10 co-converted NCOs in Mlh−/− animals.
Table S1. Related to STAR Methods. Allele-specific primers (ASP), used for PCR amplifying 59.5.
Nucleotides in red indicate polymorphic sites between B and D.
Table S2. Related to STAR Methods. Allele-specific oligos (ASO), used for genotyping 59.5.
Nucleotides in red indicate polymorphic sites between B and D.
Table S3. Related to STAR Methods. Allele-specific primers (ASP), used for PCR amplifying A3.
Nucleotides in red indicate polymorphic sites between B and D.
Table S4. Related to STAR Methods. Allele-specific oligos (ASO), used for genotyping A3.
Nucleotides in red indicate polymorphic sites between B and D.
Highlights.
Juvenile mouse spermatocytes have fewer crossovers and more achiasmate chromosomes
Greater use of alternative DNA repair pathways in juvenile mouse spermatocytes
Lower MutLγ focus density in juvenile human spermatocytes
Juvenile spermatocytes likely suffer from crossover maturation inefficiency
Acknowledgments
We thank P. Cohen for mice; J. Baird for technical support, S. Reh for technical suggestions; S. Wang, L. Zhang, and N. Kleckner for sharing results; S. Arur and B. Dennehey for critical comments; and the CCSG (NIH CA16672) supported cores Flow Cytometry and Cellular Imaging, Molecular Biology, Histology, and Research Animal Support at Science Park. This work was supported by grants from CPRIT (R1213), the Jeanne F. Shelby Scholarship Fund, and the NIH (DP2HD087943). RK was supported by a CPRIT research training award (RP170067). JH and MG were supported by NIH grant R25ES016147 (MDACC).
Footnotes
Author Contributions
Conceptual design and writing MJZ and FC; Data analysis and paper editing All authors; Funding acquisition FC
Publisher's Disclaimer: This is a PDF file of an unedited manuscript that has been accepted for publication. As a service to our customers we are providing this early version of the manuscript. The manuscript will undergo copyediting, typesetting, and review of the resulting proof before it is published in its final citable form. Please note that during the production process errors may be discovered which could affect the content, and all legal disclaimers that apply to the journal pertain.
References
- Anderson LK, Reeves A, Webb LM, Ashley T. Distribution of crossing over on mouse synaptonemal complexes using immunofluorescent localization of MLH1 protein. Genetics. 1999;151:1569–1579. doi: 10.1093/genetics/151.4.1569. [DOI] [PMC free article] [PubMed] [Google Scholar]
- Bizard AH, Hickson ID. The dissolution of double Holliday junctions. Cold Spring Harb Perspect Biol. 2014;6:a016477. doi: 10.1101/cshperspect.a016477. [DOI] [PMC free article] [PubMed] [Google Scholar]
- Blanco MG, Matos J. Hold your horSSEs: controlling structure-selective endonucleases MUS81 and Yen1/GEN1. Front Genet. 2015;6:253. doi: 10.3389/fgene.2015.00253. [DOI] [PMC free article] [PubMed] [Google Scholar]
- Borner GV, Kleckner N, Hunter N. Crossover/noncrossover differentiation, synaptonemal complex formation, and regulatory surveillance at the leptotene/zygotene transition of meiosis. Cell. 2004;117:29–45. doi: 10.1016/s0092-8674(04)00292-2. [DOI] [PubMed] [Google Scholar]
- Cloud V, Chan YL, Grubb J, Budke B, Bishop DK. Rad51 is an accessory factor for Dmc1-mediated joint molecule formation during meiosis. Science. 2012;337:1222–1225. doi: 10.1126/science.1219379. [DOI] [PMC free article] [PubMed] [Google Scholar]
- Cole F, Baudat F, Grey C, Keeney S, de Massy B, Jasin M. Mouse tetrad analysis provides insights into recombination mechanisms and hotspot evolutionary dynamics. Nat Genet. 2014;46:1072–1080. doi: 10.1038/ng.3068. [DOI] [PMC free article] [PubMed] [Google Scholar]
- Cole F, Jasin M. Isolation of meiotic recombinants from mouse sperm. Methods Mol Biol. 2011;745:251–282. doi: 10.1007/978-1-61779-129-1_15. [DOI] [PMC free article] [PubMed] [Google Scholar]
- Cole F, Kauppi L, Lange J, Roig I, Wang R, Keeney S, Jasin M. Homeostatic control of recombination is implemented progressively in mouse meiosis. Nature cell biology. 2012;14:424–430. doi: 10.1038/ncb2451. [DOI] [PMC free article] [PubMed] [Google Scholar]
- Cole F, Keeney S, Jasin M. Comprehensive, fine-scale dissection of homologous recombination outcomes at a hot spot in mouse meiosis. Mol Cell. 2010;39:700–710. doi: 10.1016/j.molcel.2010.08.017. [DOI] [PMC free article] [PubMed] [Google Scholar]
- Crown KN, McMahan S, Sekelsky J. Eliminating both canonical and short-patch mismatch repair in Drosophila melanogaster suggests a new meiotic recombination model. PLoS Genet. 2014;10:e1004583. doi: 10.1371/journal.pgen.1004583. [DOI] [PMC free article] [PubMed] [Google Scholar]
- de Boer E, Jasin M, Keeney S. Local and sex-specific biases in crossover vs. noncrossover outcomes at meiotic recombination hot spots in mice. Genes Dev. 2015;29:1721–1733. doi: 10.1101/gad.265561.115. [DOI] [PMC free article] [PubMed] [Google Scholar]
- De Muyt A, Jessop L, Kolar E, Sourirajan A, Chen J, Dayani Y, Lichten M. BLM helicase ortholog Sgs1 is a central regulator of meiotic recombination intermediate metabolism. Mol Cell. 2012;46:43–53. doi: 10.1016/j.molcel.2012.02.020. [DOI] [PMC free article] [PubMed] [Google Scholar]
- Getun IV, Wu Z, Fallahi M, Ouizem S, Liu Q, Li W, Costi R, Roush WR, Cleveland JL, Bois PR. Functional Roles of Acetylated Histone Marks at Mouse Meiotic Recombination Hotspots. Mol Cell Biol. 2016 doi: 10.1128/MCB.00942-15. [DOI] [PMC free article] [PubMed] [Google Scholar]
- Getun IV, Wu ZK, Bois PR. Organization and roles of nucleosomes at mouse meiotic recombination hotspots. Nucleus. 2012;3:244–250. doi: 10.4161/nucl.20325. [DOI] [PMC free article] [PubMed] [Google Scholar]
- Gilbertson LA, Stahl FW. A test of the double-strand break repair model for meiotic recombination in Saccharomyces cerevisiae. Genetics. 1996;144:27–41. doi: 10.1093/genetics/144.1.27. [DOI] [PMC free article] [PubMed] [Google Scholar]
- Goldman AS, Lichten M. Restriction of ectopic recombination by interhomolog interactions during Saccharomyces cerevisiae meiosis. Proc Natl Acad Sci U S A. 2000;97:9537–9542. doi: 10.1073/pnas.97.17.9537. [DOI] [PMC free article] [PubMed] [Google Scholar]
- Gruhn JR, Rubio C, Broman KW, Hunt PA, Hassold T. Cytological studies of human meiosis: sex-specific differences in recombination originate at, or prior to, establishment of double-strand breaks. PLoS One. 2013;8:e85075. doi: 10.1371/journal.pone.0085075. [DOI] [PMC free article] [PubMed] [Google Scholar]
- Guillon H, Baudat F, Grey C, Liskay RM, de Massy B. Crossover and noncrossover pathways in mouse meiosis. Mol Cell. 2005;20:563–573. doi: 10.1016/j.molcel.2005.09.021. [DOI] [PubMed] [Google Scholar]
- Hassold T, Chiu D. Maternal age-specific rates of numerical chromosome abnormalities with special reference to trisomy. Hum Genet. 1985;70:11–17. doi: 10.1007/BF00389450. [DOI] [PubMed] [Google Scholar]
- Heyer WD. Recombination: Holliday junction resolution and crossover formation. Curr Biol. 2004;14:R56–58. doi: 10.1016/j.cub.2003.12.043. [DOI] [PubMed] [Google Scholar]
- Holloway JK, Booth J, Edelmann W, McGowan CH, Cohen PE. MUS81 generates a subset of MLH1-MLH3-independent crossovers in mammalian meiosis. PLoS Genet. 2008;4:e1000186. doi: 10.1371/journal.pgen.1000186. [DOI] [PMC free article] [PubMed] [Google Scholar]
- Hunter N. Meiotic Recombination: The Essence of Heredity. Cold Spring Harb Perspect Biol. 2015;7 doi: 10.1101/cshperspect.a016618. [DOI] [PMC free article] [PubMed] [Google Scholar]
- Hunter N, Kleckner N. The single-end invasion: an asymmetric intermediate at the double-strand break to double-holliday junction transition of meiotic recombination. Cell. 2001;106:59–70. doi: 10.1016/s0092-8674(01)00430-5. [DOI] [PubMed] [Google Scholar]
- Kauppi L, Barchi M, Lange J, Baudat F, Jasin M, Keeney S. Numerical constraints and feedback control of double-strand breaks in mouse meiosis. Genes Dev. 2013;27:873–886. doi: 10.1101/gad.213652.113. [DOI] [PMC free article] [PubMed] [Google Scholar]
- Kelmenson PM, Petkov P, Wang X, Higgins DC, Paigen BJ, Paigen K. A torrid zone on mouse chromosome 1 containing a cluster of recombinational hotspots. Genetics. 2005;169:833–841. doi: 10.1534/genetics.104.035063. [DOI] [PMC free article] [PubMed] [Google Scholar]
- Lange J, Yamada S, Tischfield SE, Pan J, Kim S, Zhu X, Socci ND, Jasin M, Keeney S. The Landscape of Mouse Meiotic Double-Strand Break Formation, Processing, and Repair. Cell. 2016;167:695–708. e616. doi: 10.1016/j.cell.2016.09.035. [DOI] [PMC free article] [PubMed] [Google Scholar]
- Lenzi ML, Smith J, Snowden T, Kim M, Fishel R, Poulos BK, Cohen PE. Extreme heterogeneity in the molecular events leading to the establishment of chiasmata during meiosis i in human oocytes. Am J Hum Genet. 2005;76:112–127. doi: 10.1086/427268. [DOI] [PMC free article] [PubMed] [Google Scholar]
- Lipkin SM, Moens PB, Wang V, Lenzi M, Shanmugarajah D, Gilgeous A, Thomas J, Cheng J, Touchman JW, Green ED, et al. Meiotic arrest and aneuploidy in MLH3-deficient mice. Nat Genet. 2002;31:385–390. doi: 10.1038/ng931. [DOI] [PubMed] [Google Scholar]
- Lynn A, Koehler KE, Judis L, Chan ER, Cherry JP, Schwartz S, Seftel A, Hunt PA, Hassold TJ. Covariation of synaptonemal complex length and mammalian meiotic exchange rates. Science. 2002;296:2222–2225. doi: 10.1126/science.1071220. [DOI] [PubMed] [Google Scholar]
- Machovina TS, Mainpal R, Daryabeigi A, McGovern O, Paouneskou D, Labella S, Zetka M, Jantsch V, Yanowitz JL. A Surveillance System Ensures Crossover Formation in C. elegans. Curr Biol. 2016;26:2873–2884. doi: 10.1016/j.cub.2016.09.007. [DOI] [PMC free article] [PubMed] [Google Scholar]
- Martin RH, Ko E, Rademaker A. Distribution of aneuploidy in human gametes: comparison between human sperm and oocytes. Am J Med Genet. 1991;39:321–331. doi: 10.1002/ajmg.1320390315. [DOI] [PubMed] [Google Scholar]
- Martin RH, Rademaker A. The frequency of aneuploidy among individual chromosomes in 6,821 human sperm chromosome complements. Cytogenet Cell Genet. 1990;53:103–107. doi: 10.1159/000132905. [DOI] [PubMed] [Google Scholar]
- Martini E, Borde V, Legendre M, Audic S, Regnault B, Soubigou G, Dujon B, Llorente B. Genome-wide analysis of heteroduplex DNA in mismatch repair-deficient yeast cells reveals novel properties of meiotic recombination pathways. PLoS Genet. 2011;7:e1002305. doi: 10.1371/journal.pgen.1002305. [DOI] [PMC free article] [PubMed] [Google Scholar]
- Mitchel K, Lehner K, Jinks-Robertson S. Heteroduplex DNA position defines the roles of the Sgs1, Srs2, and Mph1 helicases in promoting distinct recombination outcomes. PLoS Genet. 2013;9:e1003340. doi: 10.1371/journal.pgen.1003340. [DOI] [PMC free article] [PubMed] [Google Scholar]
- O’Shaughnessy PJ, Sheffield JW. Effect of temperature and the role of testicular descent on post-natal testicular androgen production in the mouse. J Reprod Fertil. 1991;91:357–364. doi: 10.1530/jrf.0.0910357. [DOI] [PubMed] [Google Scholar]
- Oke A, Anderson CM, Yam P, Fung JC. Controlling meiotic recombinational repair - specifying the roles of ZMMs, Sgs1 and Mus81/Mms4 in crossover formation. PLoS Genet. 2014;10:e1004690. doi: 10.1371/journal.pgen.1004690. [DOI] [PMC free article] [PubMed] [Google Scholar]
- Plug AW, Xu J, Reddy G, Golub EI, Ashley T. Presynaptic association of Rad51 protein with selected sites in meiotic chromatin. Proc Natl Acad Sci U S A. 1996;93:5920–5924. doi: 10.1073/pnas.93.12.5920. [DOI] [PMC free article] [PubMed] [Google Scholar]
- Radford SJ, McMahan S, Blanton HL, Sekelsky J. Heteroduplex DNA in meiotic recombination in Drosophila mei-9 mutants. Genetics. 2007;176:63–72. doi: 10.1534/genetics.107.070557. [DOI] [PMC free article] [PubMed] [Google Scholar]
- Ribeiro J, Abby E, Livera G, Martini E. RPA homologs and ssDNA processing during meiotic recombination. Chromosoma. 2016;125:265–276. doi: 10.1007/s00412-015-0552-7. [DOI] [PMC free article] [PubMed] [Google Scholar]
- Roecker GO, Huether CA. An analysis for paternal-age effect in Ohio’s Down syndrome births, 1970–1980. Am J Hum Genet. 1983;35:1297–1306. [PMC free article] [PubMed] [Google Scholar]
- Rosu S, Zawadzki KA, Stamper EL, Libuda DE, Reese AL, Dernburg AF, Villeneuve AM. The C. elegans DSB-2 protein reveals a regulatory network that controls competence for meiotic DSB formation and promotes crossover assurance. PLoS Genet. 2013;9:e1003674. doi: 10.1371/journal.pgen.1003674. [DOI] [PMC free article] [PubMed] [Google Scholar]
- Stamper EL, Rodenbusch SE, Rosu S, Ahringer J, Villeneuve AM, Dernburg AF. Identification of DSB-1, a protein required for initiation of meiotic recombination in Caenorhabditis elegans, illuminates a crossover assurance checkpoint. PLoS Genet. 2013;9:e1003679. doi: 10.1371/journal.pgen.1003679. [DOI] [PMC free article] [PubMed] [Google Scholar]
- Steiner B, Masood R, Rufibach K, Niedrist D, Kundert O, Riegel M, Schinzel A. An unexpected finding: younger fathers have a higher risk for offspring with chromosomal aneuploidies. Eur J Hum Genet. 2015;23:466–472. doi: 10.1038/ejhg.2014.122. [DOI] [PMC free article] [PubMed] [Google Scholar]
- Svetlanov A, Baudat F, Cohen PE, de Massy B. Distinct functions of MLH3 at recombination hot spots in the mouse. Genetics. 2008;178:1937–1945. doi: 10.1534/genetics.107.084798. [DOI] [PMC free article] [PubMed] [Google Scholar]
- Tarsounas M, Morita T, Pearlman RE, Moens PB. RAD51 and DMC1 form mixed complexes associated with mouse meiotic chromosome cores and synaptonemal complexes. J Cell Biol. 1999;147:207–220. doi: 10.1083/jcb.147.2.207. [DOI] [PMC free article] [PubMed] [Google Scholar]
- Templado C, Uroz L, Estop A. New insights on the origin and relevance of aneuploidy in human spermatozoa. Mol Hum Reprod. 2013;19:634–643. doi: 10.1093/molehr/gat039. [DOI] [PubMed] [Google Scholar]
- Templado C, Vidal F, Estop A. Aneuploidy in human spermatozoa. Cytogenet Genome Res. 2011;133:91–99. doi: 10.1159/000323795. [DOI] [PubMed] [Google Scholar]
- Vrooman LA, Nagaoka SI, Hassold TJ, Hunt PA. Evidence for paternal age-related alterations in meiotic chromosome dynamics in the mouse. Genetics. 2014;196:385–396. doi: 10.1534/genetics.113.158782. [DOI] [PMC free article] [PubMed] [Google Scholar]
- Vrooman LA, Oatley JM, Griswold JE, Hassold TJ, Hunt PA. Estrogenic exposure alters the spermatogonial stem cells in the developing testis, permanently reducing crossover levels in the adult. PLoS Genet. 2015;11:e1004949. doi: 10.1371/journal.pgen.1004949. [DOI] [PMC free article] [PubMed] [Google Scholar]
- Wang S, Hassold T, Hunt P, White MA, Zickler D, Kleckner N, Zhang L. Inefficient Crossover Maturation Underlies Elevated Aneuploidy in Human Female Meiosis. Cell. 2017;168:977–989. e917. doi: 10.1016/j.cell.2017.02.002. [DOI] [PMC free article] [PubMed] [Google Scholar]
- Woglar A, Daryabeigi A, Adamo A, Habacher C, Machacek T, La Volpe A, Jantsch V. Matefin/SUN-1 phosphorylation is part of a surveillance mechanism to coordinate chromosome synapsis and recombination with meiotic progression and chromosome movement. PLoS Genet. 2013;9:e1003335. doi: 10.1371/journal.pgen.1003335. [DOI] [PMC free article] [PubMed] [Google Scholar]
- Wu L, Hickson ID. The Bloom’s syndrome helicase suppresses crossing over during homologous recombination. Nature. 2003;426:870–874. doi: 10.1038/nature02253. [DOI] [PubMed] [Google Scholar]
- Wu X, Arumugam R, Zhang N, Lee MM. Androgen profiles during pubertal Leydig cell development in mice. Reproduction. 2010;140:113–121. doi: 10.1530/REP-09-0349. [DOI] [PubMed] [Google Scholar]
- Yoshida S, Sukeno M, Nakagawa T, Ohbo K, Nagamatsu G, Suda T, Nabeshima Y. The first round of mouse spermatogenesis is a distinctive program that lacks the self-renewing spermatogonia stage. Development. 2006;133:1495–1505. doi: 10.1242/dev.02316. [DOI] [PubMed] [Google Scholar]
- Zakharyevich K, Tang S, Ma Y, Hunter N. Delineation of joint molecule resolution pathways in meiosis identifies a crossover-specific resolvase. Cell. 2012;149:334–347. doi: 10.1016/j.cell.2012.03.023. [DOI] [PMC free article] [PubMed] [Google Scholar]
- Zhang L, Espagne E, de Muyt A, Zickler D, Kleckner NE. Interference-mediated synaptonemal complex formation with embedded crossover designation. Proc Natl Acad Sci U S A. 2014;111:E5059–5068. doi: 10.1073/pnas.1416411111. [DOI] [PMC free article] [PubMed] [Google Scholar]
Associated Data
This section collects any data citations, data availability statements, or supplementary materials included in this article.
Supplementary Materials
Recombination at 59.5 in BxD F1 hybrid sperm.
Top panel: Cumulative fraction of COs in both orientations: B to D (squares) and D to B (circles); vertical lines represent the midpoint for each orientation. Note that the distributions of each orientation are offset from each other, a hallmark of reciprocal CO asymmetry. Reciprocal CO asymmetry is due to DSBs forming preferentially on only one of the two homologs, here the B homolog. Owing to CO-dependent gene conversion, COs in the recipient to donor orientation (B to D) cluster to the left and COs in the donor to recipient orientation (D to B) cluster to the right of the hotspot center (schematic above). As such, the distance between midpoints is an estimate of the mean CO gene conversion tract length (548bp).
Middle panel: CO breakpoint maps in the B to D (top) and D to B (bottom) orientations.
Tickmarks represent polymorphisms tested. N=5 each.
Bottom panel: histogram of NCO distribution. Consistent with reciprocal CO asymmetry, ~3-fold more NCOs are found on chromosome B vs. D. Tickmarks as above. B chromosome, N = 5; D chromosome, N = 4.
RPA2 foci dynamics in adult and juvenile mouse spermatocytes with and without MLH3.
Top panel, representative images and quantification of RPA2 foci for each experimental group and stage. Scale bar = 10μm.
Bottom panel, quantification for each experimental group (N=2; except Mlh3−/− Adult and 1st round N=3). Z, zygonema, P, pachynema. Mean ± SD: Adult Mlh3+/+ Z 277 ± 71, Adult Mlh3+/+ P 163 ± 54, Adult Mlh3−/− Z 207 ± 59, Adult Mlh3−/− P 152 ± 51, 1st round Mlh3+/+ Z 187 ± 58, 1st round Mlh3+/+ P 98 ± 55, 1st round Mlh3−/− Z 217 ± 71, 1st round Mlh3−/− P 117 ± 52, 3rd round Mlh3+/+ P 144 ± 58, 3rd round Mlh3−/− P 144 ± 57. Some data are reproduced from Figures 1, 2, and 3. P values, Kruskal-Wallis test followed by Dunn’s correction, black bars are mean ± SD.
Distribution of RPA2 foci in adult and juvenile mouse spermatocytes with and without MLH3.
Histograms displaying binned RPA2 foci data (25 foci/bin) of nuclei for each age and genotype.
No alterations in the frequency or distribution of noncrossovers at the A3 hotspot in juveniles or adults or with and without.
(A) Top, histogram of singleton NCO frequencies at specific polymorphisms (ntot) at each genotype and round of spermatogenesis (Mlh3+/− adult N=2, Mlh3+/+ or +/− 1st round N=3, Mlh3−/− adults N=3, Mlh3−/− 1st round N=1).
Bottom, plots of representative NCOs (nplot). Here and elsewhere unless noted, the number of nplot shown and corresponding length of the plotted maps is proportional to the alterations in NCO frequencies among experimental groups.
Tickmarks represent SNPs tested.
(B) Frequency and distribution of co-converted NCOs were unaltered between spermatocytes with or without MLH3 (compare A with B). Mean average tract lengths ± SD are indicated.
All noncrossovers detected at 59.5.
Top panel: All NCOs detected in Mlh3+/− spermatocytes from the indicated rounds of spermatogenesis. The number in smaller point size to the left of each NCO category denotes the number of NCOs detected at this position; ntot = total number of NCOs detected.
Middle panel: All singleton NCOs in Mlh3−/− spermatocytes from the indicated rounds of spermatogenesis.
Bottom panel: All co-conversions detected in Mlh3−/− mice from the indicated rounds of spermatogenesis.
Most long noncrossovers do not contain retained heteroduplex DNA.
Top, depiction of expected outcomes from different NCO configurations after cloning and and probing with specific polymorphisms (poly).
Bottom, analysis of 13 cloned long NCOs. 11 were consistent with single, continuous molecules with patterns described in A (single co-conversion). Two clones (designated with *) appeared to represent two independent molecules. Two independent clones could mean that either two independent NCO events were detected in one well (B, top), or that these represent retained heteroduplex (C, top), which after PCR amplification appears as two independent recombinants. In both cases, a different pattern of D-positive colonies was observed for neighboring polymorphisms. Retained heteroduplex is more likely because the number of wells estimated to contain two independent, co-converted NCOs was well below that observed here (0.28). In some cases, after several rounds of probing and stripping we were unable to confirm a signal for some polymorphisms, which are indicated with a gray box for untested SNP.
None of the long noncrossovers are observed at 59.5 on the D chromosome.
Plots of all NCOs isolated from the D chromosome in the indicated genotypes. No co-converted NCOs were recovered, regardless of the genotype, or round of spermatogenesis from more than 25,000 haploid genomes (Mlh3+/− adults N=1, Mlh3+/− 1st round N=1, Mlh3−/− adults N=2, Mlh3−/− 1st round N=3). Assuming a similar percentage of co-conversions among all NCOs, as observed on the B chromosome in spermatocytes from Mlh3−/− adults (~13%), we would expect 9–10 co-converted NCOs in Mlh−/− animals.
Table S1. Related to STAR Methods. Allele-specific primers (ASP), used for PCR amplifying 59.5.
Nucleotides in red indicate polymorphic sites between B and D.
Table S2. Related to STAR Methods. Allele-specific oligos (ASO), used for genotyping 59.5.
Nucleotides in red indicate polymorphic sites between B and D.
Table S3. Related to STAR Methods. Allele-specific primers (ASP), used for PCR amplifying A3.
Nucleotides in red indicate polymorphic sites between B and D.
Table S4. Related to STAR Methods. Allele-specific oligos (ASO), used for genotyping A3.
Nucleotides in red indicate polymorphic sites between B and D.