Abstract
Morphological design and the relationship between form and function have great influence on the functionality of a biological organ. However, the simultaneous investigation of morphological diversity and function is difficult in complex natural systems. We have developed a multiobjective optimization (MOO) approach in association with cluster analysis to study the form-function relation in vocal folds. An evolutionary algorithm (NSGA-II) was used to integrate MOO with an existing finite element model of the laryngeal sound source. Vocal fold morphology parameters served as decision variables and acoustic requirements (fundamental frequency, sound pressure level) as objective functions. A two-layer and a three-layer vocal fold configuration were explored to produce the targeted acoustic requirements. The mutation and crossover parameters of the NSGA-II algorithm were chosen to maximize a hypervolume indicator. The results were expressed using cluster analysis and were validated against a brute force method. Results from the MOO and the brute force approaches were comparable. The MOO approach demonstrated greater resolution in the exploration of the morphological space. In association with cluster analysis, MOO can efficiently explore vocal fold functional morphology.
Index Terms: Multiobjective optimization, myo-elastic-aerodynamic theory of voice production, source-filter theory, vocal fold functional morphology, voice physiology
I. INTRODUCTION
Functional morphology investigates the relationship between anatomical form and behavior. In biology, innovation in design and the form-function relationship have great influence on the evolution of diversity in systems [1]. In medicine, the repair of a damaged mechanical structure and the form-function relationship impact the performance of the organ after recovery. Investigating morphological diversity and function simultaneously is especially difficult in complex systems, but computational simulations can provide new insights. Here, we used multiobjective optimization (MOO) [2] pp. 227–298] to investigate morphological variety and vocal function of vocal folds. Associating MOO with cluster analysis provides a new approach to evaluate trends generated by the utilized evolutionary algorithms.
Vocalization for singing and speaking is a highly complex behavior, intimately related to the process of energy conversion. The vocal fold oscillation rate determines the sound fundamental frequency (Fo), and their oscillation amplitude contributes to the sound amplitude (“sound pressure level,” SPL). Generating sound by vocal fold oscillations is complex (see Fig. 1): (a) lung pressure must be generated, (b) vocal fold mechanical properties determine their oscillation behavior, (c) neuromechanical properties of involved muscles determine active movements of larynx and vocal tract. The high dimensionality of the vocal system makes predictions of effects on voice quality generated by perturbations at a single point in the system very difficult.
Fig. 1.
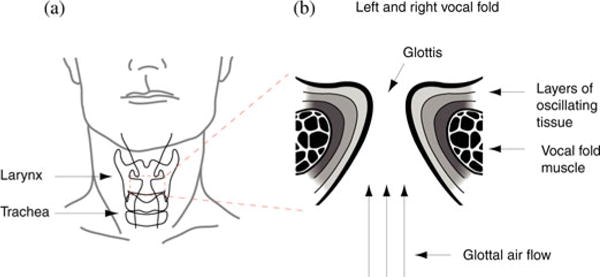
Vocal organ, the larynx, of humans. (a) The larynx is positioned in the upper neck area. It consists of a framework of cartilages, ligaments, and muscles. Inside the larynx are two vocal folds positioned. (b) Schematic of the enlarged left and right vocal folds. Active movements of larynx muscles narrow the space between the vocal folds (“glottis”) before voice is produced. Aerodynamic forces set vocal folds into self-sustained oscillations during expiration. The morphology of the vocal folds determines their oscillation behavior. Vocal folds in humans and many other mammals are multilayer structures. A deep layer (also called “body”) is the thyroarytenoid muscle. Three layers of connective tissue (“lamina propria”) and a layer of epithelium represent the tissue that is exposed to and interacting with the air flow (three arrows indicate air flow direction).
Voice simulation used in this study was based on control in two domains: 1) flow-induced oscillation of collapsible tissue walls to produce sound, and 2) propagation of sound in airways [3] pp. 80–135]. Finite-element and finite-difference approaches are used to solve differential equations [4], that govern air and tissue movement. Similar approaches have been taken by others [5]–[11]. We utilize a modified Bernoulli flow calculation coupled with a few hundred finite elements for tissue vibration, striking a balance between a sufficient number of iterations (for accuracy and stability) and computation time.
The voice simulator and MOO are integrated by an evolutionary algorithm, the nondominated sorting genetic algorithm II (NSGA-II) [12]. The algorithm searches for optimal solutions that are diverse and globally distributed. It produces multiple generations of populations that contain alternative nondominated solutions. The MOO is more efficient than a brute-force search that explores space at a predefined resolution. The solutions are viable and characterized by different phenotypic features (here two acoustic parameters: , ). The solutions of each new generation are closer to the predefined target objectives. The use of evolutionary algorithms to study functional vocal fold morphology has two advantages over other optimization techniques. First, multiple solutions are generated reflecting natural variation at the individual level. They also demonstrated that the vocal organ can facilitate very similar vocal features by multiple solutions. Second, for surgical repair, a compromise is sought between tissue reconstruction (targeting a predamage shape) and establishing a sufficient voice quality and long-term tissue survival.
II. Problem Definition
The goal of this study was to develop a tool for obtaining alternate vocal fold morphological solutions that allow voice production within targeted ranges of voice features based on an evolutionary algorithm. The MOO technique operates with vocal fold morphology parameters as decision variables, and with voice acoustic requirements as objective functions. Constraints can be imposed on both, morphology and acoustic requirements. We developed a computational mapping procedure that delivers 20 alternative solutions per population. Each solution is viable, i.e., a sustained voice is produced. The algorithm is run for 500 generations, producing 10 000 solutions. Each new generation contains solutions that are closer to the target morphology than those from the previous generation.
Section III first outlines the voice simulator. Then, the evolutionary algorithm is explained, and finally details of the integration of the voice simulator with the evolutionary algorithm are presented.
III. Methods
A. Voice Simulator—A Vocal Fold Finite Element Model
Vocal fold dynamics includes fast and small amplitude oscillatory movements in which various layers of the vocal fold are vibrating. The implementation of vocal fold morphology is outlined in Fig. 2. Soft tissue of the vibrating portion of each vocal fold was divided into triangular elements in the coronal plane and into rectangular layers in the ventro-dorsal direction (along the length of the vocal folds) as shown in Fig. 2(c) and (d). The number of elements was chosen to capture two principal modes of oscillation [13], [14]. These modes are based on approximate half-wavelength standing waves in the dorso-ventral direction and half-wavelength standing waves in the caudo-cranial direction on the vocal fold surfaces. We used 12 elements in the caudo-cranial direction, which would be 24 elements per wavelength. In the dorso-ventral direction, the number of elements was 10.
Fig. 2.
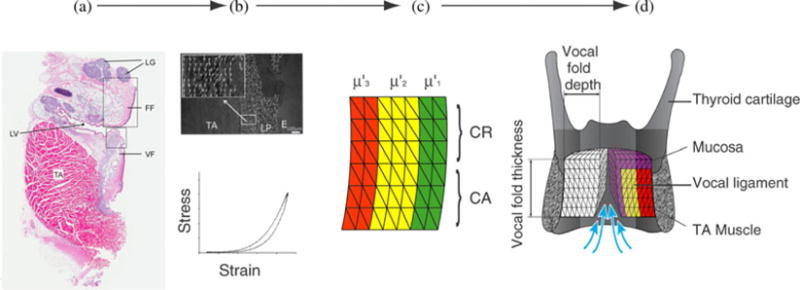
Compartmentalization of the vocal fold and implementation in a finite element model. (a) Differentially stained thin serial coronal sections are used to collect information about collagen and elastin content, fiber orientation, and hyaluronic acid content (e.g., [31], [35], [40], [41]). (b) The collagen fiber orientation is further investigated with greater detail using polarized light [36] (white arrows indicate collagen fibers). Mechanical tests are used to determine viscous and tensile strength of various compartments of the vocal fold [31], [35], [36]. (c) The vocal fold is discretized into compartments (superficial, intermediate, and deep, indicated here by three different colors; as well as upper, CR and lower, CA). A compartment is defined as a morphologically homogeneous portion of the vocal fold. It must not be smaller than what a surgeon can operate on (i.e., locate, manipulate, inject graft), but should be represented by enough finite elements to satisfy mesh requirements. Compartments are also created from anterior to posterior (not shown). Each compartment is characterized by geometry, fiber stress in the superficial , the intermediate , and deep layer .(d) Finally, the vocal fold structure is embedded into the laryngeal framework [13]. LV laryngeal ventricle; VF vocal fold; FF false fold; TA thyroarytenoid muscle; LG laryngeal glands; LP lamina propria; , , —shear modulus of respective layers.
Mammalian vocal folds consist of several layers of tissue [see Fig. 2(c)] each characterized by specific biomechanical properties. The current simulation investigated a vocal fold with two layers and a vocal fold with three layers. In the three layer vocal fold, the outermost layer is the mucosa. Underneath is the vocal ligament consisting of extracellular matrices of collagen and elastin proteins. All layers contain glycosaminoglycans like hyaluronan. Lateral to the lamina propria is a muscle (musculus thyroarytenoideus) which demonstrates passive and active stress response characteristics. In our model, the material is considered isotropic in a plane transverse to the dorso-ventral fiber direction. In essence, the tissue is an orthotropic fiber-gel compound.
Tissue vibration is solved with the planar viscoelastic equation of motion [13] p. 178],
| (1) |
where x and z are space variables in the coronal plane, ξ and ζ are the corresponding displacements in the x and z direction, μ is the shear modulus in the coronal place, ν is the Poisson ratio, and μ′ is the shear modulus in any plane perpendicular to the coronal plane. The variable μ′ contains the tension in the tissue fibers that are imposed by moveable boundary conditions. Incompressibility of the tissue transverse to the fibers at sonic frequencies is expressed by the relation
| (2) |
and the planar Poisson ratio ν is taken to be as close to 1.0 as numerically feasible. The tissue density ρ is 1.04 g/cm3. This leaves only two elastic variables, μ and μ′, to be selected as control variables. By far the dominant one of these is μ′ for frequency of oscillation. μ′ describes the tension in the tissue fibers, and tension in the tissue fibers is the primary restoring force and largely determines F0 [43]. Hence, we chose μ′ for parameter variation. Amplitude of oscillation is controlled primarily by lung pressure. The constitutive equation for the fiber-gel substance is embedded in (1), defined by the shear elastic moduli and the poisson ratio. FEM solution includes a shear viscosity η.
There are six boundaries for the vibrating portion of each vocal fold. Tissue fibers originate or insert into these boundaries laterally, ventrally, and dorsally. Tissue oscillation is constrained to be zero on these surfaces because the boundary movement is postural, not oscillatory [see Fig. 2(d)]. In the study reported here, all postural movements occur prior to phonation, not during phonation. Aerodynamic and acoustic pressures apply cranially, caudally, and medially, and tissue vibration is unconstrained. The boundary conditions are formulated as displacements at the nodes of each finite element. Interpolation functions are derived to express displacements and velocities inside each element. More details on the implementation of the vocal system by finite element modeling can be found elsewhere (e.g., [13], [15], [16]).
The finite-element construct allows solution of the partial differential equations [13] pp. 214–231]. The most important boundary for driving pressures is the medial surface of the vocal folds, which is parameterized as
| (3) |
where y and z are space variables in the mid-sagittal (glottal) plane, ξ01 and ξ02 are lower and upper abduction from the y-z plane, T is vocal fold thickness (in the z direction), and ξb is a bulging parameter that gives curvature to the medial surface.
Oscillation of the vocal folds is self-sustained by airflow between the vocal folds. This airflow is computed by the equation
| (4) |
where
| (5) |
is the effective combined vocal tract area, made up of the subglottal area As and epiglottal area Ae. In the above, ad is the flow detachment area in the glottis, ke is a transglottal pressure coefficient (approximately 1.1), ρ is air density, c is sound velocity, is the subglottal incident pressure (steady plus acoustic), and is the supraglottal incident pressure (also steady plus acoustic). A wave reflection algorithm [13] pp. 319–334], [17], [18] is used to solve all the acoustic wave pressures in the vocal tract, which was modeled as uniform tube of 17.5 cm length and 2 cm diameter. Pressures in the glottis are solved with Bernoulli’s energy equation below flow detachment and with jet stream equations above flow detachment [13] pp. 270–279].
B. Optimization Algorithm
Given a set of decision variables x ∈ X, a generic multiobjective optimization problem is defined as maximizing or minimizing the objective functions F (x) ∈ Y, subject to the constraint information g (x) ≤ 0 and h (x) = 0. Here, X is the decision variable space, Y is the objective function space, which can be weighted according to objective priority function w (y) to determine the relevance of each objective function to the individual. The constraints determine the set of feasible solutions where g corresponds to inequality constraints and h corresponds to equality constraints.
There are several MOO techniques and their comparison studies available [12], [19]–[23]. A critical feature of MOO techniques is how they use constraints information [24]. The NSGA-II has been chosen for our purpose because of its elitist approach, low computational cost, handling of constraints, better spread of solutions, and better convergence to the true pareto-optimal front [12].
1) Nondominated Sorting Genetic Algorithm
The NSGA-II is a genetic algorithm that uses evolutionary strategies to generate populations of solutions in each generation. An arithmetic crossover and Gaussian mutation generate offspring population of individuals from parent population. Solutions are the optimal individuals that are the outcome of the optimization in each generation. The binary tournament selection method chooses individuals for next generation from a combined parent and offspring population. The NSGA-II algorithm uses nondominated sorting method [12] for sorting individuals into different non-domination levels and crowding distance method [25] to sort individuals within the same level. An individual dominates another individual if it is strictly better in at least one objective and no worse in all the other objectives. All individuals that are not dominated by any other individuals in the objective space form the first nondomination level called pareto front 1. The individuals that are dominated only by individuals in pareto front 1 form the pareto front 2 and so on. The step by step procedure of NSGA-II algorithm is provided in Fig. 3 as a flowchart.
Fig. 3.
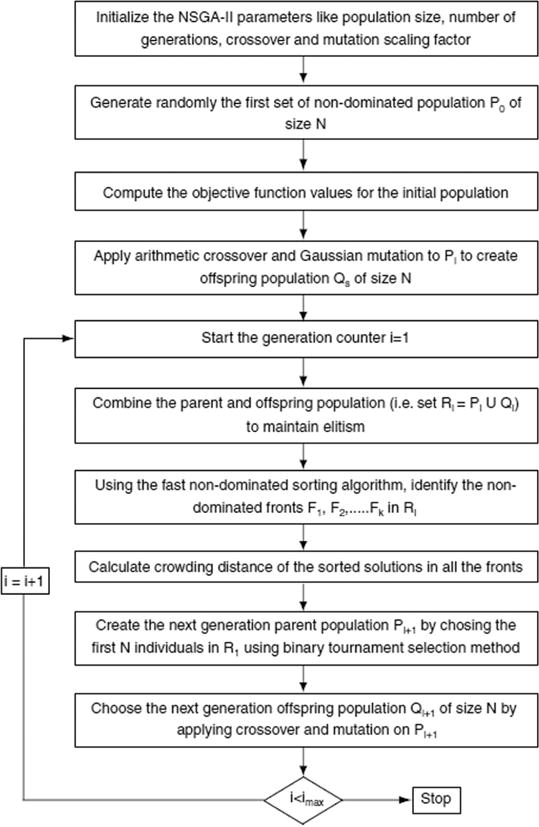
Flowchart of step-by-step procedure of NSGA-II algorithm.
2) Arithmetic Crossover Function
A crossover function generates two offsprings from two parent individuals [26]. The offsprings have the best characteristics of the two parent individuals. The arithmetic crossover function is given as
| (6) |
| (7) |
where P1 is parent 1, P2 is parent 2, O1 is offspring 1, O2 is offspring 2, r1 is a random number, and c is a scalar called crossover fraction. The crossover fraction controls the closeness of offsprings to the parents. A small number of c keeps the new solutions close to the old ones.
3) Gaussian Mutation
Mutation is used in optimization algorithms to maintain diversity in individuals from one generation to the next [27]. The Gaussian mutation function is given as
| (8) |
where O is the offspring, σ denotes standard deviation of the random number r2 generated, s is a scalar that decreases the mutation range as the optimization progress forward, Gi is the current generation number, Gm is the maximum number of generations, and bu and bl are the upper and lower bounds of the offspring, respectively.
4) Binary Tournament Selection
A binary tournament selects individuals for next generation. Individuals are chosen above others based on their pareto front number and crowding distance [28]. An individual with lower pareto front number is chosen if the two individuals are from different pareto fronts and the individual with larger crowding distance is chosen if the two individuals are from the same Pareto front. The crowding distance is computed on objective function values sorted in ascending order within the parent population. The crowding distance equation derived by Mehdipour [29] is given as
| (9) |
where is the crowding distance of jth individual, Ij in the sorted list, M is the number of objectives, fm is the mth objective function, j + 1 and j − 1 are the two nearest individuals on either side of the current individual in the sorted list, Min and Max are the minimum and maximum values of the objective function in the sorted list, respectively.
C. Applying the NSGA-II Algorithm to the Voice Simulator
One key morphology parameter of the vocal folds for fundamental frequency control μ′/μ was used as a decision variable. Acoustic output variables and were the objective functions. Restrictions on the morphology and acoustic variables were the constraints of the optimization algorithm. The acoustic priority weights were all set to 1. A single run of the finite element model to generate 0.4 s of voice signal requires about 11 s to complete. It took about 30 h to complete an optimization simulation with a population size of 20 and 500 generations, yielding 10 000 solutions.
1) Morphology Parameters
Vocal folds demonstrate a species-specific layer structure (e.g., [30], [31]). Each layer is characterized by length L, thickness T, depth D, bottom ξ01, and top ξ02 x-position, bulging B, viscosity η, longitudinal μ′, and transverse μ shear modulus.
In our current experiment, subglottal pressure and longitudinal shear moduli μ′ of each vocal fold layer were varied during optimization (see Table I). The current presentation focuses on longitudinal shear modulus because it is the single most important parameter affecting . The left and right vocal folds were considered symmetric. In vector form, the morphological parameters were written as
| (10) |
where PL is the subglottal pressure, is the longitudinal shear modulus of layer 1, is the longitudinal shear modulus of layer 2, and so on. Layers are concatenated as needed.
TABLE I.
Targets, Boundaries and Results of MOO and BF Methods
| Acoustic variables | Two layer VF | Three layer VF | |||||||||
|---|---|---|---|---|---|---|---|---|---|---|---|
| Target | Min | Max | X from opt | X from BF | Target | Min | Max | X from opt | X from BF | ||
| (Hz) | 80 | 50 | 110 | 93 | 97 | 130 | 90 | 170 | 135 | 156 | |
| (dB) | 110 | 90 | 130 | no | 110 | 70 | 50 | 90 | 78 | 81 | |
|
|
N/A | 0.05 | 20 | 0.8
0.85 |
0.94
1.24 |
N/A | 0.05 | 20 | 0.85
0.85 |
0.95
1.05 |
|
|
|
N/A | N/A | N/A | N/A | N/A | N/A | 0.05 | 20 | 0.65
0.7 |
0.8
0.8 |
|
MOO was tested on two vocal fold designs. A two-layer vocal fold is based on morphological and mechanical data collected from tiger larynges and vocal folds [37], [31]. The three-layer vocal fold is based on human data from various sources [16]. The table lists two variables in the objective domain ( , ) and two translayer ratios of longitudinal shear modulus of different layers ( and ) implemented in the finite element model. VF-vocal fold, opt-NSGA-II optimization, BF-brute force, X-centroid of the highest density cluster for optimization and brute force method, respectively, and for ( ) and ( ), respectively.
2) Acoustic Requirements
Several acoustic parameters can be measured for simulated voice production. Investigators in human speech and voice research have established norms for mean fundamental frequency and mean sound pressure level ( ). Similar data exist for some animals. Acoustic requirements alter with species, gender, age, etc. In vector form, the acoustic requirements considered here are given as a dot product
| (11) |
where W is a priority vector that gives a weight to each acoustic parameter. Weights can range between 0 (assigning lowest importance to an acoustic parameter) and 1 (highest importance) such that the sum of all the weights will be equal to 1. In this study, W for both parameters was considered to be 1.
3) Constraints
Restrictions are imposed on both morphological and acoustic variables. These restrictions set ranges of each variable based on published values (see Table I). Constraints are also set on the ratio of transverse to longitudinal shear modulus μ′/μ of each layer. These restrictions will guide the optimization of morphological parameters in achieving the desired acoustic requirements.
D. Presentation of Results and Performance Assessment
The MOO algorithm was programmed to generate a population of 20 solutions in each generation. It is customary in studies using MOO techniques to present the solutions of the last generation, given that they are closest to the true pareto front among all generations. However, our concern is to explore the relationship between the morphology and the acoustic space. Hence, we chose to present all the individual solutions that were generated by the crossover and mutation algorithms during the optimization rather than just the optimal solutions of the final generation. This has the advantage of exploring the parameter space for viable solutions, similar to a brute force approach with random parameter variations. However, greater resolution and more rapid convergence are expected with predefined target morphology and acoustic spaces.
The performance of the NSGA-II algorithm is measured across generations as it gives an indication of how many generations are needed for the algorithm to converge to the true pareto front and the optimal mutation and crossover parameters needed [32]. The performance of the NSGA-II algorithm across generations has been measured using hypervolume indicator [32].
1) Cluster Analysis
The objective is to obtain multiple alternate solutions of morphology parameters for the desired acoustic output. Hence, the results from the optimization were presented as clusters of solutions between decision and objective spaces. The optimization algorithm was altered to store the generated individuals and their corresponding acoustic outputs across all generations. The combinations of each of the morphology and acoustic spaces were then analyzed using cluster analysis. The clusters are computed using Gaussian mixture models (GMM), which were formed by combining multivariate normal density components [33]. An expectation maximization algorithm assigned posterior probabilities to each component density with respect to each observation. Clusters were formed by selecting the component that maximizes the posterior probability.
2) Hypervolume Indicator
A hypervolume indicator is a measure of space covered by solutions in the objective space [32]. It measures this space with respect to a reference point that is dominated by all points in the objective space. Considering minimization of objectives to be the goal of the optimization, the point containing the maximum value of each objective function will be a good reference since it will be dominated by any other point in the objective space. The hypervolume indicator can be measured on a single point or group of points. When a single point is considered, the hypervolume is the product of individual differences between the reference point and the point of interest (i.e., the volume of the hypercube between the point and the reference). When group of points is considered, the hypervolume is the union of all hypercubes between the reference point and the points in the group [25].
Here, we compute the hypervolume of each generation (i.e., group of 20 solutions) to see the progress of the NSGA-II algorithm across generations. The objective functions are normalized to their maximum values. So, the hypervolume will always lie between 0 and 1 with 1 corresponding to the best solution. If better solutions are obtained in each generation of the optimization, the hypervolume will increase across generations.
E. Validation of MOO Simulation Results
1) Sound Output Validation
In order to test whether a simulation generated a sustained voice signal, i.e., resulted in a successful voice simulation, each simulation was investigated for its periodicity over time. We used simple peak detection which detects periodicity in the time-domain envelope by measuring the period of the envelope peaks. A sufficient number of consecutively matching periods (limiting the range of frequencies that are acceptable for a periodicity from 30 to 400 Hz) are interpreted as the presence of a periodic voice signal. A standard deviation of the peak values less than 0.01 was used as selection criterion for a sustained voice signal. The measure proofed to be robust in a subsample of 500 simulations for which the outcome was visually confirmed in a spectrogram. is computed using standard autocorrelation method [34] and is computed as a pressure measured at 30 cm from the mouth with reference to a standard pressure of 20 μPa [3] p. 221].
2) Brute Force Search
An alternative way to explore the relationship between two spaces is through brute force search by systematically varying the parameters in the input space and finding the corresponding values in the output space. But, there are inherent issues with the brute force search. The computational cost increases steeply with the increase in resolution and the number of variables in the input (morphology) space. The computational cost of brute force search is O(KN), where N is the number of decision variables and K is the number of points per decision variable. For simplicity, we assumed an equal number of points for each decision variable. The computational cost of the NSGA-II algorithm is O (MG2), where M is the number of objective functions and G is the number of generations [12]. Only two variables were explored in this study, but in future studies, cases might require up to 100 morphological parameters to be varied simultaneously [indicated by the compartmentalization in Fig. 2(c)], which is not practical for a brute force approach but can be easily handled by the MOO as the number of generations will not increase dramatically with morphology parameters. Furthermore, the number of objectives will remain low. There is also no means to impose constraints on the output (acoustic) space, leading to exploration of regions of no interest. These problems can be overcome by using MOO techniques which only explores regions of interest set by constraints and the resolution in the morphology space is controlled by mutation and crossover functions. Hence, we used coarse brute force search only to validate our results from MOO simulations.
F. Two Case Studies—A Two-Layer and a Three-Layer Vocal Fold System
In order to test the applicability of MOO approach to optimize vocal fold morphology, we ran two test cases. Optimization was performed on fiber stress in a two layer and a three layer vocal fold system (see Table I). There are two reasons to use these two specific case studies. First, the number of layers represents an important distinctive feature in vocal fold design among mammals. Species-specific vocal fold design and vocal repertoire are linked [31], [35], [36], [40]. Second, the two-layer and the three-layer systems provide a contrast between human and tiger vocal fold design. Both have been studied in sufficient detail to facilitate the finite element model [30], [31], [37]. In this study, we implemented tiger data for the two layer vocal fold, and human data for the three layer vocal fold.
1) Parameters for Test Cases
The objective of the optimization was to produce of 130 Hz (three-layer vocal fold) and 80 Hz (2-layer vocal fold), respectively, of 70 dB (three-layer vocal fold) and 110 dB (two-layer vocal fold) at a distance of 30 cm from the lips, respectively. The two layer system has been referred to as a body-cover system and the three layer system represents mucosa, ligament, and muscle. Left–right symmetry was imposed. Each parameter has lower and upper bounds for their respective cases. The parameters and their bounds are listed in Table I. The objective function for the three-layer vocal fold is written in terms of quadratic error functions
| (12) |
likewise for two-layer case as
| (13) |
The two errors were minimized with equal acoustic priority. In the decision space, the subglottal pressure was varied between 0.01–2 kPa for three-layer vocal folds and 0.01–3 kPa for two-layer vocal fold system. The longitudinal shear modulus of each layer was varied between 5000 to 100 000dyn/cm2. There were no restrictions on the ratios of longitudinal shear modulus of different layers. The geometric parameters (L, T, D, B, ξ01, ξ02), the transverse shear modulus μ, and the viscosity η of the layers were kept constant at their nominal values throughout the optimization. The nominal values for (L, T, D, B, ξ01, ξ02, μ and η) for a three-layer system are (1.0 cm, 0.5 cm, 0.5 cm, 0, 0.01 cm, 0.01 cm, 5000 dyn/cm2, and 2 poise), respectively, and for a two-layer system are (4 cm, 5 cm, 3 cm, 0, 0.05 cm, 0.05 cm, 5000 dyn/cm2, and 3 poise), respectively. The vocal tract length of three-layer system is considered as 17.5 cm and for two-layer system as 40 cm.
2) Parameters for NSGA-II Algorithm
The NSGA-II multiobjective optimization algorithm was implemented in MATLAB. The optimal solutions and the individuals considered in each generation were stored for later analysis. The parameters of the NSGA-II algorithm that needed to be set are the number of generations, population size, crossover fraction, mutation scale, and shrink. The outcome of the optimization algorithm depended on the choice of these parameters. For a fixed population size and number of generations, we varied the crossover fraction (c), mutation scale (σ), and shrink (s) and ran the optimization on the three-layer vocal fold system. We considered eight combinations of these three parameters. The combination that gave the maximum Hyper-volume Indicator across generations was chosen as the optimal parameter set to run the optimization. The mean Hypervolume Indicator for every 50 generations of these eight combinations is shown in Fig. 4. The set H (σ − 0.5, s − 0.2, c − 1.2) generates larger Hypervolume across all generations whereas the set G (σ − 0.5, s − 0.2, c − 0.7) generates larger Hypervolume in the last 50 generations. Since we considered solutions from all generations for our analysis, we chose set H to be the optimal combination. These values are listed in Table II.
Fig. 4.
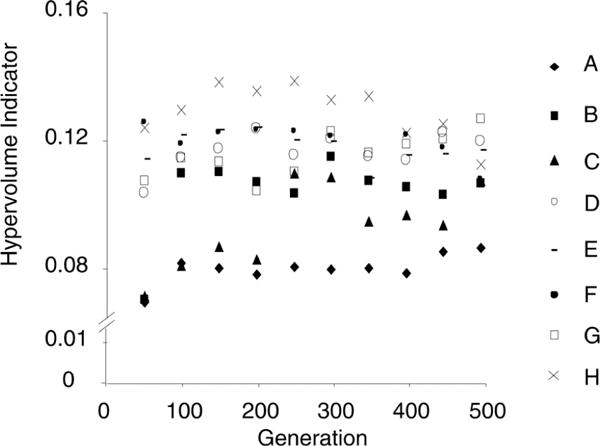
Hypervolume Indicator for eight combinations of mutation and crossover parameters on a three-layer vocal fold system. See (6) to (8) for details on these parameters. (A: σ = 0.1, s = 0.5, c = 0.7; B: σ = 0.1, s = 0.5, c = 1.2; C: σ = 0.1, s = 0.2, c = 0.7; D: σ = 0.1, s = 0.2, c = 1.2; E: σ = 0.5, s = 0.5, c = 0.7; F: σ = 0.5, s = 0.5, c = 1.2; G: σ = 0.5, s = 0.2, c = 0.7; H: σ = 0.5, s = 0.2, c = 1.2).
TABLE II.
Parameters of NSGA-II Algorithm
| NSGA-II (parameters) | values |
|---|---|
| Number of generations | 500 |
| Population size | 20 |
| Crossover Fraction | 1.2 |
| Mutation Scale | 0.5 |
| Mutation Shrink | 0.2 |
IV. Results
A. Two-Layer Vocal Fold
Fiber stress relations for a two layer system plotted against two acoustic variables are shown in Fig. 5(a) and (b). The density of solutions is illustrated by the contour lines in cluster maps [see Fig. 5(c) and (d)]. The acoustic priorities for the two layer system were low (80 Hz) and high (110 dB). Results show high density clusters for reaching between 90 and 100 Hz [see Fig. 5(c)] and for around 110 dB [Fig. 5(d)]. Both priorities are achieved with a translayer ratio near and below 1, suggesting that a homogenous system (both layers equal), or a system with a slightly stiffer superficial layer, helps to obtain the desired low and high requirements.
Fig. 5.
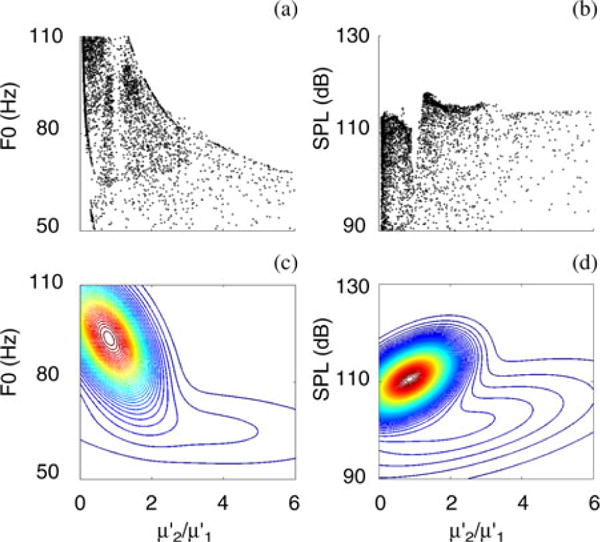
Solutions from 500 generations of NSGA-II for a two-layer vocal fold system. (a, b) Scatter plots of 10 000 solutions illustrating the relation between the translayer ratio and and , respectively. (c, d) Cluster maps generated by Gaussian mixture models are based on the 10 000 solutions.
Results demonstrated also that viable solutions are not limited to a single cluster [high density cluster in Fig. 5(c)]. For both and , there are second clusters of lower density. The respective values for and , are lower, and the associated translayer fiber tension ratio is increased.
The results from the optimization were validated against results from the brute force search [see Fig. 6(a)–(d)]. In the brute force search, the parameters in the morphological space are varied systematically without MOO convergence criteria and the corresponding values in the acoustic space are measured. The subglottal pressure PL is varied from 0.01 to 3 kPa in increments of 0.1 kPa and the longitudinal shear modulus is varied from 5000 to 100 000 dyn/cm2 in increments of 5000 dyn/cm2. The density resolution is lower in the brute force approach [compare Fig. 5(a) and 6(a), or 5(b) and 6(b)]. Like in the optimization approach, two to three clusters were formed, associated with a shift in the location of the centroids of the clusters (see Table I). One implicit acoustic requirement imposed on both approaches is self-sustained oscillation, which governs the overall range of solutions.
Fig. 6.
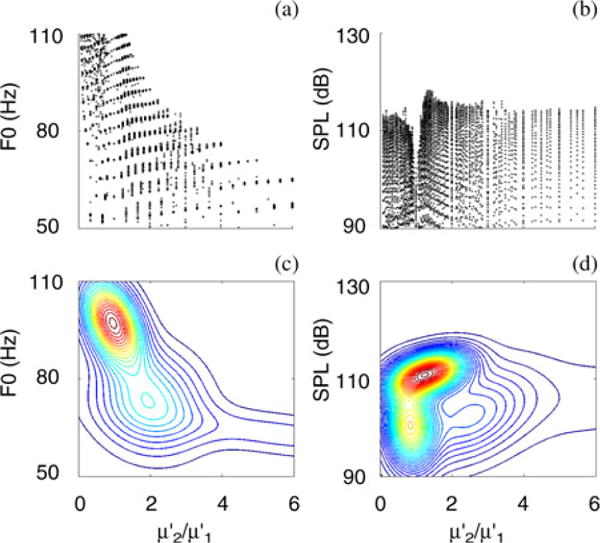
(a, b) Scatter plots of solutions generated by brute force approach illustrating the relation between the translayer ratio and two acoustic variables. (c,d) Cluster maps generated by Gaussian mixture models based on brute force solutions.
B. Three-Layer Vocal Fold
For the three-layer system, we focus the graphic analysis on the translayer ratio ( ) because layers 1 and 2 are exposed and interacting with the passing air flow. The translayer ratio is again close to 1 for and (see Fig. 7(a) and (b); Table I). This indicates that, like in the two layer system, the tissue is almost homogenous if the vocal fold is optimized for low . High [see Fig. 7(b)] is also achieved if layer 2 is as or less stiff than layer 1.
Fig. 7.
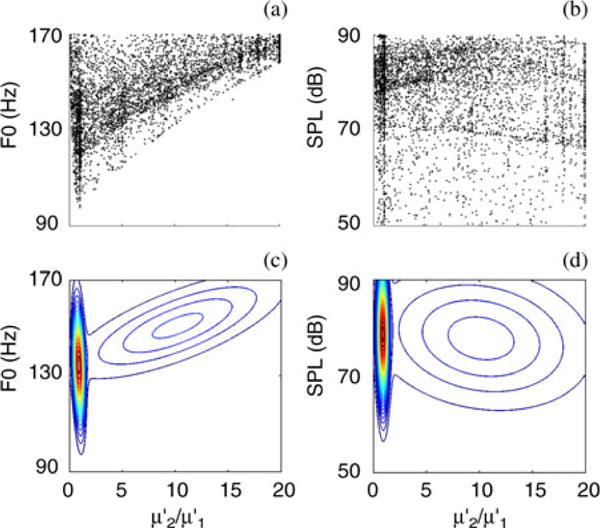
Exploring the relation between translayer ratio and and for a three layer vocal fold based on solutions from 500 generations of NSGA-II algorithm. (a, b) Scatter plots of , across . (c, d) Cluster plots of , across .
Brute force results are shown in Fig. 8(a–d). Subglottal pressure (PL) was varied from 0.01 to 2 kPa in increments of 0.1 kPa. Longitudinal shear modulus of the three layers was varied from 5000 to 100 000 dyn/cm2 in increments of 7500 dyn/cm2. Exploring the entire morphological space by brute force took five times longer than the MOO approach. Most viable solutions cluster at translayer ratios of 1.
Fig. 8.
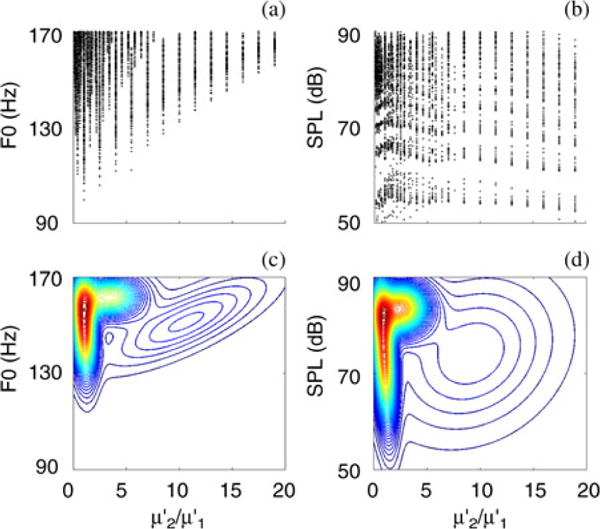
Exploring the relation between translayer ratio and and for a three layer vocal fold based on solutions from brute force search. (a, b) Scatter plots of , across . (c, d) Cluster plots of , across .
There is good agreement between the optimization and brute force search results as can be seen from Figs. 7 and 8. This indicates that MOO acts as an alternative to the brute force search, but is more efficient and faster in searching for a relationship between the targeted objective and decision spaces.
V. Discussion
The use of the MOO technique to explore simultaneously a decision space (morphology) and an objective space (acoustic variables) provided two important insights that will help in future explorations of functional morphology of vocal folds. First, MOO is superior to single objective optimization algorithms because it generates multiple alternate solutions in a single run. The combination of MOO with cluster analysis provides the power to evaluate solutions simultaneously in both decision and objective spaces. Because of the use of mutation to generate populations, a good solution tends to generate more good solutions around it, forming clusters. Second, since there is considerable overlap in solutions between MOO and brute force search, both methods recognize spaces that are viable for voice production. One important implicit criterion common to both approaches is that self-sustained oscillation must occur. This probably accounts for the similarities between solutions in the two approaches. The morphological parameter space that does not support sustained voice production will not show up in the results. The observation that cluster spaces for MOO solutions and for brute force solution overlap is therefore not surprising. The two approaches (MOO plus cluster analysis and brute force) generated similar results and were not too dramatically different in computation time. However, in the future, when we consider more than just two parameters, the faster computation time of the MOO approach will be apparent. Furthermore, resolution of MOO approach is higher, in particular near the optimal solutions. MOO will specifically explore the area around an optimal solution and ignore an area of inferior or no solution. In contrast, the brute force approach will explore each aspect of the morphology space with equal resolution.
A. Two Case Studies—A Low Pitched Voice is Well Generated With a Homogenous Vocal Fold
The interesting result here was that MOO suggests translayer ratios near and below 1 for both the two-layer and three-layer vocal fold. This corresponds with empirical data. First, the two layer system was modeled after the tiger vocal fold lamina propria which consists of two layers, a deep layer with relatively high fat content (not stiff), and a stiffer superficial layer with highly organized collagen fiber content [31], i.e., the translayer ratio ( ) is smaller than 1. In the three-layer vocal fold, which was modeled after a human vocal fold, mechanical properties for low vocalization also performs best with a translayer ratio close to 1. In other words, mucosa and ligament should be nearly homogenous. Low vocalization, as in speech, is easily produced when both mucosal and ligamental tissue is lax so that optimal energy transfer can occur from glottal airflow into the tissue [3]. For high-pitched productions (not investigated here), the results may be very different, however. The ligament must become very stiff (tense), which means that the translayer ratio for μ′ may be quite different from 1.0.
B. MOO to Study Functional Morphology
Traditionally, studies using MOO techniques present results only in the objective space, but rarely in the decision space. Obtaining optimal solutions in the objective space is the primary goal in such studies. In contrast, the problem investigated here was to better understand the relationship between the decision space and the objective space. The larynx as a vocal organ can naturally produce a large range of sounds, yet there are specializations facilitating species-specific vocal behavior [35], and there is large interest in predicting what small changes to the integrity of the vocal folds will do to the voice of a person [38], [39]. The cluster analysis helps to relate morphological to acoustic spaces. Weights provide the possibility to evaluate parameters in the decision space differently. For example, SPL might be most important for one condition tolerating tradeoffs in F0 (WSPL > WF0). In the simulations presented here, we assigned equal priority to both parameters (W = 1). In the future studies, it will also be interesting to explore tradeoffs between various acoustic features and vocal fold morphology, i.e., between objective and decision space.
Furthermore, current data confirm that more than one solution is possible. High density clusters were close to target variables ( and ). However, additional clusters indicated that with different acoustic priorities, different morphologies may be favored. For example, trends were seen that higher pitches were associated with a larger translayer ratio [see Fig. 7(c)]. The non-isotropic (fiber-gel) nature of the different layers within a human vocal fold would account for this shift in the translayer ratio.
The analysis of complex relationships between function and morphology is challenging in many fields of research [42]. The MOO approach in association with cluster analysis appears to provide a route to explore this relationship.
Acknowledgments
This work was supported by National Institute of Health under Grant NIH R01 DC008612.
Footnotes
Color versions of one or more of the figures in this paper are available online at http://ieeexplore.ieee.org.
Contributor Information
Anil Palaparthi, National Center for Voice and Speech, University of Utah, Salt Lake City, UT 84101, USA.
Tobias Riede, Department of Biology and National Center for Voice and Speech, University of Utah, Salt Lake City, UT 84112, USA.
Ingo R. Titze, Department of Communication Sciences and Disorders, University of Iowa, Iowa City, IA 52242, USA National Center for Voice and Speech, University of Utah, Salt Lake City, UT 84101, USA.
References
- 1.Wainwright PC. Functional versus morphological diversity in macroevolution. Annu Rev Ecol Evol Syst. 2007;38:381–401. [Google Scholar]
- 2.Deb K. Multi-Objective Optimization Using Evolutionary Algorithms. New York, NY, USA: Wiley; 2001. [Google Scholar]
- 3.Titze IR. Principles of Voice Production. Denver, CO, USA: National Center for Voice and Speech; 2000. [Google Scholar]
- 4.Alipour F, Berry D, Titze IR. A finite-element model of vocal-fold vibration. J Acoustic Soc Amer. 2000 Dec;108:3003–3012. doi: 10.1121/1.1324678. [DOI] [PubMed] [Google Scholar]
- 5.Tao C, Jiang JJ. Mechanical stress during phonation in a self-oscillating finite-element vocal fold model. J Biomechanics. 2007;40:2191–2198. doi: 10.1016/j.jbiomech.2006.10.030. [DOI] [PubMed] [Google Scholar]
- 6.Tao C, Jiang JJ. A self-oscillating biophysical computer model of the elongated vocal fold. Comput Biol Med. 2008 Nov;38:1211–1217. doi: 10.1016/j.compbiomed.2008.10.001. [DOI] [PMC free article] [PubMed] [Google Scholar]
- 7.Thomson SL, Mongeau L, Frankel SH. Aerodynamic transfer of energy to the vocal folds. J Acoust Soc Amer. 2005;118:1689–1700. doi: 10.1121/1.2000787. [DOI] [PubMed] [Google Scholar]
- 8.Berke G, Mendelsohn AH, Howard NS, Zhang Z. Neuromuscular induced phonation in a human ex vivo perfused larynx preparation. J Acoust Soc Amer. 2013;133:El114–EL117El117. doi: 10.1121/1.4776776. [DOI] [PMC free article] [PubMed] [Google Scholar]
- 9.Chhetri DK, Neubauer J, Berry DA. Neuromuscular control of fundamental frequency and glottal posture at phonation onset. J Acoust Soc Amer. 2012;131:1401–1412. doi: 10.1121/1.3672686. [DOI] [PMC free article] [PubMed] [Google Scholar]
- 10.Zheng X, Xue Q, Mittal R, Bielamowicz S. Coupled sharp-interface immersed-boundary finite element method for flow-structure interaction with application to human phonation. J Biomechanical Eng. 2010 Nov;132:111003. doi: 10.1115/1.4002587. [DOI] [PMC free article] [PubMed] [Google Scholar]
- 11.Cook DD, Nauman E, Mongeau L. Ranking vocal fold model parameters by their influence on model frequencies. J Acoust Soc Amer. 2009;126:2002–2010. doi: 10.1121/1.3183592. [DOI] [PMC free article] [PubMed] [Google Scholar]
- 12.Deb K, Agarwal S, Pratap A, Meyarivan T. A fast and elitist multiobjective genetic algorithm: NSGA-II. IEEE Trans Evol Comput. 2002;6(2):182–197. [Google Scholar]
- 13.Titze IR. The Myoelastic Aerodynamic Theory of Phonation. Salt Lake City, UT: National Center for Voice and Speech; 2006. [Google Scholar]
- 14.Titze IR, Strong W. Normal modes in vocal cord tissue. J Acoust Soc Amer. 1975;57:736–744. doi: 10.1121/1.380498. [DOI] [PubMed] [Google Scholar]
- 15.Alipour F, Berry D, Titze IR. A finite-element model of vocal-fold vibration. J Acoust Soc Amer. 2000;108:3003–3012. doi: 10.1121/1.1324678. [DOI] [PubMed] [Google Scholar]
- 16.Titze IR, Riede T. A cervid vocal fold model suggests greater glottal efficiency in calling at higher frequencies. PLoS Comput Biol. 2010;6(8):e1000897. doi: 10.1371/journal.pcbi.1000897. [DOI] [PMC free article] [PubMed] [Google Scholar]
- 17.Liljencrants J. Doctoral thesis. Dept of Speech Comm Music Acoust, Royal Inst Technol; Stockholm, Sweden: 1985. Speech synthesis with a reflection-type line analog. [Google Scholar]
- 18.Story B. PhD dissertation. Univ of Iowa; Iowa, IA, USA: 1995. Physiologically based speech simulation using an enhanced wave-reflection model of the vocal tract. [Google Scholar]
- 19.Cohon JL. Multiobjective Programming and Planning. New York, NY, USA: Academic; 1978. [Google Scholar]
- 20.Srinivas N, Deb K. Multi-objective function optimization using non-dominated sorting genetic algorithms. Evol Comput J. 1994;2(3):221–248. [Google Scholar]
- 21.Coello Coello CA. An updated survey of GA based multiobjective optimization techniques. Laboratorio Nacional de Informatica Avanzada (LANIA); Xalapa, Veracruz, Mexico, Tech Rep Lania-RD-98-08: 1998. [Google Scholar]
- 22.Zitzler E, Deb K, Thiele L. Comparison of multiobjective evolutionary algorithms: Empirical results. Evol Comput. 2000;8(2):173–195. doi: 10.1162/106365600568202. [DOI] [PubMed] [Google Scholar]
- 23.Chinchuluun A, Pardalos PM. A survey of recent developments in multiobjective optimization. Annu Oper Res. 2007;154:29–50. [Google Scholar]
- 24.Hwang CL, Masud ASM. Multiple Objectives Decision Making-Methods and Applications. Berlin, Germany: Springer; 1979. [Google Scholar]
- 25.Schrum J, Miikkulainen R. Evolving multimodel networks for multitask games. IEEE Trans Comput Intell AI Games. 2012 Jun;4(2):94–111. doi: 10.1109/TCIAIG.2015.2390615. [DOI] [PMC free article] [PubMed] [Google Scholar]
- 26.Ladkany GS, Trabia MB. A genetic algorithm with weighted average normally-distributed arithmetic crossover and twinkling. Appl Math. 2012;3(10):1220–1235. [Google Scholar]
- 27.Hinterding R. 2nd IEEE Conf Evol Comput. Piscataway, NJ, USA: IEEE Press; 1995. Gaussian mutation and self-adaptation in numeric genetic algorithms,” presented at the; pp. 384–389. [Google Scholar]
- 28.Miller BL, Goldberg DE. Genetic algorithms, tournament selection, and the effects of noise. Complex Syst. 1995;8(3):193–212. [Google Scholar]
- 29.Fallah-Mehdipour E, Haddad OB, Tabari MMR, Marino MA. Extraction of decision alternatives in construction management projects: Application and adaptation of NSGA-II and MOPSO. Expert Syst Appl. 2012;39(3):2794–2803. [Google Scholar]
- 30.Hirano M. Proc 78th Annu Convention Oto-Rhino-Laryngological Soc. Vol. 21. Japan: 1975. Phonosurgery: Basic and clinical investigations; pp. 239–440. [Google Scholar]
- 31.Klemuk SA, Riede T, Walsh EJ, Titze IR. Adapted to roar: Functional morphology of tiger and lion vocal folds. PLoS ONE. 2011;6(11):e27029. doi: 10.1371/journal.pone.0027029. [DOI] [PMC free article] [PubMed] [Google Scholar]
- 32.Zitzler E, Drockhoff D, Thiele L. The Hypervolume indicator revisited: On the design of pareto-compliant indicators via weighted integration. Proc 4th Int Conf Evolutionary Multi-Criterion Optimization. 2007:862–876. [Google Scholar]
- 33.He Y, Pan W, Lin J. Cluster analysis using multivariate normal mixture models to detect differential gene expression with microarray data. Comput Statist Data Anal. 2006;51:641–658. [Google Scholar]
- 34.Boersma P. Accurate short-term analysis of the fundamental frequency and the harmonics-to-noise ratio of a sampled sound. Proc Inst Phonetic Sci. 1993;17:97–110. [Google Scholar]
- 35.Riede T, Lingle S, Hunter EJ, Titze IR. Cervids with different vocal behavior demonstrate different viscoelastic properties of their vocal folds. J Morph. 2010;271:1–11. doi: 10.1002/jmor.10774. [DOI] [PMC free article] [PubMed] [Google Scholar]
- 36.Julias M, Riede T, Cook D. Visualizing collagen network within human and rhesus monkey vocal folds using polarized light microscopy. Annu Otolaryngol Rhinol Laryngol. 2013;122:135–144. doi: 10.1177/000348941312200210. [DOI] [PMC free article] [PubMed] [Google Scholar]
- 37.Titze IR, Fitch WT, Hunter EJ, Alipour F, Montequin D, Armstrong DL, McGee J, Walsh EJ. Vocal power and glottal efficiency in excised tiger larynges. J Exp Biol. 2010;213:3866–3873. doi: 10.1242/jeb.044982. [DOI] [PMC free article] [PubMed] [Google Scholar]
- 38.Mau T, Courey MS. Influence of gender and injection site on vocal fold augmentation. Otolaryngol Head Neck Surg. 2008;138:221–225. doi: 10.1016/j.otohns.2007.10.028. [DOI] [PubMed] [Google Scholar]
- 39.Mau T, Brewer JM, Gatzert ST, Courey MS. Three-dimensional conformation of the injected bolus in vocal fold injections in a cadaver model. Otolaryngol Head Neck Surg. 2011;144:552–557. doi: 10.1177/0194599810395107. [DOI] [PMC free article] [PubMed] [Google Scholar]
- 40.Riede T. Elasticity and stress relaxation of rhesus monkey (Macaca mulatta) vocal folds. J Exp Biol. 2010;213:2924–2932. doi: 10.1242/jeb.044404. [DOI] [PMC free article] [PubMed] [Google Scholar]
- 41.Alipour F, Titze IR. Elastic models of vocal fold tissues. J Acoust Soc Amer. 1991;90:1326–1331. doi: 10.1121/1.401924. [DOI] [PubMed] [Google Scholar]
- 42.Bock WJ, von Wahlert G. Adaptation and the form-function complex. Evolution. 1965;19:269–299. [Google Scholar]
- 43.Titze IR. Vocal fold mass is not a useful quantity for describing F0 in vocalization. J Speech Lang Hear Res. 2011;54:520–522. doi: 10.1044/1092-4388(2010/09-0284). [DOI] [PMC free article] [PubMed] [Google Scholar]


