Abstract
Background-subtracted fast-scan cyclic voltammetry (FSCV) has emerged as a powerful analytical technique for monitoring sub-second molecular fluctuations in live brain tissue. Despite increasing utilization of FSCV, efforts to improve the accuracy of quantification have been limited due to the complexity of the technique and the dynamic recording environment. It is clear that variable electrode performance renders calibration necessary for accurate quantification; however, the nature of in vivo measurements can make conventional post-calibration difficult, or even impossible. Analyte-specific voltammograms and scaling factors that are critical for quantification can shift or fluctuate in vivo. This is largely due to impedance changes, and the effects of impedance on these measurements have not been characterized. We have previously reported that the background current can be used to predict electrode-specific scaling factors in situ. In this work, we employ model circuits to investigate the impact of impedance on FSCV measurements. Additionally, we take another step toward in situ electrode calibration by using the oxidation potential of quinones on the electrode surface to accurately predict the oxidation potential for dopamine at any point in an electrochemical experiment, as both are dependent on impedance. The model, validated both in adrenal slice and live brain tissue, enables information encoded in the shape of the background voltammogram to determine electrochemical parameters that are critical for accurate quantification. This improves data interpretation and provides a significant next step toward more automated methods for in vivo data analysis.
Keywords: carbon-fiber microelectrode, electrochemical impedance spectroscopy, electrochemistry, calibration, in vivo
Table of Contents Graphic
1. Introduction
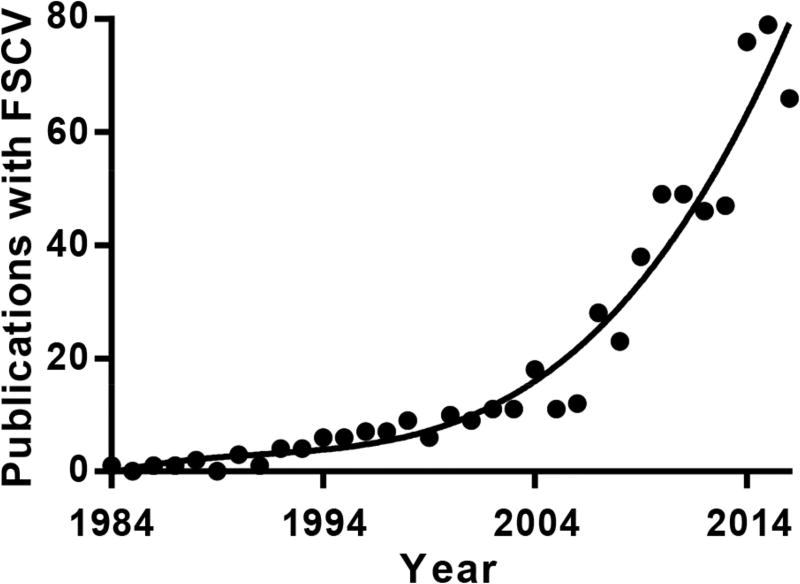
Background-subtracted fast-scan cyclic voltammetry employing carbon-fiber microelectrodes (CFME) is a powerful tool for making real-time, sub-second measurements of electroactive molecules in discrete brain regions.1,2 This approach originated with the work of Millar and colleagues,3,4 and has seen increasing use in the last decade (Figure 1) due to thorough characterization and technological improvements made largely by Wightman and colleagues.5–10 When combined with behavioral and pharmacological paradigms, it has provided remarkable information about the molecular mechanisms underlying specific aspects of goal-directed behavior and associative learning, significantly advancing this field.11–19 Despite this, broad acceptance by the neuroscience community has been hindered by remaining difficulties associated with its practice, such as reliable electrode calibration.
Figure 1.
The number of references in PubMed using ‘fast-scan cyclic voltammetry’ per year, since 1984.
Individual CFME performance is variable and dependent on physical characteristics inherent to the handmade electrodes and the recording microenvironment. As a result, electrode-specific calibration is required to accurately relate the observed current to analyte concentration. Traditionally, calibration is done in a flow-injection system following an experiment, as the electrode surface changes in response to tissue exposure and this alters electrode sensitivity.20,21 However, post-calibration assumes that the homogeneous buffered electrolyte solution used in vitro replicates the unknown, complex, and chemically dynamic environment of brain tissue. Traditional calibration schemes do not account for the involvement of spectator species, such as proteins, which can affect both working and reference electrodes in vivo. Also, traditional calibration assumes that electrode sensitivity is constant over the course of the experiment. These assumptions contradict fundamentals of analytical chemistry, which state that the calibration medium should resemble (as closely as possible) the environment in which the measurement was made,22 or calibration may result in significant misinterpretation of data. Additionally, univariate calibration fails when the signals from multiple analytes overlap, which is often the case for in vivo electrochemical data. Principal component analysis combined with inverse least-squares regression, also called principal component regression (PCR),23 is a multivariate calibration technique. When used with FSCV, training sets are composed of voltammograms for individual electroactive analytes to resolve chemical contributions to the signal, as well as calibration factors to estimate sensitivity and enable quantification.24,25,26 A more detailed description of the use of PCR with FSCV can be found elsewhere.27
PCR has been effectively employed in analysis of in vivo data for acutely implanted CFMEs.24,28 The relatively brief exposure to tissue minimizes the neuroimmunological response,29 and acutely implanted electrodes can be easily removed for post-calibration to obtain in vitro calibration factors as estimates of sensitivity in vivo. However, chronically implanted electrodes introduce a significant procedural constraint with respect to calibration, due to the duration of the implant (weeks to months),30 and difficulties in safely recovering the electrode for post-calibration. These constraints have led to use of ‘standard’ or ‘universal’ training sets, obtained from other electrodes, recording sessions, or subjects, to analyze in vivo data.31–33 Even when training sets are constructed from data collected in vitro using the electrode that was implanted in vivo, so called ‘matrix effects’ can lead to inconsistencies between the in vivo data and the data that comprise the training set (i.e. changes in the shape and position of peaks in the voltammogram).34 For these reasons, analytical chemistry textbooks conclude that standards used for calibration should be run in the same matrix as the unknown.22,35 Thus, when monitoring molecules in brain tissue a reliable and straightforward method for in situ electrode calibration is essential.
Recent work in our group has moved toward this goal by demonstrating that the total background current can be used as a predictor of electrode sensitivity to multiple analytes, in situ.21 Herein, we expand upon this work by exploring changes in electrochemical performance resulting from variable impedance. Electrode fouling is mimicked by the addition of impedance to the electrochemical system. The resulting shifts in sensitivity, and in the oxidation potentials of both quinone-like moieties on the carbon surface (Ep,QH) and of dopamine (Ep,DA), are characterized. Finally, an in vitro model that predicts Ep,DA based on Ep,QH is described and validated. This powerful tool will facilitate in situ determination of appropriate electrochemical parameters for accurate quantification. Additionally, the information within will be fundamental in the development of more automated data analysis methods.
2. Results and Discussion
Combining Fast-Scan Cyclic Voltammetry and Principal Component Regression
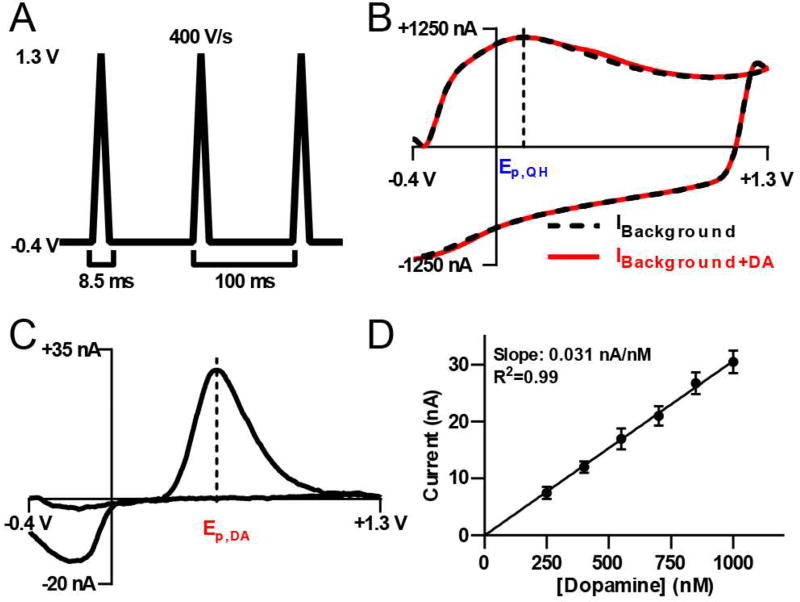
The detection of catecholamines using FSCV is commonly performed with a triangular waveform ramping from a −0.4 V holding potential to +1.3 V and back.1,2 Herein, this waveform (Figure 2A) is applied to a CFME with a scan rate of 400 V s−1, an application frequency of 10 Hz, and a sampling frequency of 200 kHz (except for data present in Figure 3 which were sampled at 100 kHz). When applied to a CFME, it generates a large but stable background signal composed predominately of nonfaradaic capacitive (charging) current,36 with smaller faradaic contributions from electroactive species that are statically present in the extracellular space1 and redox groups inherent to the electrode surface.37 When the concentration of an electroactive analyte fluctuates in the immediate vicinity of the electrode, the background current (Figure 2B, black dashed line) can be subtracted to reveal the faradaic current generated in response to the concentration change. The resulting voltammogram serves to identify the analyte and can also be used for quantification (Figure 2C). This effectively removes contributions to the current that result from processes inherent to the electrode, and from species that exist at relatively constant concentrations. The vertical dashed lines delineate the oxidation potentials of quinone-like surface functionalities and surface confined quinone species, (Ep,QH, Figure 2B),37–39 and the oxidation potential of dopamine (Ep,DA, Figure 2C). The current at Ep,DA (ordinate) can be plotted versus analyte concentration (abscissa) and the slope of a fitted regression line determines electrode sensitivity (Figure 2D).1,2
Figure 2.
Overview of fast-scan cyclic voltammetry. A) A triangular waveform from −0.4 V to +1.3 V is applied at 400 V/s and repeated at 10 Hz. B) Representative background (black) and dopamine (red) CVs. C) A representative background-subtracted CV for 1 µM dopamine. In both B) and C), potential and current are plotted as the abscissa and ordinate, with dashed lines indicating positions of Ep,QH and Ep,DA, respectively. D) A calibration curve for dopamine using a single CFME. Dopamine concentration and current at Ep,DA are plotted on the abscissa and ordinate, respectively. Data are presented as mean ± standard deviation (n=3 replicate injections).
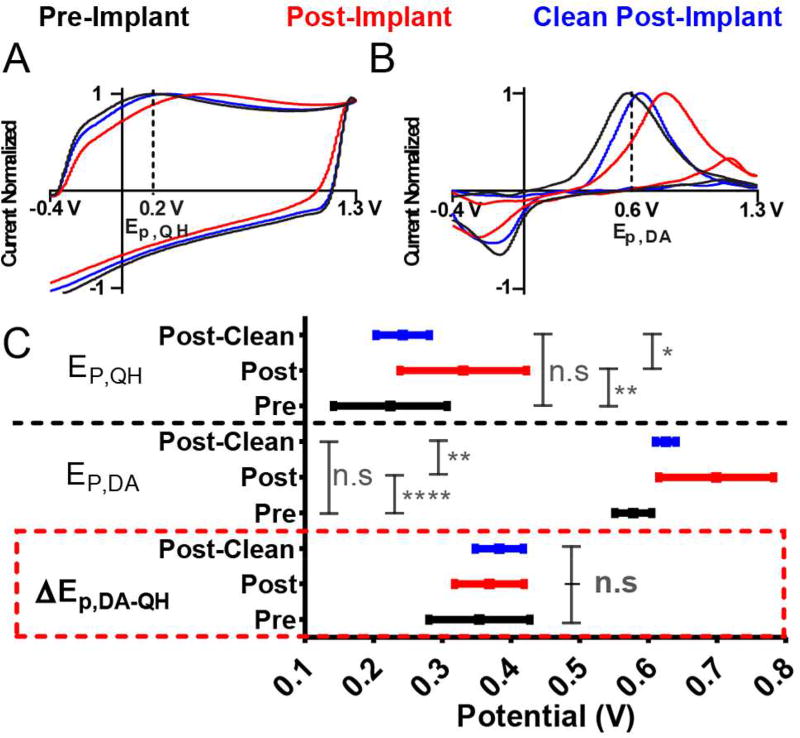
Figure 3.
The electrode surface influences oxidation potential. Normalized A) background CVs and B) background-subtracted dopamine CVs collected on an electrode: 1) before tissue implantation (black), 2) post-implantation (red) and 3) post-implantation and cleaning in IPA (blue). Potential and normalized current are plotted as the abscissa and ordinate, respectively. Dashed lines indicate nominal values of the oxidation potentials. C) Summary of Ep,QH (top), Ep,DA (middle), and ΔEp,DA-QH (bottom) as a function of the electrode state. Data represent mean ± standard deviation (n=12 electrodes). Significance was determined via a one-way ANOVA with Tukey’s post-test.
A comprehensive training set consists of voltammograms for all analytes expected to be present in the experimental data, with concentrations spanning the physiological range.27,34 Voltammetric signals collected in vivo are highly variable in terms of peak width, position, and relative intensity. Additional variation results from instrumentation, inherent differences in carbon-fiber preparations and surface structure,38,40 reference electrode performance,41 and differences in recording microenvironments. In fact, oxidation potentials can dynamically shift during an in vivo electrochemical experiment. When oxidation potentials are intentionally offset from those used in the training set, systematic misestimation of analyte concentrations and/or failures in residual analysis for model validation arise.27,34 Thus, training a model for PCR is not straightforward, and the selection of an inappropriate training set could result in unreliable assignment of analyte concentrations.27,34 Realization of this unresolved issue initiated investigation into how electrode surface states and recording microenvironments influence oxidation potentials.
The Carbon-Fiber Microelectrode Surface Influences Oxidation Potential
Conditioning of the CFME changes the chemical nature of the carbon surface,42 and as such is expected to influence analyte oxidation potentials. To verify this, three surface conditions were investigated using a flow-injection system. Dopamine was detected in a TRIS buffered saline 1) before implantation in the striatum of an anesthetized rat for 30 min, 2) after removal from the striatum, and 3) following post-implantation cleaning in isopropyl alcohol (IPA) overnight. Representative CVs are displayed in Figure 3A–B. Potential is plotted on the abscissa and normalized current (I/Ip) on the ordinate. The dashed lines indicate nominal values for the oxidation potentials, Ep,QH and Ep,DA. The difference between the two potentials (ΔEp,DA-QH) is displayed in Figure 3C. Data are presented as the mean ± standard deviation (n=12 electrodes). One-way ANOVA with Tukey’s post-hoc test was employed for multiple comparisons of Ep,QH, Ep,DA and ΔEp,DA-QH resulting from different electrode states. There was a significant effect of the surface state on Ep,QH and Ep,DA; F(2,33)=6.895, **p=0.0031; and F(2,33)=16.83, ****p<0.0001, respectively. A Tukey’s post-hoc test revealed that Ep,QH and Ep,DA are shifted to more positive potentials following implantation in striatal tissue. This is attributed to fouling of the electrode surface by adsorbed biological material. Cleaning the electrode in IPA reverses the effects of fouling, returning the oxidation potentials to approximately their original values, suggesting removal of adsorbed material. Perhaps the most interesting result is that ΔEp,DA-QH is conserved for each electrode condition; F(2,33)=0.8282, p>0.05. Thus, the oxidation potentials are similarly affected by changes to the electrode surface, suggesting that the position of Ep,QH could serve as a predictor for the position of Ep,DA. To investigate this, a series of circuits of varying impedance was used to controllably shift oxidation potential positions in vitro.
Model Circuits to Simulate Impedance Contributions Due to Electrode Fouling
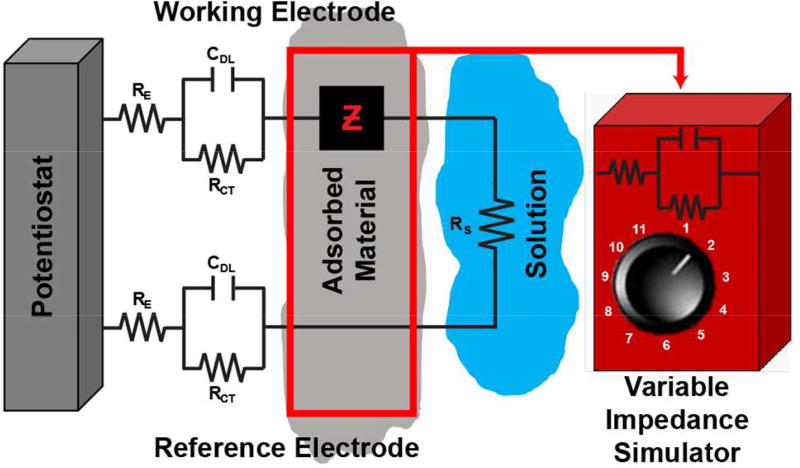
The non-specific adsorption of material to the electrode surface perturbs the electrochemical system. This can be treated as a change in impedance and modeled using equivalent circuits.36 Generally, an electrode-electrolyte interface can be modeled with a Randles equivalent circuit consisting of solution resistance (Rs) in series with both double-layer capacitance (CDL) and charge-transfer resistance (RCT); such that CDL is in parallel with RCT (Figure 4).36,43–45 Warburg impedance is a constant phase element that describes impedance due to diffusing redox species. It is observed at low frequencies (<100 Hz) not relevant to this work, so it is not included.46 The simplified circuit model represents a two-electrode electrochemical system in tissue. It consists of a potentiostat connected to two Randles equivalent circuits representing the working and reference electrodes (RE is the resistance inherent to the electrode). A variable impedance element is included to represent impedance contributions due to fouling (of both working and reference electrodes), and the system is completed by including solution resistance (Rs). Work characterizing the impedance properties of single carbon-fiber microelectrodes in vivo is minimal. However, fouling contributions to metal and silicon microelectrode impedance have been studied extensively using electrochemical impedance spectroscopy (EIS).47–51 These studies rely on the assumption that the electrode state does not change significantly over the duration of the experiment. However, impedance is expected to vary due to the dynamic nature of the tissue and slower changes in the microenvironment (inflammation, gliosis, etc.) that occur over the course of an extended electrode implant. The data presented in Figure 3C define the approximate range of Ep,QH and Ep,DA that must be achievable by controlling impedance.
Figure 4.
Equivalent circuit diagram depicting an in vivo electrochemical system. Both the working and reference electrodes are represented by Randles equivalent circuits with an impedance contribution due to adsorbed material (fouling) that is simulated by adding impedance (Z) between the potentiostat and working electrode.
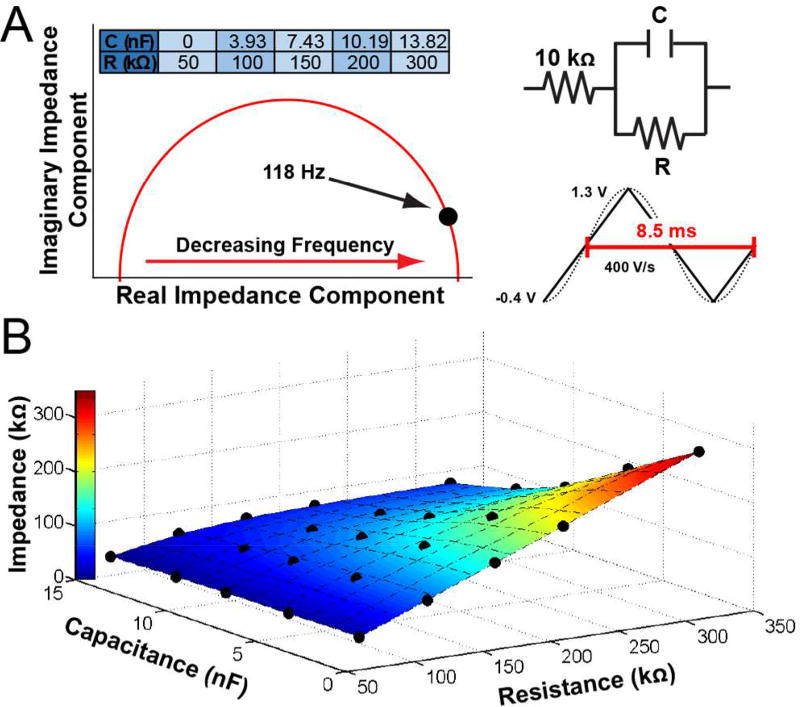
Figure 5A (inset) displays a schematic of the Randles circuit used to mimic shifts in impedance due to biological fouling, and a table of the values for resistance (R) and capacitance (C) used. These values represent a myriad of possible contributing factors such as bulk tissue resistance and tissue response to the implanted electrodes by way of matrix proteins, microglia, and astrocytes (the response is dynamic across the duration of the implant).47,49,52 Changes in capacitance can be attributed to microglia/astrocyte cell membrane capacitances as well as the adsorption of proteins (which affects surface area), and changes in extracellular ionic composition.47,49,50 A representative Nyquist plot resulting from an EIS simulation of a model Randles circuit is also shown (Figure 5A), in which the real and imaginary components of impedance are plotted on the abscissa and ordinate, respectively. Each point making up the Nyquist plot represents impedance due to different alternating current frequencies, decreasing from left to right. A standard voltammetric sweep is completed in ~8.5 msec when using common waveform parameters in FSCV (−0.4 V to 1.3 V applied at 400 V/sec). If this triangle were constantly repeated, the time of the applied triangular waveform (8.5 msec) could be thought of as the ‘period’ of the waveform, approximated by that of a sine wave of ~118 Hz (dotted line, Figure 5A inset). Thus, this frequency was sampled for a series of 27 circuits, including one with no added impedance, to study how impedance modulates the position of Ep,QH and Ep,DA. Figure 5B displays a contour plot describing the relationship between capacitance (x-axis), resistance (y-axis), and total impedance (z-axis) of the circuits at 118 Hz. Total impedance is also depicted in color. It is evident that impedance increases as resistance increases, and it decreases as capacitance increases. The effects of capacitance are much more evident at high versus low resistance. However, the plot clearly indicates that these relationships are not linear. Rather, there is a complex relationship that spans a range of impedance values.
Figure 5.
Impedance characterization of model Randles circuits. A) Representative Nyquist plot for a Randles circuit (top right), as well as a table of the resistance (R) and capacitance (C) values employed. Triangular and sine waveforms are overlaid (bottom right) to depict the period used in determining an appropriate impedance frequency (118 Hz). B) Total impedance at 118 Hz as a function of resistance and capacitance. Capacitance, resistance, and impedance are plotted on the x, y, and z axes, respectively; color also denotes impedance. Simulated data points are indicated by the black dots.
Employing Model Circuits to Investigate How Impedance Shifts Redox Potential
Following characterization, the circuits were coupled with CFMEs in either phosphate-buffered saline (PBS) or TRIS-buffered saline (TRIS). Both buffers are commonly used in electrochemical experiments at physiological pH; however, TRIS contains amines (present in many biomolecules) that competitively bind to the electrode,53 creating a situation that is thought to more closely resemble conditions in the brain. The model circuits were implemented between the potentiostat and the working electrode; the reference electrode was unaltered. Impedance is additive across the electrochemical cell. As such, altering the impedance of one electrode should serve to shift impedance of the entire circuit. Background CVs and background-subtracted dopamine CVs were used to determine Ep,QH and Ep,DA values. Triplicate standards were averaged across five electrodes for each impedance preparation in PBS and TRIS.
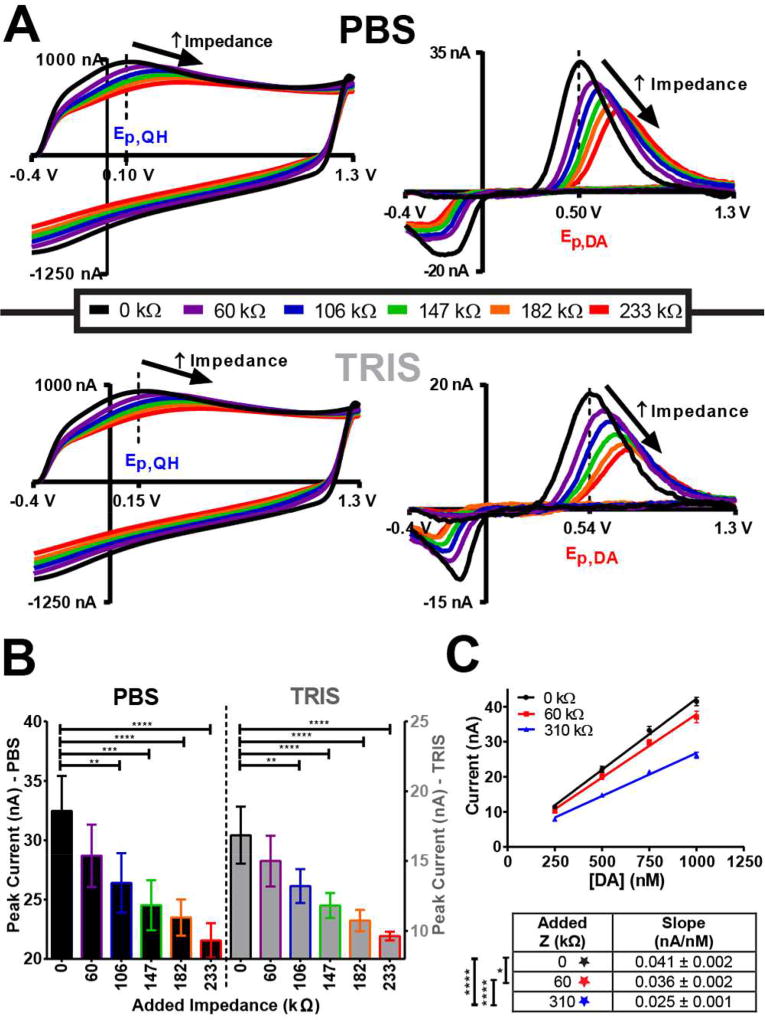
Figure 6A displays representative background CVs (left) and background-subtracted dopamine CVs (1 µM, right) for impedance preparations in which the total resistance was systematically increased (60, 110, 160, 210, 310 kΩ) while the capacitance was held constant (3.19 nF) in PBS (top) or TRIS (bottom) buffer. The black traces were collected with no added impedance (control), and simulated impedance values are described in the legend. The dashed lines indicate the mean potentials (n=5 electrodes) corresponding to Ep,QH and Ep,DA in the control circuit, with no impedance added. The data clearly demonstrate that adding impedance impacts the nature of the electrochemical system, as both Ep,QH and Ep,DA shift to more positive potentials as impedance is added. A positive shift in these oxidation potentials is also observed in the presence of TRIS, an amine that competitively binds to the electrode surface, as compared to PBS solution (with no impedance added: Ep,QH: t(4)=5.74, **p=0.0023 and Ep,DA: t(4)=3.675, *p=0.0107, one-tailed t-test, data not shown). Increased impedance also results in decreased current amplitude (Figure 6B, PBS: F(5,24)=15.05, ****p<0.0001; TRIS: F(5,24)=21.07, ****p<0.0001), as well as decreased electrode sensitivity (Figure 6C, F(2,30)=56.52, ****p<0.0001). Working in TRIS buffer also reduces the amplitude of the signal, but this is largely due to the presence of the amines that occupy dopamine adsorption sites on the sensor surface.53 Taken together, these data underscore the importance of improving calibration strategies, and the need for an accurate in situ approach.21
Figure 6.
Impedance impacts the nature of the electrochemical system. A) Representative background CVs (left) and background-subtracted dopamine CVs (1µM, right) resulting from systematic increases in impedance using the model circuits. Values in the legend are simulated impedance at 118 Hz for each circuit. In each case the capacitance was held constant (3.93 nF) and the resistance varied (60, 110, 160, 210, 310 kΩ). Data was collected in PBS (top) and TRIS (bottom). Mean values of Ep,QH and Ep,DA (n=5) for the preparation with no added impedance are indicated with dashed lines. B) Added impedance significantly decreases peak current (at Ep,DA) for dopamine oxidation when working in either PBS (left) or TRIS buffer (right). A one-way ANOVA with Tukey’s post-hoc test was used to compare each preparation with added impedance to that with no added impedance, for both PBS and TRIS (n=5). C) Sensitivity to dopamine is significantly decreased with additional impedance. Data was collected in PBS with no added impedance (black), 60 kΩ (red), and 310 kΩ (blue) of added impedance (n=3). A summary of the sensitivities is provided in the table. Slopes were compared via ANCOVA with Tukey post-hoc test. All data are presented as mean ± standard deviation.
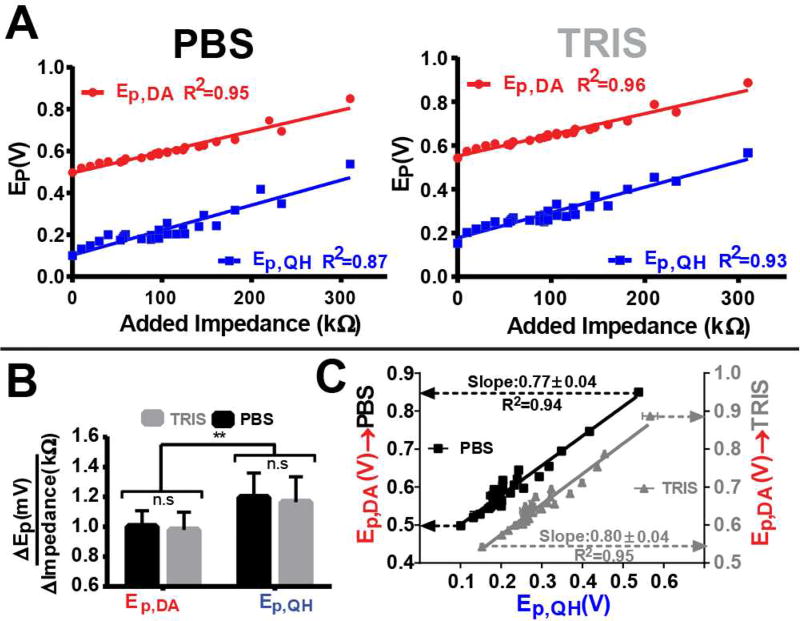
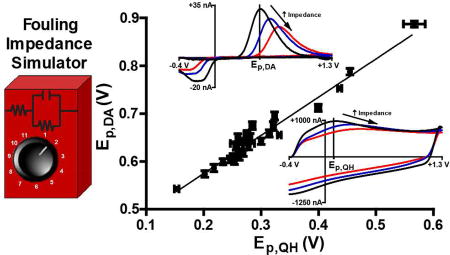
Figure 7A plots the position of Ep,QH (blue) and Ep,DA (red) as a function of added impedance in both PBS (left) and TRIS (right) buffers. At 118 Hz, it is apparent that this relationship is linear (R2≥0.87, n=5). Figure 7B compares the slopes of the regression lines fit to these data. Slope (mV/kΩ***) is plotted on the ordinate, with the various peak potentials identified on the abscissa; columns are color coordinated according to buffer. A two-way ANOVA determined that the source of variation in the slopes is due to the oxidation potential monitored, F(1,100)=9.034, **p=0.0033, and not due to the buffer, F(1,100)=0.2363, p>0.05. Thus, Ep,QH is modulated differently (per unit impedance) than Ep,DA. These results also demonstrate that the effects of impedance are consistent across these buffers. Figure 7C displays the relationship between Ep,QH (abscissa) and Ep,DA (ordinate) in both PBS (black) and TRIS (gray) buffers. Each point represents the mean (n=5) value for a given impedance preparation, with the lowest values (bottom left) collected with no added impedance and the highest values (top right) with 310 kΩ of added impedance. Ep,DA,PBS values are plotted on the left ordinate and Ep,DA,TRIS values on the right ordinate. The linear relationship demonstrates that Ep,QH can be used as a reliable predictor of Ep,DA. This is important, because it shows that this model can be used to identify training set parameters that are most likely to be appropriate for PCR and data analysis, and to thus improve interpretation of in vivo data. ANCOVA was used to compare regression models in both PBS and TRIS, and no differences were found (F(1,50)=0.154, p>0.05). The more physiologically relevant TRIS model was employed for further ex vivo validation.
Figure 7.
Establishing a relationship between Ep.QH and Ep,DA. A) Ep.QH (blue) and Ep,DA (red) as a function of added impedance (abscissa) in both PBS (left) and TRIS (right). B) Comparison of the slopes (mV/kΩ) of the regression model for both Ep,QH and Ep,DA as a function of added impedance in PBS (black) and TRIS (gray). Significance was determined via a two-way ANOVA. C) Plot of Ep,QH (abscissa) versus Ep,DA (ordinate) resulting from all impedance preparations in PBS (black, left ordinate) and TRIS (gray, right ordinate). ANCOVA was used to compare the two regression models. In all cases error bars represent the mean ± standard deviation (n=5).
Validation of the Impedance Model
Electrically evoked catecholamine (CA) release was detected in CA-depleted adrenal tissue slices as well as in the nucleus accumbens (NAc) of a freely moving animal to validate a predictive model for Ep,DA using Ep,QH. The adrenal medulla contains significant quantities of epinephrine and norepinephrine, and lower levels of dopamine, even when the animal has been treated with reserpine and α-MPT to decrease CA levels.54,55 The oxidation potentials of these CAs are indistinguishable from one another using the waveform employed and the resulting CVs are quite similar.40,56 Adrenal tissue provides an effective model for validation because it is significantly impeding, as evident by the fact that catecholamine CVs have Ep,QH and Ep,DA values higher than in the NAc (Figure 8A). This may be due to high levels of CA fouling the electrode via electopolymerization.57 Electrodes (n=5) were positioned in the medulla and allowed to cycle for 30–60 min prior to electrical stimulation every 5 min for 30 min. To further evaluate the model, electrically evoked catecholamine release was also detected at a CFME chronically implanted in the NAc over the course of three weeks. Background CVs and background-subtracted catecholamine CVs were used to determine Ep,QH and Ep,DA, respectively.
Figure 8.
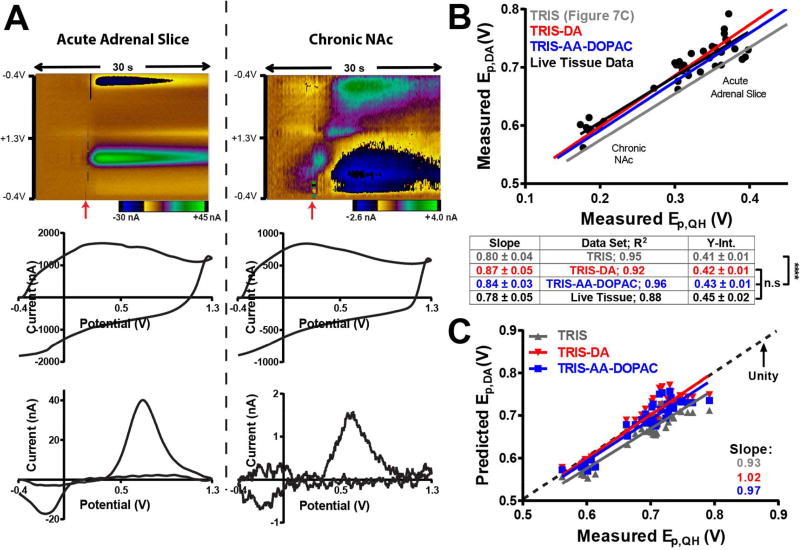
Model validation in live tissue. A) Representative color plots (top), background CVs (middle), and background-subtracted catecholamine CVs (bottom) collected in adrenal and brain (NAc) tissue. In the color plots, time is the ordinate, potential is the abscissa, and current is plotted in false color with the scale bar below the color plot. Time of electrical stimulation is denoted by red arrows. B) Measured values for Ep,QH and Ep,DA from individual electrical stimulations are plotted on the abscissa and ordinate, respectively. One group of data points was obtained from five CFMEs acutely implanted in adrenal tissue. The other group of data points was obtained over three weeks using a chronically implanted CFME. The four lines display the linear regressions for the TRIS (gray), TRIS-DA (red, n=3 electrodes), and TRIS-AA-DOPAC (blue, n=3 electrodes) models, and for the live tissue data (black). ANCOVA with Tukey’s post-hoc test was used to compare the slopes and intercepts of the regression models. A table summarizing the regression statistics is provided below. C) Measured Ep,DA (abscissa) and predicted Ep,DA (ordinate) obtained using Ep,QH in the TRIS (gray), TRIS-DA (red), and TRIS-AA-DOPAC (blue) models. The dashed line has a slope equal to unity.
Figure 8A displays representative color plots and CVs from the two tissue preparations. Figure 8B displays the relationship between the critical oxidation potentials for individual electrical stimulation events (black symbols) as they relate to the TRIS regression model (gray). Measured values for Ep,QH and Ep,DA are plotted on the abscissa and ordinate, respectively (black). It is apparent that the relationship between Ep,QH and Ep,DA approximates the relationship established in vitro, confirming that the range of impedances used to create the model was appropriate. The individual data points should be normally distributed about the regression model; however, the tissue data is offset from the regression line. In tissue, ongoing background redox processes are present that are not accounted for in the flow-cell. To investigate the role of background redox processes on the Ep,QH:Ep,DA relationship, physiological concentrations of electroactive species present in the NAc were added to the buffer. Ascorbic acid (AA, 50 µM) and 3,4-dihydroxyphenylacetic acid (DOPAC, 5 µM) were used to create a TRIS-AA-DOPAC buffer (Figure 8B, blue),58,59 and a TRIS-DA buffer (Figure 8B, red) contained 5 µM dopamine. ANCOVA determined no significant difference in the slopes of TRIS, TRIS-AA-DOPAC, TRIS-DA and of a regression line fit to the live tissue data (F(3,119)=0.84, p=0.4766). ANCOVA did reveal that the y-intercepts were significantly different (F(3,122)=13.2, ****p<0.0001). Tukey’s post-hoc test determined that TRIS-AA-DOPAC, TRIS-DA and the live tissue regression lines had intercepts that were not different (p≥0.37), but that were all different from the TRIS model (****p<0.0001). Therefore, the presence of background redox processes is critical when predicting Ep,DA in tissue. Figure 8C plots the relationship between the measured Ep,DA (abscissa) and Ep,DA predicted (ordinate) using the linear model for the TRIS (gray), TRIS-AA-DOPAC (blue), and TRIS-DA (red) buffers. If the models reliably predict Ep,DA, then all the resulting points should fall on, or be normally distributed about, the dashed unity line, as in the models that incorporate background redox processes.
3. Conclusion
Precise and reliable quantification of neurochemical concentration is critical in order to accurately interpret the molecular mechanisms underlying any aspect of brain function. Electrode calibration is necessary for accurate quantification; however, the nature of in vivo measurements can make conventional post-calibration difficult, or even impossible. Even when calibration is feasible, the analyte-specific voltammograms and scaling factors that lie at the core of PCR can shift or fluctuate in vivo, largely due to changes in impedance brought about by long-term biological processes. Thus, an in situ method for accurate electrode calibration is imperative. We provide a step toward this goal by describing a model that uses the oxidation potential of quinone-like moieties in the background signal as an accurate predictor for the oxidation potential of dopamine at any time point in an electrochemical experiment. Importantly, this model does not assume that current-potential relationships are fixed across the entirety of an experiment. One example of its utility would be when the experimental signal to noise ratio is insufficient to resolve peak oxidation potential. The nature of the background signal could bring attention to inconsistencies between the training set and the experimental data, so that the training set could be adjusted as required. Overall, this work characterizes the effects of impedance on FSCV measurements, and provides a tool for researchers to make informed decisions when constructing appropriate PCR models. It promises to simplify data collection protocols for in vivo applications, and to facilitate widespread use of FSCV by allowing more freedom in experimental design, particularly when combined with a previously described approach to predict electrode sensitivity in situ21. Thus, it represents a significant step toward more automated analysis of in vivo data.
4. Materials and Methods
Chemicals
All chemicals (≥95%, HPLC assay) were purchased from Sigma-Aldrich Co. (St. Louis, MO), unless otherwise stated, and used without additional processing. In vitro electrochemical experiments were performed in either a phosphate-buffered saline (10 mM Na2HPO4, 138 mM NaCl, and 2.7 mM KCl) or TRIS buffered saline (15 mM 2-amino-2-hydroxymethyl-propane-1,3-diol, 3.25 mM KCl, 1.20 mM CaCl2, 1.2 mM MgCl2, 2 mM Na2SO4, 1.25 mM NaH2PO4, and 145 mM NaCl). Adrenal slice experiments used bicarbonate-buffered saline (125 mM NaCl, 26 mM NaHCO3, 2.5 mM KCl, 2.0 mM CaCl2, 1.0 mM MgCl2, 1.3 mM NaH2PO4, 10 mM HEPES, and 10 mM glucose) saturated with 95% O2 and 5% CO2. All buffers were adjusted to pH 7.4 with 1 M NaOH and 1M HCl. Reserpine (10 mg mL−1) and α-methyl-DL-tyrosine methyl ester hydrochloride (α-MPT, 250 mg mL−1) were prepared in 50% saline:50% dimethyl sulfoxide and in saline, respectively. All aqueous solutions were made using ultrapure 18.2 MΩ water.
Microelectrode Fabrication
Cylindrical carbon-fiber microelectrodes were fabricated using T-650 carbon fibers (Cytec Industries, Inc., Woodland Park, NJ) as previously described.1 In short, a single carbon fiber was aspirated into a glass capillary, a glass seal was created using a micropipette puller (Narishige, Tokyo, Japan), and the fiber extending past the seal was cut to 100 µm in length. Electrical connection to the carbon-fiber was established via a conductive silver epoxy. A Ag/AgCl pellet reference electrode (World Precision Instruments, Inc., Sarasota, FL) was used to complete the two-electrode electrochemical cell.
Model Circuit Fabrication and Characterization
Resistance and capacitance values for circuit components were confirmed with a voltmeter. Five circuits with constant resistance (60, 110, 160, 210, and 310 kΩ) were produced in a manner that allowed capacitors (0, 3.93, 7.43, 10.19, 13.82 nF) to be interchanged. Additionally, a circuit containing four 10 kΩ resistors in series was fabricated to add data points between 0 and 40 kΩ. This resulted in 29 different circuits. EIS Spectrum Analyzer60 software (available online at http://www.abc.chemistry.bsu.by/vi/analyser/) was used to simulate electrochemical impedance spectroscopic values for each circuit.
Flow-Injection System
Working electrodes were positioned in a custom electrochemical flow-cell using a micromanipulator (World Precision Instruments, Sarasota, FL). A syringe pump (New Era Pump Systems, Wantagh, NY) supplied a continuous buffer stream of 0.5 mL min−1 (1.0 mL min−1 for data in Figure 3) across the working and reference electrodes. Two-second bolus injections of analyte to the microelectrode surface were accomplished with a six-port HPLC valve mounted on a two-position actuator controlled by a digital pneumatic solenoid valve (Valco Instruments, Houston, TX). The entire apparatus was enclosed in a custom-built grounded Faraday cage.
Data Acquisition
A triangular waveform from −0.4 to +1.3 V with a −0.4 V holding potential was applied at a scan rate of 400 V s−1, an application frequency of 10 Hz, and a sampling frequency of 200 kHz (100 kHz for data in Figure 3) using a custom built instrument for potential application and current transduction (University of North Carolina at Chapel Hill, Department of Chemistry, Electronics Facility). High Definition Cyclic Voltammetry software (University of North Carolina at Chapel Hill) was used for waveform output, data analysis and signal processing in conjunction with data acquisition cards (National Instruments, Austin TX) used for measuring current and synchronizing the electrochemical cell with the flow-injection system. Analog filtering was accomplished with a 2-pole Sallen-Key, low-pass filter at 2 kHz. There was no additional analog or digital filtering of the data.
Animal Experiments
Male Sprague-Dawley rats (250–300 g, Charles River Laboratories, Raleigh, NC) were used in all animal experiments. Animal care and use was in accordance with North Carolina State University Institutional Animal Care and Use Committee (IACUC) guidelines. One animal was used as an acute electrode preparation. The animal was urethane anesthetized (4 g kg−1 intraperitoneally), placed in a stereotaxic frame (David Kopf Instruments, Tujunga, CA), and holes for electrodes were drilled in the skull using stereotaxic coordinates, as described previously.1 The working electrode was placed in the striatum (1.2 mm AP, 3.0 mm ML, −5.0 mm DV relative to bregma), and the Ag/AgCl reference electrode was placed in the contralateral forebrain. The animal’s body temperature was maintained at 37 °C by a heating pad.
One animal was treated with reserpine (5 mg/kg) and α-MPT (250 mg/kg) daily for three days. The animal was urethane anesthetized (4 g kg−1 intraperitoneally), decapitated, and adrenal glands were quickly removed, trimmed of fat tissue, and embedded in 3% agarose gel in bicarbonate-buffered saline (BBS). The gel blocks were placed in cold BBS and 400 µm thick slices were cut with a vibratome (World Precision Instruments, Sarasota, FL). The slices were allowed to rest in BBS for one hour, then transferred to a recording chamber (Warner instruments, Hamden, CT) and superfused with BBS maintained at 34°C for at least 30 min prior to electrical stimulation. Carbon-fiber microelectrodes were positioned in tissue near twin tungsten stimulating electrodes. Electrode placements were made with the aid of a microscope (Nikon Instruments, Inc., Melville, NY) and micromanipulators (Scientifica, ltd., United Kingdom). Electrical stimulations consisted of trains of 16 biphasic, 500 µA pulses at a frequency of 60 Hz with a pulse width of 2 ms.
A chronic electrode preparation was investigated in one animal. Surgery was performed as previously described.30 Briefly, the animal was anesthetized with 2.5%–4% isoflurane, placed in a stereotaxic frame (David Kopf Instruments, Tujunga, CA), and holes for electrodes and screws were drilled in the skull using stereotaxic coordinates. The working electrode was placed in the NAc (+1.2 mm AP, +1.4 mm ML, −7.0 mm DV relative to bregma), the stimulation electrode in the ventral tegmental area (−5.2 mm AP, +1.0 mm ML, −8.2 mm DV relative to bregma), and a Ag/AgCl reference electrode was placed in the contralateral forebrain. The components were permanently affixed with dental cement. The animal’s body temperature was maintained at 37 °C using a heating pad. The animal was allowed to recover for two weeks prior to administering electrical stimulation. Electrical stimulations consisted of trains of 12 biphasic, 175 µA pulses at a frequency of 60 Hz with a pulse width of 2 ms, performed every other day.
Statistics
Data are presented as the mean ± standard deviation, unless otherwise noted. Paired t-tests were employed to compare two groups of data. One-way ANOVA with a Tukey’s post-hoc test and two-way ANOVA were used to compare significance between multiple groups. ANCOVA (with Tukey’s post-hoc test) was used to compare linear regression models. Significance was determined at p<0.05. Statistical analyses and graphical depictions of the data were carried out using GraphPad Prism 6 (GraphPad Software, Inc., La Jolla, CA) and MATLAB R2012B (Mathworks, Natick, MA).
Acknowledgments
This work was supported by the U.S. National Institutes of Health (R01-NS076772 to L.A.S). C.J.M. is supported by an NSF Graduate Research Fellowship (DGE-1252376).
Abbreviations
- FSCV
fast-scan cyclic voltammetry
- PCR
principal component regression
- CV
cyclic voltammogram
- Ep,DA
oxidation potential of dopamine
- Ep,QH
oxidation potential of quinone-like moieties
- CFME
carbon-fiber microelectrode
- EIS
electrochemical impedance spectroscopy
- PBS
phosphate-buffered saline
- TRIS
Tris-buffered saline
- CA
catecholamine
- α-MPT
α-methyl-DL-tyrosine methyl ester hydrochloride
- AA
ascorbic acid
- DA
dopamine
- DOPAC
3,4-dihydroxyphenylacetic acid
Footnotes
AUTHOR CONTRIBUTIONS
L.A.S., G.S.M., and J.G.R. conceived of the work, all of the authors collectively designed experiments and prepared the manuscript, and C.J.M. collected and analyzed data.
References
- 1.Roberts JG, Lugo-Morales LZ, Loziuk PL, Sombers LA. In: Leading Methods in Dopamine Research. Kabbani N, editor. Humana Press; New York: 2013. pp. 275–294. [DOI] [PMC free article] [PubMed] [Google Scholar]
- 2.Robinson DL, Wightman RM. In: Electrochemical Methods for Neuroscience. Michael AC, Borland LM, editors. CRC Press; Boca Raton, FL: 2007. pp. 17–34. [Google Scholar]
- 3.Stamford JA, Kruk ZL, Millar J. Regional differences in extracellular ascorbic acid levels in the rat brain determined by high speed cyclic voltammetry. Brain Res. 1984;299:289–295. doi: 10.1016/0006-8993(84)90710-8. [DOI] [PubMed] [Google Scholar]
- 4.Stamford JA, Kruk ZL, Millar J, Wightman RM. Striatal dopamine uptake in the rat: In vivo analysis by fast cyclic voltammetry. Neurosci. Lett. 1984;51:133–138. doi: 10.1016/0304-3940(84)90274-x. [DOI] [PubMed] [Google Scholar]
- 5.Kile BM, Walsh PL, McElligott ZA, Bucher ES, Guillot TS, Salahpour A, Caron MG, Wightman RM. Optimizing the Temporal Resolution of Fast-Scan Cyclic Voltammetry. ACS Chem. Neurosci. 2012;3:285–292. doi: 10.1021/cn200119u. [DOI] [PMC free article] [PubMed] [Google Scholar]
- 6.Takmakov P, McKinney CJ, Carelli RM, Wightman RM. Instrumentation for fast-scan cyclic voltammetry combined with electrophysiology for behavioral experiments in freely moving animals. Rev. Sci. Instrum. 2011;82:074302. doi: 10.1063/1.3610651. [DOI] [PMC free article] [PubMed] [Google Scholar]
- 7.Wightman RM, Heien MLAV, Wassum KM, Sombers LA, Aragona BJ, Khan AS, Ariansen JL, Cheer JF, Phillips PEM, Carelli RM. Dopamine release is heterogeneous within microenvironments of the rat nucleus accumbens. Eur. J. Neurosci. 2007;26:2046–2054. doi: 10.1111/j.1460-9568.2007.05772.x. [DOI] [PubMed] [Google Scholar]
- 8.Keithley RB, Takmakov P, Bucher ES, Belle AM, Owesson-White CA, Park J, Wightman RM. Higher Sensitivity Dopamine Measurements with Faster-Scan Cyclic Voltammetry. Anal. Chem. 2011;83:3563–3571. doi: 10.1021/ac200143v. [DOI] [PMC free article] [PubMed] [Google Scholar]
- 9.Hermans A, Keithley RB, Kita JM, Sombers LA, Wightman RM. Dopamine Detection with Fast-Scan Cyclic Voltammetry Used with Analog Background Subtraction. Anal. Chem. 2008;80:4040–4048. doi: 10.1021/ac800108j. [DOI] [PubMed] [Google Scholar]
- 10.Heien MLAV, Johnson MA, Wightman RM. Resolving Neurotransmitters Detected by Fast-Scan Cyclic Voltammetry. Anal. Chem. 2004;76:5697–5704. doi: 10.1021/ac0491509. [DOI] [PubMed] [Google Scholar]
- 11.Roitman MF, Stuber GD, Phillips PEM, Wightman RM, Carelli RM. Dopamine Operates as a Subsecond Modulator of Food Seeking. J. Neurosci. 2004;24:1265–1271. doi: 10.1523/JNEUROSCI.3823-03.2004. [DOI] [PMC free article] [PubMed] [Google Scholar]
- 12.Gan JO, Walton ME, Phillips PEM. Dissociable cost and benefit encoding of future rewards by mesolimbic dopamine. Nat. Neurosci. 2010;13:25–27. doi: 10.1038/nn.2460. [DOI] [PMC free article] [PubMed] [Google Scholar]
- 13.Day JJ, Roitman MF, Wightman RM, Carelli RM. Associative learning mediates dynamic shifts in dopamine signaling in the nucleus accumbens. Nat. Neurosci. 2007;10:1020–1028. doi: 10.1038/nn1923. [DOI] [PubMed] [Google Scholar]
- 14.Phillips PEM, Stuber GD, Heien MLAV, Wightman RM, Carelli RM. Subsecond dopamine release promotes cocaine seeking. Nature. 2003;422:614–618. doi: 10.1038/nature01476. [DOI] [PubMed] [Google Scholar]
- 15.Howe MW, Tierney PL, Sandberg SG, Phillips PEM, Graybiel AM. Prolonged dopamine signaling in striatum signals proximity and value of distant rewards. Nature. 2013;500:575–579. doi: 10.1038/nature12475. [DOI] [PMC free article] [PubMed] [Google Scholar]
- 16.Stouffer MA, Woods CA, Patel JC, Lee CR, Witkovsky P, Bao L, Machold RP, Jones KT, de Vaca SC, Reith MEA, Carr KD, Rice ME. Insulin enhances striatal dopamine release by activating cholinergic interneurons and thereby signals reward. Nat. Commun. 2015 doi: 10.1038/ncomms9543. published online Oct 27, 2015. [DOI] [PMC free article] [PubMed] [Google Scholar]
- 17.Spanos M, Gras-Najjar J, Letchworth JM, Sanford AL, Toups JV, Sombers LA. Quantitation of Hydrogen Peroxide Fluctuations and Their Modulation of Dopamine Dynamics in the Rat Dorsal Striatum Using Fast-Scan Cyclic Voltammetry. ACS Chem. Neurosci. 2013;4:782–789. doi: 10.1021/cn4000499. [DOI] [PMC free article] [PubMed] [Google Scholar]
- 18.Hashemi P, Dankoski EC, Wood KM, Ambrose RE, Wightman RM. In vivo electrochemical evidence for simultaneous 5-HT and histamine release in the rat substantia nigra pars reticulata following medial forebrain bundle stimulation. J. Neurochem. 2011;118:749–759. doi: 10.1111/j.1471-4159.2011.07352.x. [DOI] [PMC free article] [PubMed] [Google Scholar]
- 19.Wagner AK, Drewencki LL, Chen X, Santos FR, Khan AS, Harun R, Torres GE, Michael AC, Dixon CE. Chronic methylphenidate treatment enhances striatal dopamine neurotransmission after experimental traumatic brain injury. J. Neurochem. 2009;108:986–997. doi: 10.1111/j.1471-4159.2008.05840.x. [DOI] [PMC free article] [PubMed] [Google Scholar]
- 20.Logman MJ, Budygin EA, Gainetdinov RR, Wightman RM. Quantitation of in vivo measurements with carbon fiber microelectrodes. J. Neurosci. Methods. 2000;95:95–102. doi: 10.1016/s0165-0270(99)00155-7. [DOI] [PubMed] [Google Scholar]
- 21.Roberts JG, Toups JV, Eyualem E, McCarty GS, Sombers LA. In Situ Electrode Calibration Strategy for Voltammetric Measurements In Vivo. Anal. Chem. 2013;85:11568–11575. doi: 10.1021/ac402884n. [DOI] [PMC free article] [PubMed] [Google Scholar]
- 22.Harris DC. Quantitative chemical analysis. 8. Macmillan; New York: 2010. [Google Scholar]
- 23.Kramer R. Chemometric Techniques for Quantitative Analysis. Marcel-Dekker; New York: 1998. [Google Scholar]
- 24.Heien MLAV, Khan AS, Ariansen JL, Cheer JF, Phillips PEM, Wassum KM, Wightman RM. Real-time measurement of dopamine fluctuations after cocaine in the brain of behaving rats. Proc. Natl. Acad. Sci. 2005;102:10023–10028. doi: 10.1073/pnas.0504657102. [DOI] [PMC free article] [PubMed] [Google Scholar]
- 25.Keithley RB, Mark Wightman R, Heien ML. Multivariate concentration determination using principal component regression with residual analysis. TrAC, Trends Anal. Chem. 2009;28:1127–1136. doi: 10.1016/j.trac.2009.07.002. [DOI] [PMC free article] [PubMed] [Google Scholar]
- 26.Keithley RB, Wightman RM, Heien ML. Erratum to “Multivariate concentration determination using principal component regression with residual analysis” [Trends Anal. Chem. 28 (2009) 1127–1136] TrAC Trends Anal. Chem. 2010 doi: 10.1016/j.trac.2009.07.002. [DOI] [PMC free article] [PubMed] [Google Scholar]
- 27.Johnson JA, Rodeberg NT, Wightman RM. Failure of Standard Training Sets in the Analysis of Fast-Scan Cyclic Voltammetry Data. ACS Chem. Neurosci. 2016;7:349–359. doi: 10.1021/acschemneuro.5b00302. [DOI] [PMC free article] [PubMed] [Google Scholar]
- 28.Lugo-Morales LZ, Loziuk PL, Corder AK, Toups JV, Roberts JG, McCaffrey KA, Sombers LA. Enzyme-modified carbon-fiber microelectrode for the quantification of dynamic fluctuations of nonelectroactive analytes using fast-scan cyclic voltammetry. Anal. Chem. 2013;85:8780–6. doi: 10.1021/ac4017852. [DOI] [PMC free article] [PubMed] [Google Scholar]
- 29.Peters JL, Miner LH, Michael AC, Sesack SR. Ultrastructure at carbon fiber microelectrode implantation sites after acute voltammetric measurements in the striatum of anesthetized rats. J. Neurosci. Methods. 2004;137:9–23. doi: 10.1016/j.jneumeth.2004.02.006. [DOI] [PubMed] [Google Scholar]
- 30.Clark JJ, Sandberg SG, Wanat MJ, Gan JO, Horne EA, Hart AS, Akers CA, Parker JG, Willuhn I, Martinez V, Evans SB, Stella N, Phillips PEM. Chronic microsensors for longitudinal, subsecond dopamine detection in behaving animals. Nat. Methods. 2010;7:126–129. doi: 10.1038/nmeth.1412. [DOI] [PMC free article] [PubMed] [Google Scholar]
- 31.Flagel SB, Clark JJ, Robinson TE, Mayo L, Czuj A, Willuhn I, Akers CA, Clinton SM, Phillips PEM, Akil H. A selective role for dopamine in stimulus–reward learning. Nature. 2011;469:53–57. doi: 10.1038/nature09588. [DOI] [PMC free article] [PubMed] [Google Scholar]
- 32.Clark JJ, Collins AL, Sanford CA, Phillips PEM. Dopamine Encoding of Pavlovian Incentive Stimuli Diminishes with Extended Training. J. Neurosci. 2013;33:3526–3532. doi: 10.1523/JNEUROSCI.5119-12.2013. [DOI] [PMC free article] [PubMed] [Google Scholar]
- 33.Hart AS, Rutledge RB, Glimcher PW, Phillips PEM. Phasic Dopamine Release in the Rat Nucleus Accumbens Symmetrically Encodes a Reward Prediction Error Term. J. Neurosci. 2014;34:698–704. doi: 10.1523/JNEUROSCI.2489-13.2014. [DOI] [PMC free article] [PubMed] [Google Scholar]
- 34.Rodeberg NT, Johnson JA, Cameron CM, Saddoris MP, Carelli RM, Wightman RM. Construction of Training Sets for Valid Calibration of in Vivo Cyclic Voltammetric Data by Principal Component Analysis. Anal. Chem. 2015;87:11484–11491. doi: 10.1021/acs.analchem.5b03222. [DOI] [PMC free article] [PubMed] [Google Scholar]
- 35.Skoog DA, West DM, Holler FJ, Crouch SR. Fundamentals of Analytical Chemistry. 9. Nelson Education; Toronto: 2013. [Google Scholar]
- 36.Bard AJ, Faulkner LR. Electrochemical Methods: Fundamentals and applications. 2. Wiley; New York: 2001. [Google Scholar]
- 37.McCreery RL. Advanced Carbon Electrode Materials for Molecular Electrochemistry. Chem. Rev. 2008;108:2646–2687. doi: 10.1021/cr068076m. [DOI] [PubMed] [Google Scholar]
- 38.Takmakov P, Zachek MK, Keithley RB, Bucher ES, McCarty GS, Wightman RM. Characterization of Local pH Changes in Brain Using Fast-Scan Cyclic Voltammetry with Carbon Microelectrodes. Anal. Chem. 2010;82:9892–9900. doi: 10.1021/ac102399n. [DOI] [PMC free article] [PubMed] [Google Scholar]
- 39.DuVall SH, McCreery RL. Self-catalysis by Catechols and Quinones during Heterogeneous Electron Transfer at Carbon Electrodes. J. Am. Chem. Soc. 2000;122:6759–6764. [Google Scholar]
- 40.Heien MLAV, Phillips PEM, Stuber GD, Seipel AT, Wightman RM. Overoxidation of carbon-fiber microelectrodes enhances dopamine adsorption and increases sensitivity. Analyst. 2003;128:1413–1419. doi: 10.1039/b307024g. [DOI] [PubMed] [Google Scholar]
- 41.Moussy F, Harrison DJ. Prevention of the Rapid Degradation of Subcutaneously Implanted Ag/AgCl Reference Electrodes Using Polymer Coatings. Anal. Chem. 1994;66:674–679. doi: 10.1021/ac00077a015. [DOI] [PubMed] [Google Scholar]
- 42.Roberts JG, Moody BP, McCarty GS, Sombers LA. Specific Oxygen-Containing Functional Groups on the Carbon Surface Underlie an Enhanced Sensitivity to Dopamine at Electrochemically Pretreated Carbon Fiber Microelectrodes. Langmuir. 2010;26:9116–9122. doi: 10.1021/la9048924. [DOI] [PubMed] [Google Scholar]
- 43.Chang B-Y, Park S-M. Electrochemical Impedance Spectroscopy. Annu. Rev. Anal. Chem. 2010;3:207–229. doi: 10.1146/annurev.anchem.012809.102211. [DOI] [PubMed] [Google Scholar]
- 44.Lisdat F, Schäfer D. The use of electrochemical impedance spectroscopy for biosensing. Anal. Bioanal. Chem. 2008;391:1555–1567. doi: 10.1007/s00216-008-1970-7. [DOI] [PubMed] [Google Scholar]
- 45.Franks W, Schenker I, Schmutz P, Hierlemann A. Impedance Characterization and Modeling of Electrodes for Biomedical Applications. IEEE Trans. Biomed. Eng. 2005;52:1295–1302. doi: 10.1109/TBME.2005.847523. [DOI] [PubMed] [Google Scholar]
- 46.Pollak V. An equivalent diagram for the interface impedance of metal needle electrodes. Med. Biol. Eng. 1974;12:454–459. doi: 10.1007/BF02478601. [DOI] [PubMed] [Google Scholar]
- 47.Williams JC, Hippensteel JA, Dilgen J, Shain W, Kipke DR. Complex impedance spectroscopy for monitoring tissue responses to inserted neural implants. J. Neural Eng. 2007;4:410–423. doi: 10.1088/1741-2560/4/4/007. [DOI] [PubMed] [Google Scholar]
- 48.Huang X, Nguyen D, Greve DW, Domach MM. Simulation of Microelectrode Impedance Changes Due to Cell Growth. IEEE Sens. J. 2004;4:576–583. [Google Scholar]
- 49.Mercanzini A, Colin P, Bensadoun J-C, Bertsch A, Renaud P. In Vivo Electrical Impedance Spectroscopy of Tissue Reaction to Microelectrode Arrays. IEEE Trans. Biomed. Eng. 2009;56:1909–1918. doi: 10.1109/TBME.2009.2018457. [DOI] [PubMed] [Google Scholar]
- 50.Lempka SF, Miocinovic S, Johnson MD, Vitek JL, McIntyre CC. In vivo impedance spectroscopy of deep brain stimulation electrodes. J. Neural Eng. 2009;6:046001. doi: 10.1088/1741-2560/6/4/046001. [DOI] [PMC free article] [PubMed] [Google Scholar]
- 51.McAdams ET, Jossinet J. Tissue impedance: a historical overview. Physiol. Meas. 1995;16:A1–A13. doi: 10.1088/0967-3334/16/3a/001. [DOI] [PubMed] [Google Scholar]
- 52.Szarowski DH, Andersen MD, Retterer S, Spence AJ, Isaacson M, Craighead HG, Turner JN, Shain W. Brain responses to micro-machined silicon devices. Brain Res. 2003;983:23–35. doi: 10.1016/s0006-8993(03)03023-3. [DOI] [PubMed] [Google Scholar]
- 53.Bath BD, Michael DJ, Trafton BJ, Joseph JD, Runnels PL, Wightman RM. Subsecond Adsorption and Desorption of Dopamine at Carbon-Fiber Microelectrodes. Anal. Chem. 2000;72:5994–6002. doi: 10.1021/ac000849y. [DOI] [PubMed] [Google Scholar]
- 54.Martínez-Olivares R, Villanueva I, Racotta R, Piñón M. Depletion and recovery of catecholamines in several organs of rats treated with reserpine. Auton. Neurosci. 2006;128:64–69. doi: 10.1016/j.autneu.2006.04.004. [DOI] [PubMed] [Google Scholar]
- 55.Toneff T, Funkelstein L, Mosier C, Abagyan A, Ziegler M, Hook V. Beta-amyloid peptides undergo regulated co-secretion with neuropeptide and catecholamine neurotransmitters. Peptides. 2013;46:126–135. doi: 10.1016/j.peptides.2013.04.020. [DOI] [PMC free article] [PubMed] [Google Scholar]
- 56.Mundorf ML, Joseph JD, Austin CM, Caron MG, Wightman RM. Catecholamine release and uptake in the mouse prefrontal cortex. J. Neurochem. 2008;79:130–142. doi: 10.1046/j.1471-4159.2001.00554.x. [DOI] [PubMed] [Google Scholar]
- 57.Harreither W, Trouillon R, Poulin P, Neri W, Ewing AG, Safina G. Carbon Nanotube Fiber Microelectrodes Show a Higher Resistance to Dopamine Fouling. Anal. Chem. 2013;85:7447–7453. doi: 10.1021/ac401399s. [DOI] [PMC free article] [PubMed] [Google Scholar]
- 58.Zetterström T, Sharp T, Marsden CA, Ungerstedt U. In vivo measurement of dopamine and its metabolites by intracerebral dialysis: changes after d-amphetamine. J. Neurochem. 1983;41:1769–73. doi: 10.1111/j.1471-4159.1983.tb00893.x. [DOI] [PubMed] [Google Scholar]
- 59.Parsons LH, Justice JB. Extracellular Concentration and In Vivo Recovery of Dopamine in the Nucleus Accumbens Using Microdialysis. J. Neurochem. 1992;58:212–218. doi: 10.1111/j.1471-4159.1992.tb09298.x. [DOI] [PubMed] [Google Scholar]
- 60.Bondarenko AS, Ragoisha GA. In: Progress in Chemometrics Research. Pomerantsev AL, editor. Nova Science Publishers; New York: 2005. pp. 89–102. (the program is available online at http://www.abc.chemistry.bsu.by/vi/analyser/) [Google Scholar]


