

Abstract
Objective
To determine if optimized imaging protocols across multiple computed tomography (CT) vendors could result in reproducible radiomic features calculated from an anthropomorphic phantom.
Methods
Materials with varying degrees of heterogeneity were placed throughout the lungs of the phantom. Twenty scans of the phantom were acquired on 3 CT manufacturers with chest CT protocols that had optimized protocol parameters. Scans were reconstructed using vendor-specific standards and lung kernels.
The Concordance Correlation Coefficient (CCC) was used to calculate reproducibility between features. For features with high CCC values, Bland-Altman analysis was also used to quantify agreement.
Results
The mean Hounsfield unit (HU) was 32.93 HU (141.7 to −26.5 HU) for the rubber insert and 347.2 HU (−320.9 to −347.7 HU) for the wood insert. Low CCC values < 0.9 were calculated for all features across all scans.
Conclusions
Radiomic features that are derived from the spatial distribution of voxel intensities should be particularly scrutinized for reproducibility in a multi-vendor environment.
Keywords: Radiomics, computed tomography, anthropomorphic phantom
Introduction
Technological advancements in medical imaging hardware and software have enabled devices, such as Computed Tomography (CT) scanners, to be particularly helpful in depicting tumor compositional and morphological features with high quality1–5. Such advances have enabled the rapid progression of fields like radiomics. For example, in patients with lung adenocarcinoma, Coroller, et al.6 reported 35 radiomic features to be prognostic for distant metastasis and 12 features that predict survival. However, any value and practicality of noninvasively quantifying tumor characteristics is largely dependent on the repeatability and reproducibility of quantitative imaging features across medical imaging devices6–19, 32. As such, prior to the clinical application of radiomic features for patient care, they must be found to be repeatable and reproducible under the conditions that might be expected in clinical practice or a clinical trial with multiple scanners or sites6–19, 32.
To date, publicly available retrospective patient image datasets and phantoms have been used to identify robust radiomic features. With test/retest CT scans of 56 non-small cell lung carcinoma (NSCLC) patients Hunter, et al.11 identified machine-robust image features, but also reported that reproduciblity and redundancy of radiomic features depended on both the CT scanner and CT image type. To further understand the influence of CT scan parameters on radiomic feature reproducibility Mackin, et al.12 compared radiomic features calculated for NSCLC tumors from 20 patients with those calculated for 17 scans of a rectangular radiomics phantom. He showed that the variability calculated from different CT scanners is comparable to that found in CT images of NSCLC tumors. In a retrospective clinical trial Solomon, et al.19 reported on the degree to which radiation dose and iterative reconstruction algorithms affect the robustness of radiomic features extracted from tumors. However, the study was only conducted on General Electric (GE) CT scanners.
Although these studies highlight that variability in radiomic features exist, they are limited in several respects. In particular, several of the studies have not incorporated the effect of the latest advancements in CT hardware and software such as automated tube current modulation (TCM) and iterative reconstruction. All modern TCM systems are designed to automatically modulate the radiation dose and tube current according to a user-selected image quality reference parameter and the patient size/attenuation profile35,36. The underlying functionality varies across manufacturers, but the overall intent is to reduce noise variation across the inhomogenous body habitus. Due to concerns surrounding the stochastic risks from exposure to low doses of ionizing raidation dose, patient based test/retest studies used to determine radiomic feature robustness may not be practical in a multi-vendor environment12. Phantoms may be the most practical means to determine robustness, but the phantoms currently being used are either too homogenous in texture or unrealistic in shape (i.e., have a square or rectangular cross section) 12 for modern CT systems. Inserts consisting of variable textures12 were incorporated into an adult-sized anthropomorphic phantom to address these limitations. The anthropomorphic phantom consists of attenuation properties similar to human tissue and provides for a realistic context with which to evaluate modern CT scanners. Hence, the purpose of this study was to investigate if imaging protocols optimized for image quality and radiation dose across multiple CT vendors would result in reproducible radiomic features.
Materials and Methods
Scanning Parameters and Anthropomorphic Phantom
Twenty scans of the hybrid anthropomorphic phantom (Figure 1a, b) were acquired on three CT manufacturers: a 64 detector row CT scanner (Discovery CT750 HD; GE Healthcare, Milwaukee, Wisconsin, USA), 32 detector row CT scanner (Somatom Definition AS, Siemens, Forchheim, Germany), and a 16 detector row scanner (Big Bore Brilliance, Phillips Healthcare, Cleveland, OH, USA). All scans were acquired using modified CT chest protocols that used manufacturer-specific TCM. The scan parameters common to each scanner were: tube potential of 120 kVp, 0.7s rotation time, large body filter, 512 × 512 matrix, and a display field of view of 39 cm. All scans were reconstructed using the manufacturer specific standard and lung kernels and a reconstruction slice thickness of 5 mm. The imaging parameters are listed in Table 1.
Figure 1.
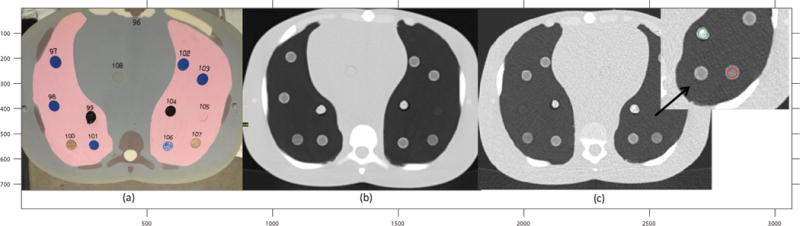
(a), a cross section of the anthropomorphic phantom with the rubber and wood inserts placed throughout the lungs. #104 is the rubber insert. #107 is the sycamore wood. (b), axial CT scan of the phantom cross section displayed on the left. The regions of higher electron density are brighter in the image and the regions of lower electron density are not as bright. (c) Cross section shows the placement of ROIs on each of the inserts.
Table 1.
List of Scanners and Scan Parameters Used in the Study.
| Manufacturer/Model | Reconstruction Kernel | Scan Type | Slice Thickness | Pixel Spacing (mm) | Spiral Pitch Factor | kVp | Image Quality Reference Parameter | Indicated CTDIvol (mGy) |
|---|---|---|---|---|---|---|---|---|
| GE Discovery CT750 HD |
Standard/Lung | Helical | 5mm | 0.762 | 0.984 | 120 | NI 14 | 9.33 |
| Phillips Brilliance 16 |
Standard(B)/Lung (L) | Helical | 5 mm | 0.762 | 0.938 | 120 | 150 mAs/Slice | 9.20 |
| Siemens Somatom Definition AS |
Standard – B40f Lung – B60f |
Helical | 5 mm | 0.762 | 0.951 | 120 | QRM 253 | 9.34 |
kVp indicates kilovoltage peak; mAs is milliampere-second. NI = Noise index. QRM = Quality Reference mAs.
The anthropomorphic phantom consists of five simulated tissue types: soft tissue, lung, brain, spinal cord, and bone. The tissue types were engineered to produce photon attenuation values within 1% of those for real tissues for the bone and the soft tissue substitutes, and 3% for the lung tissue substitute over the range of 30–20 000 keV20. Although the anthropomorphic phantom contains different tissue types, two objects with varying degrees of heterogeneity, shredded rubber and sycamore wood, were introduced. Feature values extracted from the rubber insert were previously demonstrated to span the range of feature values found in human tissue, especially NSCLC12. The rubber insert presented with a porous, random and strong texture, whereas the wood insert consisted of a regular, repeated texture. While these exact patterns may not be found within human tumors, the enhancement or smoothing resulting from different reconstruction kernels will be similar to what is observed in heterogenous or homogenous tissues. For example, a NSCLC tumor may consist of several different densities and sharp discontinuities at the boundaries producing a wide range of Hounsfield unit (HU) values. A lung reconstruction algorithm would seek to over enhance such boundaries, whereas a standard algorithm would tend to reduce the noise and offer a smoother looking image. Similar observations would be noted with the chosen inserts. The inserts placed within the anthropomorphic phantom are shown in Figure 1a.
Quantitative Image Analysis
The first set of features evaluated in this study included the mean and median HU of the rubber and wood inserts. The second sets of features evaluated are based on the spatial distribution of voxel intensities or CT numbers (i.e. HU values) of a CT image. These features included the neighborhood gray-tone difference matrix (NGTDM)21 and the Gray Level Co-occurrence Matrix (GLCM)38. A total of 27 features were used in this study, Table 2 provides a listing. Both features were chosen due to their common use in radiomics research investigations22–26.
Table 2.
NGTDM and GLCM features used in this study.
| Feature Name | Category | |
|---|---|---|
| 1 | Busyness | NeighborIntensityDifference3 (Computed from a 3D image matrix) |
| 2 | Coarseness | |
| 3 | Complexity | |
| 4 | Contrast | |
| 5 | Texture Strength | |
|
| ||
| 6 | Autocorrelation | GrayLevelCooccurenceMatrix3 (Computed from a 3D image matrix) |
| 7 | Cluster Prominence | |
| 8 | Cluster Shade | |
| 9 | Cluster Tendency | |
| 10 | Contrast | |
| 11 | Correlation | |
| 12 | Difference Entropy | |
| 13 | Dissimilarity | |
| 14 | Energy | |
| 15 | Entropy | |
| 16 | Homogeneity | |
| 17 | Homogeneity 2 | |
| 18 | Information Measure Corr1 | |
| 19 | Information Measure Corr2 | |
| 20 | InverseDiffMomentNorm | |
| 21 | InverseDiffNorm | |
| 22 | InverseVariance | |
| 23 | MaxProbability | |
| 24 | SumAverage | |
| 25 | SumEntropy | |
| 26 | SumVariance | |
| 27 | Variance | |
The IBEX radiomics software package (MD Anderson) was used to calculate the NGTDM and GLCM features27. For each insert, ROIs were defined as shown in Figure 1c. The NGTDM features were calculated using a 3D image matrix27. The intensity range and number of bins were determined by evaluating the histogram for each respective insert. As a result, for both inserts, the number of bins used was 32. The intensity range varied with reconstruction kernel and insert type. The neighborhood matrix size was 3 in the X-dimension. The slice thickness was set to 5mm, as shown in Table 1. A second set of features derived from the GLCM were also computed using IBEX. The IBEX algorithm calculates features in 3D in thirteen unique directions27. The distance between pixels d, was set to a value of d = 1.
Reproducibility Analysis
The variation in HU for each insert across all scanners and scan types was first explored. Then, while applying vendor specific standard or lung kernels to each scan, the reproducibility of the NGTDM and GLCM features was investigated. The scans were acquired with optimized acquisition parameters where the CTDIvol, voxel dimensions, pitch, and kVp were nearly equivalent. The following six combinations of scans were included in the reproducibility analysis: GE standard kernel (GE-SK) vs. Siemens standard kernel (S-SK), GE-S vs. Phillips standard kernel (P-SK), and S-SK vs. P-SK. The same sequence was used for the lung kernel (LK): GE-LK vs S-LK, GE-LK vs. P-LK, and S-LK vs. P-LK.
In a separate analysis, the reproducibility of NGTDM and GLCM features calculated on scans reconstructed with sharp lung and smoother standard kernels was explored. For this analysis, only the reconstruction kernel was allowed to vary within and between each CT vendor. Reproducibility of the following scan combinations was considered: GE-SK vs. GE-LK, GE-SK vs. S-LK, GE-SK vs. P-LK; S-SK vs. GE-LK, S-SK vs. S-LK, S-SK vs. P-LK; and P-SK vs. GE-LK, P-SK vs. S-LK, and P-SK vs. P-LK.
Statistical Analysis
The Lilliefors test was used to test the normality of all features extracted from the phantom scans. A p value of less than 0.05 indicated statistical significance. The Concordance Correlation Coefficient (CCC) 29–31 was used to identify the most reproducible radiomic features. The CCC, as proposed by Lawrence and Lin, describes the extent to which paired measurements diverge from perfect agreement, reflecting both systemic differences between repeated measurements and variability11, 28,29.
The CCC is defined as:
Where are the variances for each class, μ1 and μ2 are the group means. As suggested by McBride, et al., reproducible features with CCC > 0.9 were defined. A CCC value of greater than 0.9 indicated highly correlated values, whereas those below 0.9 were considered to be poorly correlated29–31. Kernels and scanning parameters that produced highly correlated results (CCC > 0.9) were identified. All the statistical analysis was performed by software written in MATLAB R2014b on a Microsoft Windows system.
A Bland-Altman analysis and regression analysis was performed next. Due to the large number of possible combinations, plots with regression and the Bland-Altman analysis were limited to the features found to have the highest CCC values. Bland-Altman plots are scatter plots with the vertical axis showing the difference between two variables versus against their average in the horizontal axis32. The mean difference and 95% limits of agreement were reported on each plot. If features from any two scans were comparable, then the differences on the Bland-Altman plot would be small or near zero32. A negative value implied that feature values are greater on one particular scan method relative to another. A positive value indicated lower feature values relative to any particular scan method. The reproducibility coefficient (RPC) was calculated as 1.96 * standard deviation. The coefficient of variation (CV) was also reported within the Bland-Altman plots32.
Results
The normality test revealed that most NGTDM- and GLCM-derived features appeared to have normal distribution (p < 0.05). For those NGTDM and GLCM features found to be non-normal, a log-normal transformation was performed. Figure 2 shows the distribution of HU values for each insert across all scanners. With the rubber insert, the average HU across all scans was found to be 32.93 HU with a range of 141.7 HU to −26.5 HU. The mean HU of the sycamore wood insert was found to be −347.2 HU with a range of −320.9 HU to −347.7 HU.
Figure 2.
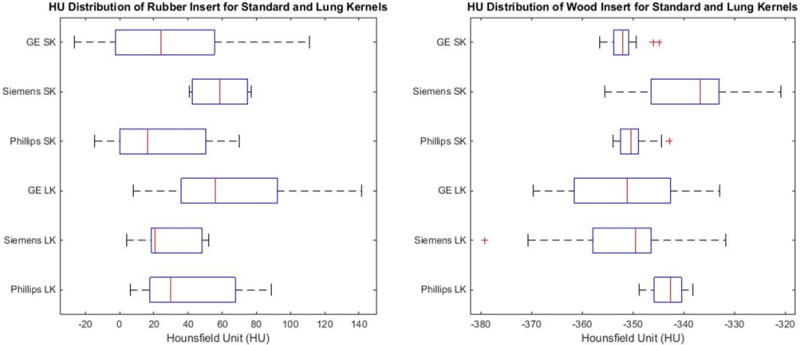
Left: Distribution of the HU value for the rubber insert. Right: Distribution of HU for the sycamore wood insert for all scans. Each HU value was extracted using equivalent sized ROIs and at the same slice locations. SK: Standard Kernel, LK: Lung Kernel.
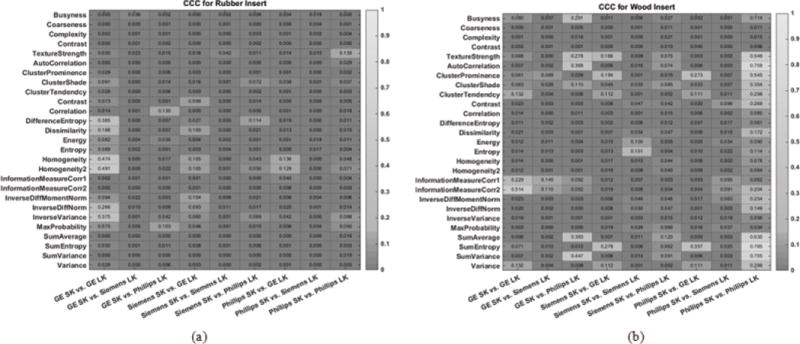
Figure 3 shows the reproducibility of radiomic features between images reconstructed with vendor specific standard kernels. Within the heatmaps, a lighter color indicates a higher CCC value, which suggests greater reproducibility. The corresponding numerical CCC values of these radiomics features are overlaid onto the heatmaps. Figure 3a shows the CCC values for the rubber insert and Figure 3b shows the values for the wood insert. For both the rubber and wood inserts, all radiomic features were found to have CCC values that were less than 0.9. Similarly, Figure 4 compared the reproducibility of radiomic features across CT vendors, but for scans reconstructed with vendor specific lung kernels. In this case as well, all radiomic features were not found to be reproducible across vendors, with CCC < 0.9.
Figure 3.
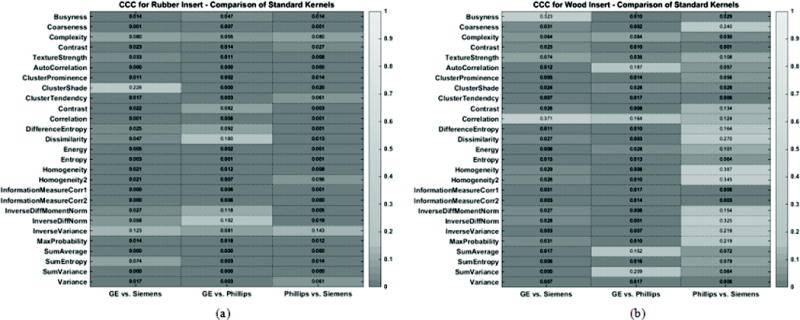
Heatmap consisting of CCC values for the radiomic features evaluated in this study. The CCC (0 to 1) was computed from repeat CT images acquired with vendor specific standard reconstruction kernels for (a) the rubber insert and (b) wood insert. The lighter the shade of gray, the higher the CCC value.
Figure 4.
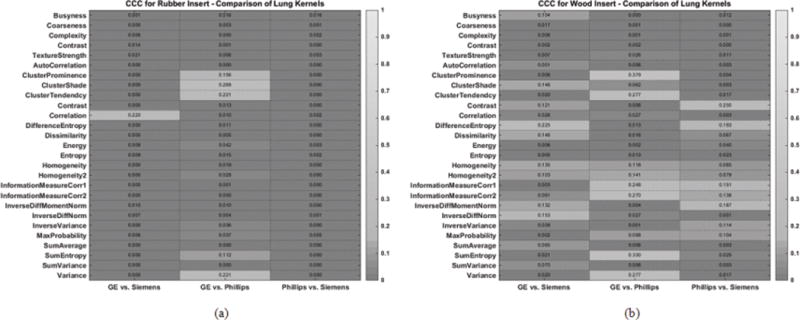
Heatmap consisting of CCC values for the radiomic features evaluated in this study. The CCC (0 to 1) was computed from repeat CT images acquired with different reconstruction kernels for (a) the rubber insert and (b) wood insert. The lighter the shade of gray, the higher the CCC value.
When comparing reproducibility of radiomic features extracted from an image reconstructed with a standard kernel to the same features extracted from an image reconstructed with a lung kernel, we found that the CCC is less than 0.9 for all features and across all vendors, see Figure 5a and 5b.
Figure 5.
Heatmap consisting of CCC values for the radiomic features evaluated in this study. The CCC (0 to 1) was computed from repeat CT images acquired with different imaging settings for (a) the rubber insert and (b) wood insert. The lighter the shade of gray, the higher the CCC value.
Regression and Bland-Altman analysis were performed next on the features within Figure 3 and Figure 4 that had the largest CCC values. Figures 6 and 7 show the Bland-Altman analysis with limits of agreement, RPC, CV and the regression analysis for the GLCM homogeneity and GLCM SumEntropy feature calculated for the wood insert. The GLCM homogeneity feature had a CCC of 0.387 between Phillips-SK and Siemens-SK scans. The mean difference was 0.0009, (95% CI, −0.02 to 0.02), with a CV of 3.2% and RPC of 0.02. The CCC of the GLCM SumEntropy feature of the Phillips-SK and Phillips-LK was CCC = 0.785. The Bland-Altman plot in Figure 7 shows that the mean difference for GLCM SumEntropy feature (CCC = 0.785) was slightly less than zero at 0.02 (95% CI, −0.05 to 0.01) with a CV of 0.33% and RPC of 0.03. The slight negative mean difference suggests that the GLCM SumEntropy feature may have had, on average, higher values on the Phillips-LK as compared to the Phillips-SK scans.
Figure 6.
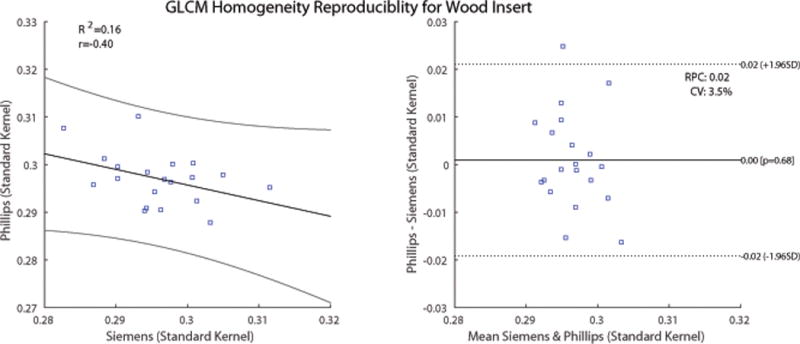
Comparison of GLCM Homogeneity feature calculated on images of the wood insert from Phillips and Siemens CT scans. The scans were reconstructed using the vendor-specific standard kernel. Left: Scatter plot with regression fit and confidence intervals plotted. Slope = 0.33 and intercept = 0.39. Right: Bland-Altman plot with lower and upper limits. RPC = reproducibility coefficient. CV = coefficient of variation.
Figure 7.
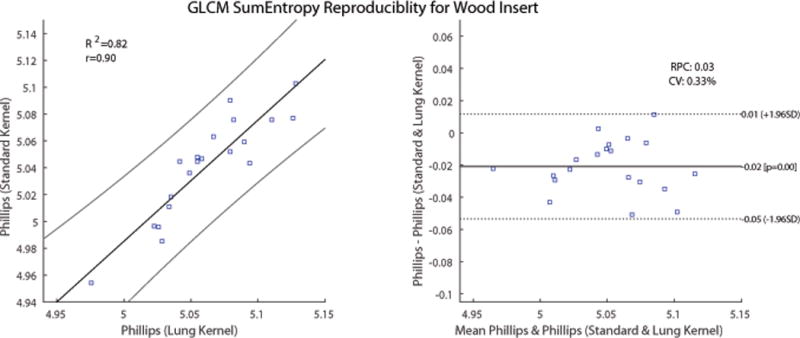
Comparison of GLCM SumEntropy feature calculated on images of the wood insert from Phillips CT scans. The scans were reconstructed using the vendor-specific standard and lung kernels. Left: Scatter plot with regression fit and confidence intervals plotted. Slope = 0.90 and intercept = 0.47. Right: Bland-Altman plot with lower and upper limits of agreement. RPC = reproducibility coefficient, CV = coefficient of variation.
Discussion
The anthropomorphic phantom used in this study consisted of realistic tissue attenuation properties and components that are reproducible over time and position (i.e., the phantom is not compressed over time). For such an idealized case, we have demonstrated that with optimized scanning parameters across CT vendors, where voxel dimensions, CTDIvol, pitch, kVp and reconstruction kernels were similar, NGTDM and GLCM radiomic features were found to be not reproducible. The importance of deriving robust, reproducible and repeatable quantitative metrics from CT scans is critical for the progress of radiomics and personalized medicine. With increasingly large numbers of publications emerging about the connection between underlying tumor phenotype and radiomic features, strong consideration must be paid to the robustness of radiomic features, particularly NGTDM and GLCM features. In addition to publications demonstrating linkage of features to tumor phenotype, an equal number of publications are demonstrating the impact that CT acquisition scan parameters have on robustness of radiomic features6–16. One solution being proposed for robust radiomic features has been the standardization of CT acquisition methods40. However, as our results show here, even while using nearly identical scanning parameters for three CT scanners, radiomic features based on the NGTDM and GLCM methods are not consistent across the scanners used in this study. There are specific intrinsic factors within each scanner that cannot be compensated for.
The original inception of CT scanners was not for them to be accurate, quantitative measuring devices as found in calibration style laboratories32. Consistency of the fundamental unit of measurements for all CT scanners, the HU, is dependent on a number of items, such as the scanner detector characteristics and design, calibration methods, and quality control/maintenance41. Additional uncontrollable factors that vary from patient to patient and limit the accuracy of HU values is the fundamental physics of x-ray interaction that result in beam hardening artifacts41. As an x-ray beam hardens, the effective energy increases, resulting in voxel intensity or HU values that deviate from expectations. Hence, standardization of imaging protocols alone may not be enough to ensure robust NGTDM and GLCM radiomic features in a multi-vendor environment. For radiomics to progress, the engineering of features that are specific for textures found on 3D medical images, particularly CT images may be necessary, and/or robust correction factors may need to be implemented to ensure accuracy within a multi-vendor environment.
Although the data presented here is unique in that it is derived from anthropomorphic phantoms, some limitations must be discussed. Due to available resources, this study included only three scanners and a subset of image acquisition parameters that are used clinically. Siemens CT scanners offer many additional kernels that are used for different types of exams (e.g., body, head, etc.); however, we focused primarily on a kernel intended to be used with chest CT exams. Further, only images reconstructed with traditional filtered back projection were considered. Iterative reconstruction (IR) algorithms are increasingly being used in practice and are known to produce images with differing textures19,34. However, due to the proprietary nature and continuous evolution of these IR algorithms, developing a consistent set of radiomics features that accurately describe the tumor microenvironments, or developing correction factors from images reconstructed using IR may not be practically feasible. Additionally, the inserts used within this study were of a fixed, small size, and ROIs used to calculate texture parameters did not include borders of the objects. Hence, the small ROI and small size of the inserts may have introduced bias into the final results. A follow up study will aim to investigate the impact of ROI size on feature reproducibility and also reasons as to why within vendor kernels presented with higher CCC values for some features. Lastly, although the anthropomorphic phantom consists of materials that simulate the attenuation properties of human tissue, it is static, of one size, and issues, such as patient motion, could not be accounted for.
In conclusion, we sought to determine if standardized imaging protocols could produce the most robust radiomic features. However, even under optimized scanning conditions with an idealized anthropomorhpic phantom, the NGTDM and GLCM features extracted from CT images were not reproducible across scanners. Radiomic features that are derived from the spatial distribution of voxel intensities should be particularly scrutinized for accuracy.
Acknowledgments
Source of Funding:
This research was funded in part through the NIH/NCI Cancer center support grant P30 CA008748.
Footnotes
Conflicts of Interest:
All authors have no conflicts of interest with regard to this manuscript.
References
- 1.Yu M, Stott S, Toner M, et al. Circulating tumor cells: approaches to isolation and characterization. J Cell Biol. 2011;192(3):373–382. doi: 10.1083/jcb.201010021. [DOI] [PMC free article] [PubMed] [Google Scholar]
- 2.Junttila MR, de Sauvage FJ. Influence of tumour micro-environment heterogeneity on therapeutic response. Nature. 2013;501(7467):346–354. doi: 10.1038/nature12626. [DOI] [PubMed] [Google Scholar]
- 3.O’Connor JP, Rose CJ, Waterton JC, et al. Imaging intratumor heterogeneity: role in therapy response, resistance, and clinical outcome. Clin Cancer Res. 2015;21(2):249–257. doi: 10.1158/1078-0432.CCR-14-0990. [DOI] [PMC free article] [PubMed] [Google Scholar]
- 4.Gillies RJ, Kinahan PE, Hricak H. Radiomics: images are more than pictures, they are data. Radiology. 2015;278(2):563–577. doi: 10.1148/radiol.2015151169. [DOI] [PMC free article] [PubMed] [Google Scholar]
- 5.Alizadeh AA, Aranda V, Bardelli A, et al. Toward understanding and exploiting tumor heterogeneity. Nat Med. 2015;21(8):846–853. doi: 10.1038/nm.3915. [DOI] [PMC free article] [PubMed] [Google Scholar]
- 6.Coroller TP, Grossmann P, Hou Y, et al. CT-based radiomic signature predicts distant metastasis in lung adenocarcinoma. Radiother Oncol. 2015;114(3):345–350. doi: 10.1016/j.radonc.2015.02.015. [DOI] [PMC free article] [PubMed] [Google Scholar]
- 7.Figueiras RG, Padhani AR, Goh VJ, et al. Novel oncologic drugs: what they do and how they affect images. RadioGraphics. 2011;31(7):2059–2091. doi: 10.1148/rg.317115108. [DOI] [PubMed] [Google Scholar]
- 8.Al-Kadi OS, Watson D. Texture analysis of aggressive and nonaggressive lung tumor CE CT images. IEEE T Bio-Med Eng. 2008;55(7):1822. doi: 10.1109/TBME.2008.919735. [DOI] [PubMed] [Google Scholar]
- 9.Aerts HJWL, Velazquez ER, Leijenaar RTH, et al. Decoding tumor phenotype by noninvasive imaging using a quantitative radiomics approach. Nature Communications. 2014;5:4006. doi: 10.1038/ncomms5006. [DOI] [PMC free article] [PubMed] [Google Scholar]
- 10.Boedeker KL, McNitt-Gray MF, Rogers SR, et al. Emphysema: effect of reconstruction algorithm on CT imaging measures. Radiology. 2004;232(1):295–301. doi: 10.1148/radiol.2321030383. [DOI] [PubMed] [Google Scholar]
- 11.Hunter LA, Krafft S, Stingo F, et al. High quality machine-robust image features: Identification in nonsmall cell lung cancer computed tomography images. Med Phys. 2013;40(12):121916. doi: 10.1118/1.4829514. [DOI] [PMC free article] [PubMed] [Google Scholar]
- 12.Mackin D, Fave X, Zhang L, et al. Measuring computed tomography scanner variability of radiomics features. Invest Radiol. 2015;50(11):757–65. doi: 10.1097/RLI.0000000000000180. [DOI] [PMC free article] [PubMed] [Google Scholar]
- 13.Yang J, Zhang L, Fave XJ, et al. Uncertainty analysis of quantitative imaging features extracted from contrast-enhanced CT in lung tumors. Comput Med Imag Grap. 2016;48:1–8. doi: 10.1016/j.compmedimag.2015.12.001. [DOI] [PMC free article] [PubMed] [Google Scholar]
- 14.Fave X, Cook M, Frederick A, et al. Preliminary investigation into sources of uncertainty in quantitative imaging features. Comput Med Imag Grap. 2015;44:54–61. doi: 10.1016/j.compmedimag.2015.04.006. 2015. [DOI] [PubMed] [Google Scholar]
- 15.Bartel ST, Bierhals AJ, Pilgram TK, et al. Equating quantitative emphysema measurements on different CT image reconstructions. Med Phys. 2011;38(8):4894–4902. doi: 10.1118/1.3615624. [DOI] [PMC free article] [PubMed] [Google Scholar]
- 16.Gallardo-Estrella L, Lynch DA, Prokop M, et al. Normalizing computed tomography data reconstructed with different filter kernels: effect on emphysema quantification. Eur Radiol. 2016;26(2):478–486. doi: 10.1007/s00330-015-3824-y. [DOI] [PMC free article] [PubMed] [Google Scholar]
- 17.Zhang J, Bruesewitz MR, Bartholmai BJ, et al. Selection of appropriate computed tomographic image reconstruction algorithms for a quantitative multicenter trial of diffuse lung disease. Journal of Computer Assisted Tomography. 2008;32(2):233–237. doi: 10.1097/RCT.0b013e3180690d89. [DOI] [PubMed] [Google Scholar]
- 18.Wang Y, Keller BM, Zheng, et al. SPIE Medical Imaging. International Society for Optics and Photonics; 2013. Texture feature standardization in digital mammography for improving generalizability across devices; pp. 867026–867026. [Google Scholar]
- 19.Solomon J, Mileto A, Nelson RC, et al. Quantitative Features of Liver Lesions, Lung Nodules, and Renal Stones at Multi–Detector Row CT Examinations: Dependency on Radiation Dose and Reconstruction Algorithm. Radiology. 2015;279(1):185–94. doi: 10.1148/radiol.2015150892. [DOI] [PubMed] [Google Scholar]
- 20.ATOM. Atom dosimetry verification phantoms 2015 [Google Scholar]
- 21.Amadasun M, King R. Textural features corresponding to textural properties. IEEE Trans Syst Man Cybern Syst Hum. 1989;19(5):1264–1274. (1989) [Google Scholar]
- 22.Vince DG, Dixon KJ, Cothren RM, et al. Comparison of texture analysis methods for the characterization of coronary plaques in intravascular ultrasound images. Comput Med Imag Grap. 2000;24(4):221–229. doi: 10.1016/s0895-6111(00)00011-2. [DOI] [PubMed] [Google Scholar]
- 23.Mendez AJ, Tahoces PG, Lado MJ, et al. Computer-aided diagnosis: Automatic detection of malignant masses in digitized mammograms. Med Phys. 1998;25(6):957–964. doi: 10.1118/1.598274. [DOI] [PubMed] [Google Scholar]
- 24.Chicklore S, Goh V, Siddique M, et al. Quantifying tumour heterogeneity in 18F-FDG PET/CT imaging by texture analysis. Eur J Nucl Med Mol I. 2013;40(1):133–140. doi: 10.1007/s00259-012-2247-0. [DOI] [PubMed] [Google Scholar]
- 25.Yu H, Caldwell C, Mah K, et al. Coregistered FDG PET/CT-based textural characterization of head and neck cancer for radiation treatment planning. IEEE T Med Imaging. 2009;28(3):374–383. doi: 10.1109/TMI.2008.2004425. [DOI] [PubMed] [Google Scholar]
- 26.Cook GJ, Yip C, Siddique M, et al. Are pretreatment 18F-FDG PET tumor textural features in non–small cell lung cancer associated with response and survival after chemoradiotherapy? J Nucl Med. 2013;54(1):19–26. doi: 10.2967/jnumed.112.107375. [DOI] [PubMed] [Google Scholar]
- 27.Zhang L, Fried DV, Fave XJ, et al. ibex: An open infrastructure software platform to facilitate collaborative work in radiomics. Med Phys. 2015;42(3):1341–1353. doi: 10.1118/1.4908210. [DOI] [PMC free article] [PubMed] [Google Scholar]
- 28.Ganeshan B, Abaleke S, Young RC, et al. Texture analysis of non-small cell lung cancer on unenhanced computed tomography: initial evidence for a relationship with tumour glucose metabolism and stage. Canc Imag. 2010;10(1):137–143. doi: 10.1102/1470-7330.2010.0021. [DOI] [PMC free article] [PubMed] [Google Scholar]
- 29.Lin LI-K. A concordance correlation coefficient to evaluate reproducibility. Biometrics. 1989;45:255–268. [PubMed] [Google Scholar]
- 30.Lin LI-K. A note on the concordance correlation coefficient. Biometrics. 2000;56:324–325. [Google Scholar]
- 31.McBride GB. A proposal for strength-of-agreement criteria for Lin’s Concordance Correlation Coefficient. NIWA Client Report: HAM2005-062 2005 [Google Scholar]
- 32.Raunig DL, McShane LM, Pennello G, et al. Quantitative imaging biomarkers: A review of statistical methods for technical performance assessment. Stat Methods Med Res. 2015;24(1):27–67. doi: 10.1177/0962280214537344. [DOI] [PMC free article] [PubMed] [Google Scholar]
- 33.Bushberg JT, Siebert JA, Leidholdt EM, et al. The Essential Physics of Medical Imaging. 2nd. Williams and Wilkins; Philadelphia: p. 2002. [Google Scholar]
- 34.Solomon JB, Christianson O, Samei E. Quantitative comparison of noise texture across CT scanners from different manufacturers. Medical Phys. 2012;39(10):6048–6055. doi: 10.1118/1.4752209. [DOI] [PubMed] [Google Scholar]
- 35.Bushberg JT, Boone JM. The essential physics of medical imaging. Lippincott Williams & Wilkins; 2011. [Google Scholar]
- 36.Kalra MK, Maher MM, Toth TL, et al. Techniques and applications of automatic tube current modulation for CT 1. Radiology. 2004;233(3):649–657. doi: 10.1148/radiol.2333031150. [DOI] [PubMed] [Google Scholar]
- 37.Lambin P, van Stiphout RG, Starmans MH, et al. Predicting outcomes in radiation oncology—multifactorial decision support systems. Nature Reviews Clinical Oncology. 2013;10(1):27–40. doi: 10.1038/nrclinonc.2012.196. [DOI] [PMC free article] [PubMed] [Google Scholar]
- 38.Haralick RM, Shanmuga K, Dinstein I. Textural features for image classification. IEEE Trans Syst Man Cybern. 1973;3:610–621. [Google Scholar]
- 39.Armato SG, Meyer CR, McNitt‐Gray MF, et al. The Reference Image Database to Evaluate Response to Therapy in Lung Cancer (RIDER) Project: A Resource for the Development of Change-Analysis Software. Clin Pharmacol Therapeut. 2008;84(4):448–456. doi: 10.1038/clpt.2008.161. [DOI] [PMC free article] [PubMed] [Google Scholar]
- 40.Nyflot MJ, Yang F, Byrd D, et al. Quantitative radiomics: impact of stochastic effects on textural feature analysis implies the need for standards. Journal of Medical Imaging. 2015;2(4):041002–041002. doi: 10.1117/1.JMI.2.4.041002. [DOI] [PMC free article] [PubMed] [Google Scholar]
- 41.Hsieh J. Computed tomography: principles, design, artifacts, and recent advances. Bellingham, WA: SPIE; 2009. Nov, [Google Scholar]