

Abstract
Diet soda consumption has not been associated with tangible weight loss. Aspartame (ASP) commonly substitutes sugar and one of its breakdown products is phenylalanine (PHE), a known inhibitor of intestinal alkaline phosphatase (IAP), a gut enzyme shown to prevent metabolic syndrome in mice. We hypothesized that ASP consumption might contribute to the development of metabolic syndrome based on PHE’s inhibition of endogenous IAP. The design of the study was such that for the in vitro model, IAP was added to diet and regular soda, and IAP activity was measured. For the acute model, a closed bowel loop was created in mice. ASP or water was instilled into it and IAP activity was measured. For the chronic model, mice were fed chow or high-fat diet (HFD) with/without ASP in the drinking water for 18 weeks. The results were that for the in vitro study, IAP activity was lower (p < 0.05) in solutions containing ASP compared with controls. For the acute model, endogenous IAP activity was reduced by 50% in the ASP group compared with controls (0.2 ± 0.03 vs 0.4 ± 0.24) (p = 0.02). For the chronic model, mice in the HFD + ASP group gained more weight compared with the HFD + water group (48.1 ± 1.6 vs 42.4 ± 3.1, p = 0.0001). Significant difference in glucose intolerance between the HFD ± ASP groups (53 913 ± 4000.58 (mg·min)/dL vs 42 003.75 ± 5331.61 (mg·min)/dL, respectively, p = 0.02). Fasting glucose and serum tumor necrosis factor-alpha levels were significantly higher in the HFD + ASP group (1.23- and 0.87-fold increases, respectively, p = 0.006 and p = 0.01). In conclusion, endogenous IAP’s protective effects in regard to the metabolic syndrome may be inhibited by PHE, a metabolite of ASP, perhaps explaining the lack of expected weight loss and metabolic improvements associated with diet drinks.
Keywords: non-nutritive sweeteners, noncaloric sweeteners, diet-induced insulin resistance, intestinal alkaline phosphatase, aspartame, obesity, insulin resistance
Introduction
It is clear that consuming sugar-sweetened beverages (SSB) promotes obesity (Malik et al. 2010). Artificial sweeteners are often employed as a sugar substitute and weight-management strategy (Anton et al. 2010), yet numerous studies suggest that the replacement of SSB with artificially sweetened beverages (ASB) does not diminish weight gain. Indeed, ASB have been implicated in the development of certain aspects of metabolic syndrome, including insulin resistance, impaired glucose tolerance, and dyslipidemia (Gardener et al. 2012; Swithers 2013; Imamura et al. 2015). The negative effects of ASB on metabolic health may even impact the offspring of women exposed during their pregnancy (Araujo et al. 2014; Azad et al. 2016). One of the most common artificial sweeteners, aspartame (ASP), which has a US Food and Drug Administration (FDA) approved daily intake level of 50 mg/kg, has been shown to increase the relative risk for type 2 diabetes and metabolic syndrome by as much as 67% and 36%, respectively (Nettleton et al. 2009).
ASP is known to be metabolized by gut esterases and pepti-dases into L-aspartic acid, L-phenylalanine (PHE), and methanol. Recently, our lab has shown that the brush border enzyme intestinal alkaline phosphatase (IAP) can prevent a high-fat diet (HFD)-induced metabolic syndrome in mice, at least partly by inhibiting the absorption of endotoxin (lipopolysaccharide; LPS) that occurs with dietary fats (Kaliannan et al. 2013). We postulated that when ASP breaks down into aspartic acid + PHE, the PHE metabolite, a known inhibitor of IAP (Ghosh and Fishman 1966), hampers IAP-mediated detoxification of gut bacteria-derived endotoxins, thus promoting the development of the metabolic syndrome. Indeed, herein we present results suggesting a possible explanation for why the consumption of ASP may contribute to the development of the metabolic syndrome.
Materials and methods
Study design
Three separate models were developed to test our hypothesis. An in vitro model was performed where IAP activity was measured in solutions of regular soda and diet soda both with and without the addition of 0.1 units of IAP to the sodas. IAP activity was measured by p-nitrophenyl phosphate (pNPP) under pH ranges 3–10, imitating the variations in pH observed within the gut lumen.
Next, an in vivo model was used to study the acute effects of ASP in the intestinal lumen in male mice. A 6-cm segment of small bowel was isolated and injected with saline control or an ASP solution. The amount of ASP administered (34 mg/kg) was based on the FDA’s projected 99th percentile intake amongst humans (Davoli et al. 1986). After 3 h, the mice were sacrificed and luminal contents from the loop were harvested to measure the IAP activity using the pNPP assay.
In a chronic model, we assessed the long-term effects of ASP on male mice fed an HFD. Six-week-old mice were divided into groups receiving a chow diet or an HFD and further subdivided into groups receiving ASP-infused drinking solution (0.96 mg/mL (Magnuson et al. 2007)) or regular water (controls), and were maintained on their respective diet + drink combo for 18 weeks. The mice were monitored for weight gain, food, and water intake throughout these 18 weeks. At the end of the study, 2 glucose tolerance tests were conducted assessing short- and long-term glucose tolerance (6 and 16 h of fasting), and serum tumor necrosis factor alpha (TNF-α) levels were measured prior to sacrifice.
Biochemical reagents
ASP (Asp-Phe methyl ester) was purchased from Sigma–Aldrich (St. Louis, Mo., USA). TNF-α enzyme-linked immunosorbent assay (ELISA) kits were purchased from eBioscience, San Diego, Calif., USA.
Animals
C57BL/6 mice were purchased from Charles River Laboratories. Animals in this study were maintained in accordance with the guidelines prepared by the Institutional Animal Care and Use Committee (IACUC) at Massachusetts General Hospital (MGH) based on the Care and Use of Laboratory Animals of the Institute of Laboratory Resources, National Research Council (Department of Health, Education, and Human Services, publication no. 85e23 (National Institute of Health (NIH)), revised 1985). All experiments were reviewed and approved by the IACUC and carried out according to regulations of the Subcommittee on Research Animal Care of the MGH and the National Institutes of Health (NIH Publication no. 85-23, 1985). Animals received a standard chow diet (Laboratory Rodent Diet 5001; 58% (w/w) kilocalories from carbohydrate, 27% (w/w) kilocalories from protein, and 14% (w/w) kiliocalories from fat (saturated fat 4.5%, unsaturated fat 9.5%), totaling an energy content of 4.09 kcal/g) from Lab Diet (Brentwood, Mo., USA) or an HFD (D12451; 35% (w/w) kilocalories from carbohydrate, 20% (w/w) kilocalories from protein, 45% (w/w) kilocalories from fat (saturated fat 16.2%, unsaturated fat 28.8%), totaling an energy content of 4.73 kcal/g) from and Research Diets Inc. (New Brunswick, N.J., USA). Of note, per manufacturer’s product data, sucrose made up 3.8% (w/w) in the standard chow diet while it was 17% (w/w) of the HFD. Animals received either regular autoclaved drinking water or an ASP-containing solution (0.96 mg/mL) (Magnuson et al. 2007). Animals were euthanized following the American Veterinary Medical Association’s 2013 approved protocol.
Animal experiments
Mice were housed in a biosafety level 1 room in hard top cages and were maintained in a temperature-controlled room (22–24 °C) with a strictly followed 12-h light/12-h dark diurnal cycle with food and water provided ad libitum unless otherwise indicated. For the chronic in vivo experiment, 4 mice were housed per cage, and each cage represented 1 experimental group (n = 4, unless otherwise specified), and there were a total of 4 groups (Chow, Chow + ASP, HFD, HFD + ASP). Animal body weight and food and water intake were measured weekly. Drinking water tubes were changed weekly.
IAP assay
IAP activity in commercial and other IAP samples were verified and/or quantified by performing IAP assay (Malo et al. 2010). Briefly, 25 μL of a luminal sample was mixed with 175 μL phosphatase assay reagent containing 5 mmol/L of p-nitrophenyl phosphate (pNPP) followed by determining optical density at 405 nm after a specific time period. The Coomassie Blue Protein Assay (Bradford) Kit from Fisher Scientific (Pittsburg, Pa., USA) was used for protein quantification. The specific activity of the enzyme is expressed as pmol pNPP hydrolyzed/(min·μg protein)−1.
Cytokine assay
TNF-α levels were determined using an ELISA kit following the manufacturer’s instructions (eBioscience) in blood serum collected at sacrifice.
Glucose Tolerance Test (GTT)
GTT was performed in nonanesthetized mice as described (Cani et al. 2007). Two separate GTTs were conducted to assess glucose tolerance with short- (6 h) and long-term (16 h) fasting. Briefly, mice were fasted for 6 h and 16 h in the morning, fasting blood sugar was measured, and glucose (1.0 g/kg body weight, 20% (w/v) glucose solution) was administered by intraperitoneal injection. Small blood samples (mL) were drawn from the tip of the incised tail at 30, 60, 90, and 120 min to measure blood glucose levels. Glucose tolerance was expressed by calculating the total area under the curve (AUC) of each GTT.
Statistical analysis
Statistical analyses were performed using IBM SPSS Statistics for Macintosh (version 20.0; IBM Corp., Armonk, N.Y., USA) and Graph-Pad Prism (version 6.00 for Mac; GraphPad Software, La Jolla, Calif., USA). Data were expressed as means ± SE. Statistical differences between 2 groups were analyzed using unpaired 2-tailed Student’s t test. Statistical differences between more than 2 test groups were evaluated by 2-way ANOVA using Tukey’s multiple comparison post-tests. A significant difference was considered when p < 0.05.
Results
ASP lowers IAP activity in vitro
In the in vitro study, soda without added IAP served as a control and did not display any measurable alkaline phosphatase activity, demonstrating a lack of inherent alkaline phosphatase activity in soda (Fig. 1A). After IAP was added to the solutions, IAP activity was significantly lower (t tests at each pH data point, p < 0.05) in solutions containing ASP (diet soda; +ASP) compared with controls without ASP (regular soda; −ASP) at pH 3.3–10 (representing the different acidic/basic environments of the gut). The inhibitory effects of ASP were most dramatic at pH 9 (0.24 ± 0.0002 vs 0.46 ± 0.0023 pmol pNPP hydrolyzed/min, p = 0.034) (Fig. 1B), which interestingly corresponds to the high pH environment of the proximal duodenum where the highest amount of endogenous IAP is produced.
Fig. 1.

Effect of aspartame on intestinal alkaline phosphatase (IAP) activity in vitro in the pH range 3.3–10. Diet soda contains aspartame, but regular soda does not. Without adding IAP to the soda solutions, no alkaline phosphatase activity was present (A). After adding IAP to the drink solutions, IAP was most significantly inhibited by the aspartame in the diet soda with basic pHs resembling the duodenal environment (B). Values are means ± SE, n = 3. pPNNP, p-nitrophenyl phosphate. *, Significant change from regular soda baseline as determined by t tests at each pH data point, p < 0.05.
ASP lowers IAP activity in vivo
In the bowel loop model, IAP activity was significantly (p = 0.02) reduced in mice that had ASP instilled into the loops compared with saline controls (0.2 ± 0.03 vs 0.4 ± 0.24) (Fig. 2). These data indicate that the presence of ASP within the bowel lumen directly inhibits endogenous IAP activity.
Fig. 2.
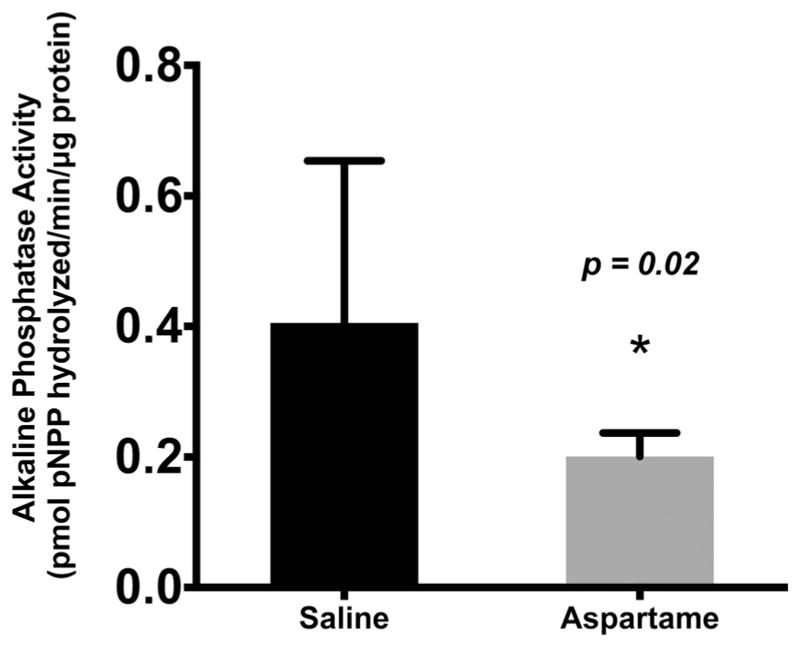
Effect of aspartame on the activity of intraluminal intestinal alkaline phosphatase (IAP) in an isolated bowel loop in mice. When aspartame is instilled in a closed bowel loop, IAP activity is significantly inhibited compared with a saline control (p = 0.02). Values are means ± SE, n = 5. pPNNP, p-nitrophenyl phosphate. *, Significant change from saline baseline, p < 0.05.
In the chronic in vivo model, we found that IAP activity was enhanced by the HFD, consistent with previous published results (Mahmood et al. 2003). Mice receiving ASP in their drinking water had lower luminal IAP activity compared with the controls, and although a trend was seen, this difference was not found to be statistically significant (p = 0.3) (Fig. 3).
Fig. 3.
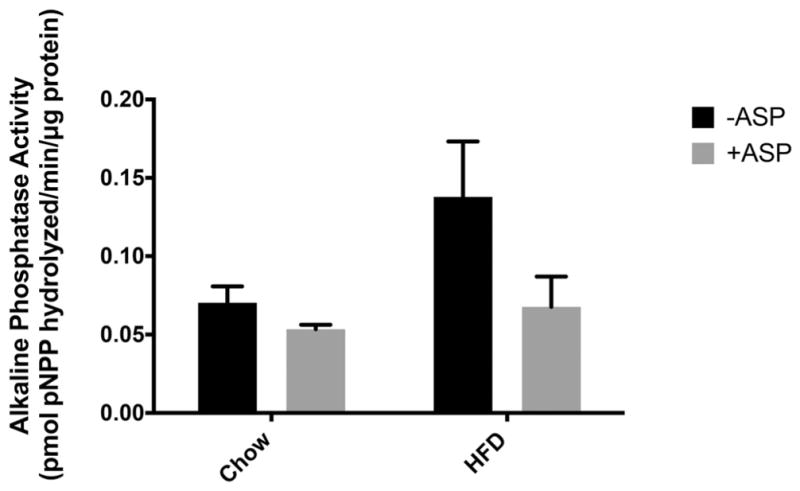
Effect of drinking-water aspartame (ASP) on intraluminal intestinal alkaline phosphatase (IAP) activity in mice fed a chow diet or high-fat diet (HFD). A trend was seen where +ASP groups had decreased intestinal alkaline phosphatase activity, but this difference was not significant with a 2-way ANOVA (p = 0.3). Values are means ± SE, n = 4. +ASP, solutions containing ASP; −ASP, controls without ASP; pPNNP, p-nitrophenyl phosphate.
ASP causes more weight gain in mice fed an HFD
In the chronic in vivo model, where mice received ASP in their drinking water for 18 weeks, mice in the chow group consumed an average of 3.7 mg of ASP (123.3 mg/kg) per day and the mice in the HFD group consumed an average of 3.6 mg (70 mg/kg) per day. There were minimal differences in the amount of weight gained between the water and ASP chow groups (35.8 g ± 1.5 vs 33.2 g ± 3.1). As expected, both HFD – ASP and HFD + ASP groups gained more weight than their chow diet counterparts (42.4 ± 3.1 and 48.1 ± 1.6 vs 35.8 g ± 1.5 and 33.2 g ± 3.1, respectively) (Fig. 4A), but the group that received HFD + ASP gained more weight than the HFD control group (48.1 ± 1.6 vs 42.4 ± 3.1, p < 0.0001). Two-way ANOVA was significant for both ASP and diet when comparing percentage weight gained between groups (p < 0.0001) (Fig. 4B).
Fig. 4.
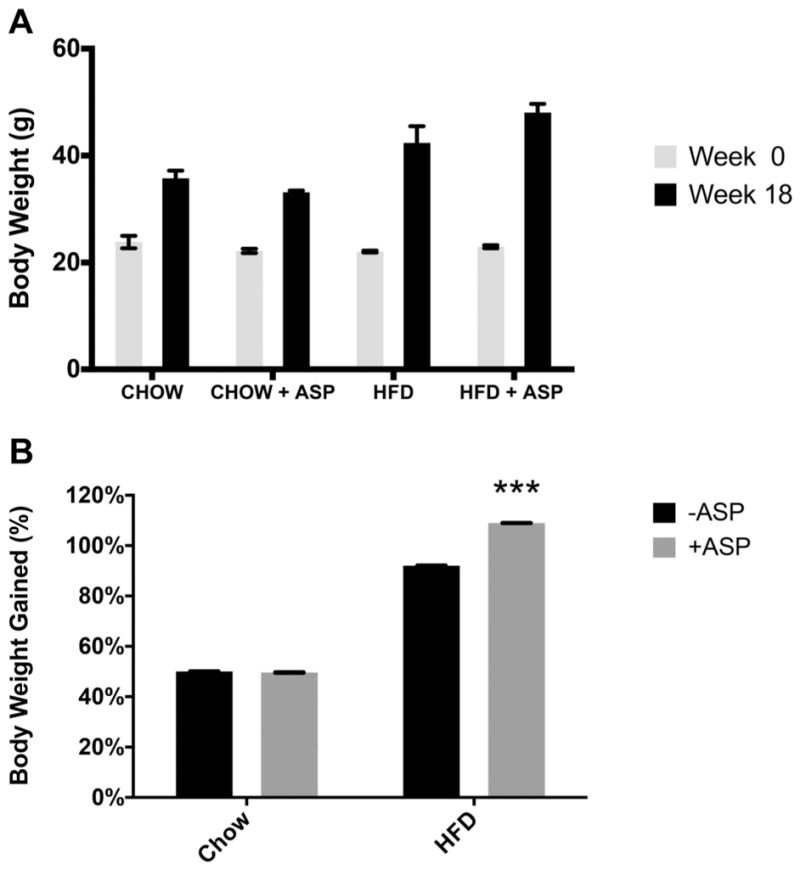
Effect of high-fat diet (HFD) and aspartame (ASP) on mouse weight. Mouse weight was measured at week 0, then the mice were fed a chow diet ± ASP or HFD ± ASP; weight was again measured after 18 weeks (A). Although percent body weight gain (B) was not significantly different for the chow diet groups, percent body weight gain was significantly increased for the HFD group with ASP (p < 0.0001). A 2-way ANOVA test showed that ASP and diet both significantly affected weight. Values are means ± SE, n = 4. +ASP, solutions containing ASP; −ASP, controls without ASP. ***, Significant change from respective diet and −ASP baseline via Tukey’s multiple comparison test, p < 0.0001.
The effect of ASP on blood glucose levels
GTTs were performed and demonstrated that mice that received ASP-infused drinking water developed relative glucose intolerance. The 16-h fasting blood sugar levels were higher in the chow group that received ASP (136.5 ± 12.7 mg/dL vs 108.0 ± 4.7 mg/dL, p = 0.04) and were also higher in the HFD group that received ASP (248.3 ± 17.47 mg/dL vs 218.0 ± 18.77 mg/dL, p = 0.02) (Fig. 5A). Blood glucose was measured over time after 6 h (Fig. 5B) and 16 h (Fig. 5D) of fasting. The total AUC of the blood glucose curves was calculated after the 6-h (Fig. 5C) and 16-h (Fig. 5D) fasting periods. Total AUC was increased in HFD – ASP group, and even more so in HFD + ASP group after both 6 h and 16 h of fasting (42 003.75 ± 5331.61 (mg·min)/dL vs 53 913 ± 4000.58 (mg·min)/dL with 6-h fast, p = 0.02; 38 741.25 ± 6425.50 (mg·min)/dL vs 48 330 ± 3694.69 (mg·min)/dL at 16 h, p = 0.3). Although 2-way ANOVA was not found to be significant with 16-h of fasting (p = 0.5), for the 6-h fast the 2-way ANOVA showed that ASP and diet both significantly affected glucose concentration (p = 0.008).
Fig. 5.

Effects of aspartame (ASP) on glucose tolerance on mice with a chow diet ± ASP or a high-fat diet (HFD) ± ASP. Fasting blood sugar following 16 h of fasting (A). Blood glucose was measured over time following 6 h (B) and 16 h (D) of fasting. The total area under the curve (AUC) of the blood glucose graphs was calculated after the 6-h (C) and 16-h (E) fasting periods to express glucose tolerance. A 2-way ANOVA showed that ASP and diet both significantly affect glucose tolerance after 6 h of fasting. Values are means ± SE, n = 4. +ASP, solutions containing ASP; −ASP, controls without ASP. *, Significant change from respective diet and −ASP baseline via Tukey’s multiple comparison test, p < 0.05. **, p < 0.01.
Effect of ASP on TNF-α levels
Chronic low-grade inflammation, as a result of LPS and perhaps other mediators being absorbed with dietary fats, has been associated with the development of the metabolic syndrome (Cani et al. 2007). TNF-α, a marker of inflammation that has been linked to insulin resistance, has been shown to be locally and systemically elevated in models of diet and genetic-induced obesity (Hotamisligil et al. 1993). In our chronic in vivo model, we found that compared with the controls, serum TNF-α was increased in both chow + ASP and HFD + ASP groups (1622.3 ± 184.1 pg/mg of protein and 2512.1 ± 251.4 pg/mg of protein, respectively), indicating a higher level of systemic inflammation in groups receiving ASP (Fig. 6). This was apparent when comparing TNF-α levels in HFD groups ± ASP (1608.60 ± 349.16 pg/mg vs ±184.1 pg/mg, p = 0.03). A 2-way ANOVA showed that ASP and diet both significantly affect serum TNF-α levels (p = 0.005). TNF-α was highest in the HFD group receiving ASP (p = 0.01).
Fig. 6.
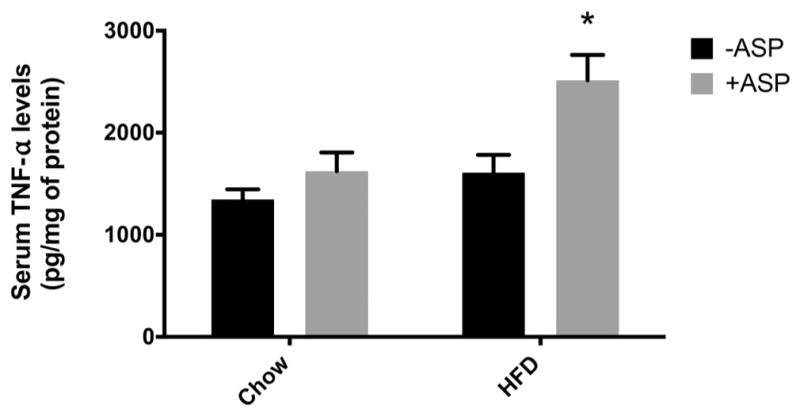
Effect of aspartame (ASP) on serum tumor necrosis factor alpha (TNF-α) levels on mice with a chow diet ± ASP or a high-fat diet (HFD) ± ASP. A 2-way ANOVA showed that ASP and diet both significantly affect serum TNF-α levels (p = 0.005). There was a significant increase in serum TNF-α in high-fat diet (HFD) + ASP (p = 0.009). Values are means ± SE, n = 4. +ASP, solutions containing ASP; −ASP, controls without ASP. *, Significant change from respective diet and −ASP baseline via Tukey’s multiple comparison test, p < 0.05.
Discussion
In recent decades, there has been a marked increase in the consumption of artificial sweeteners as a popular substitute for sucrose (Gardner 2014; Roberts 2015). Indeed, many flavored sodas, energy drinks, frozen foods, common dairy products such as yogurt, and even baby foods contain significant amounts of artificial sweeteners (Yang 2010; Ng et al. 2012). Although artificial sweeteners are marketed as healthy alternatives for consumers seeking to avoid sugar-containing products (de la Pena 2010), several studies have shown a positive correlation between weight gain and consumption of such products (Stellman and Garfinkel 1988; Fowler et al. 2008). However, the effects of artificial sweeteners remain controversial as results appear to be somewhat dependent on experimental conditions (Sylvetsky et al. 2016).
Yet, the reason for artificial sweeteners failing to consistently result in the expected weight loss remains unknown. ASP, a commonly used artificial sweetener, popular for its lack of a bitter aftertaste, has been associated with a significant increase in appetite (Tordoff and Alleva 1990). It was previously thought that the observed increase in appetite was due to the fact that artificial sweeteners did not activate the food reward pathways in the same way as sucrose and fructose (Yang 2010), perhaps resulting in compensatory overeating (Lavin et al. 1997; Davidson et al. 2011; Swithers et al. 2013). However, recent evidence indicates that artificial sweeteners, specifically ASP, may have a direct effect on the gut microbiota that could explain the metabolic changes that occur in high-dose consumption of artificial sweeteners (Palmnas et al. 2014; Suez et al. 2014; Burke and Small 2015).
The impact of artificial sweeteners has been reported in numerous studies. As early as 1989, ASP was shown to increase serum PHE, raising concern that the pathways of tyrosine and other neurotransmitters would be disrupted, potentially leading to cognitive deficiencies and seizure disorders (Wurtman 1983; Gaull 1985). Since then, ASP has been linked to cancer (Roberts 1997), Sjögren’s syndrome (Roberts 2006), angiogenesis (Alleva et al. 2011), and oxidative stress (Prokic et al. 2014). During the last 10 years, the debate surrounding ASP and its potentially adverse effects has mainly focused on its metabolic implications, specifically on the development of obesity and metabolic disease. Previous nutrigenomic studies demonstrated that non-nutritive food additives such as ASP decrease the expression of regulatory genes such as peroxisome proliferator-activated receptor gamma, co-activator 1 alpha and other differentially expressed genes in hepatic and adipose tissue (Collison et al. 2013).
In a recently published study, Frankenfeld et al observed significant differences in the human gut microbiota when comparing consumption of artificial sweeteners to that of a regular diet, explicitly demonstrating a difference in the bacterial makeup in patients with an increased ASP and acesulfame-K intake after only a 4-day trial (Frankenfeld et al. 2015). Although the trials were aiming to study acute changes in high-dose settings, the results raise the question of the long-term effects of artificial sweeteners.
In 2014, Suez et al proposed that non-nutritive sweeteners including ASP may induce glucose intolerance by altering the gut microbiota (Suez et al. 2014). In the same year, Palmnäs et al demonstrated that ASP elevated fasting glucose levels in mice regardless of diet type (Palmnas et al. 2014). Consistent with the work of Frankenfeld et al, the group also showed that a low-dose consumption of ASP alters the gut microbiota, observing an increase in total gut bacteria and a changed dynamic of the gut bacterial composition. Although many theories explaining the effects of ASP on gut metabolism have been suggested, the precise mechanism has not been defined.
PHE is one of the breakdown products of ASP and, we believe, could play a major role in regard to the impact of ASP on metabolic disease. PHE is a known inhibitor of IAP (Ghosh and Fishman 1966), a gut enzyme important in the intestinal microbiotal homeostasis (Malo et al. 2010). IAP derives anti-inflammatory properties from its dephosphorylating activity, detoxifying LPS and other inflammatory mediators and thus inhibit the inflammatory cascade (Lalles 2014). We hypothesized that the negative metabolic effects seen with ASP consumption could be due to its indirect inhibition of IAP through the breakdown product PHE.
We sought to test this hypothesis using both in vitro and in vivo settings. Our in vitro experiments demonstrate that IAP activity was inhibited by the presence of ASP in different pH environments imitating the physiology of the gut. ASP is most stable at an acidic pH of 4.2. In more basic environments, ASP will quickly degrade into its PHE and L-aspartate amino acid components (Hatada et al. 1985). ASP will thus remain stable in the acidic environments of the soda and the stomach; however, when ASP reaches the basic environment of the intestines, it will decompose (Bell and Labuza 1991). The PHE formed from this degradation acts as a specific noncompetitive inhibitor of IAP. PHE’s inhibition of IAP is pH-dependent, and this inhibition is greatest at a pH of 8.5–9 (Ghosh and Fishman 1966). Our in vitro data corresponds to the pH dependence of ASP degradation and of PHE’s IAP inhibition. The graph shows a marginal inhibition of IAP by PHE in the pH 7–8 range. However, in a basic environment where pH is greater than 8, PHE significantly inhibits IAP.
IAP is primarily produced in the proximal small intestine and secreted into the gut lumen, travelling distally and yet maintaining much of its enzymatic activity as it makes its way into the final stool product. Given that the highest IAP levels and activity exist within the proximal small intestine where the luminal pH can be greater than 8, we were intrigued to discover that the in vitro inhibitory effects of ASP on IAP activity were most pronounced under high-pH conditions.
This finding suggests that ASP consumption could indeed lead to significant IAP inhibition in vivo. We directly tested this hypothesis using an in vivo bowel loop model. We found that IAP activity in the isolated intestinal loop was significantly reduced by the presence of ASP (p = 0.02). These results confirmed the idea that ASP could impact the activity of endogenous IAP within the brush border and lumen of the gastrointestinal tract.
To further test the impact of ASP in regard to IAP activity and the metabolic syndrome, we fed mice either chow or HFD ± ASP. It should be noted that unlike humans, mice do not always show strong preferences for ASP, which may be related to the hyper-responsiveness to the negative taste components rather than the lack of sweetness (Bachmanov et al. 2001). No significant weight changes were observed in the group on a regular diet; however, more pronounced (p = 0.0001) weight gain was observed in the group on an HFD when ASP was added to the drinking water.
The inflammatory cytokine TNF-α has been shown to directly interfere with tissue insulin receptors and therefore block insulin’s biological actions, resulting in insulin resistance because of TNF-α exposure (Hotamisligil and Spiegelman 1994). We thus hypothesized that the inhibition of the anti-inflammatory effects of regulating gut proteins such as IAP would lead to elevated insulin levels and relative glucose intolerance. After 6 h of fasting, a significant difference was seen in glucose levels; mice on a regular diet demonstrated significantly higher (p = 0.04) fasting glucose levels when receiving ASP as an additive to their water compared with drinking water alone. In the HFD group, which developed a higher rate of glucose intolerance as expected compared with the chow diet group, a significant and sustained additional increase in fasting glucose levels were seen in the group that combined ASP with the HFD instead of drinking only water (p = 0.02). Calculating glucose concentration over time and AUC after the 6-h fast, a 2-way ANOVA showed that ASP and diet both significantly affected glucose concentration. We additionally measured glucose after a 16-h fast to show that the glucose intolerance could persist despite the mice not having consumed ASP in 16 h; however, the 16-h fast AUC was not found to be statistically significant.
The present data suggest that ASP may promote the metabolic syndrome through IAP inhibition by its breakdown product PHE.
Our lab has previously shown that IAP prevents the metabolic syndrome in mice. IAP works through a variety of mechanisms, including promoting commensal bacteria growth (Malo et al. 2010), blocking bacterially derived pro-inflammatory ligands such as LPS (Kaliannan et al. 2013), and enhancing the gut barrier function (Hamarneh et al. 2014). The metabolic syndrome is defined by a state of chronic low-grade inflammation as a result of LPS and other mediators being absorbed along with dietary fats (Cani et al. 2007). TNF-α is a cytokine known to be elevated in obesity models (Hotamisligil et al. 1993) and has also been linked to insulin resistance. In our chronic in vivo model, we found that the levels of serum TNF-α were increased in mice consuming ASP compared with water, regardless of diet type (p = 0.005). As expected, TNF-α levels were highest in the HFD + ASP group (p = 0.01). These results indicate that ASP alone will elevate the level of inflammation seen over 18 weeks of consumption, regardless of whether it is combined with an HFD.
In conclusion, we have demonstrated that chronic ASP consumption in mice leads to an accelerated weight gain, glucose intolerance, and increased TNF-α levels. We have also shown that ASP reduces the activity of IAP both in vitro and in vivo, likely through its breakdown product PHE, a well-known inhibitor of IAP. And although some data points were not statistically significant, this may be due to the low statistical power from the low sample sizes used in the experiments. A repetition of the experiment with a greater sample size could yield more statistical power and potentially more statistical significance for the difference between the +ASP and −ASP conditions. Furthermore, only male mice were used in this experiment, and there could potentially be differences between sexes, as male mice tend to have higher levels of diet-induced inflammation (Grove et al. 2010) and female mice demonstrate better insulin sensitivity because of their higher levels of adiponectin and estrogen (Medrikova et al. 2012). Investigating sex differences could additionally be an area for further research.
Our findings are consistent with previous studies on ASP and provide a potential explanation for its effects on the metabolic syndrome. By blocking the gut protective anti-inflammatory enzyme IAP, ASP may significantly contribute to the development of the metabolic syndrome, perhaps explaining the observation that dietary products are not associated with the weight loss and metabolic benefits that may otherwise be expected.
Footnotes
Conflict of interest statement
The authors declare no conflicting financial interests.
References
- Alleva R, Borghi B, Santarelli L, Strafella E, Carbonari D, Bracci M, Tomasetti M. In vitro effect of aspartame in angiogenesis induction. Toxicol In Vitro. 2011;25:286–293. doi: 10.1016/j.tiv.2010.09.002. [DOI] [PubMed] [Google Scholar]
- Anton SD, Martin CK, Han H, Coulon S, Cefalu WT, Geiselman P, Williamson DA. Effects of stevia, aspartame, and sucrose on food intake, satiety, and postprandial glucose and insulin levels. Appetite. 2010;55:37–43. doi: 10.1016/j.appet.2010.03.009. [DOI] [PMC free article] [PubMed] [Google Scholar]
- Araujo JR, Martel F, Keating E. Exposure to non-nutritive sweeteners during pregnancy and lactation: impact in programming of metabolic diseases in the progeny later in life. Reprod Toxicol. 2014;49:196–201. doi: 10.1016/j.reprotox.2014.09.007. [DOI] [PubMed] [Google Scholar]
- Azad MB, Sharma AK, de Souza RJ, Dolinsky VW, Becker AB, Mandhane PJ, et al. Association between artificially sweetened beverage consumption during pregnancy and infant body mass index. JAMA Pediatr. 2016;170:662–670. doi: 10.1001/jamapediatrics.2016.0301. [DOI] [PubMed] [Google Scholar]
- Bachmanov AA, Tordoff MG, Beauchamp GK. Sweetener preference of C57BL/6ByJ and 129P3/J mice. Chem Senses. 2001;26:905–913. doi: 10.1093/chemse/26.7.905. [DOI] [PMC free article] [PubMed] [Google Scholar]
- Bell LN, Labuza TP. Aspartame degradation kinetics as affected by pH in intermediate and low moisture food systems. J Food Sci. 1991;56:17–20. doi: 10.1111/j.1365-2621.1991.tb07964.x. [DOI] [Google Scholar]
- Burke MV, Small DM. Physiological mechanisms by which non-nutritive sweeteners may impact body weight and metabolism. Physiol Behav. 2015;152:381–388. doi: 10.1016/j.physbeh.2015.05.036. [DOI] [PMC free article] [PubMed] [Google Scholar]
- Cani PD, Amar J, Iglesias MA, Poggi M, Knauf C, Bastelica D, et al. Metabolic endotoxemia initiates obesity and insulin resistance. Diabetes. 2007;56:1761–1772. doi: 10.2337/db06-1491. [DOI] [PubMed] [Google Scholar]
- Collison KS, Makhoul NJ, Zaidi MZ, Inglis A, Andres BL, Ubungen R, et al. Prediabetic changes in gene expression induced by aspartame and monosodium glutamate in trans fat-fed C57Bl/6 J mice. Nutr Metab (Lond) 2013;10:44. doi: 10.1186/1743-7075-10-44. [DOI] [PMC free article] [PubMed] [Google Scholar]
- Davidson TL, Martin AA, Clark K, Swithers SE. Intake of high-intensity sweeteners alters the ability of sweet taste to signal caloric consequences: implications for the learned control of energy and body weight regulation. Q J Exp Psychol. 2011;64:1430–1441. doi: 10.1080/17470218.2011.552729. [DOI] [PMC free article] [PubMed] [Google Scholar]
- Davoli E, Cappellini L, Airoldi L, Fanelli R. Serum methanol concentrations in rats and in men after a single dose of aspartame. Food Chem Toxicol. 1986;24:187–189. doi: 10.1016/0278-6915(86)90227-9. [DOI] [PubMed] [Google Scholar]
- De la Pena C. Artificial sweetener as a historical window to culturally situated health. Ann NY Acad Sci. 2010;1190:159–165. doi: 10.1111/j.1749-6632.2009.05253.x. [DOI] [PubMed] [Google Scholar]
- Fowler SP, Williams K, Resendez RG, Hunt KJ, Hazuda HP, Stern MP. Fueling the obesity epidemic? Artificially sweetened beverage use and long-term weight gain. Obesity. 2008;16:1894–1900. doi: 10.1038/oby.2008.284. [DOI] [PubMed] [Google Scholar]
- Frankenfeld CL, Sikaroodi M, Lamb E, Shoemaker S, Gillevet PM. High-intensity sweetener consumption and gut microbiome content and predicted gene function in a cross-sectional study of adults in the United States. Ann Epidemiol. 2015;25:736–742. e4. doi: 10.1016/j.annepidem.2015.06.083. [DOI] [PubMed] [Google Scholar]
- Freireich EJ, Gehan EA, Rall DP, Schmidt LH, Skipper HE. Quantitative comparison of toxicity of anticancer agents in mouse, rat, hamster, dog, monkey, and man. Cancer Chemother Rep. 1966;50:219–244. [PubMed] [Google Scholar]
- Gardener H, Rundek T, Markert M, Wright CB, Elkind MS, Sacco RL. Diet soft drink consumption is associated with an increased risk of vascular events in the Northern Manhattan Study. J Gen Intern Med. 2012;27:1120–1126. doi: 10.1007/s11606-011-1968-2. [DOI] [PMC free article] [PubMed] [Google Scholar]
- Gardner C. Non-nutritive sweeteners: evidence for benefit vs. risk. Curr Opin Lipidol. 2014;25:80–84. doi: 10.1097/MOL.0000000000000034. [DOI] [PubMed] [Google Scholar]
- Gaull GE. Aspartame and seizures. Lancet. 1985;2:1431. doi: 10.1016/s0140-6736(85)92601-7. [DOI] [PubMed] [Google Scholar]
- Ghosh NK, Fishman WH. On the mechanism of inhibition of intestinal alkaline phosphatase by L-phenylalanine: I. Kinetic studies. J Biol Chem. 1966;241:2516–2522. [PubMed] [Google Scholar]
- Grove KL, Fried SK, Greenberg AS, Xiao XQ, Clegg DJ. A microarray analysis of sexual dimorphism of adipose tissues in high-fat-diet-induced obese mice. Int J Obes (Lond) 2010;34(6):989–1000. doi: 10.1038/ijo.2010.12. [DOI] [PMC free article] [PubMed] [Google Scholar]
- Hamarneh SR, Mohamed MM, Economopoulos KP, Morrison SA, Phupitakphol T, Tantillo TJ, et al. A novel approach to maintain gut mucosal integrity using an oral enzyme supplement. Ann Surg. 2014;260:706–714. doi: 10.1097/SLA.0000000000000916. discussion 714–715. [DOI] [PMC free article] [PubMed] [Google Scholar]
- Hatada M, Jancarik J, Graves B, Kim SH. Crystal structure of aspartame, a peptide sweetener. J Am Chem Soc. 1985;107:4279–4282. doi: 10.1021/ja00300a034. [DOI] [Google Scholar]
- Hotamisligil GS, Spiegelman BM. Tumor necrosis α: a key component of the obesity-diabetes link. Diabetes. 1994;43:1271–1278. doi: 10.2337/diab.43.11.1271. [DOI] [PubMed] [Google Scholar]
- Hotamisligil GS, Shargill NS, Spiegelman BM. Adipose expression of tumor necrosis factor-alpha: direct role in obesity-linked insulin resistance. Science. 1993;259:87–91. doi: 10.1126/science.7678183. [DOI] [PubMed] [Google Scholar]
- Imamura F, O’Connor L, Ye Z, Mursu J, Hayashino Y, Bhupathiraju SN, Forouhi NG. Consumption of sugar sweetened beverages, artificially sweetened beverages, and fruit juice and incidence of type 2 diabetes: systematic review, meta-analysis, and estimation of population attributable fraction. BMJ. 2015;351:h3576. doi: 10.1136/bmj.h3576. [DOI] [PMC free article] [PubMed] [Google Scholar]
- Kaliannan K, Hamarneh SR, Economopoulos KP, Nasrin Alam S, Moaven O, Patel P, et al. Intestinal alkaline phosphatase prevents metabolic syndrome in mice. Proc Natl Acad Sci USA. 2013;110:7003–7008. doi: 10.1073/pnas.1220180110. [DOI] [PMC free article] [PubMed] [Google Scholar]
- Lalles JP. Intestinal alkaline phosphatase: novel functions and protective effects. Nutr Rev. 2014;72:82–94. doi: 10.1111/nure.12082. [DOI] [PubMed] [Google Scholar]
- Lavin JH, French SJ, Read NW. The effect of sucrose- and aspartame-sweetened drinks on energy intake, hunger and food choice of female, moderately restrained eaters. Int J Obes Relat Metab Disord. 1997;21:37–42. doi: 10.1038/sj.ijo.0800360. [DOI] [PubMed] [Google Scholar]
- Lim U, Subar AF, Mouw T, Hartge P, Morton LM, Stolzenberg-Solomon R, et al. Consumption of aspartame-containing beverages and incidence of hematopoietic and brain malignancies. Cancer Epidemiol Biomarkers Prev. 2006;15:1654–1659. doi: 10.1158/1055-9965.EPI-06-0203. [DOI] [PubMed] [Google Scholar]
- Magnuson BA, Burdock GA, Doull J, Kroes RM, Marsh GM, Pariza MW, et al. Aspartame: a safety evaluation based on current use levels, regulations, and toxicological and epidemiological studies. Crit Rev Toxicol. 2007;37:629–727. doi: 10.1080/10408440701516184. [DOI] [PubMed] [Google Scholar]
- Mahmood A, Shao JS, Alpers DH. Rat enterocytes secrete SLPs containing alkaline phosphatase and cubilin in response to corn oil feeding. Am J Physiol Gastrointest Liver Physiol. 2003;285:G433–G441. doi: 10.1152/ajpgi.00466.2002. [DOI] [PubMed] [Google Scholar]
- Malik VS, Popkin BM, Bray GA, Despres JP, Willett WC, Hu FB. Sugar-sweetened beverages and risk of metabolic syndrome and type 2 diabetes: a meta-analysis. Diabetes Care. 2010;33:2477–2483. doi: 10.2337/dc10-1079. [DOI] [PMC free article] [PubMed] [Google Scholar]
- Malo MS, Alam SN, Mostafa G, Zeller SJ, Johnson PV, Mohammad N, et al. Intestinal alkaline phosphatase preserves the normal homeostasis of gut microbiota. Gut. 2010;59:1476–1484. doi: 10.1136/gut.2010.211706. [DOI] [PubMed] [Google Scholar]
- Medrikova D, Jilkova ZM, Bardova K, Janovska P, Rossmeisl M, Kopecky J. Sex differences during the course of diet-induced obesity in mice: adipose tissue expandability and glycemic control. Int J Obes (Lond) 2012;36(2):262–272. doi: 10.1038/ijo.2011.87. [DOI] [PubMed] [Google Scholar]
- Nettleton JA, Lutsey PL, Wang Y, Lima JA, Michos ED, Jacobs DR., Jr Diet soda intake and risk of incident metabolic syndrome and type 2 diabetes in the Multi-Ethnic Study of Atherosclerosis (MESA) Diabetes Care. 2009;32:688–694. doi: 10.2337/dc08-1799. [DOI] [PMC free article] [PubMed] [Google Scholar]
- Ng SW, Slining MM, Popkin BM. Use of caloric and noncaloric sweeteners in US consumer packaged foods, 2005–2009. J Acad Nutr Diet. 2012;112:1828–1834. e1–6. doi: 10.1016/j.jand.2012.07.009. [DOI] [PMC free article] [PubMed] [Google Scholar]
- Palmnas MS, Cowan TE, Bomhof MR, Su J, Reimer RA, Vogel HJ, et al. Low-dose aspartame consumption differentially affects gut microbiota-host metabolic interactions in the diet-induced obese rat. PloS ONE. 2014;9:e109841. doi: 10.1371/journal.pone.0109841. [DOI] [PMC free article] [PubMed] [Google Scholar]
- Prokic MD, Paunovic MG, Matic MM, Djordjevic NZ, Ognjanovic BI, Stajn AS, Saicic ZS. Prooxidative effects of aspartame on antioxidant defense status in erythrocytes of rats. J Biosci. 2014;39:859–866. doi: 10.1007/s12038-014-9487-z. [DOI] [PubMed] [Google Scholar]
- Roberts HJ. Aspartame-induced Sjögren syndrome. South Med J. 2006;99:631–632. doi: 10.1097/01.smj.0000220960.76266.bc. [DOI] [PubMed] [Google Scholar]
- Roberts HJ. Aspartame and brain cancer. Lancet. 1997;349:362. doi: 10.1016/S0140-6736(05)62868-1. [DOI] [PubMed] [Google Scholar]
- Roberts JR. The paradox of artificial sweeteners in managing obesity. Curr Gastroenterol Rep. 2015;17:423. doi: 10.1007/s11894-014-0423-z. [DOI] [PubMed] [Google Scholar]
- Stellman SD, Garfinkel L. Patterns of artificial sweetener use and weight change in an American Cancer Society prospective study. Appetite. 1988;11(S1):85–91. [PubMed] [Google Scholar]
- Suez J, Korem T, Zeevi D, Zilberman-Schapira G, Thaiss CA, Maza O, et al. Artificial sweeteners induce glucose intolerance by altering the gut microbiota. Nature. 2014;514:181–186. doi: 10.1038/nature13793. [DOI] [PubMed] [Google Scholar]
- Swithers SE. Artificial sweeteners produce the counterintuitive effect of inducing metabolic derangements. Trends Endocrinol Metab. 2013;24:431–441. doi: 10.1016/j.tem.2013.05.005. [DOI] [PMC free article] [PubMed] [Google Scholar]
- Swithers SE, Sample CH, Davidson TL. Adverse effects of high-intensity sweeteners on energy intake and weight control in male and obesity-prone female rats. Behav Neurosci. 2013;127:262–274. doi: 10.1037/a0031717. [DOI] [PMC free article] [PubMed] [Google Scholar]
- Sylvetsky AC, Blau JE, Rother KI. Understanding the metabolic and health effects of low-calorie sweeteners: methodological considerations and implications for future research. Rev Endocr Metab Disord. 2016;17(2):187–194. doi: 10.1007/s11154-016-9344-5. [DOI] [PMC free article] [PubMed] [Google Scholar]
- Tordoff MG, Alleva AM. Oral stimulation with aspartame increases hunger. Physiol Behav. 1990;47:555–559. doi: 10.1016/0031-9384(90)90126-O. [DOI] [PubMed] [Google Scholar]
- Wurtman RJ. Neurochemical changes following high-dose aspartame with dietary carbohydrates. N Engl J Med. 1983;309:429–430. doi: 10.1056/NEJM198308183090710. [DOI] [PubMed] [Google Scholar]
- Yang Q. Gain weight by “going diet? Artificial sweeteners and the neuro-biology of sugar cravings: Neuroscience 2010 Yale. J Biol Med. 2010;83:101–108. [PMC free article] [PubMed] [Google Scholar]