

Abstract
The maxi‐anion channels (MACs) are expressed in cells from mammals to amphibians with ~60% exhibiting a phenotype called Maxi‐Cl. Maxi‐Cl serves as the most efficient pathway for regulated fluxes of inorganic and organic anions including ATP. However, its molecular entity has long been elusive. By subjecting proteins isolated from bleb membranes rich in Maxi‐Cl activity to LC‐MS/MS combined with targeted siRNA screening, CRISPR/Cas9‐mediated knockout, and heterologous overexpression, we identified the organic anion transporter SLCO2A1, known as a prostaglandin transporter (PGT), as a key component of Maxi‐Cl. Recombinant SLCO2A1 exhibited Maxi‐Cl activity in reconstituted proteoliposomes. When SLCO2A1, but not its two disease‐causing mutants, was heterologously expressed in cells which lack endogenous SLCO2A1 expression and Maxi‐Cl activity, Maxi‐Cl currents became activated. The charge‐neutralized mutant became weakly cation‐selective with exhibiting a smaller single‐channel conductance. Slco2a1 silencing in vitro and in vivo, respectively, suppressed the release of ATP from swollen C127 cells and from Langendorff‐perfused mouse hearts subjected to ischemia–reperfusion. These findings indicate that SLCO2A1 is an essential core component of the ATP‐conductive Maxi‐Cl channel.
Keywords: anion channel, Maxi‐Cl, molecular entity, organic anion transporter, SLCO2A1
Subject Categories: Membrane & Intracellular Transport
Introduction
Rapid and efficient increases in anionic permeability are critical for cells to generate adequate response to environmental challenges. Anion‐selective channels with large unitary amplitude of over 300 pS are found in cells originating from virtually every part of whole body, including immune and cardiovascular system, placenta, gastrointestinal tract, kidney, and brain (Strange et al, 1996; Bell et al, 2003, 2009; Riquelme, 2009; Sabirov & Okada, 2009; Lazarowski, 2012; Sabirov et al, 2016). The maxi‐anion channels (MACs) are rarely seen in cell‐attached patches on resting cells, but can be activated in response to a variety of biologically relevant stimuli, such as cell swelling, ischemia or hypoxia, heat, and activation of various receptors by adenosine, endothelin, bombesin, bradykinin, or NK‐1 (Sabirov & Okada, 2009; Sabirov et al, 2016). Among different MACs reported so far, around 60% of channels described in original papers exhibit a phenotype designated as Maxi‐Cl having the following biophysical profile (Sabirov et al, 2016): (i) unitary conductance of 300–500 pS, (ii) linear and non‐rectifying current–voltage (I–V) relationship, (iii) strong discrimination for anions over cations with PCl/PNa of > 8, (iv) inactivation at voltages above ±20 mV, and (v) sensitivity to extracellular Gd3+ ions. In the present study, thus, we examined a possibility that there is a common core component for Maxi‐Cl which we named MAC‐1.
As a ubiquitous, abundantly expressed, and highly efficient anion‐transporting pathway, Maxi‐Cl is engaged in a number of fundamental cellular functions, including control of membrane potential (Sun et al, 1992), cell volume regulation (Schlichter et al, 1990), and fluid and solute transport (McGill et al, 1992). Recently, Maxi‐Cl was shown to provide a pathway for the release of ATP4− and MgATP2− involved in physiologically powerful purinergic signaling (Bell et al, 2003, 2009; Sabirov & Okada, 2005; Praetorius & Leipziger, 2009; Li et al, 2011; Lazarowski, 2012). Massive release of glutamate from ischemic astrocytes, which is a major cause of neurodegeneration, is also known to be induced by parallel activation of Maxi‐Cl and the volume‐sensitive outwardly rectifying (VSOR) anion channel (Liu et al, 2006).
In contrast to recent successful identification of TMEM16A/ANO1 as Ca2+‐activated Cl− channel, CaCC (Schroeder et al, 2008; Yang et al, 2008), and of LRRC8A as VSOR also called volume‐regulated anion channel (VRAC; Qiu et al, 2014; Voss et al, 2014; Pedersen et al, 2016), the molecular identity of Maxi‐Cl remains elusive (Dubyak, 2012). The plasmalemmal isoform of mitochondrial voltage‐dependent anion channel (VDAC; Dermietzel et al, 1994; Buettner et al, 2000), adenine nucleotide translocase (ANT; Brustovetsky & Klingenberg, 1996), and ttyh genes homologous to tweety in the Drosophila flightless locus (Suzuki & Mizuno, 2004) have been considered as potential candidates, but were eliminated by accumulating pharmacological and genetic evidence (Sabirov & Okada, 2005; Sabirov et al, 2006; Okada et al, 2009; Sabirov & Merzlyak, 2012).
In the present study, we adopted proteomics and genomewide approaches to identify the Maxi‐Cl protein, and the results show that SLCO2A1 is essentially involved in the activity of Maxi‐Cl. Single‐channel studies in reconstituted liposomes incorporated with recombinant SLCO2A1 and its mutant indicate that this protein is an essential core component of the Maxi‐Cl pore. An involvement of Slco2a1 in the ATP‐release pathway was evidenced by the suppressing effects of gene silencing in vitro and in vivo on the release of ATP from cultured mouse C127 cells challenged with hypoosmotic stress and from Langendorff‐perfused mouse hearts subjected to the ischemia–reperfusion injury, respectively.
The SLCO2A1 gene is known to encode the prostaglandin transporter PGT (Kanai et al, 1995) involved in a physiologically highly significant process of uptake and clearance of prostaglandins (Schuster, 1998, 2002; Schuster et al, 2015); its deficiency in mice leads to a failure of the ductus arteriosus to close after birth due to increased levels of extracellular prostaglandin E2 (PGE2; Chang et al, 2010); and in humans, mutations in SLCO2A1 gene are associated with pachydermoperiostosis (Sasaki et al, 2012; Seifert et al, 2012; Zhang et al, 2012, 2014) and enteropathy (Umeno et al, 2015; Hosoe et al, 2017). The Maxi‐Cl activity was found to be inhibited by three known PGT antagonists and suppressed by PGE2 per se. Thus, it appears that SLCO2A1 represents a double functional important protein serving as the prostaglandin transporter, PGT, and as the core component of ATP‐conducting Maxi‐Cl channel.
Results
Functional Maxi‐Cl is accumulated in the isolated bleb membrane
In our experience, the mammary C127 cell line exhibits the highest activity of Maxi‐Cl presumably containing thousands of channel proteins, because 10–20 single channels were detected in a membrane patch excised with a 2‐MΩ pipette (Sabirov et al, 2001). The C127 cell line was therefore selected as a source rich in this channel. When blebbing of the cell membrane was induced in C127 cells by suppressing the growth of actin filaments by treatment with latrunculin B (2.5 μM) followed by a strong hypoosmotic shock (16 mOsm/kg‐H2O), the MAC activity was found to be constitutively (without excision of patch membranes) activated in all the on‐bleb patches tested (Fig 1A). The currents exhibited the phenotypic properties of Maxi‐Cl such as a large single‐channel conductance (around 410 pS) with a linear I–V relationship (Fig 1B: filled circles), anion selectivity (Fig 1B: squares and triangles), voltage‐dependent inactivation (Fig 1C) with bell‐shaped voltage dependence of open probability (Fig 1D), and sensitivity to Gd3+ (Fig 1E).
Figure 1. Maxi‐Cl is constitutively active in membrane blebs, is functional after membrane protein fractionation of blebs and reconstitution into giant liposomes, and is sensitive to Gd3+ .
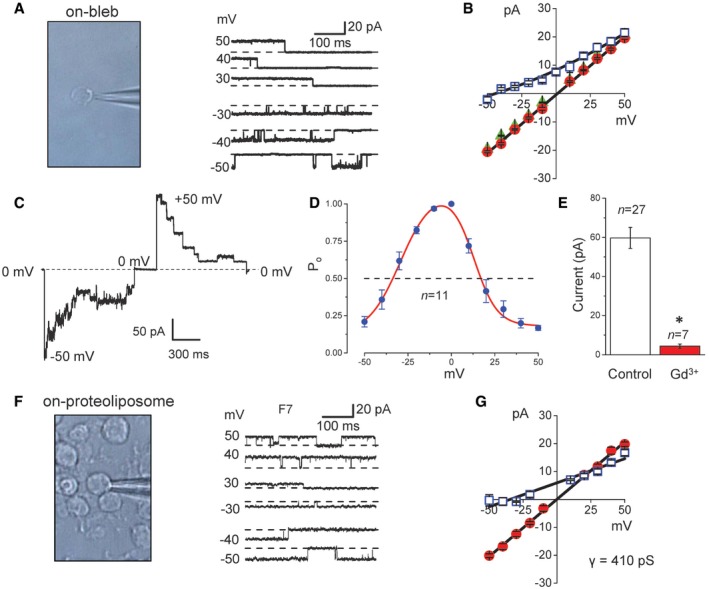
- The activity of Maxi‐Cl (right panel) recorded in a patch membrane on a single‐membrane bleb (left image).
- I–V relationships of Maxi‐Cl currents recorded on membrane blebs bathed in normal Ringer solution (circles) and in Ringer solution in which all NaCl was replaced with equimolar Na‐glutamate (squares). Patch pipettes were filled with normal Ringer solution (circles and squares) or NMDG‐Cl Ringer solution (triangles). Leftward shift of the reversal potential (by −44 mV) observed in Na‐glutamate conditions is indicative of anion selectivity. The slope conductance is 411 ± 6 pS in normal Ringer solution; n = 7–23 (circles), n = 6–48 (squares), and n = 11–18 (triangles) were obtained from four to five different patches.
- Representative record of the macro‐patch current inactivation at −50 mV and +50 mV in an excised membrane bleb patch; the dashed line corresponds to the zero‐current level.
- Voltage dependence of open probability for Maxi‐Cl in excised membrane bleb patches. Half‐maximal inactivation was observed at −35.1 ± 2.2 mV (n = 11) and +18.7 ± 2.8 mV (n = 11) in the negative and positive voltage ranges, respectively.
- Mean patch currents recorded at +25 mV from excised membrane blebs in the absence (Control: white column) and presence of Gd3+ (50 μM: red column) in the pipette solution. *P < 0.05 (Student's t‐test). n = 27 for Control (from 23 different bleb preparations) and n = 7 for Gd3+ (from three different bleb preparations).
- Maxi‐Cl activity (right panel) recorded on a single giant proteoliposome (left image) after reconstitution with the fraction‐7 (F7) derived from total bleb‐membrane proteins.
- I–V relationships of Maxi‐Cl activity for F7. Proteoliposomes were bathed in a reconstitution buffer supplemented with 1 mM CaCl2 and 1 mM MgCl2 (circles) and in buffer in which all KCl was replaced with equimolar K‐glutamate (squares). Leftward shift of the reversal potential by −37 mV is indicative of anion selectivity; n = 5–12 from five to six different patches. The slope conductance is 410 ± 7 pS under symmetrical conditions.
We then solubilized the total bleb‐membrane proteins with a mild detergent, n‐dodecyl β‐D‐maltoside (DDM) and subjected to liquid‐phase isoelectric focusing, which resulted in 10 fractions (Fig EV1A) with pI ranging from 3 to 10. When each fraction was reconstituted, after mostly removing DDM, into giant liposomes and assayed by patch‐clamping, we detected channel activity in seven fractions with maximal activity occurring in fraction #7 (F7) at pI = 8 (Fig EV1B). In the F7‐incorporated liposomes (Fig 1F: left panel), we observed constitutively active channel events (Fig 1F: right panel) with a large single‐channel conductance (around 410 pS) and a linear I–V relationship (Fig 1G: circles) as well as anion selectivity (Fig 1G: squares). In response to replacement of bath chloride with glutamate, the pattern of I–V curves observed in both blebs and proteoliposomes quickly changed, implying a rapid equilibration of the intra‐bleb and intra‐liposome electrolyte solution with that in bath. A leftward shift in the reversal potential by −44 mV for blebs (Fig 1B: squares) or by −37 mV for proteoliposomes reconstituted with the fraction #7 (Fig 1G: squares) suggests that the channel is anion‐selective with the permeability ratio Pglutamate/PCl of 0.11–0.14 which is close to the values hitherto reported for Maxi‐Cl in many cell types (Sabirov & Okada, 2009).
Figure EV1. Fractionation of the bleb‐membrane proteins.
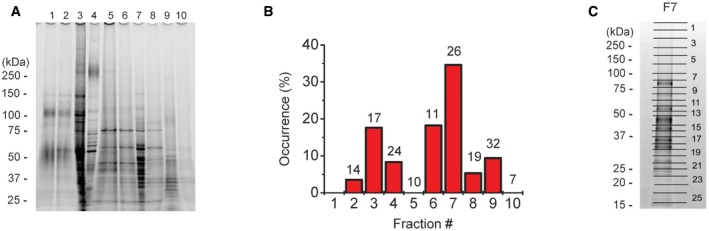
- SDS–PAGE electrophoresis of the protein fractions obtained after preparative liquid‐phase isoelectric focusing.
- Maxi‐Cl activity in each fraction after reconstitution into the giant liposomes. Number of patches tested is shown at the top of each column. No proteoliposomes could be formed using fraction‐1.
- The gel for F7 was divided into 26 pieces for the LC‐MS/MS analysis.
Source data are available online for this figure.
These results indicate that Maxi‐Cl is functionally active in membrane blebs and that even after solubilization and reconstitution into proteoliposomes the Maxi‐Cl molecule retains its function as an anion‐selective channel.
SLCO2A1 contained in the bleb membrane is involved in the function of Maxi‐Cl
To identify the protein(s) responsible for Maxi‐Cl, the proteins contained in the F7 were analyzed using proteomics. SDS–PAGE electrophoresis gel was subdivided into 26 bits (Fig EV1C), and then, proteins from each bit were extracted, trypsinized, and subjected to a nano‐LC‐MS/MS analysis, which yielded proteins coded by 439 genes in total (Dataset EV1). After removing the enzymes, cytoplasmic components, and other unrelated proteins, 93 genes remained for further consideration. To generate a prioritized list of genes for targeted siRNA screening, we next selected 15 genes encoding proteins with multiple transmembrane‐spanning domains including TMEM (transmembrane protein family), SLC (solute carrier family), and a tetraspanin family member (Appendix Table S1).
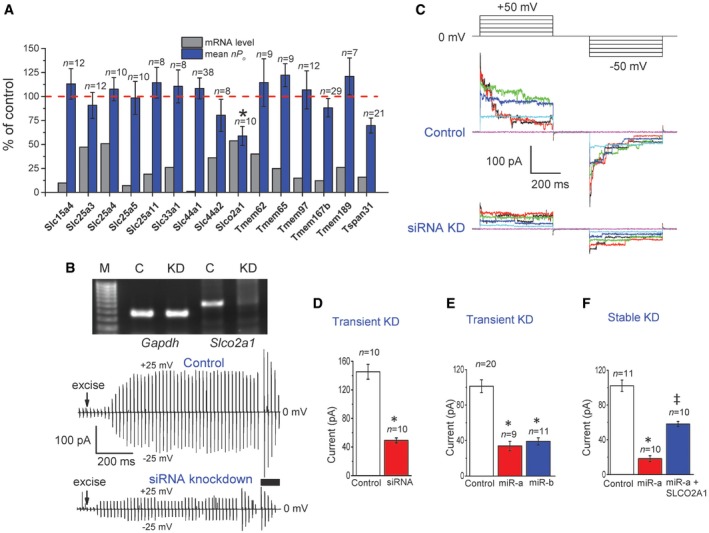
Among these 15 genes, only siRNA‐mediated silencing of SLCO2A1 (solute carrier organic anion transporter family member 2A1) gene reproducibly reduced the activity of Maxi‐Cl in C127 cells (Fig 2A–D). To confirm this result, we additionally silenced the expression of Slco2a1 using two types of microRNA (miR‐a and miR‐b) targeting two different sites of Slco2a1. Both constructs produced a profound decrease in the activity of Maxi‐Cl (Fig 2E). In a stable cell line generated with miR‐a, channel activity was more markedly depressed; however, the activity was significantly rescued by overexpression of the microRNA‐insensitive variant of Slco2a1 (Fig 2F). Thus, four different sequences targeting four different sites of Slco2a1 (two for siRNA and two for microRNA) suppressed the activity of Maxi‐Cl, the fact essentially excluding the possibility of off‐target action on an unrelated gene product. This level of current reduction and degree of gene knockdown paralleled with the ~40 and ~46% reduction shown in Fig 2A as well as ~66 and ~80% reduction in Fig 2B–D and ~82 and ~90% reduction in Fig 2F, respectively.
Figure 2. Silencing of the expression of SLCO2A1 gene downregulates Maxi‐Cl activity in C127 cells.
-
ARelative changes in the levels of mRNA and activity of Maxi‐Cl in inside‐out patches (mean nP o values are presented as the % of control) excised from C127 cells after siRNA‐mediated silencing for 15 targeted genes. Error bars, SEM, *P < 0.05 by Student's t‐test.
-
BThe expression of Slco2a1 mRNA detected by RT–PCR (top panel) and time courses of excision‐induced activation of Maxi‐Cl currents (lower panels). The Gapdh‐normalized signal of Slco2a1 in siRNA‐treated cells is 20 ± 7% of Control (n = 4).
-
CMaxi‐Cl activity in Control and siRNA‐treated cells after full activation (thick bar in B). The currents were elicited by step pulses from +50 mV to −50 mV in 10‐mV increments (pulse protocol shown at the top).
-
D–FMean patch currents at +25 mV in Control (n = 10, 20, and 11 for D–F, respectively) and Slco2a1‐targeting siRNA‐treated cells (D, n = 10), in cells treated with two different microRNAs, miR‐a (n = 9) and miR‐b (n = 11) (E), and in cells stably transfected with miR‐a alone (n = 10) and with miR‐a plus microRNA‐insensitive SLCO2A1 (n = 10) (F). The data from three to four different transfections for each value are pooled. Error bars, SEM. *P < 0.05 vs. Control, ‡ P < 0.05 vs. miR‐a. Student's t‐test is used for (D) and ANOVA for (E and F).
Source data are available online for this figure.
Since SLCO2A1 is known as a prostaglandin transporter (PGT), effects of the PGT substrate on the Maxi‐Cl activity were next tested. PGE2 (20 μM) partially but significantly suppressed Maxi‐Cl currents in C127 cells (Fig EV2A: left panel). This suppressive effect may be induced by competitive binding of PGE2 to the SLCO2A1, although the effect is relatively small, presumably because of less efficient substrate binding to SLCO2A1 in the channel conformation as Maxi‐Cl compared to the SLCO2A1 in the transporter conformation as PGT.
Figure EV2. Effects of PGE2 on single maxi‐anion currents and on swelling‐induced ATP release from C127 cells as well as effects of overexpression with SLCO2A1 and its mutants on swelling‐induced ATP release from HEK293T cells.
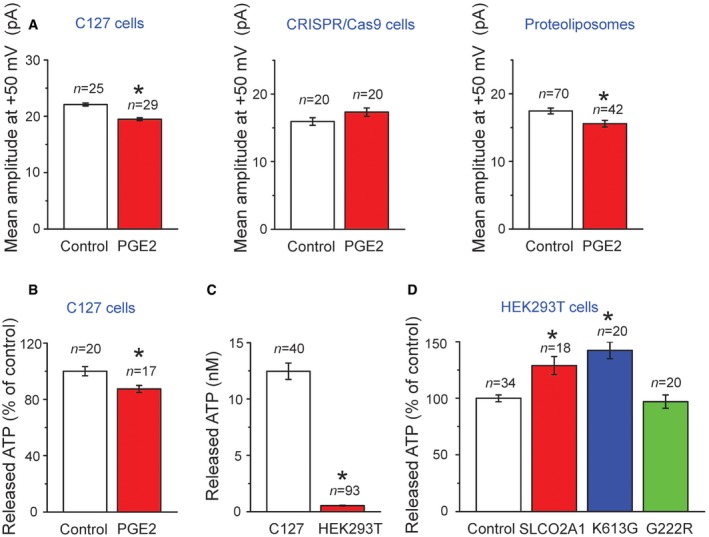
- Averaged single‐channel amplitudes recorded at +50 mV in patches excised from C127 cells (left graph, n = 25 for Control and 29 for PGE2), from CRISPR/Cas9 KO C127 cells (center graph, n = 20 for Control and 20 for PGE2), and from giant proteoliposomes with reconstituted recombinant SLCO2A1 protein (right graph, n = 70 for Control and 42 for PGE2) in the absence (Control) and presence of 20 μM PGE2 added to bath and pipette solutions. The data from 4 to 9 cells and 4 proteoliposomes for each value are pooled.
- Swelling‐induced ATP release from C127 cells in the absence (Control, n = 20) and presence of 20 μM PGE2 (n = 17). To test PGE2 effects, the cells were pre‐incubated with Ringer solution containing PGE2 and challenged with hypotonic medium containing PGE2.
- Comparison between the absolute level of the swelling‐induced ATP release from (n = 40) and that from HEK293T cells (n = 93).
- Swelling‐induced release of ATP from HEK293T cells transfected with mock (Control, n = 34)), WT SLCO2A1(n = 18) or with the mutants K613G (n = 20) and G222R (n = 20; see Appendix Table S2 for the expression vectors used here).
The prostaglandin transport activity of PGT is known to be blocked by bromosulfophthalein (BSP), bromocresol green (BCG), and indocyanine green (ICG; Kanai et al, 1995). BSP produced a reversible (Fig 3A), dose‐dependent (Fig 3B), and flickery (Fig 3C) inhibition of Maxi‐Cl activity in C127 cells with the IC50 value of around 7 μM at ±25 mV, which is comparable to that (5.8 μM) for the prostaglandin transport activity of recombinant PGT proteins expressed in HeLa cells (Kanai et al, 1995). The voltage‐independent inhibition of Maxi‐Cl channels by BSP may rule out the plug‐in open‐channel block mechanism which should be strongly voltage‐dependent. Flickery events of its inhibition possibly reflect the drug binding/unbinding events. Another known PGT blocker, BCG, similarly inhibited the activity of Maxi‐Cl in inside‐out patches with IC50 = 10.9 ± 1.2 μM (n = 5). Additionally, ICG reversibly inhibited Maxi‐Cl at 100 μM (n = 3), although the concentration–response studies could not be performed, because this drug was found to precipitate at high concentrations.
Figure 3. BSP exhibits a dose‐dependent inhibition of Maxi‐Cl in C127 cells.
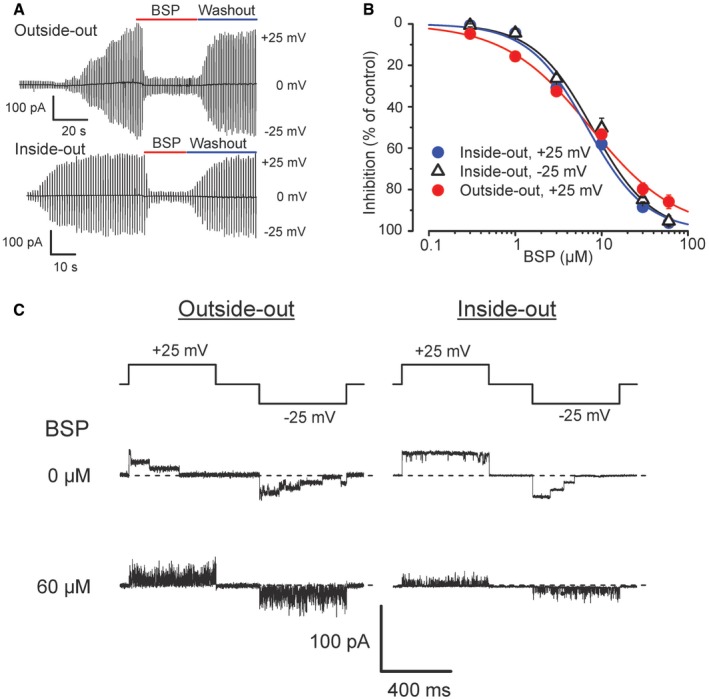
- A PGT inhibitor, BSP, reversibly blocks Maxi‐Cl currents in outside‐out and inside‐out patches.
- BSP effects are dose dependent with IC50 = 7.4 ± 0.5 and 7.8 ± 1.9 for inside‐out patches at +25 mV and −25 mV, respectively, and IC50 = 6.8 ± 0.6 μM for outside‐out patches at +25 mV (n = 5). Error bars, SEM.
- Flickery events recorded in the presence of BSP in excised patches at both +25 mV and −25 mV.
We employed CRISPR/Cas9 technology to eliminate the expression of SLCO2A1 in C127 cells (Fig 4A), which reduced the mean patch current to 14.5% (Fig 4B) with about 40% of patches showing no channel events (Fig 4C). Single‐channel studies showed that the Maxi‐Cl events observed in Control cells were completely eliminated by Slco2a1 knockout (KO) using CRISPR‐mediated genome editing. However, about 60% of the patches excised from Slco2a1‐KO cells exhibited the activity of only one or several channels of a non‐Maxi‐Cl type. These newly emerging channels showed considerably smaller unitary amplitude (Fig 4D) and discriminate poorly between anions and cations with the permeability ratio PCl/PNa as low as 2.5 ± 2.6 (cf. PCl/PNa = 17.7 ± 4.8 for Control; Fig 4E). This newly emerging channel in Slco2a1 KO cells was insensitive to PGE2 (Fig EV2A: center panel), although it exhibited sensitivity to Gd3+ (Fig EV3A) and BSP (Fig EV3B and C). Because no such non‐Maxi‐Cl‐type channel with a smaller unitary amplitude and poor anion/cation selectivity was detected in Control cells (see the upper histogram in Fig 4D), it is likely that Slco2a1 deficiency eliminated the normal Maxi‐Cl channel, but initiated channel activity with poor anion/cation selectivity. Taken together, it is concluded that SLCO2A1 is essentially involved in the native function of Maxi‐Cl in C127 cells.
Figure 4. CRISPR/Cas9‐mediated gene disruption eliminates Maxi‐Cl activity in C127 cells.
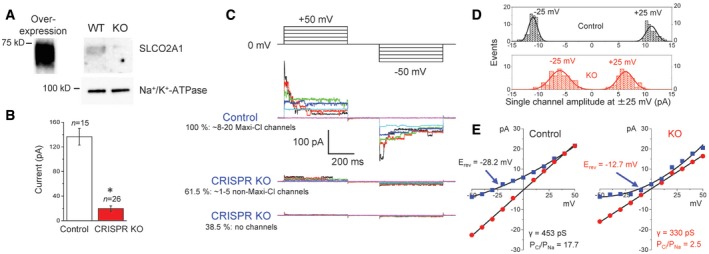
- Western blotting with anti‐SLCO2A1 antibodies; the ˜70‐kDa band is present in SLCO2A1‐overexpressing HEK293T and wild‐type (WT) C127 cells but absent in knockout (KO) C127 cells generated by the CRISPR/Cas9 technology. The data represent duplicate experiments.
- Mean patch currents at +25 mV in WT (Control) and KO cells. n = 15 for Control and 26 for CRISPR KO observed from different cells. Error bars, SEM, *P < 0.05 (Student's t‐test).
- The activity of Maxi‐Cl in Control and KO cells. Two representative records for KO correspond to two populations with no channel activity (bottom traces) and greatly reduced activity of different channels (middle traces).
- Single‐channel amplitude histogram in Control and KO cells. The distributions are significantly different at P < 0.05, as assessed by Kolmogorov–Smirnov test.
- I–V relationships for Maxi‐Cl activity in Control cells (left panel) and newly emerging channel events in KO cells (right panel). Circles: Bath and pipettes contained normal Ringer solution; squares: pipettes contained Ringer, and bath contained (in mM) 30 NaCl, 2 CaCl2, 1 MgCl2, 5 Na‐HEPES, 6 HEPES, and 240 mannitol. n = 7–29 (Control) and n = 3–38 (KO) from five to nine different patches.
Source data are available online for this figure.
Figure EV3. Gd3+ and BSP sensitivity of non‐Maxi‐Cl channels in SLCO2A1‐deficient cells.
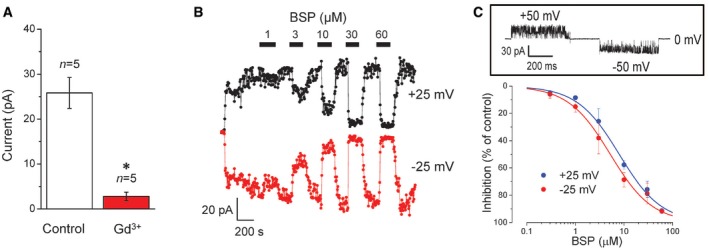
- Mean patch currents recorded at +25 mV in the outside‐out mode in the absence (Control: white column) and presence of Gd3+ (50 μM: red column) in the bath solution. Error bars, SEM, *P < 0.05 (Student's t‐test). n = 5 (from different cells) for Control and Gd3+.
- Dose‐dependent inhibitory effects of BSP (added at bars) on currents recorded from an inside‐out patch in response to a step‐pulse of ±25 mV applied every 5 s. Result of the representative experiment is shown.
- Concentration–response curves of BSP effects with IC50 = 8.3 ± 1.7 μM at +25 mV and 5.2 ± 0.4 μM at −25 mV. The inset on top shows flickery currents observed in the presence of 3 μM BSP. n = 5 for each data point (from five different experiments as shown on panel B). Error bars, SEM.
SLCO2A1 is an essential component of the Maxi‐Cl pore
When overexpressed in C127 cells, wild‐type (WT) SLCO2A1 and the charge‐neutralized mutants, K613G and R560N, which are known to impair the transporter function of SLCO2A1 (Chan et al, 2002), were largely localized in the peripheral region of the cells (Fig 5A). Importantly, in the K613G‐transfected cells, we observed a tangible reduction in the mean amplitude of the single‐channel current by 10.9 ± 1.5% at +50 mV and 13.0 ± 2.4% at −50 mV (Fig 5B–D: middle panels). A similar reduced single‐channel current was observed in the R560N mutant (Fig 5B–D: bottom panels). Although the Maxi‐Cl in K613G‐expressing cells closed with approximately the same rate as that in WT‐expressing cells in response to a +50‐mV test pulse (Fig 5E), the steady‐state inactivation was significantly less sensitive to positive voltages (Fig 5F). The effects of the R560N mutation on the channel gating kinetics were more profound: The Maxi‐Cl in R560N‐expressing cells closed significantly faster (Fig 5E) and was more sensitive to applied positive voltages than the channel in K613G‐mutant‐expressing cells (Fig 5F). These results suggest that charged residue of Arg560 is more sensitively involved in the electric field sensitivity of the inactivation gate than Lys613. The anion‐to‐cation selectivity was not significantly affected by these mutations, as evidenced by PCl/PNa of 15.6 ± 1.6, 16.7 ± 2.6, and 14.4 ± 2.1 (n = 5) for Control, K613G, and R560N, respectively. However, it must be pointed out that observed channel events in these cells do not represent pure mutant channels, because C127 cells express endogenous WT SLCO2A1 and thus K613G and R560N transfected in C127 cells possibly formed the channel by oligomerization with endogenous WT SLCO2A1 proteins.
Figure 5. Overexpression of the SLCO2A1 mutant reduces the unitary amplitude and modifies voltage‐dependent gating of the Maxi‐Cl in C127 cells.
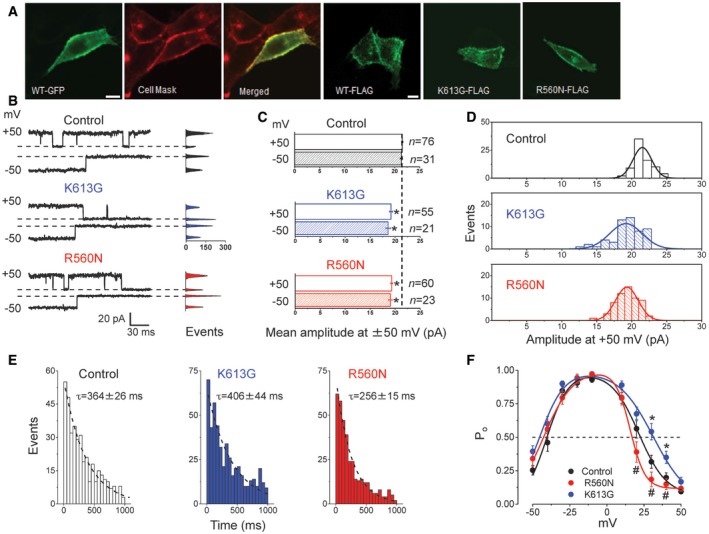
- Laser confocal images of live cells overexpressed with GFP‐tagged WT SLCO2A1 (first three images from the left) and of fixed cells overexpressed with FLAG‐tagged WT, K613G mutant, or R560N mutant proteins of SLCO2A1 (images four to six from the left). Scale bars, 10 μm. (See Appendix Table S2 for expression vectors used here.)
- Representative single‐channel events recorded at ±50 mV from mock‐transfected Control cells and cells transfected with the K613G or R560N mutant. Respective all‐points histograms are shown on the right of each trace; dashed lines correspond to the respective zero‐current level.
- Average single‐channel amplitudes recorded at +50 mV (empty bars) and −50 mV (hatched bars) in these cells. Error bars, SEM. *P < 0.05 (Student's t‐test). n = 76 and 31 for Control, n = 55 and 21 for K613G, and n = 60 and 23 for R560N at +50 mV and −50 mV, respectively. The data from at least five different patches are pooled.
- Single‐channel amplitude histogram in mock‐transfected Control cells and in cells transfected with the K613G or R560N mutant. The total number of events is indicated on the respective bars in (C). The distributions for mutant‐transfected cells are significantly different from that in Control as assessed by ANOVA with a Bonferroni correction (P = 5.8 × 10⁻¹² and P = 2.4 × 10⁻¹¹ for K613G and R560N vs. Control, respectively).
- Distribution of the first latency time (a time from the onset of a +50 mV test pulse and channel closure) for Maxi‐Cl in mock‐transfected Control cells (n = 388) and in cells transfected with the K613G (n = 498) or R560N (n = 370) mutant. Dashed lines are single‐exponential fits with indicated time constants. The distribution for R560N is different from that of Control and from that of K613G at P < 0.05, as assessed by nonparametric Kolmogorov–Smirnov test.
- Voltage dependence of open probability for Maxi‐Cl in mock‐transfected Control cells and in cells transfected with the K613G or R560N mutant. Error bars, SEM. *P < 0.05 between Control and K613G; # P < 0.05 between R560N and K613G; n = 14−20 for five different patches, tested by ANOVA.
HEK293T cells do not express SLCO2A1 and thus lack the endogenous Maxi‐Cl activity. When HEK293T cells were transfected with SLCO2A1, the protein was largely localized in the peripheral region of the cells that was stainable with a plasma membrane dye, CellMask™ Orange Plasma Membrane Stain (CellMask; Fig 6A). Whereas mock‐transfected control HEK293T cells never exhibited Maxi‐Cl activity (Fig 6B and C: Control), 10 of the 25 patches excised from SLCO2A1‐overexpressing cells exhibited channel activation upon excision (Fig 6B and C: SLCO2A1), which was sensitive to BSP (Fig 6D). Current responses to step‐pulse stimulation occasionally revealed single‐channel events with the unitary amplitude (Fig 6E and F) and I–V relationship (Fig 6G: red circles) typical to those of Maxi‐Cl, indicating that heterologous SLCO2A1 acts as an essential pore‐related component of Maxi‐Cl. In the HEK293T expression system, the charge‐neutralized and PGT function‐impairing mutant, K613G, generated markedly reduced macro‐patch currents (Fig 6C: blue column), with a markedly reduced single‐channel conductance (Fig 6G: blue circles), reflecting a decrease in the total positive charge inside the lumen of the channel. The K613G channels became relatively more selective to cations, because under a NaCl gradient, the reversal potential shifted, in a rightward direction, by 8.9 ± 1.5 mV, corresponding to PNa/PCl = 1.9 ± 0.2 (Fig 6G: blue triangles). When all NaCl in the pipette Ringer solution was equimolarly replaced with NMDG‐Cl, we observed a leftward shift of the reversal potential for the K613G currents by −6.1 ± 2.2 mV (Fig 6G, green triangles), again suggesting that the mutant channel conducts cations including not only Na+ but also NMDG+ (PNMDG/PCl = 1.2 ± 0.2 by assuming PNa/PCl = 1.9), which has an effective radius (~0.44 nm) considerably smaller than that of the narrowest part of the Maxi‐Cl pore (R ~0.55–0.75 nm: see Sabirov et al, 2016). On the other hand, two SLCO2A1 mutants, G222R and P219L, which are known to be associated with pachydermoperiostosis (Zhang et al, 2012, 2014), produced no evident channel activity (n = 14 for each mutant), despite their successful expression in the peripheral region including the plasma membrane of the cells (Fig EV4). These results strongly suggest that the recombinant SLCO2A1 protein serves as the core component or the pore of Maxi‐Cl channel.
Figure 6. Emergence of Maxi‐Cl activity in Maxi‐Cl‐deficient HEK293T cells by heterologous expression of SLCO2A1 protein and changes in the pore properties by the charge‐neutralized mutation.
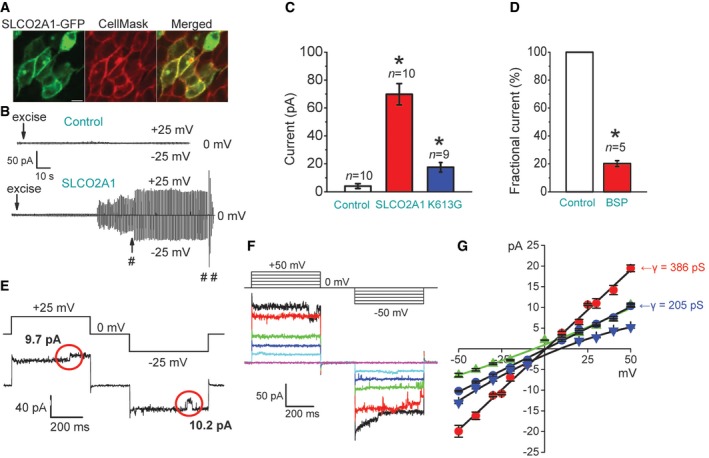
- Plasma membrane expression of the recombinant GFP‐tagged SLCO2A1 protein in transfected cells stained with CellMask™ Orange Plasma Membrane Stain (CellMask) and observed under a laser confocal microscope; scale bar, 10 μm.
- Time courses of the currents recorded in cells after control mock transfection (upper trace) and after overexpression of Slco2a1 (lower trace). Symbols # and ## indicate the time points at which the currents shown in (E) and (F), respectively, were recorded.
- Mean patch currents recorded at +25 mV in control mock‐transfected, Slco2a1‐transfected, and K613G‐transfected cells. Error bars, SEM, *P < 0.05 (ANOVA). n = 10 for Control (from four different mock transfections) and n = 10 for SLCO2A1 (from four different gene transfections), and n = 9 for K613G (from five different gene transfections). Only patches displaying current activation were counted (the total number of tested patches is 25 for WT and 17 for mutant).
- Effect of BSP (50 μM) on the mean patch currents recorded at +25 mV in Slco2a1‐transfected cells. The result is expressed as a fractional current relative to the control level recorded immediately before application of the drug. Error bars, SEM, *P < 0.05 (Student's t‐test). n = 5 from different cells.
- Single Maxi‐Cl events recorded in Slco2a1‐transfected cells. The red circles mark stepwise channel events with large amplitudes.
- Maxi‐Cl activity recorded upon application of step pulses (protocol shown at the top) after full current activation in a macro‐patch excised from Slco2a1‐transfected cells.
- I–V relationship of single‐channel currents recorded in inside‐out patches excised from cells after overexpression of WT SLCO2A1 or K613G. The slope conductance (γ) is 386 ± 7 pS for WT SLCO2A1 (red circles) and 205 ± 5 pS for K613G (blue circles) under symmetrical NaCl‐rich conditions. The reversal potential was shifted in a positive direction when the NaCl concentration in bath Ringer solution was reduced from 150 to 30 mM (blue triangles), but it was shifted in a negative direction when pipettes were filled with NMDG‐Ringer solution (green triangles). Each symbol represents the mean of 3–7 observations obtained from five different patches. Error bars, SEM.
Figure EV4. Localization of GFP‐tagged G222R mutant (upper row) and P219L mutant (lower row) proteins.
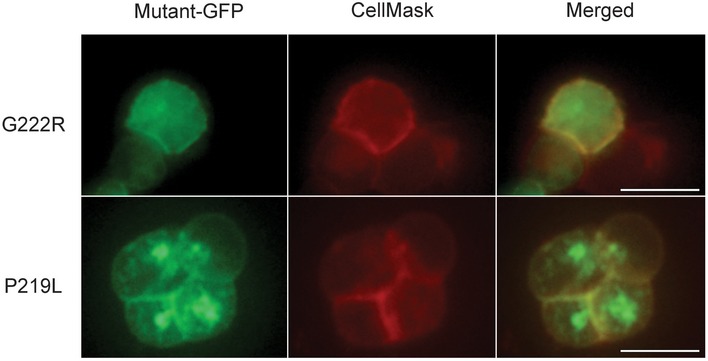
Mutant‐transfected HEK293T cells were stained with CellMask™ Orange Plasma Membrane Stain (CellMask) and observed under a fluorescence microscope; scale bars, 10 μm.
To firmly confirm the involvement of the SLCO2A1 protein in the pore formation of Maxi‐Cl, we reconstituted the purified proteins. The recombinant proteins were prepared from HEK293T cells transfected with FLAG‐tagged Slco2a1 (Fig 7A and B). The purified proteins, when reconstituted into giant proteoliposomes, exhibited the activity of Maxi‐Cl (Fig 7C and D). The I–V relationship of Maxi‐Cl activity of the recombinant SLCO2A1 protein was not affected by replacing sodium ions in the pipette solution with NMDG+ (Fig 7D: blue circles), indicating anion selectivity of the channel. Under a KCl gradient (150 mM pipette/30 mM bath), the reversal potential shifted by −27.3 mV (Fig 7D: green circles), corresponding to PCl/PK = 9.3. In the reconstituted system, the charge‐neutralized K613G mutation again decreased the slope conductance of single‐channel currents by 27%, and the reversal potential shifted by −5.8 ± 2.4 mV with NMDG+‐based pipette solution (Fig 7D: red circles), indicating that, just as the case of the mutant expressed in HEK293T cells, the mutant channel in proteoliposomes became more permeable to cations with exhibiting a smaller single‐channel conductance.
Figure 7. Recombinant SLCO2A1 proteins exhibit Maxi‐Cl channel activity in reconstituted giant proteoliposomes.
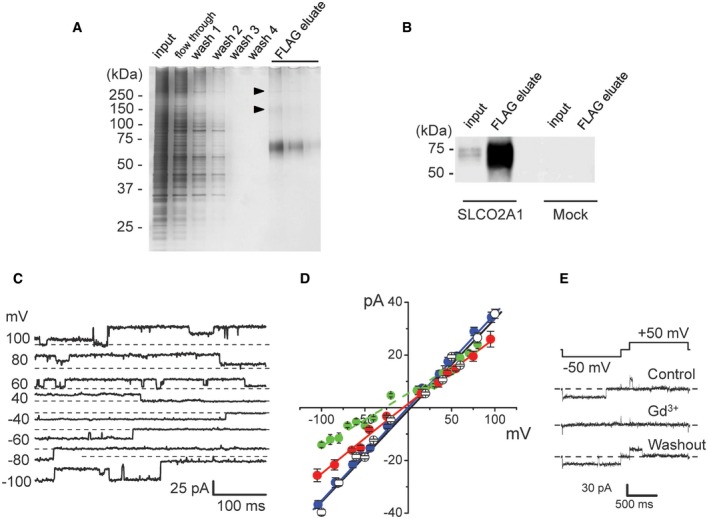
- SDS–PAGE electrophoresis at the different purification stages for FLAG‐tagged SLCO2A1 proteins prepared from transfected HEK293T cells: wash 1, 2, 3, and 4 correspond to consecutive elution with wash buffer; three lanes for FLAG eluates correspond to consecutive elution with the FLAG peptide. Arrowheads point at faint protein bands.
- Western blotting with anti‐FLAG antibodies: The protein band corresponding to ˜70 kDa (which is close to 70,147 Da calculated from the amino acid sequence) is present in the total cell lysate of Slco2a1‐transfected cells, highly concentrated in the pooled FLAG eluate and absent in that of mock‐transfected cells.
- Maxi‐Cl activity recorded on giant proteoliposomes after reconstitution of the recombinant SLCO2A1 protein.
- I–V relationships of Maxi‐Cl activity recorded after reconstitution of the WT SLCO2A1 (white, blue, and green circles) or the K613G mutant (red circles). Recordings were obtained using normal Ringer solution in the bath and pipettes (white symbols), with normal Ringer solution in the bath and Ringer solution in which all Na+ ions were replaced with equimolar NMDG+ in pipettes (blue and red symbols), or under a KCl gradient (green symbols: 150/30 mM pipette/bath supplemented with 1 mM CaCl2 and 11 mM HEPES–KOH, pH 7.4). Error bars, SEM. For green symbols: The reversal potential for WT SLCO2A1 of −27.3 mV corresponds to PCl/PK = 9.3. The slope conductance for K613G (258 ± 5 pS) is significantly smaller than that for WT (354 ± 4 pS) at P < 0.05, and its reversal potential slightly shifted in a negative direction (red symbols). n = 3–15 from five different patches (see Appendix Table S2 for expression vectors used here.)
- Reversible blocking of WT SLCO2A1‐associated Maxi‐Cl activity in the giant proteoliposomes by 50 μM Gd3+. The data represent the results of five experiments.
Source data are available online for this figure.
The reconstituted channel activity was partially but significantly suppressed by 20 μM PGE2 (Fig EV2A: right panel) and reversibly blocked by 50 μM Gd3+ (Fig 7E), the only blocker that distinguishes MACs from other volume‐related anion channels such as CFTR, VSOR, and the acid‐sensitive outwardly rectifying anion channel (ASOR; Hazama et al, 2000; Sabirov et al, 2001; Sato‐Numata et al, 2016). In contrast, BSP did not affect the reconstituted channel at 30–100 μM (n = 9). Thus, it is likely that the inhibitory effect of BSP on the native channel is indirect and possibly mediated by an auxiliary protein which is absent in the reconstitution system. In agreement with this inference, we found that the non‐Maxi‐Cl channels which newly emerged in SLCO2A1‐deficient C127 cells were also sensitive to BSP (Fig EV3B and C).
In contrast to the above channel events in the proteoliposomes reconstituted with SLCO2A1 and its K613G mutant, the Maxi‐Cl events and even any Maxi‐Cl‐like activity were never detected in control experiments, where the same purification–reconstitution procedures were performed with mock‐transfected control HEK293T cells (n = 25), with the cells transfected with FLAG‐tagged LRRC8A protein (n = 25) which is known to be the necessary but not sufficient component of the VSOR anion channel or VRAC (Qiu et al, 2014; Voss et al, 2014; Okada et al, 2017), or with the cells transfected with FLAG‐tagged SLC3A2 protein (n = 15) which is a beta‐subunit of the large neutral amino acid transporter (Wagner et al, 2001). These control experiments clearly proved that the observed channel activity is specific for the SLCO2A1 protein. Taken together, it is concluded that SLCO2A1 constitutes the core component or the pore of Maxi‐Cl channel.
SLCO2A1 provides the pathway for ATP release induced by cell swelling and ischemia–reperfusion
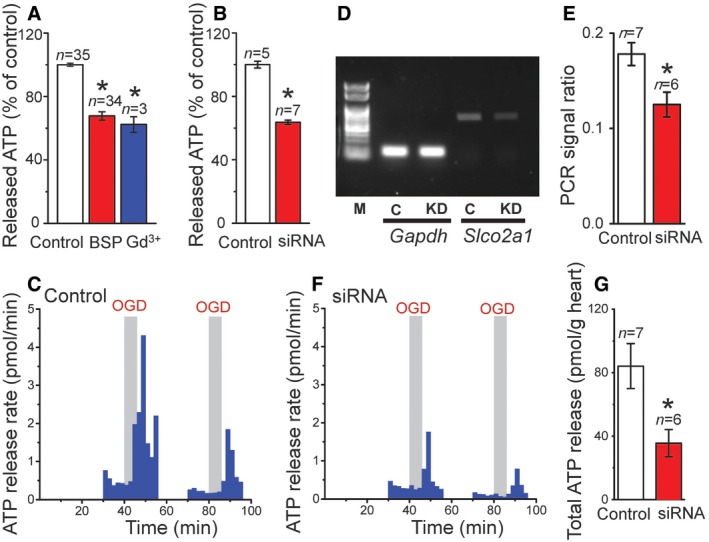
Maxi‐Cl was shown to serve as the principal, although not sole, pathway for ATP release from osmotically swollen C127 cells (Sabirov et al, 2001). Both BSP and Slco2a1 siRNA significantly suppressed the hypotonicity‐induced release of ATP from C127 cells (Fig 8A and B). The Maxi‐Cl inhibitor, Gd3+, reduced the release of ATP (Fig 8A) approximately to the same extent as did BSP and siRNA. The PGT substrate, PGE2, partially but significantly suppressed the release of ATP (Fig EV2B). The extent of suppressive effect of PGE2 on ATP release is similar to those on the native Maxi‐Cl current (Fig EV2A: left panel) and on the reconstituted channel activity in giant proteoliposomes (Fig EV2A: right panel) but not the non‐Maxi‐Cl channels in SLCO2A1‐deficient cells (Fig EV2A: center panel). HEK293T cells have no endogenous Maxi‐Cl activity and displayed much less ATP release in response to the hypoosmotic stress compared to the C127 cells (Fig EV2C). A trace of swelling‐induced ATP release from mock‐transfected HEK293T cells may be mediated by some pathways other than Maxi‐Cl, such as pannexins, connexins, and exocytosis (Dubyak, 2012). Heterologous expression of SLCO2A1 and the K613G mutant significantly augmented the swelling‐induced release of ATP from HEK293T cells (Fig EV2D). The relative effects of the gene expression on ATP release were less compared to the effects on the channel activity (Fig 6C), because 10 times less amount of the plasmid was transfected for ATP‐release experiments to avoid deteriorating effects of SLCO2A1 overexpression observed with higher DNA doses (see Appendix Supplementary Methods), and also because ATP release was performed with cell monolayers which contained not only GFP‐positive but also GFP‐negative cells, whereas patch‐clamp recordings were made only from GFP‐positive or well gene‐transfected cells. No decrease in ATP release was observed for the K613G mutant compared to WT SLCO2A1 (Fig EV2D); this was probably because of slightly elevated P o values (Fig 5F) which may counteract the decreased channel conductance (Fig 7D: red circles). Importantly, ATP release was not increased by heterologous expression of the G222R mutant (Fig EV2D) which is non‐functional as the Maxi‐Cl channel.
Figure 8. SLCO2A1 is involved in the release of ATP from C127 cells in vitro and from perfused mouse hearts in vivo .
-
A, BEffects of 50 μM BSP (n = 34) and 50 μM Gd3+ (n = 3) (A) and of Slco2a1‐targeting siRNA (n = 7) (B) on the swelling‐induced release of ATP from C127 cells. In (A), Control cells were treated with vehicle (n = 35); and in (B), Control cells were transfected with non‐targeting siRNA (n = 5). Error bars, SEM, *P < 0.05 (ANOVA).
-
CTime courses of ATP release from hearts to the coronary effluent induced by two consecutive rounds of oxygen–glucose deprivation (OGD) followed by reperfusion with oxygenated glucose‐containing Tyrode solution. The heart was isolated from a mouse injected in vivo with non‐targeting scrambled siRNA (Control).
-
DExpression of Slco2a1 and Gapdh mRNAs in the hearts dissected from mice injected with scrambled siRNA (Control: C) and Slco2a1‐targeting siRNA (siRNA knockdown: KD). Representative results of tetraplicate RT–PCR analyses.
-
EMean values of normalized expression level of Slco2a1 (Slco2a1/Gapdh) in the hearts from control animals (Control: white column, n = 7) and in the hearts from test animals (siRNA: red column, n = 6). Error bars, SEM, *P < 0.05 (Student's t‐test).
-
FSame experiment as in (C), but the heart was isolated from a mouse injected in vivo with Slco2a1‐targeting siRNA (siRNA). The level of SLCO2A1 mRNA in this heart was 54% of that in the counterpart mouse injected with scrambled siRNA.
-
GOGD/reperfusion‐induced release of ATP from the hearts of Control animals (n = 7) and animals treated with Slco2a1‐targeting siRNA (n = 6). The mean values ± SEM (bars) are shown for the mass‐normalized total amount of released ATP during 6‐min reperfusion after the first round of OGD. Error bars, SEM, *P < 0.05 (Student's t‐test).
Source data are available online for this figure.
In the isolated Langendorff‐perfused adult mouse heart, the coronary effluent ATP release started 2–3 min after the oxygen–glucose deprivation (OGD), and the release rate reached 4 pmol/min immediately after reperfusion with oxygenated glucose‐containing Tyrode solution (Fig 8C). However, when the Slco2a1 expression in the mice was partially silenced by thrice injections of 40 μg siRNA (3–1 days before dissection of the hearts) in vivo via the tail vein (Fig 8D and E), the OGD/reperfusion‐induced release of ATP became significantly lesser (Fig 8F) compared to that in the hearts isolated from control animals injected with non‐targeting siRNA (Fig 8C and G). These results indicate that SLCO2A1 serves as the ATP‐release pathway in cultured C127 cells in vitro and in Langendorff‐perfused mouse hearts in situ.
Discussion
SLCO2A1 fulfills multiple criteria for being an integral core component of the Maxi‐Cl complex, MAC‐1. First, reducing Slco2a1 expression by gene silencing led to a profound decrease in Maxi‐Cl activity in C127 cells, whereas reintroduction of Slco2a1 restored the activity. Second, eliminating SLCO2A expression by CRISPR/Cas9 technology abolished Maxi‐Cl single‐channel activity in C127 cells. Third, overexpression of the SLCO2A1 charge‐neutralized and PGT function‐impairing mutants, K613G and R560N, considerably decreased the unitary current amplitude of Maxi‐Cl in C127 cells and significantly altered its voltage‐dependent inactivation compared with those of WT. Fourth, a substrate, PGE2, and blocker for the PGT function of SLCO2A1 produced suppression and flickery block, respectively, of the Maxi‐Cl currents in C127 cells. Fifth, when reconstituted into proteoliposomes, purified SLCO2A1 proteins exhibited PGE2‐sensitive activity in the Maxi‐Cl channel, whereas the disease‐causing mutants, G222R and P219L, were non‐functional. Sixth, when Slco2a1 was transfected into HEK293T cells which do not express SLCO2A1 and endogenous Maxi‐Cl activity, Maxi‐Cl single‐channel events became activated. Seventh, when transfected into HEK293T cells or reconstituted into proteoliposomes, the charge‐neutralized and PGT function‐impairing mutant, K613G, reversed anion‐to‐cation selectivity with exhibiting a markedly smaller single‐channel conductance. The fifth to seventh criteria indicate that SLCO2A1 proteins constitute the pore of Maxi‐Cl. Maxi‐Cl in membrane blebs as well as the channel reconstituted from isolated bleb proteins and recombinant SLCO2A1 proteins in giant proteoliposomes were all in a constitutively active state. This suggests that the whole Maxi‐Cl complex natively contains or is associated with regulatory components such as kinases and phosphatases (Toychiev et al, 2009). Additionally, voltage‐dependent Maxi‐Cl inactivation in SLCO2A1‐transfected HEK293T cells was not as robust as that in C127 cells (Figs 6F cf. 2C and 4C: Control), suggesting that some endogenous component(s) modulating inactivation may be different between HEK293T and C127 cells.
Eliminating the SLCO2A1 gene by CRISPR/Cas9 technology abolished the activity of the channel in the normal Maxi‐Cl phenotype, but instead initiated sporadic activity of non‐Maxi‐Cl‐type ion channel with a smaller unitary amplitude and poor anion/cation selectivity. The former result indicates that SLCO2A1 is a core component of Maxi‐Cl (here designated MAC‐1) which is a most predominant type of MAC (Sabirov et al, 2016). Conversely, the latter result suggests that certain genes, such as Slco2a1 paralogs, involved in non‐Maxi‐Cl‐type channels with poor anion/cation selectivity, can be upregulated in Slco2a1 KO cells. It is also possible that when Slco2a1 is knocked out, an orphaned channel subunit could combine with other membrane protein(s), resulting in the formation of a new channel. Actually, the non‐Maxi‐Cl channels in SLCO2A1‐deficient cells were insensitive to PGE2. This result, in conjunction with PGE2 sensitivity of the native Maxi‐Cl channel and of the reconstituted SLCO2A1 channel, supports the notion that SLCO2A1 per se constitutes the core component of Maxi‐Cl channel. However, the activity of non‐Maxi‐Cl channels was found to be blocked by BSP with half‐maximal efficiency similar to that of native Maxi‐Cl channels. In HeLa cells, the Maxi‐Cl‐unrelated anion channel, VSOR, was found to be also sensitive to BSP (at 10–50 μM: Sabirov and Okada, unpublished data), suggesting that the two types of channels coded by different genes share a BSP‐sensitive component which is different from SLCO2A1. Consistent with this idea, the Maxi‐Cl activity reconstituted with recombinant SLCO2A1 into the proteoliposomes was totally insensitive to BSP. The voltage‐independent flickery events observed with native Maxi‐Cl channels as well as with non‐Maxi‐Cl channels in SLCO2A1‐deficient cells, probably, reflect the binding/unbinding process on a BSP‐sensitive regulatory component rather than an open‐channel block which must be strongly voltage‐dependent. It is noteworthy that Gd3+ effectively suppressed not only the native and recombinant Maxi‐Cl channels but also non‐Maxi‐Cl channels in SLCO2A1‐deficient cells. Also, it must be noted that MAC activity in mouse B cells, which is distinct from Maxi‐Cl in lacking voltage‐dependent inactivation kinetics and with exhibiting smaller unitary conductance (270 pS), was found to be sensitive to Gd3+ (Nam et al, 2006). On the other hand, the VSOR, CFTR, and ASOR anion channels are known to be Gd3+‐insensitive (Hazama et al, 2000; Sabirov et al, 2001; Sato‐Numata et al, 2016). Taken together, it is conceivable that Gd3+ is specific for the MACs among anion channels but cannot discriminate between different subtypes of MACs.
The SLCO2A1 broadens the list of bimodal channel/transporter proteins, which includes ClC family proteins functioning as Cl− channels and Cl−/H+ exchangers (Picollo & Pusch, 2005; Scheel et al, 2005), SLC1As serving as excitatory amino acid transporters (EAATs) and anion channels (Fahlke et al, 2016), and SLC26A3/6 serving as Cl− channels and anion exchangers under certain conditions (Ohana et al, 2009). These facts suggest that a similar structure is present both in slow‐cycling but selective transporters and less selective but highly efficient ion‐conducting channels.
Gene silencing of Slco2a1 suppressed swelling‐induced release of ATP from C127 cells and ischemia/reperfusion‐induced release of ATP from adult mouse hearts. Thus, Maxi‐Cl encoded by Slco2a1 represents the long‐sought ATP‐conductive anion channel (Dubyak, 2012). The effective radius of ATP molecule (0.57 nm; Sabirov & Okada, 2004) is comparable to that of prostaglandin E (0.55 nm) estimated by molecular modeling. We therefore hypothesized that SLCO2A1 may function in two modes: as a prostaglandin transporter in the resting state and as an anion channel in the activated state under hypoosmotic or ischemia–reperfusion stress. With this notion in mind, it is suggested that PGE2, ATP, and chloride share the same pathway. To visualize such possibility, we built a homology model of SLCO2A1 protein (Fig EV5) using I‐TASSER algorithm (Yang et al, 2015). The overall shape of this structure is similar to that obtained previously using the SWISS‐MODEL engine (Zhang et al, 2012). In the model, the residue R560 is located right on the central axis of the protein. This fact might be related to the present result that voltage sensitivity of the inactivation kinetics was affected by the charge‐neutralized mutation of this residue, R560N. Two residues, G222 and P219, which are mutated in pachydermoperiostosis (Zhang et al, 2012, 2014), are also close to the axis. This fact may account for why no channel activity was observed in HEK293T cells transfected with these disease‐causing mutants despite their successful expression in the periphery region including the plasma membrane of the cells (Fig EV4). Since the model was built using the crystal structure of the glycerol‐3‐phosphate transporter as a template, it most likely represents the “inward‐open”‐like transporter conformation state of SLCO2A1 as PGT. The K613 location is more distant from the central axis, but the following results suggest that in the open‐channel conformation of SLCO2A1 as Maxi‐Cl, the K613 residue may move closer toward the pore axis and thereby participating in the selectivity filter. Its neutralization (K613G) led to a change in anion‐to‐cation selectivity (Fig 6G: blue and green triangles; and Fig 7D: red circles) with inducing a decrease in the single‐channel conductance (Fig 6G: blue circles; and Fig 7D: red circles). Before making more precise structural discussion about the pore construction, however, it must be determined whether the Cl−‐conducting pathway is located within the single SLCO2A1 protein or between plural SLCO2A1 proteins in an oligomeric structure. Overexpression of the K613G mutant in C127 cells produced channels with the single‐channel amplitude less than that of the native Maxi‐Cl (Fig 5B–D) but higher than that observed upon overexpression of the same mutant in HEK293T cells lacking the endogenous SLCO2A1 (Fig 6G: blue circles). This fact suggests that the mutant protein may have combined with the endogenous WT SLCO2A1 in C127 cells, yielding channels with intermediate amplitudes, as evidenced by the broad distribution shown in Fig 5D (middle panel). Protein oligomerization could be actually detected on the non‐reducing SDS–PAGE gel as faint protein bands with a molecular mass approximately twice and thrice of the monomer (see arrowheads in Fig 7A). However, more elaborate structure‐functional analysis will be necessary to clarify the true Maxi‐Cl channel construction.
Figure EV5. Homology model of the wild‐type SLCO2A1 protein.
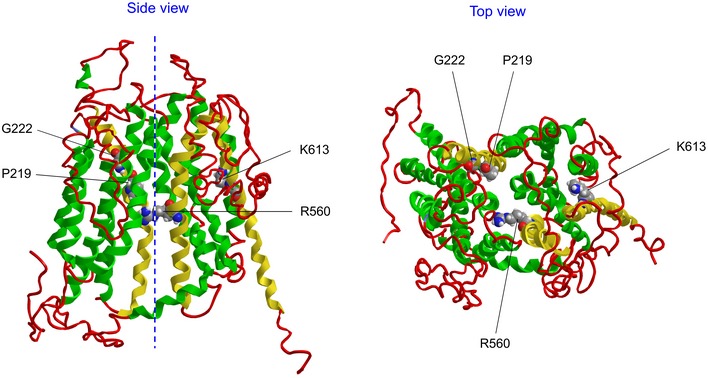
- The model was built using I‐TASSER (Iterative Threading ASSEmbly Refinement) server (http://zhanglab.ccmb.med.umich.edu/I-TASSER/). The server selected the crystal structure of the glycerol‐3‐phosphate transporter from Escherichia coli (PDB ID: 1PW4A) as the best template.
- A Side view. The dashed line marks the central axis of the molecule. Amino acids for the mutations which are discussed in the text are highlighted and indicated. The transmembrane helixes bearing these amino acids are colored in yellow. Other helixes are shown in green.
- Top view.
Cellular release of ATP is a key event in powerful purinergic signaling, which takes place in most animal tissues (Burnstock, 2012); however, how ATP is released is highly disputed at present. It has been reported that non‐vesicular conductive release of ATP is mediated by two groups of ion channels (Sabirov & Okada, 2005; Praetorius & Leipziger, 2009; Li et al, 2011; Lazarowski, 2012; Taruno et al, 2013; Sanderson et al, 2014): (i) connexin and pannexin hemichannels, CALHM1, and P2X7, which are all non‐selective cation channels, and (ii) volume‐regulated anion channels including Maxi‐Cl. Maxi‐Cl serves as the principal, though not sole, pathway for swelling‐induced release of ATP from C127 cells (Sabirov et al, 2001) and for ischemia/hypoxia‐induced release of ATP from neonatal (Coulombe & Coraboeuf, 1992; Dutta et al, 2004) and adult (Dutta et al, 2008) cardiomyocytes. This study provides evidence that Slco2a1 encodes the ATP‐conductive Maxi‐Cl molecule in swollen C127 cells and in the hearts subjected to ischemia–reperfusion.
The expression of SLCO2A1 has been demonstrated in multiple tissues and organs such as the brain, heart, lung, liver, gastrointestinal tract, kidney, and eye (Kanai et al, 1995; Chang et al, 2010), where the activity of Maxi‐Cl has also been detected (Sabirov et al, 2016). The prostaglandin‐transporting function of SLCO2A1 is well characterized (Schuster, 1998, 2002; Schuster et al, 2015). Our present findings indicate that the roles of SLCO2A1 are not confined to prostaglandin metabolism. Released ATP is known to play a protective role in ischemia/reperfusion heart injury (Ninomiya et al, 2002; Wee et al, 2007); it is therefore possible that the development of SLCO2A1 activators may be a new therapeutic strategy for preventing the damage caused by myocardial infarction.
The present study solved a long‐lasted enigma of the molecular identity of the Maxi‐Cl channel and provided molecular evidence that this Maxi‐Cl molecule serves as a pathway for the release of ATP from swollen cells and from hearts subjected to ischemia–reperfusion. Thus, this may provide a potential target for drug discovery.
Materials and Methods
Cell lines and cultures as well as nano‐LC‐MS/MS, RT–PCR analysis of mRNA expression, gene transfection, purification of recombinant proteins, Western blotting, luciferin–luciferase ATP assay, and Langendorff perfusion of the hearts are described in Appendix Supplementary Methods.
Bleb formation and isolation of proteins from the bleb membrane
C127 cells were cultured in 225‐cm2 flasks for 2−3 days until confluence. The cells were washed thrice with Dulbecco's phosphate‐buffered saline (PBS; #D8537: Sigma‐Aldrich, St. Louis, MO, USA); bleb formation was induced by treatment with 2.5 μM latrunculin B (#428020: Calbiochem, San Diego, CA, USA) for 25 min in PBS, followed by washing once with PBS, and then by exposure to a hypoosmotic solution (10 mM HEPES–Tris, 1 mM EDTA, pH 7.4) for 7 min. The cells were detached by pipetting and centrifuged at 4°C and 550 g for 15 min. Blebs in the supernatant were collected by centrifugation at 4°C and 3,000 g for 30 min. A fraction of the pellet was resuspended in normal Ringer solution (containing 135 mM NaCl, 5 mM KCl, 2 mM CaCl2, 1 mM MgCl2, 5 mM Na‐HEPES, 6 mM HEPES, and 5 mM glucose; pH 7.4, 290 mOsm/kg‐H2O) for patch‐clamping and stained with the plasma membrane dye, CellMask™ Orange Plasma Membrane Stain (C10045: Thermo Fisher Scientific, Waltham, MA, USA), according to the manufacturer's instructions. The remainder of the pellet was solubilized in 1% n‐dodecyl β‐D‐maltoside (DDM; #D4641: Sigma‐Aldrich) supplemented with a protease inhibitor cocktail (10 μl/ml; #P8340: Sigma‐Aldrich) and 20% glycerol. Insoluble contaminants were removed by centrifugation at 4°C and 20,000 g for 30 min, and the supernatant was either used immediately for the next steps or stored at −80°C. The solubilized bleb‐membrane proteins were subjected to liquid‐phase isoelectric focusing on MicroRotofor Cell System (Bio‐Rad, Hercules, CA, USA), and 10 fractions with pI ranging from 3 to 10 were collected. Each fraction was reconstituted into giant proteoliposomes and assayed by patch‐clamping.
Reconstitution of membrane proteins into giant proteoliposomes
The reconstitution was performed, as reported elsewhere (Riquelme et al, 2004). Membrane proteins (4−100 μg) dissolved in 1% DDM were mixed with the suspension (10%) of asolectin (#11145: Sigma‐Aldrich) in 1% DDM at the ratio of 10:1 (vol/vol) and then vortexed. The sample solution was kept on ice for 30 min and centrifuged at 2°C and 20,000 g for 20 min. The supernatant was loaded onto a Sephadex G‐10 (#G10120: Sigma‐Aldrich) column equilibrated with reconstitution buffer (150 mM KCl, 10 mM Tris–HCl, pH 7.4). Fractions containing proteoliposomes were collected and centrifuged at 2°C and 20,000 g for 20 min, and then, the pellet was resuspended in the same buffer. At this stage, most of the DDM was removed, and the residual detergent did not affect the proteoliposome formation and reconstituted channel activity. Proteoliposome droplets (1 μl) were placed on the surface of glass coverslips and subjected to 2−3 cycles of partial dehydration/rehydration. The last rehydration was conducted inside the patch‐clamp chamber containing reconstitution buffer supplemented with 1 mM CaCl2 and 1 mM MgCl2 or normal Ringer solution, and the formation of giant proteoliposomes suitable for patch‐clamping (sized from 10 to 100 μm) was monitored under a microscope.
In vitro siRNA‐mediated knockdown in cultured cells
To first screen for the molecular identity of Maxi‐Cl, C127 cells were transfected with siRNAs against 15 selected candidate genes. Briefly, the cells were seeded in 35‐mm Petri dishes at a density of ~80,000 cells/dish. Two hours after seeding, the cells were transfected with siRNAs (at the final concentration of 20−60 nM) using the HiPerFect transfection reagent (301705: Qiagen, Hilden, Germany) with serum‐free OPTI‐MEM (Thermo Fisher Scientific) according to the manufacturer's manual. Fluorescence‐labeled non‐targeting siRNA (AllStars 1027292: Qiagen) was used as a negative control. Transfection efficiency was monitored under a fluorescence microscope. Nearly all cells were successfully transfected under these experimental conditions. One day after transfection, the cells were washed and grown in the culture medium. The cells were then subjected to patch‐clamping or RT–PCR to confirm knockdown efficiency 2−3 days after transfection. The siRNAs were purchased from Sigma‐Aldrich, Qiagen, and Thermo Fisher Scientific.
To knock down the expression of Slco2a1, C127 cells sparsely seeded on 12‐well plates 1 day before transfection with siRNA. siRNAs against mouse Slco2a1 (probe ID: MSS216146: Thermo Fisher Scientific) were used at a final concentration of 20 nM. Two to 3 days after transfections, the cells were replated 1 day before patch‐clamping or the ATP‐release assay to achieve optimal cell density. Stealth RNAi™ siRNA Negative Control (Thermo Fisher Scientific) was also transfected into C127 cells as a control.
Stable Slco2a1 knockdown
To generate a cell line with a stable Slco2a1 knockdown, we used the BLOCK‐iT™ Pol II miR RNAi Expression Vector System (Thermo Fisher Scientific). Pre‐miRNA double‐stranded DNA oligo against Slco2a1 (oligo ID, Mmi533372: Thermo Fisher Scientific) was inserted into pcDNA™6.2‐GW/EmGFP‐miR vector. The miR‐neg control plasmid included in the kit was used as a negative control. Vectors against Slco2a1 or negative control were transfected into C127 cells. Transfected cells were cultured in the medium containing 25−50 mg/ml of blasticidin (Thermo Fisher Scientific). Approximately 4 weeks later, GFP‐positive colonies were cloned. For rescue experiments in the stable knockdown cell line, the miRNA‐insensitive synonymous variant, which has a four‐nucleotide mutation in the miRNA‐targeted sequence of Slco2a1, was generated and inserted in the CMV‐pIRES2‐dsRED2 vector (see Appendix Table S2).
Generation of SLCO2A1‐KO cells by CRISPR/Cas9‐mediated genome editing
For disruption of the SLCO2A1 gene in C127 cells, we used the CRISPR/Cas9 system with the all‐in‐one CRISPR plasmid (U6‐gRNA/CMV‐Cas9‐RFP: Sigma‐Aldrich). Target sequence in the third exon was selected from pre‐designated CRISPRs list (Sigma‐Aldrich). We transfected the plasmid into C127 cells and cloned colonies derived from RFP‐positive cells. Fragments of genomic DNA were amplified by primers bracketing the target site and sequenced to assess whether the CRISPR/Cas9‐mediated mutations were inserted. Cells containing the mutations were further subcloned twice to exclude the possibility of contamination by wild‐type cells, and then, the clone #47‐9‐8‐2 was established as the SLCO2A1‐KO cell line. In this clone, no wild‐type sequence was detected, and frame shifted sequences, which generate premature stop codons, were identified in the target region of genomic DNA (n = 8). Protein disappearance in the clone #47‐9‐8‐2 was confirmed by Western blotting.
In vivo siRNA‐mediated knockdown in mouse hearts
siRNA delivery to mouse hearts was performed in vivo by tail vein injection. We used C57BL/6J female mice aged 9–10 weeks. The same siRNA probe that was used in in vitro experiments was produced on a large scale and sterilized with a 0.22‐μm centrifuge filter (Ultrafree‐MC‐GV: Merk Millipore). For each mouse, 40 μg of siRNA with 6.4 μl of in vivo jetPEI (Polyplus transfection, Illkirch, France) added to 200 μl of 50% glucose solution was prepared according to the manufacturer's protocol. To serve as a negative control, a scrambled siRNA was designed using BLOCK‐iT™ RNAi Designer and synthesized (Thermo Fisher Scientific). Injections of siRNA solution were conducted on three consecutive days. Knockdown efficiency in the heart was examined by RT–PCR. Hearts were isolated from euthanized mice on day 4. The cDNA was synthesized using the mixture of random hexamers and oligo‐dT primers of PrimeScript II First Strand cDNA Synthesis Kit (Takara Bio Inc.).
Electrophysiology
All inside‐out and outside‐out patch‐clamp recordings were performed at room temperature (23–25°C), as described previously (Islam et al, 2012). Patch pipettes were pulled from borosilicate glass capillaries (outer diameter 1.4 mm, inner diameter 1.0 mm) with a micropipette puller (Model P‐97: Sutter Instruments, Novato, CA, USA). When filled with the pipette solution, tip resistance was ~2 MΩ for patch‐clamping the cells and ~3–4 MΩ for patch‐clamping the proteoliposomes. Unless indicated otherwise, the pipette solution consisted of Ringer solution. In some experiments, NaCl in the pipette solution was equimolarly replaced with NMDG‐Cl or Na‐glutamate or reduced with isosmotic replacement with mannitol. For patch‐clamping, the cells were plated on glass coverslips at 20–50% confluence and bathed in normal Ringer solution. Isolated membrane blebs and reconstituted proteoliposomes were also subjected to patch‐clamping. In some experiments with giant proteoliposomes, we used the reconstitution buffer (150 mM KCl or K‐glutamate with 10 mM Tris–HCl, pH 7.4) supplemented with 1 mM CaCl2 and 1 mM MgCl2, as the pipette and bath solutions. Swelling‐induced whole‐cell currents were recorded as previously described (Kurbannazarova et al, 2011). Bath contained normal Ringer solution. Pipette solution was slightly hypertonic to the bath and contained (in mM): 125 CsCl, 2 CaCl2, 1 MgCl2, 3 Na2ATP, 5 HEPES (pH 7.4 adjusted with CsOH), and 10 EGTA (pCa 7.65; 315 mOsm/kg‐H2O adjusted with mannitol). Cell swelling was induced by patch disruption. Membrane currents were measured with an EPC‐9 patch‐clamp system (Heka‐Electronics, Lambrecht/Pfalz, Germany) or an Axopatch 200A patch‐clamp amplifier coupled to a DigiData 1320 interface (Axon Instruments, Union City, CA, USA). Data acquisition and analysis were conducted using Pulse+PulseFit (Heka‐Electronics) or pCLAMP software (version 9.0.2: Axon Instruments) and WinASCD software (kindly provided by Dr. G. Droogmans, Katholieke Universiteit Leuven, Belgium). The membrane potential was controlled by shifting the pipette potential (Vp) and reported as Vp for outside‐out recordings and −Vp for inside‐out, on‐bleb, and on‐proteoliposome recordings. Current signals were filtered at 2 kHz and digitized at 5 kHz. When the bath Cl− concentration was altered, a salt bridge containing 3 M KCl in 2% agarose was used to minimize variation of electrode potential in the bath. The liquid junction potentials were calculated using pCLAMP software and corrected as necessary.
Statistical analysis
Statistical differences of the data were evaluated by the paired or unpaired Student’s t‐test, by ANOVA with Bonferroni correction and by nonparametric Kolmogorov‐Smirnov test where appropriate.
Author contributions
RZS and YO conceived of the project and its design; RZS, PGM, TO, MRI, HU, HM, TM, YM, and YX performed experiments and data analysis; YO aided in the experimental design; RZS, PGM, TO, MRI, and YO wrote the manuscript; YO approved the final version of manuscript.
Conflict of interest
The authors declare that they have no conflict of interest.
Supporting information
Appendix
Expanded View Figures PDF
Dataset EV1
Source Data for Expanded View
Review Process File
Source Data for Figure 2
Source Data for Figure 4
Source Data for Figure 7
Source Data for Figure 8
Acknowledgements
We thank A. Toychiev and N. Tsiferova for assistance with preliminary patch‐clamping on blebs and proteoliposomes, J.‐Y. Bai for help with isolated heart experiments, K. Hosoya (Univ. Toyama) for providing anti‐SLCO2A1 antibody, E. Kurganov for help with homology modeling, K. Shigemoto and N. Yasui for their technical assistance, and T. Okayasu for secretarial help. This work was supported by Grants‐in‐Aid for Scientific Research from JSPS to Y.O. (#26263045 and #17K19517) and that from JSPS to T.O. (#16K08510), as well as by Grants‐in‐Aid from the Center for Science and Technology and Academy of Sciences of Uzbekistan to R.Z.S. and P.G.M. M.R.I. was supported by JSPS Postdoctoral Fellowship.
See also: DL Minor Jr (November 2017)
References
- Bell PD, Lapointe JY, Sabirov R, Hayashi S, Peti‐Peterdi J, Manabe K, Kovacs G, Okada Y (2003) Macula densa cell signaling involves ATP release through a maxi anion channel. Proc Natl Acad Sci USA 100: 4322–4327 [DOI] [PMC free article] [PubMed] [Google Scholar]
- Bell PD, Komlosi P, Zhang ZR (2009) ATP as a mediator of macula densa cell signalling. Purinergic Signal 5: 461–471 [DOI] [PMC free article] [PubMed] [Google Scholar]
- Brustovetsky N, Klingenberg M (1996) Mitochondrial ADP/ATP carrier can be reversibly converted into a large channel by Ca2+ . Biochemistry 35: 8483–8488 [DOI] [PubMed] [Google Scholar]
- Buettner R, Papoutsoglou G, Scemes E, Spray DC, Dermietzel R (2000) Evidence for secretory pathway localization of a voltage‐dependent anion channel isoform. Proc Natl Acad Sci USA 97: 3201–3206 [DOI] [PMC free article] [PubMed] [Google Scholar]
- Burnstock G (2012) Purinergic signalling: its unpopular beginning, its acceptance and its exciting future. BioEssays 34: 218–225 [DOI] [PubMed] [Google Scholar]
- Chan BS, Bao Y, Schuster VL (2002) Role of conserved transmembrane cationic amino acids in the prostaglandin transporter PGT. Biochemistry 41: 9215–9221 [DOI] [PubMed] [Google Scholar]
- Chang HY, Locker J, Lu R, Schuster VL (2010) Failure of postnatal ductus arteriosus closure in prostaglandin transporter‐deficient mice. Circulation 121: 529–536 [DOI] [PMC free article] [PubMed] [Google Scholar]
- Coulombe A, Coraboeuf E (1992) Large‐conductance chloride channels of new‐born rat cardiac myocytes are activated by hypotonic media. Pflugers Arch 422: 143–150 [DOI] [PubMed] [Google Scholar]
- Dermietzel R, Hwang TK, Buettner R, Hofer A, Dotzler E, Kremer M, Deutzmann R, Thinnes FP, Fishman GI, Spray DC (1994) Cloning and in situ localization of a brain‐derived porin that constitutes a large‐conductance anion channel in astrocytic plasma membranes. Proc Natl Acad Sci USA 91: 499–503 [DOI] [PMC free article] [PubMed] [Google Scholar]
- Dubyak GR (2012) Function without form: an ongoing search for maxi‐anion channel proteins. Focus on “Maxi‐anion channel and pannexin 1 hemichannel constitute separate pathways for swelling‐induced ATP release in murine L929 fibrosarcoma cells”. Am J Physiol Cell Physiol 303: C913–C915 [DOI] [PMC free article] [PubMed] [Google Scholar]
- Dutta AK, Sabirov RZ, Uramoto H, Okada Y (2004) Role of ATP‐conductive anion channel in ATP release from neonatal rat cardiomyocytes in ischaemic or hypoxic conditions. J Physiol 559: 799–812 [DOI] [PMC free article] [PubMed] [Google Scholar]
- Dutta AK, Korchev YE, Shevchuk AI, Hayashi S, Okada Y, Sabirov RZ (2008) Spatial distribution of maxi‐anion channel on cardiomyocytes detected by smart‐patch technique. Biophys J 94: 1646–1655 [DOI] [PMC free article] [PubMed] [Google Scholar]
- Fahlke C, Kortzak D, Machtens JP (2016) Molecular physiology of EAAT anion channels. Pflugers Arch 468: 491–502 [DOI] [PubMed] [Google Scholar]
- Hazama A, Fan H, Abdullaev I, Maeno E, Tanaka S, Ando‐Akatsuka Y, Okada Y (2000) Swelling‐activated, cystic fibrosis transmembrane conductance regulator‐augmented ATP release and Cl− conductances in C127 cells. J Physiol (London) 523: 1–11 [DOI] [PMC free article] [PubMed] [Google Scholar]
- Hosoe N, Ohmiya N, Hirai F, Umeno J, Esaki M, Yamagami H, Onodera K, Bamba S, Imaeda H, Yanai S, Hisamatsu T, Ogata H, Matsumoto T, CEAS Atlas Group (2017) Chronic enteropathy associated with SLCO2A1 gene (CEAS) – characterization of an enteric disorder to be considered in the differential diagnosis of Crohn's disease. J Crohns Colitis 11: 1277–1281 [DOI] [PubMed] [Google Scholar]
- Islam MR, Uramoto H, Okada T, Sabirov RZ, Okada Y (2012) Maxi‐anion channel and pannexin 1 hemichannel constitute separate pathways for swelling‐induced ATP release in murine L929 fibrosarcoma cells. Am J Physiol Cell Physiol 303: C924–C935 [DOI] [PubMed] [Google Scholar]
- Kanai N, Lu R, Satriano JA, Bao Y, Wolkoff AW, Schuster VL (1995) Identification and characterization of a prostaglandin transporter. Science 268: 866–869 [DOI] [PubMed] [Google Scholar]
- Kurbannazarova RS, Bessonova SV, Okada Y, Sabirov RZ (2011) Swelling‐activated anion channels are essential for volume regulation of mouse thymocytes. Int J Mol Sci 12: 9125–9137 [DOI] [PMC free article] [PubMed] [Google Scholar]
- Lazarowski ER (2012) Vesicular and conductive mechanisms of nucleotide release. Purinergic Signal 8: 359–373 [DOI] [PMC free article] [PubMed] [Google Scholar]
- Li A, Banerjee J, Leung CT, Peterson‐Yantorno K, Stamer WD, Civan MM (2011) Mechanisms of ATP release, the enabling step in purinergic dynamics. Cell Physiol Biochem 28: 1135–1144 [DOI] [PMC free article] [PubMed] [Google Scholar]
- Liu HT, Tashmukhamedov BA, Inoue H, Okada Y, Sabirov RZ (2006) Roles of two types of anion channels in glutamate release from mouse astrocytes under ischemic or osmotic stress. Glia 54: 343–357 [DOI] [PubMed] [Google Scholar]
- McGill JM, Basavappa S, Fitz JG (1992) Characterization of high‐conductance anion channels in rat bile duct epithelial cells. Am J Physiol 262: G703–G710 [DOI] [PubMed] [Google Scholar]
- Nam JH, Zheng HF, Earm KH, Ko JH, Lee IJ, Kang TM, Kim TJ, Earm YE, Kim SJ (2006) Voltage‐dependent slowly activating anion current regulated by temperature and extracellular pH in mouse B cells. Pflugers Arch 452: 707–717 [DOI] [PubMed] [Google Scholar]
- Ninomiya H, Otani H, Lu K, Uchiyama T, Kido M, Imamura H (2002) Complementary role of extracellular ATP and adenosine in ischemic preconditioning in the rat heart. Am J Physiol Heart Circ Physiol 282: H1810–H1820 [DOI] [PubMed] [Google Scholar]
- Ohana E, Yang D, Shcheynikov N, Muallem S (2009) Diverse transport modes by the solute carrier 26 family of anion transporters. J Physiol 587: 2179–2185 [DOI] [PMC free article] [PubMed] [Google Scholar]
- Okada Y, Sato K, Toychiev AH, Suzuki M, Dutta AK, Inoue H, Sabirov R (2009) The puzzles of volume‐activated anion channels In Physiology and pathology of chloride transporters and channels in the nervous system: from molecules to diseases, Alvarez‐Leefmans FJ, Delpire E. (eds), pp 283–306. San Diego, CA: Elsevier; [Google Scholar]
- Okada T, Islam MR, Tsiferova N, Okada Y, Sabirov RZ (2017) Specific and essential but not sufficient roles of LRRC8A in the activity of volume‐sensitive outwardly rectifying anion channel (VOSR). Channels (Austin) 11: 109–120 [DOI] [PMC free article] [PubMed] [Google Scholar]
- Pedersen SF, Okada Y, Nilius B (2016) Biophysics and physiology of the volume‐regulated anion channel (VRAC)/volume‐sensitive outwardly rectifying anion channel (VSOR). Pflugers Arch 468: 371–383 [DOI] [PubMed] [Google Scholar]
- Picollo A, Pusch M (2005) Chloride/proton antiporter activity of mammalian CLC proteins ClC‐4 and ClC‐5. Nature 436: 420–423 [DOI] [PubMed] [Google Scholar]
- Praetorius HA, Leipziger J (2009) ATP release from non‐excitable cells. Purinergic Signal 5: 433–446 [DOI] [PMC free article] [PubMed] [Google Scholar]
- Qiu Z, Dubin AE, Mathur J, Tu B, Reddy K, Miraglia LJ, Reinhardt J, Orth AP, Patapoutian A (2014) SWELL1, a plasma membrane protein, is an essential component of volume‐regulated anion channel. Cell 157: 447–458 [DOI] [PMC free article] [PubMed] [Google Scholar]
- Riquelme G, Llanos P, Tischner E, Neil J, Campos B (2004) Annexin 6 modulates the maxi‐chloride channel of the apical membrane of syncytiotrophoblast isolated from human placenta. J Biol Chem 279: 50601–50608 [DOI] [PubMed] [Google Scholar]
- Riquelme G (2009) Placental chloride channels: a review. Placenta 30: 659–669 [DOI] [PubMed] [Google Scholar]
- Sabirov RZ, Dutta AK, Okada Y (2001) Volume‐dependent ATP‐conductive large‐conductance anion channel as a pathway for swelling‐induced ATP release. J Gen Physiol 118: 251–266 [DOI] [PMC free article] [PubMed] [Google Scholar]
- Sabirov RZ, Okada Y (2004) Wide nanoscopic pore of maxi‐anion channel suits its function as an ATP‐conductive pathway. Biophys J 87: 1672–1685 [DOI] [PMC free article] [PubMed] [Google Scholar]
- Sabirov RZ, Okada Y (2005) ATP release via anion channels. Purinergic Signal 1: 311–328 [DOI] [PMC free article] [PubMed] [Google Scholar]
- Sabirov RZ, Sheiko T, Liu H, Deng D, Okada Y, Craigen WJ (2006) Genetic demonstration that the plasma membrane maxianion channel and voltage‐dependent anion channels are unrelated proteins. J Biol Chem 281: 1897–1904 [DOI] [PubMed] [Google Scholar]
- Sabirov RZ, Okada Y (2009) The maxi‐anion channel: a classical channel playing novel roles through an unidentified molecular entity. J Physiol Sci 59: 3–21 [DOI] [PMC free article] [PubMed] [Google Scholar]
- Sabirov RZ, Merzlyak PG (2012) Plasmalemmal VDAC controversies and maxi‐anion channel puzzle. Biochim Biophys Acta 1818: 1570–1580 [DOI] [PubMed] [Google Scholar]
- Sabirov RZ, Merzlyak PG, Islam MR, Okada T, Okada Y (2016) The properties, functions, and pathophysiology of maxi‐anion channels. Pflugers Arch 468: 405–420 [DOI] [PubMed] [Google Scholar]
- Sanderson J, Dartt DA, Trinkaus‐Randall V, Pintor J, Civan MM, Delamere NA, Fletcher EL, Salt TE, Grosche A, Mitchell CH (2014) Purines in the eye: recent evidence for the physiological and pathological role of purines in the RPE, retinal neurons, astrocytes, Muller cells, lens, trabecular meshwork, cornea and lacrimal gland. Exp Eye Res 127: 270–279 [DOI] [PMC free article] [PubMed] [Google Scholar]
- Sasaki T, Niizeki H, Shimizu A, Shiohama A, Hirakiyama A, Okuyama T, Seki A, Kabashima K, Otsuka A, Ishiko A, Tanese K, Miyakawa S, Sakabe J, Kuwahara M, Amagai M, Okano H, Suematsu M, Kudoh J (2012) Identification of mutations in the prostaglandin transporter gene SLCO2A1 and its phenotype‐genotype correlation in Japanese patients with pachydermoperiostosis. J Dermatol Sci 68: 36–44 [DOI] [PubMed] [Google Scholar]
- Sato‐Numata K, Numata T, Inoue R, Okada Y (2016) Distinct pharmacological and molecular properties of the acid‐sensitive outwardly rectifying (ASOR) anion channel from those of the volume‐sensitive outwardly rectifying (VSOR) anion channel. Pflügers Arch 468: 795–803 [DOI] [PubMed] [Google Scholar]
- Scheel O, Zdebik AA, Lourdel S, Jentsch TJ (2005) Voltage‐dependent electrogenic chloride/proton exchange by endosomal CLC proteins. Nature 436: 424–427 [DOI] [PubMed] [Google Scholar]
- Schlichter LC, Grygorczyk R, Pahapill PA, Grygorczyk C (1990) A large, multiple‐conductance chloride channel in normal human T lymphocytes. Pflugers Arch 416: 413–421 [DOI] [PubMed] [Google Scholar]
- Schroeder BC, Cheng T, Jan YN, Jan LY (2008) Expression cloning of TMEM16A as a calcium‐activated chloride channel subunit. Cell 134: 1019–1029 [DOI] [PMC free article] [PubMed] [Google Scholar]
- Schuster VL (1998) Molecular mechanisms of prostaglandin transport. Annu Rev Physiol 60: 221–242 [DOI] [PubMed] [Google Scholar]
- Schuster VL (2002) Prostaglandin transport. Prostaglandins Other Lipid Mediat 68–69: 633–647 [DOI] [PubMed] [Google Scholar]
- Schuster VL, Chi Y, Lu R (2015) The prostaglandin transporter: Eicosanoid reuptake, control of signaling, and development of high‐affinity inhibitors as drug candidates. Trans Am Clin Climatol Assoc 126: 248–257 [PMC free article] [PubMed] [Google Scholar]
- Seifert W, Kuhnisch J, Tuysuz B, Specker C, Brouwers A, Horn D (2012) Mutations in the prostaglandin transporter encoding gene SLCO2A1 cause primary hypertrophic osteoarthropathy and isolated digital clubbing. Hum Mutat 33: 660–664 [DOI] [PubMed] [Google Scholar]
- Strange K, Emma F, Jackson PS (1996) Cellular and molecular physiology of volume‐sensitive anion channels. Am J Physiol 270: C711–C730 [DOI] [PubMed] [Google Scholar]
- Sun XP, Supplisson S, Torres R, Sachs G, Mayer E (1992) Characterization of large‐conductance chloride channels in rabbit colonic smooth muscle. J Physiol (Lond) 448: 355–382 [DOI] [PMC free article] [PubMed] [Google Scholar]
- Suzuki M, Mizuno A (2004) A novel human Cl− channel family related to Drosophila flightless locus. J Biol Chem 279: 22461–22468 [DOI] [PubMed] [Google Scholar]
- Taruno A, Matsumoto I, Ma Z, Marambaud P, Foskett JK (2013) How do taste cells lacking synapses mediate neurotransmission? CALHM1, a voltage‐gated ATP channel. BioEssays 35: 1111–1118 [DOI] [PMC free article] [PubMed] [Google Scholar]
- Toychiev AH, Sabirov RZ, Takahashi N, Ando‐Akatsuka Y, Liu H, Shintani T, Noda M, Okada Y (2009) Activation of maxi‐anion channel by protein tyrosine dephosphorylation. Am J Physiol Cell Physiol 297: C990–C1000 [DOI] [PubMed] [Google Scholar]
- Umeno J, Hisamatsu T, Esaki M, Hirano A, Kubokura N, Asano K, Kochi S, Yanai S, Fuyuno Y, Shimamura K, Hosoe N, Ogata H, Watanabe T, Aoyagi K, Ooi H, Watanabe K, Yasukawa S, Hirai F, Matsui T, Iida M et al (2015) A hereditary enteropathy caused by mutations in the SLCO2A1 gene, encoding a prostaglandin transporter. PLoS Genet 11: e1005581 [DOI] [PMC free article] [PubMed] [Google Scholar]
- Voss FK, Ullrich F, Munch J, Lazarow K, Lutter D, Mah N, Andrade‐Navarro MA, von Kries JP, Stauber T, Jentsch TJ (2014) Identification of LRRC8 heteromers as an essential component of the volume‐regulated anion channel VRAC. Science 344: 634–638 [DOI] [PubMed] [Google Scholar]
- Wagner CA, Lang F, Bröer S (2001) Function and structure of heterodimeric amino acid transporters. Am J Physiol Cell Physiol 281: C1077–C1093 [DOI] [PubMed] [Google Scholar]
- Wee S, Peart JN, Headrick JP (2007) P2 purinoceptor‐mediated cardioprotection in ischemic‐reperfused mouse heart. J Pharmacol Exp Ther 323: 861–867 [DOI] [PubMed] [Google Scholar]
- Yang YD, Cho H, Koo JY, Tak MH, Cho Y, Shim WS, Park SP, Lee J, Lee B, Kim BM, Raouf R, Shin YK, Oh U (2008) TMEM16A confers receptor‐activated calcium‐dependent chloride conductance. Nature 455: 1210–1215 [DOI] [PubMed] [Google Scholar]
- Yang J, Yan R, Roy A, Xu D, Poisson J, Zhang Y (2015) The I‐TASSER Suite: protein structure and function prediction. Nat Methods 12: 7–8 [DOI] [PMC free article] [PubMed] [Google Scholar]
- Zhang Z, Xia W, He J, Zhang Z, Ke Y, Yue H, Wang C, Zhang H, Gu J, Hu W, Fu W, Hu Y, Li M, Liu Y (2012) Exome sequencing identifies SLCO2A1 mutations as a cause of primary hypertrophic osteoarthropathy. Am J Hum Genet 90: 125–132 [DOI] [PMC free article] [PubMed] [Google Scholar]
- Zhang Z, He JW, Fu WZ, Zhang CQ, Zhang ZL (2014) Two novel mutations in the SLCO2A1 gene in a Chinese patient with primary hypertrophic osteoarthropathy. Gene 534: 421–423 [DOI] [PubMed] [Google Scholar]
Associated Data
This section collects any data citations, data availability statements, or supplementary materials included in this article.
Supplementary Materials
Appendix
Expanded View Figures PDF
Dataset EV1
Source Data for Expanded View
Review Process File
Source Data for Figure 2
Source Data for Figure 4
Source Data for Figure 7
Source Data for Figure 8