

Single-molecule imaging was used to quantify the transient nature of FcεRI-Syk interactions in a rodent mast cell line. A functional mutation that increases Syk off-rate leads to altered Syk phosphorylation patterns and impaired signaling, highlighting the importance of finely tuned protein interactions in directing cellular outcomes.
Abstract
Cross-linking of immunoglobulin E–bound FcεRI triggers multiple cellular responses, including degranulation and cytokine production. Signaling is dependent on recruitment of Syk via docking of its dual SH2 domains to phosphorylated tyrosines within the FcεRI immunoreceptor tyrosine-based activation motifs. Using single-molecule imaging in live cells, we directly visualized and quantified the binding of individual mNeonGreen-tagged Syk molecules as they associated with the plasma membrane after FcεRI activation. We found that Syk colocalizes transiently to FcεRI and that Syk-FcεRI binding dynamics are independent of receptor aggregate size. Substitution of glutamic acid for tyrosine between the Syk SH2 domains (Syk-Y130E) led to an increased Syk-FcεRI off-rate, loss of site-specific Syk autophosphorylation, and impaired downstream signaling. Genome edited cells expressing only Syk-Y130E were deficient in antigen-stimulated calcium release, degranulation, and production of some cytokines (TNF-a, IL-3) but not others (MCP-1, IL-4). We propose that kinetic discrimination along the FcεRI signaling pathway occurs at the level of Syk-FcεRI interactions, with key outcomes dependent upon sufficiently long-lived Syk binding events.
INTRODUCTION
The family of multichain immunorecognition receptors (MIRRs), including the high-affinity immunoglobulin E (IgE) receptor (FcεRI), the B-cell receptor (BCR), and the T-cell receptor (TCR), trigger a wide array of signaling outcomes critical for immune cell function, including cell survival, release of inflammatory mediators, and cytokine production. A distinguishing feature of the MIRRs is their lack of intrinsic kinase activity, rendering them reliant on the recruitment and activation of nonreceptor tyrosine kinases for signaling (Sigalov, 2005). For FcεRI and BCR, antigen engagement results in phosphorylation of accessory chain immunoreceptor tyrosine–based activation motifs (ITAMs) (Johnson et al., 1995) by the Src family kinases Lyn and Fyn, followed by the recruitment and activation of the tyrosine kinase Syk. The parallel signaling cascade of the TCR relies on sequential engagement of the Src family kinase Lck and the Syk-related kinase Zap70.
As the only two members of a kinase subfamily, Syk and Zap70 share structural similarities that regulate kinase activity through conformational state changes. Key features include tandem SH2 domains that are joined via a linker (interdomain A [I-A]), and a kinase domain (KD) connected via a second linker region (interdomain B [I-B]) (Au-Yeung et al., 2009). Interactions between the linker domains and the kinase domain create an autoinhibited conformation (Deindl et al., 2007); this closed state is likely the predominant conformation of Syk/Zap70 in a resting cell. Transitions to an open conformation facilitate binding of the tandem SH2 domains to dually phosphorylated ITAMs and free the kinase domain for activity (Johnson et al., 1995). The ITAM-docked open conformation also exposes a number of autophosphorylation sites, as well as tyrosines that are substrates for Src kinases (Sada et al., 2001; Arias-Palomo et al., 2009; Geahlen, 2009; Chen et al., 2011). Phosphorylation of Syk at these sites promotes kinase activation (Tsang et al., 2008) and provides docking sites for distinct downstream signaling molecules (Simon et al., 2005). Phosphotyrosines are also implicated in structural modifications of Syk. For example, phosphorylation of I-B tyrosine residues in both Syk and Zap70 favors the open state (Brdicka et al., 2005), and recent studies have shown that phosphorylation of these residues in Zap70 is associated with longer dwell times on the TCR (Klammt et al., 2015). Phosphorylation of key residues in the catalytic domain of Syk also enhances enzymatic activity (Carsetti et al., 2009). It is important to note that, despite their similarity, these two closely related kinases also have important distinctions. Notably, Zap70 activation by the TCR is reliant on the Src family kinase Lck, as well as the protein phosphatase CD45, whereas Syk can reconstitute TCR signaling without these two players (Chu et al., 1996). Reliable and quantitative measures that capture receptor–kinase interaction dynamics are needed to understand the full range of mechanisms underlying the similarities and differences between these essential immune kinases (Turner et al., 2000; Palacios and Weiss, 2007).
This work focuses on the dynamics of Syk recruitment to FcεRI following aggregation of the receptor by multivalent antigen. Immunoelectron microscopy studies have shown that FcεRI cross-linking leads to a dramatic increase in the amount of Syk associated with the receptor at the plasma membrane (Wilson et al., 2000). However, FcεRI aggregates can vary in size and mobility as a function of antigen dose or valency (Andrews et al., 2009; Mahajan et al., 2014). Therefore, establishing the relationship between receptor aggregate size and signaling efficiency is of keen interest (Wilson et al., 2011). Mathematical modeling studies have predicted that membrane receptor clustering can lead to enhanced signaling output by promoting multiple rebinding events (Das et al., 2009; Radhakrishnan et al., 2012). On the other hand, membrane topographical features or posttranslational modifications that reduce diffusion-mediated access or dwell time at the ITAM domain could negatively influence signaling. Thus, while structural and biochemical studies have provided information on the sequence of events needed for Syk activation in this signaling cascade, many questions remain concerning the timing and extent of Syk recruitment needed to efficiently propagate signaling. We performed single-particle tracking (SPT) using total internal reflection fluorescence (TIRF) microscopy to quantify the dynamics of Syk recruitment to the membranes of gene-edited RBL-2H3 cells whose endogenous Syk expression was ablated and reconstituted with either wild-type (WT) or mutant Syk expressed as a chimeric mNeonGreen (mNG) fusion protein. Immunological and biochemical assays were used to determine the impact of changes in FcεRI-Syk dynamics on mast cell functional responses.
We find that Syk binding at the mast cell membrane is best described as a mixture of lifetimes characterized by a fast off-rate (kf = 2.6 s−1) and a slow off-rate (ks = 0.62 s−1), indicating a population of both short-lived and long-lived binding events. Aggregation of FcεRI leads to a marked increase in the fraction of trajectories characterized by ks compared with kf, and treatment with the Lyn specific inhibitor dasatinib drastically reduces this ks fraction. These results indicate that ks characterizes specific recruitment of Syk to phosphorylated FcεRI. Based upon two-color imaging, Syk-FcεRI colocalization is sustained through rapid exchange with the pool of cytosolic Syk. The importance of the longer-lived interactions in signal propagation is shown by introduction of a Y130E mutation within the I-A domain of Syk. Phosphorylation of Y130 is proposed as a form of negative-feedback regulation, because it has been shown to destabilize binding of Syk tandem SH2 domains to phosphorylated ITAMs (pITAMs) (Zhang et al., 2008; Feng and Post, 2016). We find that Syk-Y130E is still recruited to FcεRI aggregates, but its interactions are more transient (ks = 0.87 s−1) and markedly less efficient at transphosphorylation. In cells expressing only the Syk-Y130E mutant form of Syk, mast cell degranulation and specific cytokine production (TNFα, IL-3) are impaired but, remarkably, production of MCP-1 and IL-4 is retained.
In previous work it has been shown that the kinetics of ligand–receptor binding impact signaling events and cellular responses (McKeithan, 1995; Liu et al., 2001; Torigoe et al., 2007; Suzuki et al., 2014). FcεRI signal transduction therefore has classically been considered to be controlled at the step of receptor aggregation according to the principles of kinetic proofreading (Hopfield, 1974). Here we find that propagation of a subset of cellular responses is similarly sensitive to the off-rate of Syk recruited to aggregated receptors. These data highlight the importance of finely tuned protein–protein interactions in directing cellular outcomes.
RESULTS
Syk recruitment to FcεRI is transient
We began by generating a Syk knockout subline of RBL-2H3 cells (Syk-KO) through CRISPR-Cas 9–mediated editing. These cells were then reconstituted with WT Syk expressed as an mNG fusion protein (SykmNG). Syk-mediated downstream signaling in these cells was fully rescued, including restoration of degranulation responses downstream of FcεRI aggregation (Supplemental Figure S1). To follow SykmNG recruitment to activated FcεRI, we next primed cells with fluorescent anti-DNP IgE (Alexa Fluor 647–conjugated IgE [AF647-IgE]) and then challenged cells with the multivalent antigen DNP-bovine serum albumin (BSA) (0.1 μg/ml). Confocal images in Figure 1A and Supplemental Video 1 show the expected increase in FcεRI clustering that accompanies 5 min of antigen-simulated aggregation and the formation of signaling patches (Wilson et al., 2000). Receptor cross-linking also led to the accumulation of SykmNG at the membrane, where it colocalized with FcεRI aggregates (Figure 1A and Supplemental Video 1). The recruitment of SykmNG to the plasma membrane was lost in cells pretreated with dasatinib, which selectively inhibits Src and Abl tyrosine kinases (Lombardo et al., 2004) (Figure 1B, TIRF images). Further proof that the observed binding events are specific to FcεRI aggregation is shown in Figure 1C, where the disruption of FcεRI aggregates by monovalent DNP-lysine also results in rapid dissociation of SykmNG clusters. After the addition of DNP-lysine, single molecules could be resolved near the original cluster before release into the cytosol (Figure 1C, bottom, and Supplemental Video 2). The apparent persistence of Syk at the membrane over this short period may reflect interactions with phosphorylated FcεRI monomers or other membrane components (possibly LAT or other substrates) that persist for a short time after the dissolution of FcεRI aggregates.
FIGURE 1:

Syk Recruitment to FcεRI. Syk-KO RBL cells expressing SykmNG (green) were primed with AF647-IgE (magenta) and imaged after cross-linking with 0.1 µg/ml DNP-BSA. (A) Sample images from a confocal time series showing the redistribution of AF647-IgE-FcεRI and SykmNG upon FcεRI stimulation (see also Supplemental Video 1). Resting cross-section shows homogeneous distribution of AF647-IgE-FcεRI at the plasma membrane and SykmNG in the cytosol. Upon cross-linking (5 min), FcεRI aggregation and SykmNG colocalization is readily seen at the adherent cell surface. Scale bar: 10.3 µm. White boxes in the “Overlay” panels are enlarged in the “Zoom” panels. Scale bar: 2 µm. (B) Treatment with 1 µM dasatinib results in a loss of SykmNG recruitment (bottom) to FcεRI aggregates (top). Images of the adherent cell membrane acquired in TIRF. Scale bar: 5 µm. (C) Both FcεRI and SykmNG aggregates (top) are disrupted upon addition of 100 mM monovalent DNP-lysine (middle). Scale bar: 5 µm. Selected images from a time series (bottom) show the dispersion of an individual Syk aggregate within seconds of DNP-lysine addition. Individual SykmNG molecules can be seen diffusing away from the original diffraction-limited aggregate (see also Supplemental Video 2). Images acquired in TIRF. Scale bar: 1 µm. (D) Plot of positive correlation between SykmNG and AF647-IgE intensity within each AF647-IgE aggregate. (E) Selected images from a confocal time series before and after photobleaching (at t = 0 s) of an individual SykmNG aggregate. Scale bar: 1 µm. Bottom curve quantifies the rapid recovery of mNG fluorescence intensity within the bleached region (white circles).
We next examined the recruitment capacity of FcεRI aggregates by comparing receptor aggregate size and density with SykmNG accumulation. Using two-color TIRF imaging, AF647-IgE images were first segmented by creating an intensity mask to identify individual receptor aggregates, from which corresponding AF647-IgE and SykmNG intensities were determined. The linear correlation of the IgE-FcεRI and SykmNG intensities per aggregate seen in Figure 1D indicates that, as receptor aggregates increase in size, more SykmNG is recruited. Finally, we assessed the dynamics of FcεRI-Syk interactions using fluorescence recovery after photobleaching (FRAP). SykmNG colocalized with FcεRI aggregates demonstrated rapid fluorescence recovery within 20 s (Figure 1E), while the FcεRI did not (unpublished data). These results reveal that the observed SykmNG aggregation is not stable in time but is actually an accumulation of many transient binding events.
Direct measurements of Syk binding dynamics
To directly measure the off-rate of Syk binding, we applied single-molecule imaging to visualize thousands of SykmNG binding events in living cells. Using TIRF microscopy, we were able to observe and track single SykmNG molecules as they associated with the adherent surface of the plasma membrane (Supplemental Video 3). We selected our imaging frame rate (100-ms exposure time) to minimize the contribution of fast-moving SykmNG molecules in the cytosol and selectively capture those SykmNG proteins that reduce mobility when bound to the membrane (Figure 2A, left). In this scenario, the track length of individual SykmNG proteins reflects the binding lifetime (Figure 2A, right). As shown in the cumulative probability plots in Figure 2B, we found that the distribution of track lengths shifted to longer duration after FcεRI activation. To extract the underlying Syk off-rates (k), we fitted the distribution of track lengths, assuming an exponential binding process, and compared fits across different models (see Materials and Methods for details). We found the simplest model consistent with the data was a two-component model with a fast off-rate (kf) of ∼2.6 s−1 and a slower off-rate (ks) of ∼0.62 s−1 (Figure 2C).
FIGURE 2:

Quantifying FcεRI-Syk interactions using single-particle tracking of SykmNG. Single SykmNG molecules were tracked using TIRF microscopy as they bound and dissociated from the membrane. (A) Example of SykmNG trajectories detected at the plasma membrane (left). Projection of trajectories in the time dimension (middle) shows the trajectory lengths. Enlargement of a single trajectory that lasts ∼10 s (right). (B) Cumulative probability distribution of SykmNG trajectory lengths before (black) and 4–5 min after addition of 1 µg/ml DNP-BSA (green). Solid gray lines represent the fit to the data. (C) Bar graph depicts fast and slow off-rates found when fitting the distributions in B. See Materials and Methods for details. (D) Fraction of the slow off-rate component (αs) increases from ∼5% to 23% after addition of 1 µg/ml DNP-BSA. Treatment with 1 µM dasatinib (Das) reduces αs in both resting and activated cells. Error bars in C and D are a 68% credible interval as described in Materials and Methods. See also Supplemental Table S1.
We interpret the faster off-rate to represent nonproductive binding events and the slow off-rate to characterize the specific Syk docking events that correlate with FcεRI signaling. Consistent with this interpretation, we found that the ks fraction markedly increased from 5% to 23% upon FcεRI activation (Figure 2D). The increase in the ks fraction with stimulation is blocked when cells are pretreated with the Src family kinase inhibitor dasatinib (Figure 2D). These results indicate that the longer-lived events are specifically associated with Syk binding to FcεRI pITAM. Of note, we found that there was a significant population (5%) of ks SykmNG binding events in resting cells, which was essentially ablated (<2%) with dasatinib treatment. This suggests that some basal phosphorylation of FcεRI occurs in the absence of cross-linking to recruit Syk, although we cannot fully exclude the possibility of specific Syk binding to other Src (or Abl) substrates at the membrane. We also found that dasatinib treatment consistently resulted in a reduction in the total number of SykmNG tracks captured per resting cell. While this was a qualitative observation, it can be interpreted in the context that 95% of observed tracks in resting cells are the fast component. This indicates that a large fraction of the observed tracks for Syk reflect true membrane-binding events. It is well known that low rates of ITAM phosphorylation constitutively occur in immune cells, a phenomenon that is rapidly reversed by phosphatase activity (Teshima et al., 1994). We conclude that some of the fast tracks observed may be due to nonspecific membrane encounters of cytosolic SykmNG, as we observed for a cytosolic reporter (mNG-PLY; see Materials and Methods). The remaining events likely represent true engagements of Syk-SH2 domains as they sample monophosphorylated ITAMs (Pao et al., 1998; Yamashita et al., 2008; O’Neill et al., 2011) or other substrates for Src kinases in the membrane (Park et al., 2016). These short-lived encounters are insufficient for signaling, because the increase in the fraction of slow off-rate events is the critical measure that correlates with FcεRI signal propagation.
FcεRI-Syk interaction dynamics are independent of antigen dose or aggregate size
The extent and time course of FcεRI aggregation are features of antigen dose and valency (Andrews et al., 2009). To establish the aggregation profile of FcεRI after cross-linking with DNP-BSA, we used direct stochastic optical reconstruction microscopy (dSTORM) (van de Linde et al., 2011) superresolution imaging. Imaging was performed in TIRF, which specifically evaluates antigen-mediated aggregation at the adherent membrane surface. Figure 3, A and B, shows the clustering of AF647-IgE–bound receptors after 5 min of treatment over a range of DNP-BSA doses (0.001–1 μg/ml). The comparison in Figure 3A, between the diffraction-limited images at the left and the dSTORM images at the right, illustrates that the ∼10-nm localization accuracy of this superresolution method enables the visualization and quantification (Figure 3B) of aggregation across the full dose–response range. Aggregation is observed even at the lowest doses (0.001 and 0.01 μg/ml), where changes in the diffraction-limited image are not readily discernible.
FIGURE 3:

FcεRI-Syk off-rate is independent of antigen dose or aggregate size. (A) AF647-IgE–labeled RBL cells cross-linked for 5 min with indicated DNP-BSA concentration and imaged (left) at the adherent surface in TIRF (scale bar: 5 µm) and using (right) dSTORM (scale bar: 2 µm). (B) Clustering of localizations in dSTORM images from A using a hierarchical clustering algorithm (Matlab, MathWorks). Cluster sizes are shown as gray dots, and the distribution is summarized by the mean (red cross), the median (red line), and the 25th and 75th percentiles (blue box). Kolmogorov-Smirnov tests show significant (p < 0.01) differences between resting (0 ng) and other DNP-BSA doses. (C) Mobility of SykmNG represented as the cumulative distribution of squared displacements (r2, ΔT = 0.3 s or 3 frames) for each DNP-BSA dose. See Supplemental Table S1 for values. (D) Cumulative distribution of SykmNG track lengths for each DNP-BSA dose. (E) The fraction of the slow off-rate component (αs) increases with DNP-BSA dose. Data collected between 1 and 5 min after the addition of DNP-BSA. Error bars are a 68% credible interval as described in Materials and Methods. See also Supplemental Table S1. (F) Comparison of SykmNG trajectory localization with AF647-IgE aggregates in cells stimulated with 0.1 µg/ml DNP-BSA for up to 5 min. Left, overlay of SykmNG trajectories (green lines) with AF647-IgE aggregates (magenta). Scale bar: 1 µm. See also Supplemental Video 4. Middle, comparison of SykmNG track-length distributions inside and outside the AF647-IgE mask. A Kolmogorov-Smirnov test shows the distributions are significantly different (p < 0.01). Right, no correlation is observed between SykmNG track length and the intensity of the corresponding AF647-IgE aggregate.
We showed previously that FcεRI aggregates become essentially immobile at the highest antigen doses (≥0.1 μg/ml) (Andrews et al., 2009). Because both small (mobile) and large (immobile) complexes were shown to be signaling competent (Andrews et al., 2009; Shelby et al., 2014), it was important to determine whether there was a dependence of Syk recruitment on the cross-linking conditions. We found that the mobility of SykmNG recruited to the membrane is reduced as antigen dose increases (Figure 3C and Supplemental Table S1), following the same trend as the antigen-induced changes in FcεRI mobility (Andrews et al., 2009). Figure 3D shows that the distribution of track lengths shifted toward longer duration as a function of antigen dose. Fitting these distributions across the dose response again supported a model in which the rate constants remain unchanged; rather, it is the fraction of long-lived tracks (αs) that increases with the concentration of antigen (Figure 3E and Supplemental Table S1). These data suggested that the interaction lifetime of Syk at the membrane is independent of the mobility of receptor aggregates or their cluster size.
To confirm this conclusion, we used two-color imaging to simultaneously correlate receptor aggregate size with SykmNG dwell times (Figure 3F and Supplemental Video 4). We chose an intermediate dose of DNP-BSA concentration (0.1 μg/ml), for which a range of AF647-IgE-FcεRI aggregate sizes can be seen on the cell surface (Figure 3, A and B). For each Syk trajectory, we compared its track length with the total intensity of the corresponding AF647-IgE-FcεRI aggregate to which it colocalized (Figure 3F). Comparison of SykmNG dwell times inside and outside the aggregates showed that most long-lived events are associated with FcεRI aggregates (Figure 3F, middle). No correlation between aggregate intensity (i.e., size) and SykmNG dwell time was found (Figure 3F, right). Thus, signaling is associated with an increase in the number of long-lived Syk binding events rather than changes in binding lifetime.
Phosphomimetic mutation at Y130 increases the Syk off-rate
Considering the observation that FcεRI-Syk interaction kinetics are consistent across all DNP-BSA cross-linking conditions, we next sought to experimentally alter the lifetime of Syk on FcεRI pITAMs by introducing mutations in Y130 in the Syk I-A domain. Located between the two tandem SH2 domains, Y130 phosphorylation reportedly lowers the affinity of Syk for pITAMs (Isaacson, 1997; Zhang et al., 2008). We reconstituted Syk-KO cells with mNG-tagged versions of two previously described Syk mutants (Isaacson, 1997) (Supplemental Figure S2A): 1) Y130E, a phosphomimetic mutation (SykmNG-Y130E); and 2) Y130F, which cannot become phosphorylated (SykmNG-Y130F). These mutants were also introduced into parental RBL-2H3 cells (Supplemental Figure S2A). As shown in Figure 4A, each of the reconstituted Syk-KO cell lines showed robust membrane accumulation of SykmNG after stimulation (0.1 μg/ml DNP-BSA) that colocalized with AF647-IgE-FcεRI aggregates. Quantification of these images, shown in Figure 4B, was performed in the same manner as Figure 1D. The Y130E and Y130F mutants of SykmNG were recruited to FcεRI to a similar extent as WT SykmNG. Thus, despite poor recovery of the Y130E mutant in coimmunoprecipitation studies with the BCR (Isaacson, 1997; Zhang et al., 2008), association of SykmNG-Y130E with FcεRI aggregates is not grossly impaired.
FIGURE 4:

SykmNG-Y130E exhibits a faster FcεRI off-rate. (A) TIRF images of AF647-IgE (magenta) and SykmNG (green) membrane localization in Syk-KO cells reconstituted with SykmNG-WT (left), SykmNG-Y130E (middle), or SykmNG-Y130F (right) after 4–5 min stimulation with 0.1 µg/ml DNP-BSA. Scale bar: 5 µm. (B) Quantification of FcεRI recruitment capacity for Syk. Individual aggregates of AF647-IgE were masked, and the total intensity within the mask for both the AF647-IgE and SykmNG channels is plotted per aggregate. Recruitment is similar for SykmNG-WT and each mutant. (C) Cumulative probability distributions of trajectory lengths for SykmNG-WT, SykmNG-Y130E, and SykmNG-Y130F both before (dashed lines) and after (solid lines) addition of 1 µg/ml DNP-BSA. (D) Bar graph depicts the slow off-rate (ks) found when fitting the distributions in C. Fraction of slow off-rate component (αs) increases with DNP-BSA dose for SykmNG-WT and each mutant (right). Error bars are a 68% credible interval (see Materials and Methods).
We next considered whether these mutations could alter the interaction dynamics of Syk at the membrane. Using the SykmNG-Y130E and SykmNG-Y130F stable cells lines, we used TIRF microscopy to image single SykmNG binding events for both mutant forms of Syk. In the resting state, both the Y130E and Y130F mutants have a similar track-length distribution to that of WT (SykmNG-WT) (Figure 4C, dashed lines). Interesting differences were observed, however, upon activation with DNP-BSA. Although SykmNG-WT and SykmNG-Y130F showed the expected increase in track-length distribution with FcεRI activation, track lengths of SykmNG-Y130E did not shift to the same extent. These distributions were best fitted to a two-component model with a modified off-rate, ks, for Y130E mutants of 0.87 s−1, compared with 0.62 s−1 for SykmNG-WT and 0.65 s−1 for SykmNG-Y130F (Figure 4D and Supplemental Table S1). An increased off-rate for SykmNG-Y130E was also observed in cells expressing endogenous Syk (Supplemental Figure S3, A and B). The fraction of ks for all three Syk isoforms exhibited a similar increase as a function of DNP-BSA dose (Figure 4D, right), consistent with the idea that higher antigen doses are associated with an increase in the number of long-lived Syk binding events.
Mast cell responses are sensitive to Syk lifetime on FcεRI
Mast cells are known to release histamine and other granule contents within minutes of FcεRI stimulation, followed by transcriptional up-regulation of cytokine and chemokine production (Metcalfe et al., 1997). To explore whether the subtle dynamic changes we observed for the Syk-Y130E off-rate have functional consequences, we evaluated the impact on FcεRI-mediated release of inflammatory mediators. Syk-KO cells reconstituted with either SykmNG-WT or SykmNG-Y130F have comparable degranulation responses to antigen stimulation (Figure 5A and Supplemental Figure S1). In contrast, cells reconstituted with SykmNG-Y130E were incapable of secreting preformed mediators under the same stimulating conditions (Figure 5A and Supplemental Figure S1). To ensure that SykmNG-Y130E reconstituted cells were competent for degranulation, we also treated replicate samples with ionomycin (1 μM) plus phorbol 12-myristate 13-acetate (PMA). Syk-Y130E cells do release granule contents in response to stimuli that bypass the receptor to elevate calcium levels (Supplemental Figure S2B). Additionally, we found that kinase activity in vitro was similar for all three Syk variants (Supplemental Figure S2C); thus impaired degranulation in the SykmNG-Y130E–expressing cells cannot be explained by altered kinase activity.
FIGURE 5:

Key mast cell outcomes are impaired in SykmNG-Y130E cells. (A) Degranulation measured by relative β-hexosaminidase released after 30 min of incubation with 0.1 µg/ml DNP-BSA in Syk-KO cells reconstituted with SykmNG-WT, SykmNG-Y130E, or SykmNG-Y130F. (B) Comparison of cytokine concentration in cell media of Syk-KO cells reconstituted with SykmNG-WT, SykmNG-Y130E, or SykmNG-Y130F before and after 3-h stimulation with 0.1 µg/ml DNP-BSA. Results were repeated at least three times for all four cytokines. Bar plots represent mean and SD of technical replicates in one representative sample preparation. (C) The formation of actin plaques at the basolateral surface (left) and ruffling on the apical surface (right) in response to 0.1 µg/ml DNP-BSA treatment in both SykmNG-WT and SykmNG-Y130E reconstituted Syk-KO cells. Filamentous actin labeled with phalloidin-AF647 (red). Scale bar: 2 µm. (D, E) Heat maps of relative changes in intracellular calcium concentration upon either addition of a (D) low dose (0.001 µg/ml) or (E) high dose (1 µg/ml) of DNP-BSA. Each row represents the ratio of Fura-2 emission using 350-nm/380-nm excitation for a single cell over time. Ratio color bar scale range, one- to twofold increase: blue–red. (F) Relative increase in Fura-2 ratio per cell after addition. (G) Time between antigen addition and response for each cell. (F,G) Stimulated with 1 µg/ml DNP-BSA and calculated as described in Materials and Methods.
We also evaluated release of newly formed mediators from each of the three Syk-reconstituted cell lines during 3 h of stimulation with 0.1 μg/ml DNP-BSA, including the cytokines IL-3, TNFα, and IL-4 and the chemokine MCP-1 (CCL2). In SykmNG-WT– and SykmNG-Y130F reconstituted cells, antigen stimulation led to production of all four factors (Figure 5B). SykmNG-Y130E cells, on the other hand, completely lost the ability to produce TNFα and IL-3, while production of MCP-1 was normal or somewhat attenuated compared with WT or Y130F-expressing cells. IL-4 production in SykmNG-Y130E cells was variable, but detectable in two of four samples.
FcεRI activation is also known to induce phosphoinositide 3-kinase (PI3K)-dependent ventral cell ruffling and dorsal actin plaque formation (Pfeiffer and Oliver, 1994; Barker et al., 1995). Figure 5C shows that these responses are comparable in Syk-KO cells reconstituted with either SykmNG-WT or the SykmNG-Y130E mutant. Because PI3K-mediated production of phosphatidylinositol 3,4,5-triphosphate (PtdIns(3,4,5)P3) allosterically enhances phospholipase C (PLC)-γ activity in this system (Barker et al., 1999; Smith et al., 2001), we next performed ratiometric imaging of calcium signaling in Fura-2–loaded single cells. Heat maps in Figure 5, D and E, report the composite profiles of calcium responses in at least 30 cells per condition following the addition of antigen. Stimulation with low antigen dose (0.001 μg/ml DNP24-BSA) induced measurable calcium responses in SykmNG-WT (33 out of 71 cells) or SykmNG-Y130F (37 out of 72 cells) reconstituted cells, consistent with previous observations. By comparison, SykmNGY130E expressing cells were markedly impaired, with only ∼10% (eight out of 84 cells) demonstrating any measurable calcium response to low antigen dose. Notably, SykmNG-Y130E–expressing cells were capable of initiating a calcium response after challenge with high antigen dose (1 μg/ml), as shown in Figure 5E. However, while the amplitude of the calcium response was similar between the three cell types at high antigen dose (Figure 5F), the onset of calcium flux was delayed by ∼20 s in the Syk-Y130E–expressing cells (Figure 5G).
Syk phosphorylation kinetics are finely tuned to ITAM interaction times
Syk-Y130E strikingly failed to support a number of key mast cell outcomes (degranulation and TNFα and IL-3 release), whereas other responses downstream of FcεRI activation were unaffected (MCP-1 production, ruffling). This suggests that the reduced interaction times observed for Syk-Y130E correlate with differences in phosphorylation linked to specific arms of the FcεRI signaling network. Western blot analysis was performed to compare the extent of phosphorylation at four critical tyrosine residues (Y317, Y342, Y346, Y519/520) within WT and mutant SykmNG after 5 min of stimulation with 0.1 μg/ml DNP-BSA (Figure 6A). Both SykmNG-WT and SykmNG-Y130F were strongly phosphorylated at all four tyrosine sites in response to antigen, while SykmNG-Y130E demonstrated a varied phosphorylation profile. Two of the sites in the I-B linker region (Y317, Y346) are known substrates of Lyn (Keshvara et al., 1998; Sanderson et al., 2010), although they can also be trans-phosphorylated by adjacent Syk molecules (Tsang et al., 2008). The other two sites (Y519/520 and Y342) are critical Syk autophosphorylation sites. In cells reconstituted with SykmNG-Y130E, phosphorylation at Y317 and Y346 was unimpaired, while phosphorylation of Y519/520 and Y342 was markedly inhibited: we observed a twofold reduction in phosphorylation at Y519/520 and a fivefold reduction in phosphorylation at Y342 (Figure 6A, right). This altered SykmNG-Y130E phosphorylation was also observed in parental RBL-2H3 cells expressing these constructs (Supplemental Figure S3C), demonstrating that the presence of endogenous WT Syk cannot rescue SykmNG-Y130E phosphorylation at these two sites.
FIGURE 6:

Phosphorylation kinetics of Syk and downstream signaling partners. (A) Western blot detection of the Syk phosphorylation profile in Syk-KO cells reconstituted with SykmNG-WT, SykmNG-Y130E, or SykmNG-Y130F in response to stimulation with 0.1 µg/ml DNP-BSA for 5 min. Bar plots (right) represent mean and SD of relative Syk phosphorylation level from at least three experiments. Phosphorylation of tyrosines associated with Syk autocatalytic activity (pY519/520 and pY342) is significantly reduced (t test: *, p < 0.05; **, p < 0.01) in SykmNG-Y130E. No significant difference (n.s) in phosphorylation is seen at sites susceptible to Lyn catalytic activity (pY317, pY346). (B) Western blot detection of the phosphorylation time course of downstream signaling molecules Vav1, LAT, and ERK. Cells were stimulated with 0.1 µg/ml DNP-BSA for 0, 2, or 5 min. Bar plots (right) represent mean and SD of the relative phosphorylation levels from three experiments (t test: *, p < 0.05).
Decreased phosphorylation at specific Syk autophosphorylation sites is predicted to impair docking of Syk binding partners and/or inhibit their Syk-mediated activation by phosphorylation. Figure 6B reports changes in tyrosine phosphorylation profiles for two Syk substrates downstream of FcεRI activation: LAT (Wilson et al., 2004) and Vav1 (Margolis et al., 1992). We also evaluated phosphorylation of ERK as a readout of the Ras-MAPK pathway (Graham et al., 1998). In cells expressing SykmNG-WT, LAT phosphorylation peaked at 5 min after stimulation with 0.1 μg/ml DNP24-BSA. The onset of LAT phosphorylation was consistently faster in cells reconstituted with SykmNG-Y130F (n = 3), peaking at 2 min rather than 5 min, suggesting that this mutant is equal to (or slightly better than) SykmNG-WT at coupling with LAT. In contrast, LAT phosphorylation was delayed in SykmNG-Y130E and reached only 50% of SykmNG-WT levels by 5 min. We also found that antigen-stimulated SykmNG-Y130E cells had an ∼50% reduction in Vav1 phosphorylation compared with SykmNG-WT cells, consistent with prior work identifying Syk pY342 as a key docking site for Vav1 (Deckert et al., 1996). Finally, phosphorylation of ERK under these conditions was also reduced in SykmNG-Y130E–expressing cells compared with cells reconstituted with either SykmNG-WT or SykmNG-Y130F. Taken together, these results illustrate that the reduced residency time for SykmNG-Y130E translates to impaired autophosphorylation and impaired coupling to at least three downstream signaling branches.
DISCUSSION
Signaling networks are composed of a series of reactions bifurcating from ligand-bound receptors. The importance of key elements, including cellular colocalization of critical players and detailed biochemical reaction schemes, has laid the foundation for our modern understanding of signal transduction. Although these reactions are often depicted as a linear chain of events, the dynamic interplay of signaling partners and the rapid turnover of posttranslational modifications and/or second messengers are critical components necessary to create a highly sensitive system. Studies of the high-affinity IgE receptor (FcεRI) have contributed significantly to our understanding of the spatiotemporal aspects of cell signaling, due in part to the unique architecture of the signaling complexes formed after antigen-mediated cross-linking (Menon et al., 1986). At the onset of signaling, encounters between IgE-bound FcεRI monomers on membranes are diffusion mediated (Menon et al., 1986; Andrews et al., 2009), and the resulting aggregates are influenced by the valency, affinity, and dose of ligand. Because none of the subunits in the FcεRI αβγ2 tetramer bears intrinsic catalytic activity, propagation of signals is dependent on sequential recruitment of extrinsic kinases. The dually acylated Src family kinase Lyn is responsible for rapid ITAM phosphorylation (Eiseman and Bolen, 1992). Prior work has suggested that a fraction of Lyn is colocalized with FcεRI clusters in resting RBL-2H3 cells (Wilson et al., 2000; Veatch et al., 2012), and a small fraction may be prebound to the FcεRI β-subunit (Yamashita et al., 1994; Vonakis et al., 2001). ITAM phosphorylation supports recruitment of the dual SH2-containing Syk tyrosine kinase from the cytosol (Hutchcroft et al., 1992; Shiue et al., 1995).
With the knowledge that Syk translocation is essential for the release of inflammatory mediators from mast cells and basophils (Costello et al., 1996; Zhang et al., 1996), we monitored the dynamics of individual Syk molecules during recruitment to FcεRI in live cells. Recent studies have demonstrated the power of single-molecule imaging methods in capturing the real-time interactions of membrane components with cytosolic binding partners, including clathrin assembly (Cocucci et al., 2012), the TCR’s recruitment of Zap70 (O’Donoghue et al., 2013), and Grb2 association with epidermal growth factor receptor (EGFR) (Ichinose et al., 2006). These works have illustrated the inherent stochastic nature of binding events at the single-molecule level, as well as the highly transient nature of protein interactions during active signaling and trafficking. Our SPT studies of Syk show that interactions with phosphorylated receptors are transient. We used the Syk trajectory lengths to extract a characteristic off-rate for the interaction of Syk at the membrane. From our fitting, we found that the distribution of Syk trajectories was best characterized by a mixture of two rate constants, a nonspecific, fast off-rate (kf = 2.6 s−1) and a slow off-rate (ks = 0.62 s−1) that was directly associated with FcεRI phosphorylation. The fraction of this slow off-rate component increased with higher DNP-BSA dose and IgE-FcεRI aggregation and was ablated in dasatinib-treated cells. Model comparison analysis of fits using a globally constrained ks value across all conditions versus a freely varying ks value revealed that our data were best fitted to a model in which the ks value does not vary with antigen dose (only the fraction of trajectories characterized by ks varies with dose). This suggests that higher antigen doses and larger IgE-FcεRI aggregates do not alter the fundamental Syk-pITAM interaction kinetics but increase the concentration of pITAMs available for Syk binding. Future work using different antigen geometries or affinities will be important to explore whether other local receptor environments influence Syk-pITAM kinetics.
Mathematical models have led to the prediction that membrane receptor clustering can favor multiple rebinding events between receptors and their signaling partners (Das et al., 2009; Radhakrishnan et al., 2012). Given the limitations of frame rate at which our data were acquired, we considered the possibility that rapid rebinding events to receptors in the same complex aggregate might artificially inflate the observed Syk off-rate. However, we found no correlation between track length and size of receptor aggregates. One interpretation is that, in the unique case of Syk, rebinding may be prevented due to the sequence of conformational and posttranslational changes.
ITAM-bearing receptors, such as the TCR, provided early motivation for use of kinetic proofreading models to study the dependence of signal transduction events on ligand–receptor binding kinetics (McKeithan, 1995). In its simplest form, kinetic proofreading predicts that high-affinity ligand–receptor bonds enable completion of a series of intermediate steps necessary to generate productive signals. This mechanism imposes constraints on signaling from nonspecific interactions and provides sensitivity to differences in dose and affinity. However, the FcεRI system also provided early evidence that distal events, including cytosolic messengers, might provide an alternative means of kinetic discrimination for the generation of qualitatively different signals (Hlavacek et al., 2001; Liu et al., 2001). Prior work by others established conditions using low- and high-affinity ligands for cross-linking IgE-FcεRI complexes that achieved similar receptor phosphorylation levels but differential outcomes. For example, degranulation and TNFα secretion were reduced after challenge with low-affinity ligands, while chemokine (specifically MCP-1) production was unaffected or superior (Liu et al., 2001; Suzuki et al., 2014). Rivera and colleagues proposed that the signaling differences could be explained, at least in part, by differential recruitment of Src family kinases (Fgr) and the membrane scaffold, LAT2/NTAL (Suzuki et al., 2014). Both groups also reported a reduced phosphorylation of Syk with low-affinity ligand stimulation. We show here that a single point mutation, Y130E, in Syk alters mast cell signaling in ways that are remarkably similar to stimulation with low-affinity ligand (Liu et al., 2001; Suzuki et al., 2014). These distinct cellular outcomes have the potential to promote differential regulation of the immune response. In fact, the prior study linked the ability of low-affinity ligand to evoke chemokine secretion in the absence of degranulation to increased inflammatory macrophage recruitment (Suzuki et al. 2014). We used the same high-affinity, high-valency ligand across all our experiments comparing SykmNG-WT and Syk-Y130E cells. Therefore we expect that FcεRI aggregation kinetics and geometry are consistent in our experiments and that recruitment of Src family kinase members is also unaltered. We found that the reduction in Syk-Y130E phosphorylation was site specific. No change in the Lyn-dependent site Y346 (Sanderson et al., 2010) was observed, again consistent with similar levels of Lyn/Src kinase recruitment. However, sites subject to autophosphorylation (Sanderson et al., 2010) were variable: phosphorylation at Y317 was unchanged, Y519/520 was reduced twofold, and Y342 was reduced fivefold. This pattern suggests a hierarchy of phosphorylation events that is sensitive to FcεRI interaction conditions. It also explains, at least in part, the differential signaling outcomes. For example, pY342 has previously been shown to be critical for Syk to interact with and phosphorylate the downstream partner Vav1 (Deckert et al., 1996; Simon et al., 2005), while pY346 is a critical site for recruitment of Cbl ubiquitin ligase, which is implicated in negative regulation of FcεRI signaling (Keshvara et al., 1998; Lupher et al., 1998).
The correlation between Syk binding lifetime, phosphorylation kinetics, and cellular outcome is consistent with the idea that the timing of interactions is critical to produce a fully modified protein. Previous in vitro experiments measured the binding of recombinant WT and mutant Syk-SH2 domains to dually phosphorylated TCR-ITAM peptides (Zhang et al., 2008). On the basis of these data, we expected as much as a 10-fold difference in binding lifetime for WT and Syk-Y130E. The difference that we measured in live cells is only 1.4-fold, which could be explained by conformational constraints of the intact Syk protein, spatial aspects of disulfide-linked full-length, dimeric γ-subunits, and/or influence of the lipid bilayer on ITAM accessibility (Lopez et al., 2015). Because Syk also exhibits distinct affinities for particular ITAM sequences, ranging from 4 to 40 nM (Tsang et al., 2008), we might expect that the off-rate of Syk binding will vary in other cellular contexts. In vitro experiments have led to the description of Syk as a molecular switch that acts as an “OR” gate, whereby it is an equally active kinase 1) when engaged in ITAM binding in the open conformation or 2) when autophosphorylated (Tsang et al., 2008). However, our data here suggest that the two mechanisms are connected in a tightly controlled sequence. If Syk is bound sufficiently long to FcεRI to progress to a fully autophosphorylated state, it will remain active after dissociation into the cytosol. If the lifetime of ITAM binding is shorter, as with the Y130E mutant, both arms of the “OR” gate would be affected, leading to less efficient signaling. It follows that the lifetime of active, unbound Syk will also have a limited lifetime, because it will be reversed upon encountering a phosphatase. Importantly, our results demonstrate that kinetic discrimination occurs at the level of Syk, where the extent of Syk phosphorylation at specific sites directs the cellular outcome.
We have demonstrated that Syk activation occurs through transient association with FcεRI. Live-cell studies of Zap70 interacting with TCR have shown a transient interaction between kinase and receptor, with a range of dwell times from 0.2 s to tens of seconds (Bunnell et al., 2002; O’Donoghue et al., 2013; Klammt et al., 2015; Park et al., 2016). Although our measurements also found Syk binding to be transient, with lifetimes in the range of those reported for Zap70, it is interesting to note several significant differences between these two family members. Lillemeier and colleagues have used FRAP to examine the interaction time of Zap70 with TCR microclusters (Klammt et al., 2015; Katz et al., 2017). They found that I-B domain residues control the rates of transition between open and closed conformations of Zap70 and that Zap70 closed-conformation mutants exhibited shorter TCR microcluster dwell times than WT (Klammt et al., 2015). This shorter dwell time was associated with reduced phosphorylation of Zap70 by its Src family kinase, Lck (Klammt et al., 2015). For Syk, we found that shorter dwell times are not associated with impaired Lyn-dependent Syk phosphorylation; instead, Syk-Syk trans-phosphorylation is reduced. Recently the same group examined mutations in the Zap70 I-A domain at Y126, the site analogous to Y130 in Syk (Katz et al., 2017). They showed that phosphorylation of Y126 promotes an increased exchange rate of Zap70 from the TCR. In contrast to our results with Syk, Zap70-Y126F displayed longer dwell times than WT. Expressing either Zap70-Y126E or Zap70-Y126F mutants resulted in altered TCR signaling. However, Zap70-Y126F showed impaired calcium signaling and reduced LAT and ERK phosphorylation, outcomes that are more similar to Syk-Y130E in mast cells. Therefore, while Syk and Zap70 share many structural and functional similarities, their distinctive characteristics underscore the need to avoid generalizations about their regulation. Another interesting distinction is the role of Syk in nonimmune cells, where the Syk-Y130E substitution is described as a gain-of-function mutation, because it promotes increased adhesion and microtubule dynamics (Yu et al., 2015). Clearly, the cellular context must be considered when dissecting the molecular mechanisms that govern protein function.
In summary, single-molecule imaging has allowed us to quantify the transient interactions between FcεRI and Syk that drive mast cell signaling. We found that FcεRI-Syk binding dynamics are invariant with receptor aggregate size or receptor mobility. We also found that small changes in the dynamics of Syk binding, induced by the phosphomimetic mutation Y130E, are associated with significant alterations in the Syk phosphorylation profile and impaired mast cell responses. Taken together, these results support a model consistent with Syk-ITAM interactions that are independent of local receptor density but highly sensitive to interaction time.
MATERIALS AND METHODS
Antibodies, antigens, and reagents
All IgE used in this study was H1-DNP-ε-206 IgE, prepared as described previously (Liu et al., 1980). DNP-BSA containing ∼15–25 DNP per BSA was purchased from Thermo Fisher Scientific (A23018), and DNP-lysine was purchased from Sigma (Nε-DNP-l-lysine hydrochloride, D0380). AF647-IgE was generated using NHS-chemistry as previously described (Schwartz et al., 2015), resulting in an average dye to protein ratio of 3:1. Briefly, AF647-NHS ester dye (Thermo Fisher Scientific; A20006) was reacted at a 10:1 ratio with IgE, and excess dye was purified using a PD MidiTrap G-10 Sephadex desalting column (GE Healthcare; 28-9180-11). All references to pY Syk are named according to tyrosine positions in rodent Syk. Antibodies used are listed as follows: horseradish peroxidase–conjugated anti-pY99 and anti-pY20 (Santa Cruz Biotechnology; sc7020, sc508), anti-mouse and anti-rabbit secondary antibodies (Santa Cruz; SC-7020 SC-2004), Syk (Cell Signaling; D3Z1 XPR #13198), pY-Syk pY342 (Abcam; 195700), pY519/520 (Cell Signaling; C87C1, 2710), pY317 (Abcam; AB63515), pY346 (Cell Signaling; 2701), pY-Vav1 (Abcam; ab47282), Vav1 (Cell Signaling; 2502), LAT (LS- C46104), ERK (Cell Signaling; 137F5), and pY-ERK (Cell Signaling; D13.14.4E). Dasatinib was purchased from Santa Cruz Biotechnology (SC-358114) and diluted in dimethyl sulfoxide before further dilution to ensure solubility. Ionomycin and PMA were from Sigma-Aldrich (I3909, 79326). Fura-2 AM and AF647-phalloidin were from Thermo Fisher Scientific (A22287, F1201).
Genome editing: Syk-KO cell line
Cas9-mediated DNA cleavage was used to knock out the endogenous gene coding for the Syk protein in RBL-2H3 cells via the insertion of a premature stop codon in the first exon of the gene. A highly specific single guide RNA (gRNA) (5′-GGCCAGAGCCGCAATTACCT-3′) targeting the first exon of rat Syk was designed using the http://crispr.mit.edu portal and then subcloned into PX458 vector (Addgene plasmid #48138) for simultaneous expression of the gRNA, WT Cas9, and a green fluorescent protein (GFP) reporter. For the gRNA subcloning, two partially complementary oligonucleotides (Integrated DNA Technologies) were assembled by PCR. Gel-purified PCR products were cloned into BbsI-digested PX458 using Gibson Assembly (NEB) following the manufacturer’s specifications. After cloning and sequencing, the final plasmid was used to transiently transfect RBL-2H3 cells using the Amaxa system (Lonza) following the manufacturer’s recommendations. Positive, GFP-expressing cells were selected by flow cytometry using an iCyt cell sorter and immediately plated at suboptimal concentration in 96-well plates. Subclones were screened using Western blotting to identify clones with no Syk expression. The absence of residual GFP expression in Syk KO clones was assessed using a Nikon TE2000 epifluorescence microscope.
Constructs
SykmNG-WT, SykmNG-Y130E, and SykmNG-Y130F all refer to murine Syk DNA C-terminally fused to mNG via a short V5 linker (GGTAAGCCTATCCCTAACCCTCTCCTCGGTCTCGATTCTACG) tag. The V5 tag was added to mNG (Allele Biotechnology User License) via fusion PCR. Murine Syk cDNA (Thermo Scientific, MMM1013-202858457) fused to V5-mNG was generated by gene fusion PCR (Ho et al., 1989) using PfuUltra DNA polymerase (Stratagene). Y130E and Y130F mutations were introduced during gene fusion via primers with the corresponding mutation at codon 130. Total cDNA was amplified by PCR before subcloning into pcDNA3.1 directional topo vector (Life Technologies). All constructs were checked by sequencing.
Cell lines
RBL-2H3 cells (Metzger et al., 1986; Wilson et al., 2000) were cultured in MEM supplemented with 10% heat-inactivated fetal bovine serum, puromycin, and l-glutamine. To ensure authenticity, cells were checked for IgE binding and degranulation response after each thaw and used for up to 10 passages. Transfections were performed using the Amaxa system (Lonza) with Solution L and Program T-20. Stable cell lines were generated through G418 selection over a 1-wk period followed by isolation of positive, mNG-expressing cells using an iCyt cell sorter with a 525/50-nm emission filter. Cell lines were checked for equal expression levels before experiments using an Accuri C6 flow cytometer (FL-1) and sorted again when needed. For all microscopy experiments, cells were plated into eight-well Lab-Tek (Nunc) chambers at a density of 50,000 cell/well, primed overnight with unlabeled or AF647-IgE as indicated, and then imaged within 24 h.
Immunoblotting and immunoprecipitation
Cells (3 × 10⁶) were plated on 100-mm tissue-grade culture plates and primed overnight with IgE. Cells were stimulated with 0.1 μg/ml DNP-BSA or mock for indicated time at 37°C in Hank’s buffered saline. Cell lysates from each plate were prepared in cold NP-40 lysis buffer. Protein concentration of cleared lysates was measured by bicinchoninic acid assay (Pierce, Rockford, IL), and equal amounts of total protein were separated on a 4–15% polyacrylamide gel (Bio-Rad, Hercules, CA), transferred to nitrocellulose (Life Technologies, iBlot transfer system), probed with the indicated antibody according to the manufacturer’s recommendation, and imaged using enhanced chemiluminescence on a Bio-Rad ChemiDoc. For detection of LAT phosphorylation, samples were immunoprecipitated using protein A beads (Amersham GE Healthcare) loaded with anti-LAT primary antibody, then immune complexes were denatured and immunoblotted as described. Band intensities were quantified using the Bio-Rad Image Lab Software (Image Lab, version 4.0.1) automatic band detection or via the volume tool with automatic background adjustment. Phosphorylated band intensity was normalized to total protein, and all bands were adjusted for loading using β-actin.
Kinase activity assay
Syk-KO cells stably expressing SykmNG-WT, SykmNG-Y130E, SykmNG-Y130F, or mock were lysed and immunoprecipitated using mNeonGreen nAb Agarose beads (Allele Biotechnology; ABP-NAB-MNGA050) according to the manufacturer’s protocol. Kinase activity was assessed as described previously (Steinkamp et al., 2014). Syk protein concentration across precipitate samples was semiquantified by SDS–PAGE followed by immunoblotting using an anti-Syk antibody. Blots were incubated, exposed, and quantified as described in the Immunoblotting and immunoprecipitation section. Absorbance for SykmNG-WT, SykmNG-Y130E, and SykmNG-Y130F precipitates was normalized by relative protein levels with the absorbance for Syk-KO precipitates used as a baseline offset.
Degranulation
Cells were grown in 24-well tissue culture plates for 24 h and primed with IgE. Cells were washed and stimulated in Hank’s buffer with indicated concentration of DNP-BSA for 30 min at 37°C. Release of granular content was measured by β-hexosaminidase concentration as previously described (Schwartz et al., 2015). For determination of calcium-independent secretion potential, cells were treated with 1 μM ionomycin (Sigma I3909-1mL) and 50 nM PMA (phorbol 12-myristate 13-acetate, Sigma #P1585-1MG) for 30 min at 37°C.
Calcium imaging and analysis
Measurements were carried out as previously described (Schwartz et al., 2015). The ratio of fluorescence intensity at 350-/380-nm excitation was calculated for each cell over time after background subtraction. Calcium ratio time courses were fitted to a model:
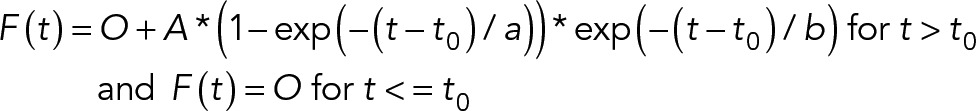 |
where O is the prestimulation signal, t0 is the lag time between stimulation and response, A is the maximum rise height, and a and b describe the rise and decay kinetics, respectively.
Cytokine release measurements
Cells were primed with IgE and grown in six-well tissue culture plates for 24 h. Cells were washed and stimulated in Hank’s buffer with 0.1 μg/ml DNP-BSA for 3 h. Supernatants were collected and mailed for shipment to RayBiotech, according to company protocol. Cytokine quantification was performed in-house by RayBiotech using their custom Rat Biomarker Quantibody platform. Samples were run in triplicate to assess technical variability. Results from at least three separate sample preparations for each cytokine were used to assess repeatability.
Confocal microscopy
Cells were primed with AF647-IgE and imaged using a Zeiss LSM800 laser-scanning confocal microscope equipped with a 63× oil objective and both 488- and 640-nm solid-state diode-laser excitation. Cells were imaged in Hank’s buffer at 35°C. For FRAP studies, cells were stimulated for more than 3 min with 0.1 μg/ml DNP-BSA. Small regions of interest (ROIs) were identified, and then a bleaching time series was acquired using the Zen2 software bleach ROI tool. For quantification, signal intensity recovery within the bleach regions was compared with signal in nonbleached regions to correct for photobleaching and background offset, then normalized to the prebleach intensity of the region. For actin labeling, cells were stimulated for 4 min with DNP-BSA before fixation with 4% paraformaldehyde (PFA) for 15 min followed by addition of ∼6.6 µM AF647-phalloidin for 30 min.
TIRF microscopy optical setup
All TIRF imaging data were collected using an inverted microscope (IX71; Olympus) equipped with a 150×/1.45 NA oil-immersion, TIRF objective (U-APO; Olympus). A 637-nm laser diode (HL63133DG; Thorlabs) was used for AF647 excitation, and a 488-nm laser (Cyan Scientific; Spectra-Physics) was used for fluorescence excitation of mNG. A quad-band dichroic and emission filter set (LF405/488/561/635-A; Semrock) was used for sample illumination and emission. Emission light was separated onto different quadrants of an electron-multiplying charge-coupled device (EMCCD) camera (iXon 897; Andor Technologies), using a custom-built two-channel splitter with a 655-nm dichroic (Semrock) and 584/20-nm, 690/20-nm additional emission filters. Images had a pixel size of 0.106 μm and were acquired at 10 frames per second (100-ms exposure time).
Live-cell TIRF microscopy
Samples were imaged in Hank’s buffer at 35°C, and temperature was maintained using a Bioptics Objective heater. Images were acquired before, during, and for up to 5 min after addition of DNP-BSA at the indicated concentrations. The 637-nm laser diode excitation was pulsed to limit photobleaching of AF647-IgE; every 10 frames, the laser was cycled on for two frames and then off for eight frames. A 488-nm laser intensity of 0.006 kW/cm2 was used for all imaging of single mNG-Syk molecules. If the mNG expression level in a cell of interest was too high, it was photobleached slightly out of TIRF with 0.38 kW/cm2 488-nm laser intensity before image acquisition, meaning a population of dark/bleached Syk-mNG also existed in all images. For dasatinib treatment, cells were incubated with 1 μM dasatinib for 30 min before imaging and also maintained during imaging and stimulation with DNP-BSA. For DNP-lysine addition, cells were prepared and activated as described for 4–5 min, allowing visible AF647-IgE aggregation, followed by addition of DNP-lysine to a final concentration of 100 μM. Cells were imaged continually during this process.
TIRF microscopy channel registration
Quadrants of the EMCCD camera representing different fluorescence emission channels were aligned as follows. White-light illumination through a channel-alignment grid slide (Miraloma Tech) that contained a 20 × 20 array of 200 ± 50 nm holes at an intrahole distance (nonregular) of 3 ± 1 microns (total size ∼60 × 60 microns) was used to create an estimation of single point emitters appearing in both quadrants at regular samplings across the channel. The intensity passing through the holes was optimized to maximize number of photons without saturation. The localizations within each channel were then used to create a locally weighted transform matrix using the Matlab “fitgeotrans” method with the “lwm” option and the recommended 12 control points (Goshtasby, 1988).
Image masking
Intensity masking to quantify and compare the extent of IgE/Syk aggregation was carried out using image-processing functions from Matlab (MathWorks) and the freely available Matlab package DipImage (Delft University of Technology). A whole-cell mask was identified by Gaussian filtering the image (kernel size = 2) and then thresholding using Matlab’s “multithresh” function, followed by the DipImage “closing” function. The overall image intensity was corrected for photobleaching by normalizing to the relative change in intensity within the whole-cell mask over time. A two-step image-segmentation process was used to identify aggregates within this cell mask. 1) Images were smoothed and filtered using the DipImage “smooth” and “dcc” functions, then a threshold was identified using the Matlab “multithresh” function and applied to the image, generating a mask representing regions of aggregation within the image. 2) For better isolation of individual aggregates, a watershed transform was applied using the DipImage “watershed” method with connectivity = 1, creating a second mask representing local areas of minimum intensities (watershed lines). The watershed lines from this step were then removed from the aggregate mask found in the first step to generate a final mask. The fluorescence intensity within each isolated mask was measured using the DipImage “label” and “measure” functions. The dynamics of aggregated AF647-IgE are relatively slow, so for analysis purposes, masks and corresponding mask intensities during “laser off” frames between 637-nm laser-excitation pulses (as described in the Live-cell TIRF microscopy section) were assumed to be static.
Superresolution imaging
Parental RBL cells labeled overnight with AF647-IgE (as described in the Cell lines section) were washed three times with warm Hank’s buffer to remove any unbound AF647-IgE; this was followed by stimulation at the indicated concentration of DNP-BSA in Hank’s buffer for 5 min at 37°C. Cells were then quickly fixed with 4% PFA, 0.2% gluteraldehyde for 2 h. Cells were extensively washed with phosphate-buffered saline and once with 10 mM Tris-HCl (pH 7.2) for 10 min to quench reactive cross-linkers. Samples were imaged as previously described (van den Dries et al., 2013; Valley et al., 2015) using the same optical setup as described in the TIRF microscopy optical setup section and 637-nm laser power of ∼1.7 kW/cm2. Images were acquired at 57 frames/s in TIRF. Between 10,000 and 20,000 frames were collected for each image reconstruction. The sample chamber was mounted in a three-dimensional piezostage (Nano-LPS; Mad City Labs, Madison, WI) with a resolution along the x,y,z-axes of 0.2 nm. Sample drift was corrected for throughout the imaging procedure using a custom-built stage-stabilization routine.
Superresolution image reconstruction and cluster analysis
dSTORM images were analyzed and reconstructed with custom-built MATLAB functions as described previously (van den Dries et al., 2013; Yan et al., 2014). Images were reconstructed from between 5 × 10⁵ and 5 × 10⁶ fit positions. To characterize the degree of AF647-IgE-FcεRI aggregation, we used an implementation of Matlab’s hierarchical clustering algorithm “linkage()” using the “single” method to group localizations into clusters. Code for this analysis, “Clustering Classes Version 2,” along with more information regarding the technique (Lin et al., 2016), is available through the University of New Mexico’s SpatioTemporal Modeling Center website (http://stmc.health.unm.edu/tools-and-data).
Diffusion coefficient estimation
Trajectories of single SykmNG (300–3000; see Supplemental Table S1) were used for each indicated concentration of DNP-BSA to calculate a diffusion coefficient using a previously developed maximum-likelihood estimation algorithm (Relich et al., 2016). The 95% confidence intervals were calculated using a log-likelihood ratio test (Pawitan, 2001).
Code availability
All computer code is available upon request.
Extracting dissociation rates from single-particle tracking of low signal-to-noise data
As has been nicely summarized previously (O’Donoghue et al., 2013; Woody et al., 2016; Presman et al., 2017), successful characterization of binding lifetimes from single-molecule fluorescence data is highly dependent on the ability to 1) minimize photobleaching while maintaining an adequate signal-to-noise ratio, 2) accurately localize single molecules and connect them across frames to build trajectories, and 3) accurately fit the distribution of trajectory lengths (representing the binding duration) to a binding model. Use of the mNG fluorophore (Shaner et al., 2013) allowed us to tune our laser power such that the rate of photobleaching was over an order of magnitude slower than our observed dissociation rates (Supplemental Figure S4A). The next sections detail our localization, tracking, and off-rate parameter estimation.
Localization intensity–based change point detection and thresholding
We found that many SykmNG trajectories represented more than a single molecule within a diffraction-limited area. We used an intensity change point algorithm (Ensign and Pande, 2009; O’Donoghue et al., 2013) to identify changes in intensity over the duration of the trajectory (Supplemental Figure S4B). This algorithm uses a Bayesian model-selection technique to identify discrete changes of mean intensity for sequences of Poisson-distributed data. The only parameter for the model is a Bayes factor used in a recursive decision procedure to divide each trajectory into segments of constant mean intensity. Similar change point profiles were found over a wide range of Bayes factors, but given the experimental variability, we chose a conservative Bayes factor of 2.35 × 10¹⁷. We also characterized the expected fluorescence for single mNG molecules in TIRF using our experimental setup. Owing to variability in fluorescence illumination and cell membrane morphology, we do not expect the fluorophore intensity to be exactly Poisson distributed. Therefore we chose to experimentally characterize the fluorescence intensity distribution for single-molecule mNG using an mNG fused to an unrelated, artificial pyrabactin resistance–like (PYL) tag (mNG-PYL) (generously provided by Fu-Sen Liang, University of New Mexico) that exhibited significant nonspecific binding at the membrane. On the basis of this empirical intensity distribution, we found <1% probability that a single mNG has intensity Imax ≥ 200 photons. Imax was therefore used as a cutoff to exclude any localizations within our data that were obviously too bright to represent a single mNG. Any trajectories containing more than two localizations above Imax were not included in the analysis. We also found the mean fluorescence intensity for all mNG-PYL localizations to be Imean = 49.1 photons. This value is consistent with the approximate size of the change point increments found using our change point analysis, even though the analysis does not have any a priori knowledge of the intensity change magnitudes. The trajectory distribution of mNG-PYL was fit to a single exponential with an off-rate of 1.8 s−1.
Single-particle tracking method for low signal-to-noise data
1. Segmentation of particle candidates: The segmentation and localization of particle candidates is handled through custom software. Segmentation is performed by identifying potential emitters as the local maxima of a filtered image. We use a filter that convolves the image with the second derivative (Laplacian) of the Gaussian approximation to the microscope point spread function (PSF). Candidate maxima are then thresholded based on their intensity in the filtered image.
Our localization procedure uses a new likelihood-based method. Like other established localization methods, we assume a two-dimensional pixelated Gaussian PSF model under Poisson noise. Unlike the maximum-likelihood estimation (MLE) approach employed in previous methods (Smith et al., 2010), we take a Bayesian approach based on finding the maximum a posteriori (MAP) estimate. The MAP parameter estimator uses a prior probability to regularize the likelihood function, making fast but fallible local-optimization procedures such as the Newton-type methods more robust when used on data from high-speed, low-intensity applications. The MAP estimator uses numerical optimization to find the parameters  , such that
|
|
Here θx and θy are the emitter’s position; θI is the emitter intensity in photons; θb is the mean background signal per pixel in photons; and θσ is the SD of the apparent Gaussian PSF. The data are the image, D, a vector giving the photon counts at each pixel. The likelihood function, P(D | θ), under the Poisson noise assumption is described in (Smith et al., 2010). Finally, for the prior P(θ), we use a diagonal (separable) probability distribution, tuned for the emitter intensity profiles of our experiment:
where, for an image of size (Sx, Sy),
Our maximization procedure for the MAP estimation is performed with custom optimization software that uses a bound-constrained Newton’s method with reflective boundary conditions (Coleman and Li, 1994), and deals with nonnegative-definite Hessians using the modified Cholesky decomposition algorithm of Schnabel and Eskow (Schnabel and Eskow, 1999). For each iteration of the optimization procedure, we compute the objective function value L(θ) (Eq. 1), as well as the gradient ∇L(θ) and full Hessian matrix ∇2L(θ). Finally, we evaluate the quality of MAP estimates  , by assuring the Hessian
  is negative-definite at the maxima and the gradient
  . The observed Fisher information (Pawitan, 2001) at the maxima,
  , then can be used to establish the approximate shape of the posterior distribution P(θ | D) in the neighborhood of
  , allowing accurate error bars on the estimated theta to be established.
Using the observed Fisher information, all emitter candidates that have estimates with a negative information value (which occurs on optimization failure) or those with very poor localization accuracy are discarded. The remaining candidates are then processed using the particle-to-trajectory assignment algorithm.
2. Particle-to-trajectory assignments: Localized particles are processed into trajectories by creating connection hypotheses for particle assignments and finding the set of connection hypotheses that return the highest probability value. Inspired by previous approaches (Jaqaman et al., 2008), our method begins with a greedy frame-to-frame connection phase wherein particles are assigned to short trajectories by finding the most likely set of connections between particles localized in sequential frames. We take advantage of temporal symmetry by tracking particles both forward and backward in time, forming two sets of short trajectories. Particle connections that do not exist in both sets are omitted to reduce connection biases that ordinarily result from forward-time frame-to-frame tracking methods.
Next the trajectory segments are connected over a sliding window in time, in which only connections that occur between the starts or ends of trajectories found at the center of the sliding window are kept. This approach once again results in two lists of trajectory connections, depending on whether the start or end of a short trajectory was found in the center of the sliding window. All connections that do not exist in both lists are once again removed to reduce the effect of connection bias. The processed trajectories are then scored based on the quality of their localizations. If a trajectory consists of mainly poor localizations, it will have a low score and will therefore be more likely to be removed. Any localizations that were not assigned to trajectories are discarded from the connection algorithm. Finally, the remaining trajectory segments are assigned to a global cost matrix (Jaqaman et al., 2008) to connect the gaps between short trajectories and more accurately reconstruct the trajectories of long-lived binding events.
3. Assignment costs: From the list of trajectories, the time a trajectory starts (birth) and the time a trajectory ends (death) are collected. The probability of a trajectory beginning or ending on a particular frame is given by a user-defined function of the minimum evidence value e0 = 0.05. The probability that two trajectories, si and sj, should be connected is
 (2) (2)
|
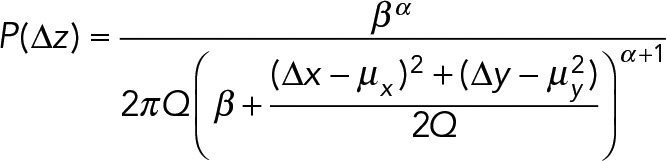
where ∆z represents the particle displacement that would be measured from connecting sj to si. Here M is a user-defined probability of a missed localization in a trajectory and is only relevant when the difference in camera frame times between trajectories is greater than 1. The terms Pl(si) and Pl(sj) represent the plausibility, defined as an upper bound of the probability, that si and sj, respectively, represent a true particle. Particles are connected using a diffusion with drift model. The probability of two-dimensional displacement, ∆z = [∆x, ∆y], in which the particle moves with diffusion constant D and drift rate V = [Vx, Vy], is
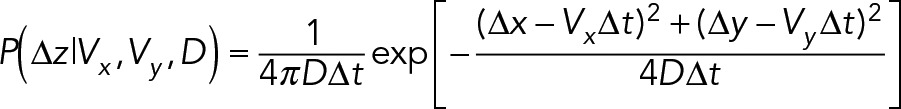 (3) (3)
|
Here ∆t is the number of camera frames elapsed during the measured displacement. The values for diffusion and drift are unknown and unique for every trajectory, so a normal distribution is used for the prior on drift constants and an inverse gamma distribution is used for the prior for diffusion constants:
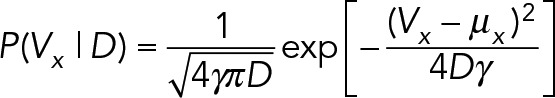 |
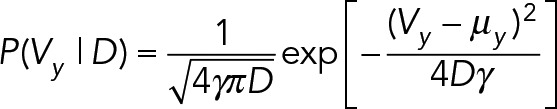 |
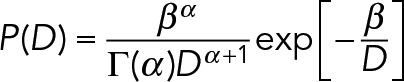 (4) (4)
|
The hyperparameters µx, µy, and γ define the prior on drift velocities, and the hyperparameters α and β define the prior on diffusion constants. The probability of a displacement is
 (5) (5)
|
where Q = 2∆t(1 + γ∆t).
The diffusion with drift hyperparameters are defined independently for each trajectory. Initially, a track uses default values, but as localizations are added, the values are updated, using the new information present in the additional displacement. If a trajectory’s motion changes over time, the hyperparameters are relaxed toward their default values to prevent overfitting.
The plausibility terms are calculated as
 |
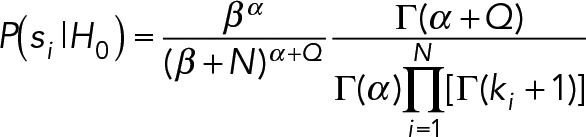 (6) (6)
|
where H0 represents the hypothesis that a localization was generated from a uniform background. The hypothesis H1 assumes the localization was generated by the usual Gaussian-shaped point-spread function. The hyperpriors on H0, α, and β, are the same values used for estimating the background, B. For each subregion H0 is evaluated in, there are N pixels with k photon counts per pixel with a mean pixel count Q.
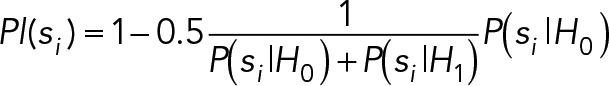
4. Trajectory filtering: Given a set of associated particles, the probability that a trajectory is valid, H1, as opposed to invalid, H0, is
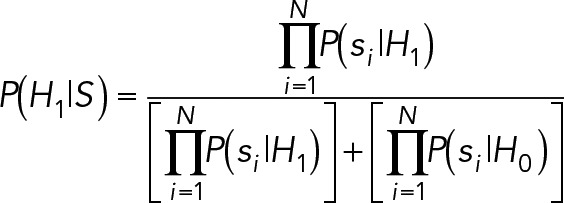 (7) (7)
|
where S represents the vector of localizations associated to the trajectory under evaluation.
Off-rate parameter estimation
Observed trajectories of SykmNG at the plasma membrane represent individual molecules of Syk bound to FcεRI complexes. The simplest model that describes the unbinding of Syk from FcεRI:
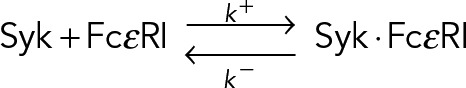 (8) (8)
|
implies that for a Syk ⋅ FcεRI, the time until dissociation is described by random variable τ~Exp(k −). The exponential distribution has the memoryless property, whereby, if τ~Exp(k −), then p(τ = t) = p(τ = t + t0 | τ > t0), so that the distribution of τ, is unchanged, even if the observation begins at arbitrary time t0 > 0 after the initial binding.
1. The geometric distribution: The kinetics of Eq. 8 imply the continuous random variable τ is exponentially distributed; however, SPT trajectories are captured at a finite frame rate tf, so the durations d > 0 are measured in discrete units of frames. Hence the distribution of trajectory durations in frames is described by a geometric distribution, d~Geo(p −). The geometric distribution is the discrete analogue of the exponential, and the only discrete distribution with the memoryless property. The geometric distribution describes the number of trials until success for a repeated Bernoulli experiment with success probability 0 < p– < 1 (e.g., the number of flips required to get heads using a p-weighted coin). In our context, a success represents unbinding, which occurs with equal probability p − each frame. Thus a trajectory is like a sequence of repeated coin flips, and the duration of a trajectory in frames represents the number of flips necessary to achieve success (unbinding). We can convert between p − and k − by taking advantage of the memoryless property of the exponential distribution. During any frame [t,t + tf), the probability of dissociation is independent of t:
 |
Hence, the conversions are
 (9) (9)
|
2. Mixtures of geometric distributions: If the true kinetics of Syk unbinding is described by Eq. 8, then we should expect the durations  to follow a single geometric distribution:
|
|
The single-component geometric model is, however, a very simple model, and often more complicated models are necessary to adequately explain duration distributions. A chemically plausible extension assumes that there are different populations of bound Syk⋅ FcεRI constructs that undergo dissociation with different rates:
 |
 (11) (11)
|
where  . The proportion of Syk ⋅ FcεRI constructs in states 1 and 2 are represented by α1, α2 ∈ (0,1), with α1 + α2 = 1. For the kinetic system of Eq. 11, the duration of a trajectory in frames is given by a two-component mixture of geometric distributions:
|
|
Extensions to M = 3 or more component geometric distributions are straightforward, where
 (13) (13)
|
3. Bayesian inference for geometric mixture models: Using the geometric mixture models (Eq. 13), there are two general classes of procedures we can perform: parameter estimation and model selection. In parameter estimation, we assume a model for the data di~GeoM(θ) and estimate the most likely parameters θ for that model given the observed data D. In Model-selection results, we compare two or more models to determine which model best describes the observed data, after which parameter estimation can be performed on the most likely model. For both types of procedures, we use the Bayesian approach (Murphy, 2012).
The Bayesian approach to parameter estimation begins with an application of Bayes’ rule to the likelihood for model M,
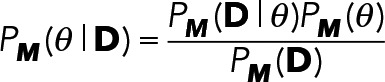 (14) (14)
|
The posterior probability distribution PM(θ | D) is the ultimate mathematical objective of Bayesian parameter estimation. It represents the distribution of the true parameters θ given the data D. We can compute the posterior using Eq. 14 to combine the likelihood PM(D | θ) and the prior PM(θ). The marginal likelihood PM(D), is simply a normalization constant that we will avoid computing in our MCMC approach.
3.A. The likelihood function: For the M-component geometric mixture distribution (Eq. 13), the free parameters are 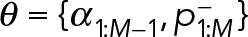 , and the likelihood of an individual trajectory duration is
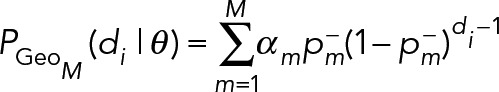 (15) (15)
|
Using Eq. 15, we define the log-likelihood function, parametrized on θ, assuming a fixed data set D = d1:N of N independent trajectories:
 (16) (16)
|
Note that the constraints on α imply that αM is not free. Given α1:M−1, αM has the fixed value 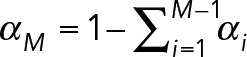 , and so we treat models as parameterized on α1:M−1.
3.B. Priors: To ensure our inferences are solely based on the data at hand, we assume no prior information on our parameters and use a uniform prior over (0,1) for each αi and the Jeffrey’s prior (Murphy, 2012) for dissociation probabilities:
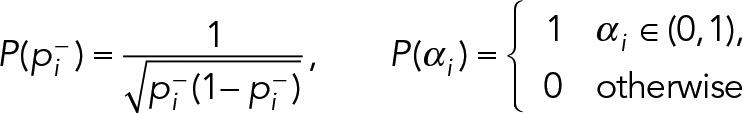 (17) (17)
|
3.C. Extending models to multiple conditions: To compare kinetic parameters across different experimental conditions, we can build a joint model over K > 1 conditions, where the data 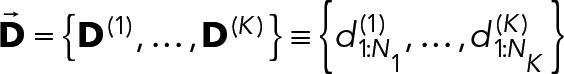 , and each
  is a collection of the NK > 0 observed trajectories from experimental condition k. A joint K-condition M-component geometric mixture model,
  , has K(2M − 1) free parameters after accounting for the constraints on α fractions:
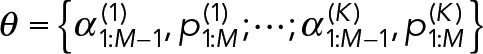 (18) (18)
|
and the joint-likelihood function is
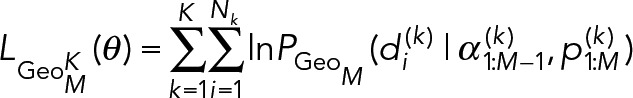 (19) (19)
|
Furthermore, we can investigate restrictions of the K-condition M-component model by assuming all of the K conditions share one or more of the underlying rate or fraction parameters. For example, if there is reason to believe all conditions share the same fast rate but may have different values for the slower rate, we can create a model where  for each k, yet each condition retains its own
  and
and  rates, so that we are left with a (K(2M − 2) + 1)–dimension model with parameters:
 (20) (20)
|
Similar restricted K-component models can be proposed by fixing any of the α or p parameters across the conditions.
4. Bayesian parameter estimation using Markov chain Monte Carlo: Given a model M and data D, Eq. 14 shows the posterior probability of the parameters θ given the data are proportional to the likelihood times the prior:
|
|
The Markov chain Monte Carlo method (MCMC) (Murphy, 2012) can be used to sample from the posterior distribution using the unnormalized formula of Eq. 21. This requires only computing the likelihood (Eq. 19) and the prior (Eq. 17) and does not require the marginal likelihood P(D).
To perform parameter inference on the models, we implemented an MCMC sampler for the parameter space of the general K-condition M-component geometric model (Eq. 18) and the related restricted models (e.g., Eq. 20). We use a one-dimensional Gaussian random-walk proposal algorithm that changes a single dimension at each MC iteration, cycling through all parameters in sequence. Because all variables are constrained to the interval (0,1), we used a one-dimensional proposal Gaussian with σ = 0.05 to achieve adequate acceptance rates and mixing speed. Any proposal that was nonfeasible because of violation of constraints (Eq. 13) was treated as a normal rejection step. This is equivalent to assigning zero likelihood to infeasible points. In general for MCMC runs, we collect S = 106 samples after rejecting the first S/4 samples as a burn-in.
If the true parameters are θ*, the estimated  that minimizes the Euclidean distance
  is the posterior mean, otherwise known as the minimum mean squared error estimator. The MCMC samples allow us to easily estimate the posterior mean and covariance with the sample mean and covariance. Indeed, nearly any probabilistic query or hypothesis that can be formulated about the posterior distribution can be estimated directly using the MCMC samples. Specifically, using this posterior distribution, we can calculate a posterior central interval containing 68.2% of the probability mass (termed 68% credible interval), or 1 SE given a normal distribution, to report our level of confidence for all estimated parameters
  .
.
5. Bayesian model selection using MCMC: Given data set D, and a set of J > 1 models M1:J, we can use Bayesian model selection to estimate the posterior probability of each model given the data P(Mi | D). Bayes’ rule shows that
 (22) (22)
|
We assume a uniform prior over models P(Mi) = 1/J. To estimate the posterior distribution for the models with Eq. 22, we need to estimate the model evidence:
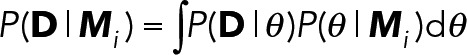 (23) (23)
|
We use a Laplacian approximation (Tierney and Kadane, 1986) to estimate the value of the integral in Eq. 23, where the sample mean and covariance from an MCMC run are used to form a Gaussian approximation of the integrand. We select the model with the highest posterior probabilty, which is the MAP model estimate
 (24) (24)
|
As a consequence of the MCMC sampling to estimate Eq. 22, after finding MMAP we already have the MCMC sample of the parameter posterior P(θ | MMAP).
6. Conditional likelihood for data with a minimum track-length cutoff: Very short trajectories are sometimes false positives that result from spurious localizations or tracking artifacts. Longer trajectories tend to be less susceptible to such noise. Therefore we imposed a lower bound m ≥ 4 on track lengths that are used in rate model inferences. Given data set D = d1:N, we know a priori that di ≥ m, so we replace  in the likelihood function of Eq. 16 with the conditional probability
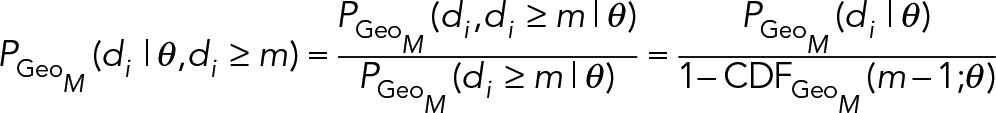 (25) (25)
|
where, for k ∈ N,
 |
In the single-component case (M = 1), the geometric model has the unique memoryless property, which allows the simplification  , but for M = 2 or more component mixture models, the memoryless property does not hold, and Eq. 25 must be used for minimum track length–thresholded data sets.
Model-selection results
We used Bayesian inference methods to answer several questions about the kinetic behavior of SykmNG across different DNP-BSA doses and between SykmNG isoforms (SykmNG-WT, SykmNG-Y130E, and SykmNG-Y130F).
First, we compared M = 1, M = 2, and M = 3 component models for each condition independently. For all conditions (except with dasatinib treatment), we found that the M = 2 model had a higher posterior probability compared with the M = 1 model, indicating that our data are clearly not well described by a single geometric distribution (Supplemental Figure S4C, left). While we did find that, for some conditions (high antigen doses for SykmNG-WT and SykmNG-Y130F), an M = 3 component model had a higher posterior probability, the relative improvement in the fit (Supplemental Figure S4C, right vs. center) could not justify the additional complexity it added when considering cross-condition model comparisons, given the available number of trajectories. For the M = 2 component model,  corresponds to the faster dissociation rate kf, and
  to the slower rate ks. We found that parameter estimates for kf were similar across conditions when fitted independently, while αs and ks varied over a wide range. We assume kf represents nonspecific binding events that we do not expect to vary across conditions.
Assuming the two-component model with a kf shared across conditions, we next asked whether there was evidence to support a model in which the slow rate ks is also shared. We compared a model in which a single ks was constrained to be shared across conditions with a model in which each condition had an independent ks rate. Across antigen-dosage conditions, we found a significantly higher posterior probability for a model in which both kf and ks are shared and only αs changes per condition. In contrast, across cell-line conditions, comparing SykmNG-Y130E to either SykmNG-WT or SykmNG-Y130F, we found a significantly higher posterior probability for a model where the slow rate ks is variable.
In addition, we use the MCMC samples from the posterior distribution (Supplemental Figure S4D) to investigate the difference between the slow kinetic rates ks across different conditions. In Supplemental Figure S4E, we plot the cumulative probability distribution for differences  based on MCMC sample of the posterior of the geometric parameters
  and
and  after conversion to kinetic rates (Eq. 9). These results show, the difference between ks values for WT and Y130F are almost certainly less than 0.1 s−1 and for WT versus Y130E almost certainly greater than 0.1 s−1 (Supplemental Figure S4E).
Single-molecule SykmNG binding simulations
For verification of our analysis, SykmNG data were simulated using three populations of simulated emitters. The first population of emitters represented the background fluorescence described by a wide PSF sigma of 4 pixels and a fast diffusion constant of 5 pixels2/frame. The other two populations represented SykmNG molecules with a PSF sigma of 1 pixel and a diffusion constant of 0 pixels2/frame or 0.5 pixels2/frame, matching our experimental observation. Simulation off-rates for each population corresponded to the fit kf or ks values from our results (Supplemental Table S1). An exponential rate was also used to draw the starting time for each emitter, reflective of the αf and αs parameter. A set number of emitters was drawn for each population at the beginning of the simulation. All emitters were simulated with photon emission times drawn from a model with a mean photon rate per frame matching our experimental observations. An emitter was allowed to diffuse freely up until the time of photon emission, at which point the location of the captured photon was recorded as a random displacement from the actual emitter location drawn from a normal distribution scaled by the corresponding PSF sigma of the emitter. All photon locations were summed to create a Poisson-corrupted image series of emitter dynamics that was evaluated using our tracking and track lifetime analysis. Binding parameters (kf,ks,αs) found from analyzing these simulations were all within 1 SE of the input parameters (Supplemental Figure S4F).
Supplementary Material
Acknowledgments
This work was supported by a National Institutes of Health (NIH) grant (R01GM100114) and the New Mexico Spatiotemporal Modeling Center (NIH P50GM085273). We thank Ryan Suderman and Emanuel Salazar-Cavazos for useful discussions, Eunice Choi and Shayna Lucero for assistance with cell culture and degranulation assays, Jennifer Gillette for use of the Accuri C6 flow cytometer, and Fu-Sen Liang and Catherine Wilcox Wright for use of the mNG-PYL construct. We gratefully acknowledge use of the University of New Mexico Cancer Center fluorescence microscopy and flow-cytometry facilities, as well as the NIH (P30CA118100) support for these cores.
Abbreviations used:
- BCR
B-cell receptor
- FRAP
fluorescence recovery after photobleaching
- GFP
green fluorescent protein
- I-A
interdomain A
- I-B
interdomain B
- IgE
immunoglobulin E
- ITAM
immunoreceptor tyrosine–based activation motif
- KD
kinase domain
- KO
knockout
- MAP
maximum a posteriori
- MCMC
Markov chain Monte Carlo
- MIRR
multichain immunorecognition receptors
- mNG
mNeonGreen
- pITAM
phosphorylated ITAM
- PMA
phorbol 12-myristate 13-acetate
- ROI
region of interest
- SPT
single-particle tracking
- TCR
T-cell receptor
- TIRF
total internal reflection fluorescence
- WT
wild type
Footnotes
This article was published online ahead of print in MBoC in Press (http://www.molbiolcell.org/cgi/doi/10.1091/mbc.E17-06-0350) on August 30, 2017.
REFERENCES
- Andrews NL, Pfeiffer JR, Martinez AM, Haaland DM, Davis RW, Kawakami T, Oliver JM, Wilson BS, Lidke DS. Small, mobile FcεRI receptor aggregates are signaling competent. Immunity. 2009;31:469–479. doi: 10.1016/j.immuni.2009.06.026. [DOI] [PMC free article] [PubMed] [Google Scholar]
- Arias-Palomo E, Recuero-Checa MA, Bustelo XR, Llorca O. Conformational rearrangements upon Syk auto-phosphorylation. Biochim Biophys Acta. 2009;1794:1211–1217. doi: 10.1016/j.bbapap.2009.04.010. [DOI] [PMC free article] [PubMed] [Google Scholar]
- Au-Yeung BB, Deindl S, Hsu LY, Palacios EH, Levin SE, Kuriyan J, Weiss A. The structure, regulation, and function of ZAP-70. Immunol Rev. 2009;228:41–57. doi: 10.1111/j.1600-065X.2008.00753.x. [DOI] [PubMed] [Google Scholar]
- Barker SA, Caldwell KK, Hall A, Martinez AM, Pfeiffer JR, Oliver JM, Wilson BS. Wortmannin blocks lipid and protein kinase activities associated with PI 3-kinase and inhibits a subset of responses induced by FcεR1 cross-linking. Mol Biol Cell. 1995;6:1145–1158. doi: 10.1091/mbc.6.9.1145. [DOI] [PMC free article] [PubMed] [Google Scholar]
- Barker SA, Lujan D, Wilson BS. Multiple roles for PI 3-kinase in the regulation of PLCγ activity and Ca2+ mobilization in antigen-stimulated mast cells. J Leukoc Biol. 1999;65:321–329. doi: 10.1002/jlb.65.3.321. [DOI] [PubMed] [Google Scholar]
- Brdicka T, Kadlecek TA, Roose JP, Pastuszak AW, Weiss A. Intramolecular regulatory switch in ZAP-70: analogy with receptor tyrosine kinases. Mol Cell Biol. 2005;25:4924–4933. doi: 10.1128/MCB.25.12.4924-4933.2005. [DOI] [PMC free article] [PubMed] [Google Scholar]
- Bunnell SC, Hong DI, Kardon JR, Yamazaki T, McGlade CJ, Barr VA, Samelson LE. T cell receptor ligation induces the formation of dynamically regulated signaling assemblies. J Cell Biol. 2002;158:1263–1275. doi: 10.1083/jcb.200203043. [DOI] [PMC free article] [PubMed] [Google Scholar]
- Carsetti L, Laurenti L, Gobessi S, Longo PG, Leone G, Efremov DG. Phosphorylation of the activation loop tyrosines is required for sustained Syk signaling and growth factor-independent B-cell proliferation. Cell Signal. 2009;21:1187–1194. doi: 10.1016/j.cellsig.2009.03.007. [DOI] [PubMed] [Google Scholar]
- Chen C-H, Martin VA, Gorenstein NM, Geahlen RL, Post CB. Two closely spaced tyrosines regulate NFAT signaling in B cells via Syk association with Vav. Mol Cell Biol. 2011;31:2984–2996. doi: 10.1128/MCB.05043-11. [DOI] [PMC free article] [PubMed] [Google Scholar]
- Chu DH, Spits H, Peyron JF, Rowley RB, Bolen JB, Weiss A. The Syk protein tyrosine kinase can function independently of CD45 or Lck in T cell antigen receptor signaling. EMBO J. 1996;15:6251–6261. [PMC free article] [PubMed] [Google Scholar]
- Cocucci E, Aguet F, Boulant S, Kirchhausen T. The first five seconds in the life of a clathrin-coated pit. Cell. 2012;150:495–507. doi: 10.1016/j.cell.2012.05.047. [DOI] [PMC free article] [PubMed] [Google Scholar]
- Coleman TF, Li Y. On the convergence of interior-reflective Newton methods for nonlinear minimization subject to bounds. Math Program. 1994;67:189–224. [Google Scholar]
- Costello PS, Turner M, Walters AE, Cunningham CN, Bauer PH, Downward J, Tybulewicz VL. Critical role for the tyrosine kinase Syk in signalling through the high affinity IgE receptor of mast cells. Oncogene. 1996;13:2595–2605. [PubMed] [Google Scholar]
- Das J, Kardar M, Chakraborty AK. Positive feedback regulation results in spatial clustering and fast spreading of active signaling molecules on a cell membrane. J Chem Phys. 2009;130:245102. doi: 10.1063/1.3149861. [DOI] [PMC free article] [PubMed] [Google Scholar]
- Deckert M, Tartare-Deckert S, Couture C, Mustelin T, Altman A. Functional and physical interactions of Syk family kinases with the Vav proto-oncogene product. Immunity. 1996;5:591–604. doi: 10.1016/s1074-7613(00)80273-3. [DOI] [PubMed] [Google Scholar]
- Deindl S, Kadlecek TA, Brdicka T, Cao X, Weiss A, Kuriyan J. Structural basis for the inhibition of tyrosine kinase activity of ZAP-70. Cell. 2007;129:735–746. doi: 10.1016/j.cell.2007.03.039. [DOI] [PubMed] [Google Scholar]
- Eiseman E, Bolen JB. Engagement of the high-affinity IgE receptor activates src protein-related tyrosine kinases. Nature. 1992;355:78–80. doi: 10.1038/355078a0. [DOI] [PubMed] [Google Scholar]
- Ensign DL, Pande VS. Bayesian single-exponential kinetics in single-molecule experiments and simulations. J Phys Chem B. 2009;113:12410–12423. doi: 10.1021/jp903107c. [DOI] [PubMed] [Google Scholar]
- Feng C, Post CB. Insights into the allosteric regulation of Syk association with receptor ITAM, a multi-state equilibrium. Phys Chem Chem Phys. 2016;18:5807–5818. doi: 10.1039/c5cp05417f. [DOI] [PMC free article] [PubMed] [Google Scholar]
- Geahlen RL. Syk and pTyr’d: signaling through the B cell antigen receptor. Biochim Biophys Acta Mol Cell Res. 2009;1793:1115–1127. doi: 10.1016/j.bbamcr.2009.03.004. [DOI] [PMC free article] [PubMed] [Google Scholar]
- Goshtasby A. Image registration by local approximation methods. Image Vision Comput. 1988;6:255–261. [Google Scholar]
- Graham TE, Pfeiffer JR, Lee RJ, Kusewitt DF, Martinez AM, Foutz T, Wilson BS, Oliver JM. MEK and ERK activation in ras-disabled RBL-2H3 mast cells and novel roles for geranylgeranylated and farnesylated proteins in FcεRI-mediated signaling. J Immunol. 1998;161:6733–6744. [PubMed] [Google Scholar]
- Hlavacek WS, Redondo A, Metzger H, Wofsy C, Goldstein B. Kinetic proofreading models for cell signaling predict ways to escape kinetic proofreading. Proc Natl Acad Sci USA. 2001;98:7295–7300. doi: 10.1073/pnas.121172298. [DOI] [PMC free article] [PubMed] [Google Scholar]
- Ho SN, Hunt HD, Horton RM, Pullen JK, Pease LR. Site-directed mutagenesis by overlap extension using the polymerase chain reaction. Gene. 1989;77:51–59. doi: 10.1016/0378-1119(89)90358-2. [DOI] [PubMed] [Google Scholar]
- Hopfield JJ. Kinetic proofreading: a new mechanism for reducing errors in biosynthetic processes requiring high specificity. Proc Natl Acad Sci USA. 1974;71:4135–4139. doi: 10.1073/pnas.71.10.4135. [DOI] [PMC free article] [PubMed] [Google Scholar]
- Hutchcroft JE, Geahlen RL, Deanin GG, Oliver JM. FcεRI-mediated tyrosine phosphorylation and activation of the 72-kDa protein-tyrosine kinase, PTK72, in RBL-2H3 rat tumor mast cells. Proc Natl Acad Sci USA. 1992;89:9107–9111. doi: 10.1073/pnas.89.19.9107. [DOI] [PMC free article] [PubMed] [Google Scholar]
- Ichinose J, Morimatsu M, Yanagida T, Sako Y. Covalent immobilization of epidermal growth factor molecules for single-molecule imaging analysis of intracellular signaling. Biomaterials. 2006;27:3343–3350. doi: 10.1016/j.biomaterials.2006.01.047. [DOI] [PubMed] [Google Scholar]
- Isaacson C. Syk activation and dissociation from the B-cell antigen receptor is mediated by phosphorylation of tyrosine 130. J Biol Chem. 1997;272:10377–10381. doi: 10.1074/jbc.272.16.10377. [DOI] [PubMed] [Google Scholar]
- Jaqaman K, Loerke D, Mettlen M, Kuwata H, Grinstein S, Schmid SL, Danuser G. Robust single-particle tracking in live-cell time-lapse sequences. Nat Methods. 2008;5:695–702. doi: 10.1038/nmeth.1237. [DOI] [PMC free article] [PubMed] [Google Scholar]
- Johnson SA, Pleiman CM, Pao L, Schneringer J, Hippen K, Cambier JC. Phosphorylated immunoreceptor signaling motifs (ITAMs) exhibit unique abilities to bind and activate Lyn and Syk tyrosine kinases. J Immunol. 1995;155:4596–4603. [PubMed] [Google Scholar]
- Katz ZB, Novotna L, Blount A, Lillemeier BF. A cycle of Zap70 kinase activation and release from the TCR amplifies and disperses antigenic stimuli. Nat Immunol. 2017;18:86–95. doi: 10.1038/ni.3631. [DOI] [PMC free article] [PubMed] [Google Scholar]
- Keshvara LM, Isaacson CC, Yankee TM, Sarac R, Harrison ML, Geahlen RL. Syk- and Lyn-dependent phosphorylation of Syk on multiple tyrosines following B cell activation includes a site that negatively regulates signaling. J Immunol. 1998;161:5276–5283. [PubMed] [Google Scholar]
- Klammt C, Novotna L, Li DT, Wolf M, Blount A, Zhang K, Fitchett JR, Lillemeier BF. T cell receptor dwell times control the kinase activity of Zap70. Nat Immunol. 2015;16:961–969. doi: 10.1038/ni.3231. [DOI] [PMC free article] [PubMed] [Google Scholar]
- Lin J, Wester MJ, Graus MS, Lidke KA, Neumann AK. Nanoscopic cell-wall architecture of an immunogenic ligand in Candida albicans during antifungal drug treatment. Mol Biol Cell. 2016;27:1002–1014. doi: 10.1091/mbc.E15-06-0355. [DOI] [PMC free article] [PubMed] [Google Scholar]
- Liu FT, Bohn JW, Ferry EL, Yamamoto H, Molinaro CA, Sherman LA, Klinman NR, Katz DH. Monoclonal dinitrophenyl-specific murine IgE antibody: preparation, isolation, and characterization. J Immunol. 1980;124:2728–2737. [PubMed] [Google Scholar]
- Liu ZJ, Haleem-Smith H, Chen H, Metzger H. Unexpected signals in a system subject to kinetic proofreading. Proc Natl Acad Sci USA. 2001;98:7289–7294. doi: 10.1073/pnas.121171998. [DOI] [PMC free article] [PubMed] [Google Scholar]
- Lombardo LJ, Lee FY, Chen P, Norris D, Barrish JC, Behnia K, Castaneda S, Cornelius LA, Das J, Doweyko AM, et al. Discovery of N-(2-chloro-6-methyl-phenyl)-2-(6-(4-(2-hydroxyethyl)-piperazin-1-yl)-2-methylpyrimidin-4-ylamino)thiazole-5-carboxamide (BMS-354825), a dual Src/Abl kinase inhibitor with potent antitumor activity in preclinical assays. J Med Chem. 2004;47:6658–6661. doi: 10.1021/jm049486a. [DOI] [PubMed] [Google Scholar]
- Lopez CA, Sethi A, Goldstein B, Wilson BS, Gnanakaran S. Membrane-mediated regulation of the intrinsically disordered CD3 cytoplasmic tail of the TCR. Biophys J. 2015;108:2481–2491. doi: 10.1016/j.bpj.2015.03.059. [DOI] [PMC free article] [PubMed] [Google Scholar]
- Lupher ML, Jr, Rao N, Lill NL, Andoniou CE, Miyake S, Clark EA, Druker B, Band H. Cbl-mediated negative regulation of the Syk tyrosine kinase. A critical role for Cbl phosphotyrosine-binding domain binding to Syk phosphotyrosine 323. J Biol Chem. 1998;273:35273–35281. doi: 10.1074/jbc.273.52.35273. [DOI] [PubMed] [Google Scholar]
- Mahajan A, Barua D, Cutler P, Lidke DS, Espinoza FA, Pehlke C, Grattan R, Kawakami Y, Tung C-S, Bradbury ARM, et al. Optimal aggregation of FcεRI with a structurally defined trivalent ligand overrides negative regulation driven by phosphatases. ACS Chem Biol. 2014;9:1508–1519. doi: 10.1021/cb500134t. [DOI] [PMC free article] [PubMed] [Google Scholar]
- Margolis B, Hu P, Katzav S, Li W, Oliver JM, Ullrich A, Weiss A, Schlessinger J. Tyrosine phosphorylation of vav proto-oncogene product containing SH2 domain and transcription factor motifs. Nature. 1992;356:71–74. doi: 10.1038/356071a0. [DOI] [PubMed] [Google Scholar]
- McKeithan TW. Kinetic proofreading in T-cell receptor signal transduction. Proc Natl Acad Sci USA. 1995;92:5042–5046. doi: 10.1073/pnas.92.11.5042. [DOI] [PMC free article] [PubMed] [Google Scholar]
- Menon AK, Holowka D, Webb WW, Baird B. Cross-linking of receptor-bound IgE to aggregates larger than dimers leads to rapid immobilization. J Cell Biol. 1986;102:541–550. doi: 10.1083/jcb.102.2.541. [DOI] [PMC free article] [PubMed] [Google Scholar]
- Metcalfe DD, Baram D, Mekori YA. Mast cells. Physiol Rev. 1997;77:1033–1079. doi: 10.1152/physrev.1997.77.4.1033. [DOI] [PubMed] [Google Scholar]
- Metzger H, Alcaraz G, Hohman R, Kinet JP, Pribluda V, Quarto R. The receptor with high affinity for immunoglobulin E. Annu Rev Immunol. 1986;4:419–470. doi: 10.1146/annurev.iy.04.040186.002223. [DOI] [PubMed] [Google Scholar]
- Murphy KP. Machine Learning: A Probabilistic Perspective. Cambridge, MA: MIT Press; 2012. [Google Scholar]
- O’Donoghue GP, Pielak RM, Smoligovets AA, Lin JJ, Groves JT. Direct single molecule measurement of TCR triggering by agonist pMHC in living primary T cells. eLife. 2013;2:e00778. doi: 10.7554/eLife.00778. [DOI] [PMC free article] [PubMed] [Google Scholar]
- O’Neill SK, Getahun A, Gauld SB, Merrell KT, Tamir I, Smith MJ, Dal Porto JM, Li QZ, Cambier JC. Monophosphorylation of CD79a and CD79b ITAM motifs initiates a SHIP-1 phosphatase-mediated inhibitory signaling cascade required for B cell anergy. Immunity. 2011;35:746–756. doi: 10.1016/j.immuni.2011.10.011. [DOI] [PMC free article] [PubMed] [Google Scholar]
- Palacios EH, Weiss A. Distinct roles for Syk and ZAP-70 during early thymocyte development. J Exp Med. 2007;204:1703–1715. doi: 10.1084/jem.20070405. [DOI] [PMC free article] [PubMed] [Google Scholar]
- Pao LI, Famiglietti SJ, Cambier JC. Asymmetrical phosphorylation and function of immunoreceptor tyrosine-based activation motif tyrosines in B cell antigen receptor signal transduction. J Immunol. 1998;160:3305–3314. [PubMed] [Google Scholar]
- Park MJ, Sheng R, Silkov A, Jung DJ, Wang ZG, Xin Y, Kim H, Thiagarajan-Rosenkranz P, Song S, Yoon Y, et al. SH2 domains serve as lipid-binding modules for pTyr-signaling proteins. Mol Cell. 2016;62:7–20. doi: 10.1016/j.molcel.2016.01.027. [DOI] [PMC free article] [PubMed] [Google Scholar]
- Pawitan Y. In All Likelihood: Statistical Modelling and Inference Using Likelihood. Oxford, UK: Oxford University Press; 2001. [Google Scholar]
- Pfeiffer JR, Oliver JM. Tyrosine kinase-dependent assembly of actin plaques linking Fc epsilon R1 cross-linking to increased cell substrate adhesion in RBL-2H3 tumor mast cells. J Immunol. 1994;152:270–279. [PubMed] [Google Scholar]
- Presman DM, Ball DA, Paakinaho V, Grimm JB, Lavis LD, Karpova TS, Hager GL. Quantifying transcription factor binding dynamics at the single-molecule level in live cells. Methods. 2017;123:76–88. doi: 10.1016/j.ymeth.2017.03.014. [DOI] [PMC free article] [PubMed] [Google Scholar]
- Radhakrishnan K, Halasz A, McCabe MM, Edwards JS, Wilson BS. Mathematical simulation of membrane protein clustering for efficient signal transduction. Ann Biomed Eng. 2012;40:2307–2318. doi: 10.1007/s10439-012-0599-z. [DOI] [PMC free article] [PubMed] [Google Scholar]
- Relich PK, Olah MJ, Cutler PJ, Lidke KA. Estimation of the diffusion constant from intermittent trajectories with variable position uncertainties. Phys Rev E. 2016;93:042401. doi: 10.1103/PhysRevE.93.042401. [DOI] [PubMed] [Google Scholar]
- Sada K, Takano T, Yanagi S, Yamamura H. Structure and function of Syk protein-tyrosine kinase. J Biochem. 2001;130:177–186. doi: 10.1093/oxfordjournals.jbchem.a002970. [DOI] [PubMed] [Google Scholar]
- Sanderson MP, Wex E, Kono T, Uto K, Schnapp A. Syk and Lyn mediate distinct Syk phosphorylation events in FcεRI-signal transduction: implications for regulation of IgE-mediated degranulation. Mol Immunol. 2010;48:171–178. doi: 10.1016/j.molimm.2010.08.012. [DOI] [PubMed] [Google Scholar]
- Schnabel RB, Eskow E. A revised modified Cholesky factorization algorithm. SIAM J Optim. 1999;9:1135–1148. [Google Scholar]
- Schwartz SL, Yan Q, Telmer CA, Lidke KA, Bruchez MP, Lidke DS. Fluorogen-activating proteins provide tunable labeling densities for tracking FcεRI independent of IgE. ACS Chem Biol. 2015;10:539–546. doi: 10.1021/cb5005146. [DOI] [PMC free article] [PubMed] [Google Scholar]
- Shaner NC, Lambert GG, Chammas A, Ni Y, Cranfill PJ, Baird MA, Sell BR, Allen JR, Day RN, Israelsson M, et al. A bright monomeric green fluorescent protein derived from Branchiostoma lanceolatum. Nat Methods. 2013;10:407–409. doi: 10.1038/nmeth.2413. [DOI] [PMC free article] [PubMed] [Google Scholar]
- Shelby SA, Holowka DA, Baird BA, Veatch SL. Super-resolution localization microscopy identifies distinct stages of antigen-induced IgE receptor cross-linking and immobilization in Rbl-2H3 mast cells. Biophys J. 2014;106:238a. [Google Scholar]
- Shiue L, Zoller MJ, Brugge JS. Syk is activated by phosphotyrosine-containing peptides representing the tyrosine-based activation motifs of the high affinity receptor for IgE. J Biol Chem. 1995;270:10498–10502. doi: 10.1074/jbc.270.18.10498. [DOI] [PubMed] [Google Scholar]
- Sigalov A. Multi-chain immune recognition receptors: spatial organization and signal transduction. Semin Immunol. 2005;17:51–64. doi: 10.1016/j.smim.2004.09.003. [DOI] [PubMed] [Google Scholar]
- Simon M, Vanes L, Geahlen RL, Tybulewicz VLJ. Distinct roles for the linker region tyrosines of Syk in FcεRI signaling in primary mast cells. J Biol Chem. 2005;280:4510–4517. doi: 10.1074/jbc.M410326200. [DOI] [PubMed] [Google Scholar]
- Smith AJ, Surviladze Z, Gaudet EA, Backer JM, Mitchell CA, Wilson BS. p110β and p110δ phosphatidylinositol 3-kinases up-regulate FcεRI-activated Ca2+ influx by enhancing inositol 1,4,5-trisphosphate production. J Biol Chem. 2001;276:17213–17220. doi: 10.1074/jbc.M100417200. [DOI] [PubMed] [Google Scholar]
- Smith CS, Joseph N, Rieger B, Lidke KA. Fast, single-molecule localization that achieves theoretically minimum uncertainty. Nat Methods. 2010;7:373–375. doi: 10.1038/nmeth.1449. [DOI] [PMC free article] [PubMed] [Google Scholar]
- Steinkamp MP, Low-Nam ST, Yang S, Lidke KA, Lidke DS, Wilson BS. erbB3 is an active tyrosine kinase capable of homo- and heterointeractions. Mol Cell Biol. 2014;34:965–977. doi: 10.1128/MCB.01605-13. [DOI] [PMC free article] [PubMed] [Google Scholar]
- Suzuki R, Leach S, Liu W, Ralston E, Scheffel J, Zhang W, Lowell CA, Rivera J. Molecular editing of cellular responses by the high-affinity receptor for IgE. Science. 2014;343:1021–1025. doi: 10.1126/science.1246976. [DOI] [PMC free article] [PubMed] [Google Scholar]
- Teshima R, Ikebuchi H, Nakanishi M, Sawada J. Stimulatory effect of pervanadate on calcium signals and histamine secretion of RBL-2H3 cells. Biochem J. 1994;302:867–874. doi: 10.1042/bj3020867. [DOI] [PMC free article] [PubMed] [Google Scholar]
- Tierney L, Kadane JB. Accurate approximations for posterior moments and marginal densities. J Am Stat Assoc. 1986;81:82–86. [Google Scholar]
- Torigoe C, Faeder JR, Oliver JM, Goldstein B. Kinetic proofreading of ligand-FcεRI interactions may persist beyond LAT phosphorylation. J Immunol. 2007;178:3530–3535. doi: 10.4049/jimmunol.178.6.3530. [DOI] [PMC free article] [PubMed] [Google Scholar]
- Tsang E, Giannetti AM, Shaw D, Dinh M, Tse JKY, Gandhi S, Ho H, Wang S, Papp E, Bradshaw JM. Molecular mechanism of the Syk activation switch. J Biol Chem. 2008;283:32650–32659. doi: 10.1074/jbc.M806340200. [DOI] [PubMed] [Google Scholar]
- Turner M, Schweighoffer E, Colucci F, Di Santo JP, Tybulewicz VL. Tyrosine kinase SYK: essential functions for immunoreceptor signalling. Immunol Today. 2000;21:148–154. doi: 10.1016/s0167-5699(99)01574-1. [DOI] [PubMed] [Google Scholar]
- Valley CC, Arndt-Jovin DJ, Karedla N, Steinkamp MP, Chizhik AI, Hlavacek WS, Wilson BS, Lidke KA, Lidke DS. Enhanced dimerization drives ligand-independent activity of mutant epidermal growth factor receptor in lung cancer. Mol Biol Cell. 2015;26:4087–4099. doi: 10.1091/mbc.E15-05-0269. [DOI] [PMC free article] [PubMed] [Google Scholar]
- van de Linde S, Loschberger A, Klein T, Heidbreder M, Wolter S, Heilemann M, Sauer M. Direct stochastic optical reconstruction microscopy with standard fluorescent probes. Nat Protoc. 2011;6:991–1009. doi: 10.1038/nprot.2011.336. [DOI] [PubMed] [Google Scholar]
- van den Dries K, Schwartz SL, Byars J, Meddens MB, Bolomini-Vittori M, Lidke DS, Figdor CG, Lidke KA, Cambi A. Dual-color superresolution microscopy reveals nanoscale organization of mechanosensory podosomes. Mol Biol Cell. 2013;24:2112–2123. doi: 10.1091/mbc.E12-12-0856. [DOI] [PMC free article] [PubMed] [Google Scholar]
- Veatch SL, Chiang EN, Sengupta P, Holowka DA, Baird BA. Quantitative nanoscale analysis of IgE-FcεRI clustering and coupling to early signaling proteins. J Phys Chem B. 2012;116:6923–6935. doi: 10.1021/jp300197p. [DOI] [PMC free article] [PubMed] [Google Scholar]
- Vonakis BM, Haleem-Smith H, Benjamin P, Metzger H. Interaction between the unphosphorylated receptor with high affinity for IgE and Lyn kinase. J Biol Chem. 2001;276:1041–1050. doi: 10.1074/jbc.M003397200. [DOI] [PubMed] [Google Scholar]
- Wilson BS, Oliver JM, Lidke DS. Spatio-temporal signaling in mast cells. Adv Exp Med Biol. 2011;716:91–106. doi: 10.1007/978-1-4419-9533-9_6. [DOI] [PMC free article] [PubMed] [Google Scholar]
- Wilson BS, Pfeiffer JR, Oliver JM. Observing FcεRI signaling from the inside of the mast cell membrane. J Cell Biol. 2000;149:1131–1142. doi: 10.1083/jcb.149.5.1131. [DOI] [PMC free article] [PubMed] [Google Scholar]
- Wilson BS, Steinberg SL, Liederman K, Pfeiffer JR, Surviladze Z, Zhang J, Samelson LE, Yang LH, Kotula PG, Oliver JM. Markers for detergent-resistant lipid rafts occupy distinct and dynamic domains in native membranes. Mol Biol Cell. 2004;15:2580–2592. doi: 10.1091/mbc.E03-08-0574. [DOI] [PMC free article] [PubMed] [Google Scholar]
- Woody MS, Lewis JH, Greenberg MJ, Goldman YE, Ostap EM. MEMLET: an easy-to-use tool for data fitting and model comparison using maximum-likelihood estimation. Biophys J. 2016;111:273–282. doi: 10.1016/j.bpj.2016.06.019. [DOI] [PMC free article] [PubMed] [Google Scholar]
- Yamashita T, Mao SY, Metzger H. Aggregation of the high-affinity IgE receptor and enhanced activity of p53/56lyn protein-tyrosine kinase. Proc Natl Acad Sci USA. 1994;91:11251–11255. doi: 10.1073/pnas.91.23.11251. [DOI] [PMC free article] [PubMed] [Google Scholar]
- Yamashita T, Suzuki R, Backlund PS, Yamashita Y, Yergey AL, Rivera J. Differential dephosphorylation of the FcRγ immunoreceptor tyrosine-based activation motif tyrosines with dissimilar potential for activating Syk. J Biol Chem. 2008;283:28584–28594. doi: 10.1074/jbc.M802679200. [DOI] [PMC free article] [PubMed] [Google Scholar]
- Yan Q, Schwartz SL, Maji S, Huang F, Szent-Gyorgyi C, Lidke DS, Lidke KA, Bruchez MP. Localization microscopy using noncovalent fluorogen activation by genetically encoded fluorogen-activating proteins. Chemphyschem. 2014;15:687–695. doi: 10.1002/cphc.201300757. [DOI] [PMC free article] [PubMed] [Google Scholar]
- Yu Y, Gaillard S, Phillip JM, Huang T-C, Pinto SM, Tessarollo NG, Zhang Z, Pandey A, Wirtz D, Ayhan A, et al. Inhibition of spleen tyrosine kinase potentiates paclitaxel-induced cytotoxicity in ovarian cancer cells by stabilizing microtubules. Cancer Cell. 2015;28:82–96. doi: 10.1016/j.ccell.2015.05.009. [DOI] [PMC free article] [PubMed] [Google Scholar]
- Zhang J, Berenstein EH, Evans RL, Siraganian RP. Transfection of Syk protein tyrosine kinase reconstitutes high affinity IgE receptor-mediated degranulation in a Syk-negative variant of rat basophilic leukemia RBL-2H3 cells. J Exp Med. 1996;184:71–79. doi: 10.1084/jem.184.1.71. [DOI] [PMC free article] [PubMed] [Google Scholar]
- Zhang Y, Oh H, Burton RA, Burgner JW, Geahlen RL, Post CB. Tyr130 phosphorylation triggers Syk release from antigen receptor by long-distance conformational uncoupling. Proc Natl Acad Sci USA. 2008;105:11760–11765. doi: 10.1073/pnas.0708583105. [DOI] [PMC free article] [PubMed] [Google Scholar]
Associated Data
This section collects any data citations, data availability statements, or supplementary materials included in this article.