Abstract
Fluorescent carbon dots have received considerable attention as a result of their accessibility and potential applications. Although several prior studies have demonstrated that nearly any organic compound can be converted to carbon dots by chemical carbonization processes, mechanisms explaining the formation of carbon dots still remain unclear. Herein, we propose a seed-growth mechanism of carbon dot formation facilitated by ferulic acid, a widespread and naturally occurring phenolic compound in seeds of Ocimum basilicum (basil). Ferulic acid triggers local condensation of polysaccharide chains and forms catalytic core regions resulting in nanoscale carbonization. Our study indicates that carbon dots generated from natural sources might share the similar mechanism of phenolic compound mediated nanoscale condensation followed by core carbonization.
Table of Contents Entry
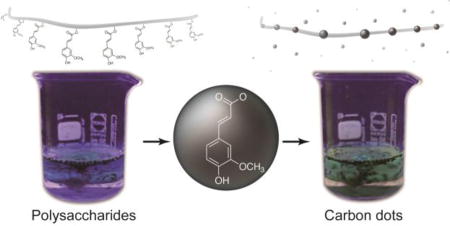
Unexpected phenolic compounds found in basil seeds play a facilitating role in the formation of carbon dot.
Carbon nanoparticles (i.e., carbon dots) are promising fluorescent materials,1–3 which have been applied to various applications, such as bio-imaging tools,4 photodynamic therapy,5 chemical sensors,6 and optoelectronic devices.7 Recent studies have shown that carbon dots can be prepared from abundant vegetables and fruits such as birch kraft pulp,8 mango fruit,9 sweet pepper,10 grass,11 and pomelo peel.12 These natural polymers are composed primarily of polysaccharides, which are rapidly condensed in the presence of strong acids to form carbon dots with a certain degree of homogeneity in their optical properties and dimensions.9,13,14 However, researchers often overlook the presence of trace amounts of phenolic compounds which are found in various polysaccharide backbones of plants and fruit.15
Ferulic acid is a widespread phenolic compound existing in plants,16 typically functioning as a chemical cross-linker that prevents unusual volume expansion of plant body.17 For example, soybean, grapefruit, banana, and cabbage contain trace amounts of ferulic acid,16 and interestingly, all of these materials have been used as chemical sources for carbon dot formation.12,14,18,19 Despite ferulic acid having a strong hydrophobic, phenolic domain that can preferentially interact with aromatized polysaccharides formed from carbonization,20 the mechanistic role of phenolic compounds in the formation of carbon dots has not been reported.
Herein, we propose a seed-growth mechanism in carbon dot formation from polysaccharides that is facilitated by the presence of unavoidable ferulic acid. The use of high-performance liquid chromatography connected with mass spectrometry (HPLC-MS) revealed the presence of ferulic acid in the polysaccharides of Ocimum basilicum (basil) seeds. To demonstrate the significance of phenolic compounds in the formation of carbon dots, we found a correlation between the photoluminescence intensities: the relative quantity of produced carbon dots of each carbonized polysaccharide before and after the trace amount of ferulic acid addition. As a result, the photoluminescence intensity of the sample with additional ferulic acid was dramatically increased, suggesting the crucial role of the aromatic compounds in the production of carbon dots.
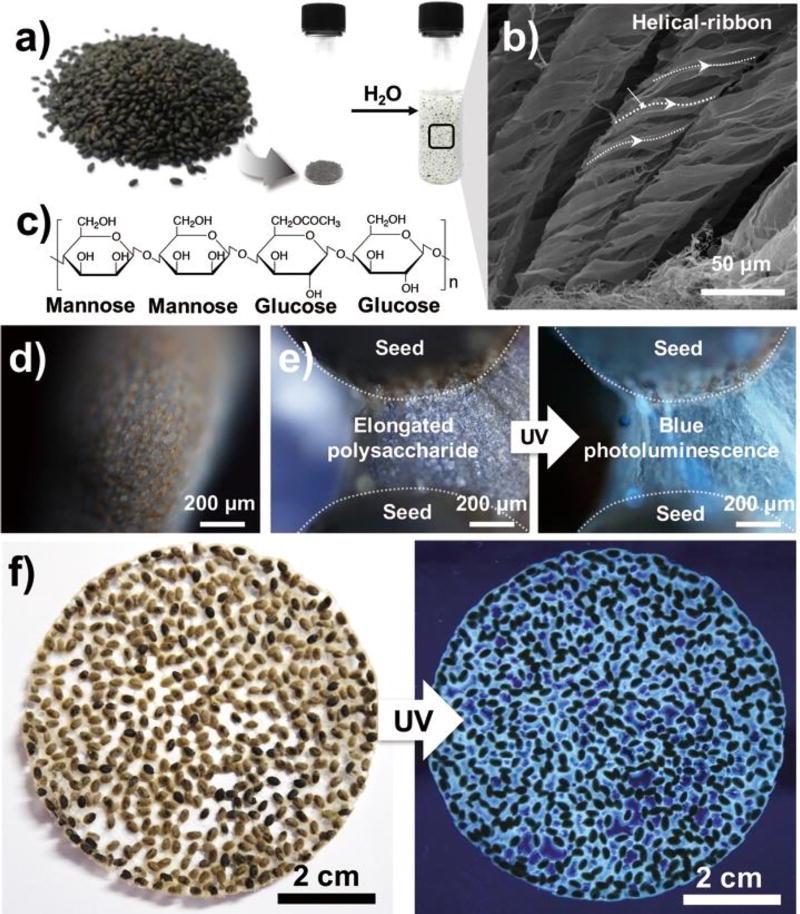
Seeds of basil (Figure 1a) are polysaccharide-rich plants consisting mostly of glucomannan (43%) and xylan (24%).21 Seeds immersed in water extrude hydrogel-like materials within 10 minutes, displaying a helical appearance (Figure 1b). Rees et al. previously reported that 1,4-linked polysaccharides, such as glucomannan (Figure 1c), are generally arranged in helical-ribbon structures during hydration.22
Fig. 1.
a) An optical image of basil seeds and their water-swelling behavior. b) Scanning electron image of the hydrocolloid of basil seed. c) Chemical structure of the representative polysaccharide in basil seed (i.e., glucomannan) d) Fluorescence images of the outer layer of an untreated basil seed. e) Fluorescence microscope images and f) optical images of a swelled basil seed cluster (λex = 312 nm).
Thus, the main components of the outer surface of swelled basil seed are likely to be composed of polysaccharides, which are commonly used as precursors for carbon dot production achieved by chemical treatment.23 An interesting optical behavior observed from natural basil was blue photoluminescence with UV exposure (Figure 1d). Considering the non-fluorogenic nature of polysaccharides because of in the absence of aromatic ring structures (Figure S1), the blue fluorescence is an unusual phenomenon. In particular, the origin of fluorescence resulted from the hydrated outer layer of basil seed, not from the seed body, which was confirmed both at the microscale (Figure 1e) and the macro-scale (Figure 1f). Thus, identification of chemical moieties for the observed fluorescence is necessary.
Most plants contain a trace amounts of phenolic compounds such as ferulic acid, sinapic acid, and/or p-coumaric acid, ester linked to various polysaccharide chains.17,24 Electrons in the π bond-rich phenolic compounds are often excited by UV light, showing blue photoluminescence.24 Therefore, we hypothesized that unknown phenolic compounds in the polysaccharide chains, released from the basil seed, might be the origin of the blue photoluminescence.
To identify the fluorogenic phenolic compounds, we collected the phenol-rich polysaccharides using fast performance liquid chromatography (FPLC) with a UV detector (280 nm). This wavelength detects the presence of phenolic compounds associated in polysaccharides.
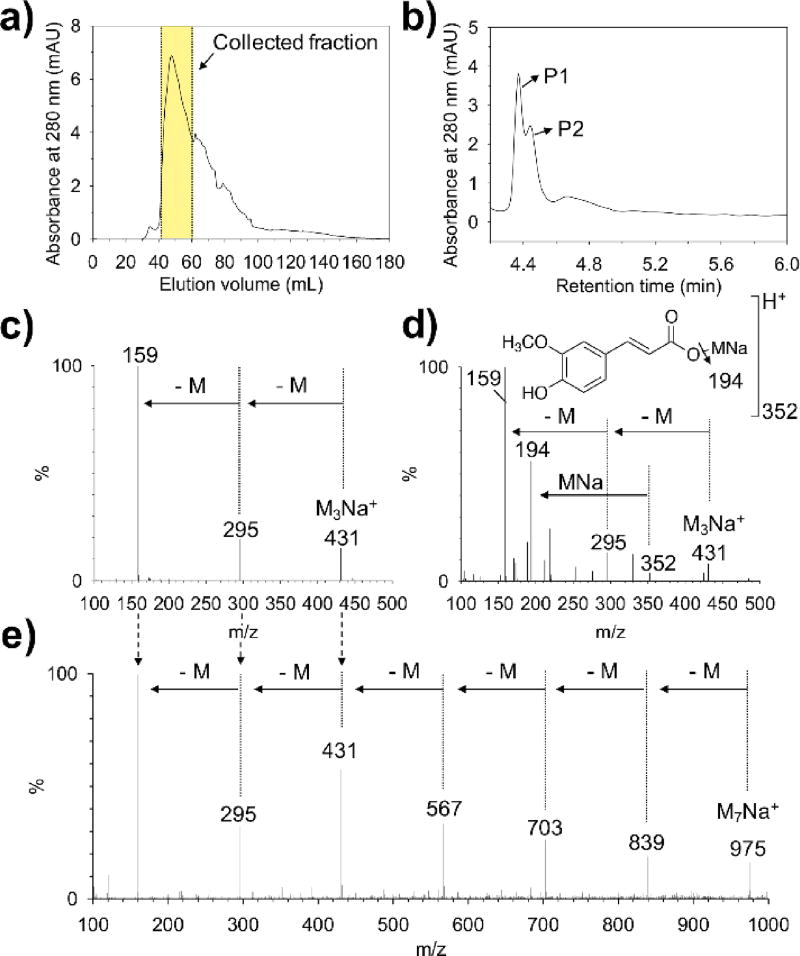
As shown in Figure 2a, multiple peaks overlapped, showing a broad distribution in which the representative eluents collected at approximately 50 mL elution volume were further analyzed by HPLC-MS analysis (Figure 2b). We found two main peaks, P1 and P2, which commonly showed m/z: [M + H]+ found, 431 for P1 (Figure 2c) and P2 (Figure 2d). Additionally, a repeated decrease in the mass interval of m/z: [M] found, 136 was observed. We hypothesized that the m/z: [M] found, 136 might originate from the molecular cleavage of the monosaccharide glucomannan (C5H12O4). The MS analysis of the glucomannan control, shown in Figure 2e, indeed revealed the distinctive repetitive mass reduction of m/z: [M] found, 136, indicating that the same mass reduction observed in P1 (Figure 2c) and P2 (Figure 2d) was due to monomeric cleavage in the MS equipment. Importantly, we found direct MS evidence of a covalent adduct of ferulic acid to glucomannan backbones. The distinctive mass peaks of m/z: [M + H]+ found, 194 and [M + H]+ found, 352 were observed only in P2, showing the ester tethered feruloylated monosaccharides with sodium adduct [monosaccharide + ferulic acid + Na]+ for m/z: [M + H]+ found, 352 and ferulic acid mass itself for m/z: [M + H]+ found, 194 by monosaccharide cleavage (Figure 2d). This observation was previously reported in other plants.15,16
Fig. 2.
a) FPLC analysis of physically extracted polysaccharide solution from basil seed. b) HPLC peaks (P1 and P2) from the collected (by FPLC) solution. MS data at c) P1 and d) P2. e) The direct-MS result of glucomannan solution.
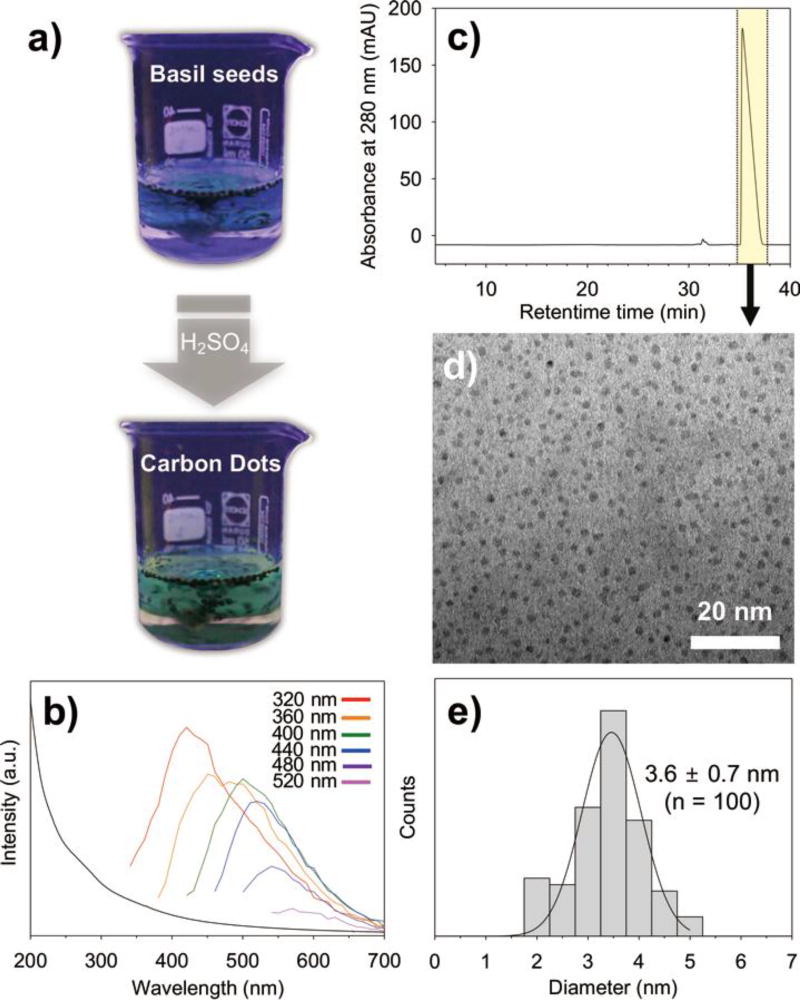
We used sulfuric acid to induce carbonization reaction9,23 from basil seeds. (See the experimental section for the detailed procedures.) The green fluorescence was developed by UV-light (312 nm) after the carbonization of basil seeds, demonstrating the successful transition of polysaccharides to carbon dots (Figure 3a).
Fig. 3.
Optical properties and dimension of the carbon dots from seeds of Ocimum basilicum. a) Macroscopic fluorescent development of the basil seed solution during sulfuric acid-induced carbonization reactions observed under UV projection (λex = 312 nm). b) The UV-Vis absorption spectrum (black line) of the carbonized carbon dots from basil seed polysaccharides and the corresponding photoluminescence spectra: Red (λex = 320 nm), orange (λex = 360 nm), green (λex = 400 nm), blue (λex = 440 nm), purple (λex = 480 nm), pink (λex = 520 nm) c) HPLC chromatogram of the ethanol extracted carbon dot products from basil seeds. The highlighted peak was further collected for TEM analysis. d) Characterization of the purified carbon dots by TEM. e) Statistical analysis of the size distribution of the carbon dots shown in the TEM image.
We performed UV-vis and photoluminescence analysis for the detailed optical characterization (Figure 3b). The UV-vis absorption of the carbon dots from basil seed polysaccharides exhibited a broad range of up to 500 nm with no distinctive peaks (the black line), which might be attributed to generation (and extension) of π-conjugated bonds by the carbonization reaction. The emission spectra, shown in different colors, exhibited varied maximal emission wavelength values depending on changes in excitation wavelength: 420 nm for λex = 320 nm, 460 nm for λex = 360 nm, 500 nm for λex = 400 nm, 520 nm for λex = 440 nm, 540 nm for λex = 480 nm, and 570 nm for λex = 520 nm (colored lines).
Ethanol extraction of the carbonized seed solution was performed to remove remaining polysaccharides, and then HPLC separation for the generated carbon dots was carried out by a prep-scale column (Figure 3c). The extracted sample was collected in a tube and exhibited a distinct peak at a retention time of 36 min. Analyses by transmission electron microscopy (TEM) showed nearly monodisperse carbon dots with average diameter of 3.6 ± 0.7 nm (n = 100) (Figure 3d and e). This result confirms that the green fluorescence originates from the carbon dots.
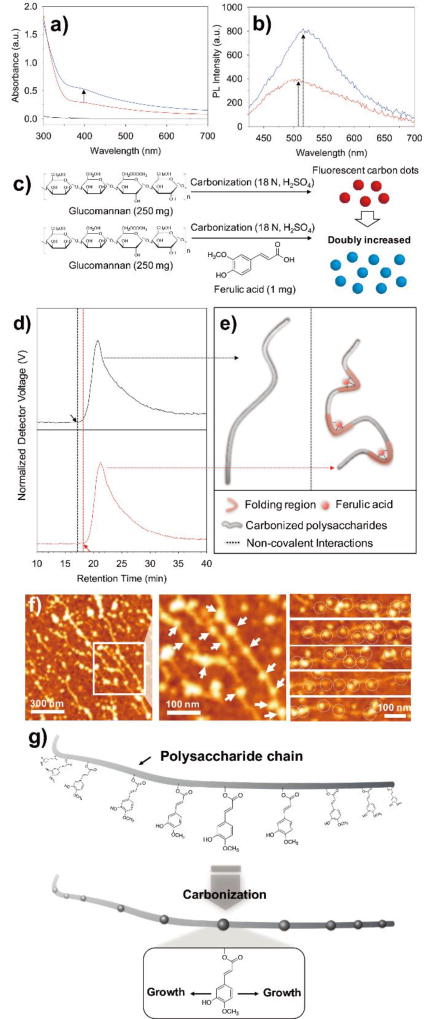
To demonstrate the contribution of phenolic compounds in the formation of carbon dots, we performed spectroscopic analysis for carbon dots generated from glucomannan (the major representative polysaccharide of basil seeds) in the presence or absence of ferulic acid. Sulfuric acid induced carbonization of the natural glucomannan showed significant development of UV and visible wavelength absorption ranging from 300 nm (Figure 4a, red line). In contrast, the same glucomannan before carbonization had limited UV-vis absorption (black line). The development of broad absorption in the UV and visible wavelengths strongly indicated the formation of carbon dots.25,26 In addition, Raman spectroscopy analysis confirmed the G-band (1595 cm−1), a partial crystalline structure with a sp2 carbon network as found in conventional carbon-based quantum dots27,28. This indicates the successful conversion of carbon dots from natural glucomannan (Figure S2, black line). Interestingly, we found a large enhancement in the broad UV-vis wavelength absorption when a trace amount of ferulic acid (0.4 wt%) was added to the natural glucomannan during carbonization (blue line). The presence of this small amount of ferulic acid increased the UV-vis absorption, from 0.29 to 0.53 at 400 nm wavelength. In addition, the photoluminescence intensity was also increased from 399 to 819 arbitrary unit by the addition of ferulic acid during the carbonization process (Figure 4b). Importantly, we found that carbonization reaction of ferulic acid alone did not generate carbon dots (Figure S3). Thus, the observed remarkable increase in photoluminescence intensity is not due to the polymerization of the ferulic acid itself but resulted from the intermolecular interactions of polysaccharide backbones and the added ferulic acid. As previously demonstrated in Figure 3c–e, the green fluorescence observed in the carbonization process of polysaccharides is derived from nano-sized dots (i.e., carbon dots). Thus, the significant increase in UV-vis absorption and photoluminescence intensity when there is a trace amount of ferulic acid in the carbonization process of polysaccharides, means that the generation of carbon dots is also correspondingly increased as illustrated in Figure 4c.
Fig. 4.
a) UV-Vis absorption of natural glucomannan before carbonization (black), after carbonization (red), and the addition of ferulic acid to glucomannan followed by carbonization (blue). b) Photoluminescence (ëex = 400 nm) measurement of the carbonized glucomannan in the presence (blue) or absence (red) of ferulic acid. c) The schematic experimental procedures and the illustration in which carbon dots are doubly increased in presence of a trace amount of ferulic acid during carbonization, based on the spectroscopic results from UV-vis and photoluminescence. d) The GPC results of carbonized natural glucomannan in the absence (black) or presence of ferulic acid (red) and e) the corresponding schematic illustration to explain the role of ferulic acid. f) The representative AFM image with corresponding magnified image, and additional images of the carbonized polysaccharides from basil seed. Developed carbon dots from polysaccharides were marked as arrows and circles. g) Proposed seed-growth mechanism of carbon dots from natural polysaccharides.
To demonstrate that the increased photoluminescence intensity in the presence of ferulic acid is due to the increased number of carbon dots, a quantum yield and a production yield of the carbon dots were compared in the presence or absence of ferulic acids. The quantum yield of carbon dots prepared with 'glucomannan' or 'glucomannan/ferulic acid' was similar with no significant differences: 0.63% for glucomannan carbon dots and 0.55% glucomannan/ferulic acid carbon dots (Figure S4, see the supporting information for detailed experimental procedures). Spectroscopic analyses using X-ray spectroscopy (XPS), Fourier transform infrared spectroscopy (FT-IR), and Raman spectroscopy showed that the surface functionalities of the carbon dots were also similar regardless of ferulic acid addition (Figure S5). For example, in the high-resolution C1s spectra of carbon dots, we found three main peaks at 284.2 eV (C-C/C=C), 285.8 eV (C-O), and 288.1 eV (C=O), showing comparable atomic ratios of 81: 11: 8 and 82: 10: 8, respectively (Figure S5a and b).
In the FT-IR spectra of the carbon dots, oxygenated bonds from unreacted glucomannan such as -OH (3480 cm−1), C=O (1738 cm−1) and C-OH (1265 cm−1) were similarly found (Figure S5 c and d). Also, alkene (1630 cm−1) and aromatic (1436 cm−1) bonds from the sp2 carbon structure were observed at the same wavenumber in the spectra. In addition, the relative ratio of disordered D band to crystalline G band in Raman spectra (i.e., Id/Ig) was 2.06 (for carbon dot of glucomannan) and 1.96 (for carbon dot of glucomannan and ferulic acid), respectively. The results indicate that the chemical properties observed in the two types of the carbon dots are also comparable (Figure S2). On the other hand, there was a considerable difference in the production yield of the carbon dots in the presence (14.7%) or absence (21.0%) of ferulic acids. Considering the fact that the concentration of ferulic acid barely affects the size of carbon dots as demonstrated in Figure S6 (1.05 nm on average in the absence of ferulic acids and 1.06 nm in the presence of ferulic acids, 0.5 mg/mL), the increased photoluminescence intensity (Figure 4b) should be originated from the quantitative increase of the number of carbon dots. These data strongly suggest that the ferulic acid plays a role in promoting the number of carbon dot formations.
The molecular-level evidence of the intermolecular interactions to induce local conformational folded regions (i.e., physical condensations) triggered by ferulic acid was demonstrated by gel permeation chromatography (GPC) (Figure 4d and e). We hypothesized that creation of local conformational folding by the phenolic component, ferulic acid, might result in retention time delay in GPC chromatograms (Figure 4d and e). It has been a general phenomenon that retention time was shifted in GPC depending on folded/unfolded states of a protein (i.e., the same molecular weight).27 Although the effect of ferulic acid-induced folding of glucomannan was not significant like protein folding/unfolding, the retention time delay was indeed observed from 17.2 min to 18.3 min (Figure 4d). Considering together with the increased population of florescent carbon nanodots by ferulic acid addition during the carbonization of glucomannan (Figure 4c), our experiments demonstrated that the naturally present trace amounts of phenolic compound, ferulic acid, acts as a catalytic “seed” for carbon dot growth.
To determine the role of the phenolic moieties in ferulic acids as catalytic seeds for the formation of carbon dots,1H-NMR experiments were performed. It has been known that an integral value appeared in1H-NMR peaks from a core region is decreased compared to the same proton exposed to a solvent (i.e., locate outside).30 Thus, decreased intensities in the NMR peaks in the phenolic protons could be observed when the phenolic groups act as catalytic cores. In fact, we found 40 % decreases in the peak integral values for the phenolic1H peaks (8.56, 7.94, and 7,36 ppm) after D2SO4 carbonization compared with those in ferulic acids before the process (Figure S7b and d). Glycine was used as an internal standard for accurate peak quantification (Figure S7c–e). In addition, the innermost proton peak of the carbon dot represented by ferulic acid shifted slightly toward up-field (Figure S7d). The results indicate that the proton of ferulic acid is shielded by electrons of the hydrophobic surrounding carbon. Thus, the decreased integral intensities from ferulic acids’ phenolic protons suggest that ferulic acids are located at hydrophobic inner cores facilitating carbonization processes.
There are two possible mechanisms for the production of carbon dots. The first is direct carbon dot formation from a polysaccharide chain, such as glucomannan, and the second is from the facilitated carbon dot formation initiated at the ferulic acid conjugation site.
Using AFM, we found that a significant portion of carbon dots is generated along the chains (Figure 4f). Detailed chemical explanations were determined as the following. The hydroxyl groups (-OH) in the polysaccharide undergo dehydration reactions with neighboring hydrogens during carbonization, resulting in the conversion from -(HO)C(H)-CH2- to -HC=CH- (the first mechanism mentioned above).31 Subsequently, the newly formed C=C bonds are thermodynamically favorable to react with the existing phenolic compound to form graphitic cores through condensation reactions, resulting in carbon dots (the 2nd mechanism). Considering the AFM height profiles (Figure S8), developed carbon dots showed an average thickness value of 4.5 ± 1.6 nm (n = 70), which is comparable to 3-8 layers of graphene flakes.32
In summary, we can graphically describe the phenolic seed-growth mechanism for carbon dot development as shown in Figure 4g, in which phenolic compounds (i.e., ferulic acid) serve as a catalytic seed for carbon dot growth.
Conclusions
In conclusion, we demonstrated the seed-growth mechanism of carbon dots derived from the natural polysaccharides of basil seed as a model system. In contrast to the conventional belief that carbon dots are formed directly from the dehydration condensation reaction to form -C=C- in a polysaccharide chain itself, we unexpectedly found that the naturally present trace amount of the phenolic compound ferulic acid acts as a favorable growth site for the development of carbon dots. The photoluminescence intensity of carbonized glucomannan was doubly enhanced at 400 nm excitation, even with a trace amount of in situ addition of ferulic acid (0.4 wt%). The GPC has shown that the phenolic "seed" group of ferulic acid can chemically tether the carbonized polysaccharides for carbon dot development. With AFM images showing the in situ growth of carbon dots along the glucomannan chains, we demonstrated that carbon dot production was facilitated at ferulic acid tethering sites along the backbone of the polysaccharide chains, suggesting the significance of phenolic compounds for carbon dot growth. Our study describes carbon dot formation mechanisms using a polysaccharide from basil seed, glucomannan, as a model system. The results reported here suggest that other previous carbon dot formation studies using natural polysaccharides such as birch kraft pulp, mango fruit, sweet pepper, grass, pomelo peel, soybean, grapefruit, banana, cabbage and others might share the same mechanism when considering the unavoidable incorporation of inherently present phenolic compounds.
Supplementary Material
Acknowledgments
The authors thank Dr. Anton A. A. Smith (UC Berkeley) for valuable assistance for the experimental set-up of GPC. This work is supported by Mid-Career Scientist Grant from National Research Foundation of South Korea (NRF- 2017R1A2A1A05001047), Convergence Research of Traditional Culture and Current Technology from the Ministry of Science, ICT & Future Planning (NRF-2016M3C1B5906481), NIH grants (R37 DE14193 and R01 EB). Caroline Sugnaux acknowledges support from the Swiss National Foundation of Science Fellowship 165149.
Footnotes
Electronic Supplementary Information (ESI) available.
Conflicts of interest
There are no conflicts of interest to declare.
References
- 1.Lim SY, Shen W, Gao Z. Chem. Soc. Rev. 2015;44:362–381. doi: 10.1039/c4cs00269e. [DOI] [PubMed] [Google Scholar]
- 2.Li H, Kang Z, Liu Y, Lee S-T. J. Mater. Chem. 2012;22:24230–24225. [Google Scholar]
- 3.Baker SN, Baker GA. Angew. Chem. Int. Ed. 2010;49:6726–6744. doi: 10.1002/anie.200906623. [DOI] [PubMed] [Google Scholar]
- 4.Jiang K, Sun S, Zhang L, Lu Y, Wu A, Cai C, Lin H. Angew. Chem. Int. Ed. 2015;54:5360–5363. doi: 10.1002/anie.201501193. [DOI] [PubMed] [Google Scholar]
- 5.Choi Y, Kim S, Choi M-H, Ryoo S-R, Park J, Min D-H, Kim B-S. Adv. Funct. Mater. 2014;24:5781–5789. [Google Scholar]
- 6.Zhu S, Meng Q, Wang L, Zhang J, Song Y, Jin H, Zhang K, Sun H, Wang H, Yang B. Angew. Chem. Int. Ed. 2013;52:3953–3957. doi: 10.1002/anie.201300519. [DOI] [PubMed] [Google Scholar]
- 7.Choi H, Ko S-J, Choi Y, Joo P, Kim T, Lee BR, Jung J-W, Choi HJ, Cha M, Jeong J-R, Hwang I-W, Song MH, Kim B-S, Kim JY. Nature Photonics. 2013;7:732–738. [Google Scholar]
- 8.Junka K, Guo J, Filpponen I, Laine J, Rojas OJ. Biomacromolecules. 2014;15:876–881. doi: 10.1021/bm4017176. [DOI] [PubMed] [Google Scholar]
- 9.Jeong CJ, Roy AK, Kim SH, Lee JE, Jeong JH, In I, Park SY. Nanoscale. 2014;6:15196–15202. doi: 10.1039/c4nr04805a. [DOI] [PubMed] [Google Scholar]
- 10.Yin B, Deng J, Peng X, Long Q, Zhao J, Lu Q, Chen Q, Li H, Tang H, Zhang Y, Yao S. Analyst. 2013;138:6551–6557. doi: 10.1039/c3an01003a. [DOI] [PubMed] [Google Scholar]
- 11.Liu S, Tian J, Wang L, Zhang Y, Qin X, Luo Y, Asiri AM, Al-Youbi AO, Sun X. Adv. Mater. 2012;24:2037–2041. doi: 10.1002/adma.201200164. [DOI] [PubMed] [Google Scholar]
- 12.Lu W, Qin X, Liu S, Chang G, Zhang Y, Luo Y, Asiri AM, Al-Youbi AO, Sun X. Anal. Chem. 2012;84:5351–5357. doi: 10.1021/ac3007939. [DOI] [PubMed] [Google Scholar]
- 13.Sharker SM, Kim SM, Lee JE, Jeong JH, In I, Lee KD, Lee H, Park SY. Nanoscale. 2015;7:5468–5475. doi: 10.1039/c4nr07422j. [DOI] [PubMed] [Google Scholar]
- 14.De B, Karak N. RSC Adv. 2013;3:8286–8285. [Google Scholar]
- 15.Balasundram N, Sundram K, Samman S. Food Chem. 2006;99:191–203. [Google Scholar]
- 16.Kumar N, Pruthi V. Biotechnol. Rep. 2014;4:86–93. doi: 10.1016/j.btre.2014.09.002. [DOI] [PMC free article] [PubMed] [Google Scholar]
- 17.Ishii T. Plant Sci. 1997;127:111–127. [Google Scholar]
- 18.Zhu C, Zhai J, Dong S. Chem. Commun. 2012;48:9367–9363. doi: 10.1039/c2cc33844k. [DOI] [PubMed] [Google Scholar]
- 19.Alam A-M, Park B-Y, Ghouri ZK, Park M, Kim H-Y. Green Chem. 2015;17:3791–3797. [Google Scholar]
- 20.Sun X, Li Y. Angew. Chem. Int. Ed. 2004;43:597–601. doi: 10.1002/anie.200352386. [DOI] [PubMed] [Google Scholar]
- 21.Rafe A, Razavi SMA. Int. J. Food Sci. Tech. 2012;48:556–563. [Google Scholar]
- 22.Rees DA, Welsh EJ. Angew. Chem. Int. Ed. 1977;16:214–224. [Google Scholar]
- 23.Choi Y, Ryu GH, Min SH, Lee BR, Song MH, Lee Z, Kim B-S. ACS Nano. 2014;8:11377–11385. doi: 10.1021/nn504287q. [DOI] [PubMed] [Google Scholar]
- 24.Baby S, Johnson AJ, Govindan B, Lukose S, Gopakumar B, Koshy KC. Sci. Rep. 2013;3:2738. doi: 10.1038/srep02738. [DOI] [PMC free article] [PubMed] [Google Scholar]
- 25.Liu R, Wu D, Liu S, Koynov K, Knoll W, Li Q. Angew. Chem. Int. Ed. 2009;48:4598–4601. doi: 10.1002/anie.200900652. [DOI] [PubMed] [Google Scholar]
- 26.Qu S, Wang X, Lu Q, Liu X, Wang L. Angew. Chem. Int. Ed. 2012;51:12215–12218. doi: 10.1002/anie.201206791. [DOI] [PubMed] [Google Scholar]
- 27.Bao L, Liu C, Zhang Z-L, Pang D-W. Adv. Mater. 2015;27:1663–1667. doi: 10.1002/adma.201405070. [DOI] [PubMed] [Google Scholar]
- 28.Ryu S, Lee K, Hong SH, Lee H. RSC Adv. 2014;4:56848–56852. [Google Scholar]
- 29.Uversky VN. Biochemistry. 1993;32:13288–13298. doi: 10.1021/bi00211a042. [DOI] [PubMed] [Google Scholar]
- 30.Gomez MV, Guerra J, Velders AH, Crooks RM. J. Am. Chem. Soc. 2009;131:341–350. doi: 10.1021/ja807488d. [DOI] [PubMed] [Google Scholar]
- 31.Tang MM, Bacon R. Carbon. 1964;2:211–220. [Google Scholar]
- 32.Casiraghi C, Hartschuh A, Lidorikis E, Qian H, Harutyunyan H, Gokus T, Novoselov KS, Ferrari AC. Nano Lett. 2007;7:2711–2717. doi: 10.1021/nl071168m. [DOI] [PubMed] [Google Scholar]
Associated Data
This section collects any data citations, data availability statements, or supplementary materials included in this article.


