Abstract
A human bone tissue model was developed by constructing ex vivo the 3D network of osteocytes via the biomimetic assembly of primary human osteoblastic cells with 20–25 µm microbeads and subsequent microfluidic perfusion culture. The biomimetic assembly: (1) enabled 3D-constructed cells to form cellular network via processes with an average cell-to-cell distance of 20–25 µm, and (2) inhibited cell proliferation within the interstitial confine between the microbeads while the confined cells produced extracellular matrix (ECM) to form a mechanically integrated structure. The mature osteocytic expressions of SOST and FGF23 genes became significantly higher, especially for SOST by 250 folds during 3D culture. The results validate that the bone tissue model: (1) consists of 3D cellular network of primary human osteocytes, (2) mitigates the osteoblastic differentiation and proliferation of primary osteoblast-like cells encountered in 2D culture, and (3) therefore reproduces ex vivo the phenotype of human 3D-networked osteocytes. The 3D tissue construction approach is expected to provide a clinically relevant and high-throughput means for evaluating drugs and treatments that target bone diseases with in vitro convenience.
Keywords: human bone tissue model, human primary osteocytes, human primary osteoblasts, 3D culture, microfluidic, sclerostin, SOST, FGF23
Graphical abstract

1. Introduction
Osteocytes reside as 3D-networked cells within mineralized extracellular matrix (ECM) cavities (“lacunae”) in bone tissues, and are interconnected by dendritic cell processes and gap junctions along ECM canals (“canaliculi”).[1]–[4] Osteocytes function as master regulators of homeostatic bone remodeling[1], [2], [4] and play important roles in the metabolic regulation of minerals. [3] Also, recent studies suggest that osteocytes, as 3D-networked cells, can interact with bone marrow cells[5] as well as prostate cancer and multiple myeloma cells located on the bone marrow side. [6]–[9]
Our long-term motivation is to reconstruct ex vivo the 3D-networked lacunocanalicular structure of human primary osteocytes, as a clinically relevant means of developing high-throughput in vitro bone tissue models. We anticipate that these 3D tissue models can be used for: (1) evaluating the efficacy of drugs targeting bone diseases and metastases and (2) reducing current reliance on animal models that have limited relevance to human disease and thus often poorly correlate with clinical outcomes. For example, primary human multiple myeloma, prostate, and breast cancer cells rarely metastasize to animal bone,[10] Because of this reason, state-of-the-art patient-derived xenograft models use implanted fetal human bone chips to which human tumor cells can metastasize.[11]–[14] However, the xenograft models suffer from: (1) implanted bone chips often becoming poorly vascularized, causing bone cell death; (2) difficulties in obtaining fetal samples for consistent results; and (3) several months needed for tumors to develop, contributing to high costs.[15]–[17]
For the clinical relevance of bone tissue models, the use of human primary osteocytes is critically important since: (1) immortalizing human cells into cell lines by gene transfection perturbs the cells’ gene expression profiles and cellular physiology[18]–[20] and (2) cell lines cannot capture the genotypic and phenotypic heterogeneity of primary cells.[20] Also, another significant problem with available murine and human cell lines such as MLO-Y4,[21] MLO-A5,[ 22] and HOB-01-C148[23] is the lack of mature osteocytic gene expressions (e.g., SOST and FGF23) during conventional 2D culture. The ability to replicate SOST-expressing osteocytes is particularly important since: (1) this gene produces sclerostin, a major signaling molecule that regulates the development of osteoblasts;[24]–[26] (2) SOST/sclerostin is an important target for treating osteoporosis[27] and tumor-induced osteolytic lesions;[28] and (3) elevated levels of sclerostin have been associated with the severity of multiple myeloma.[29]–[31]
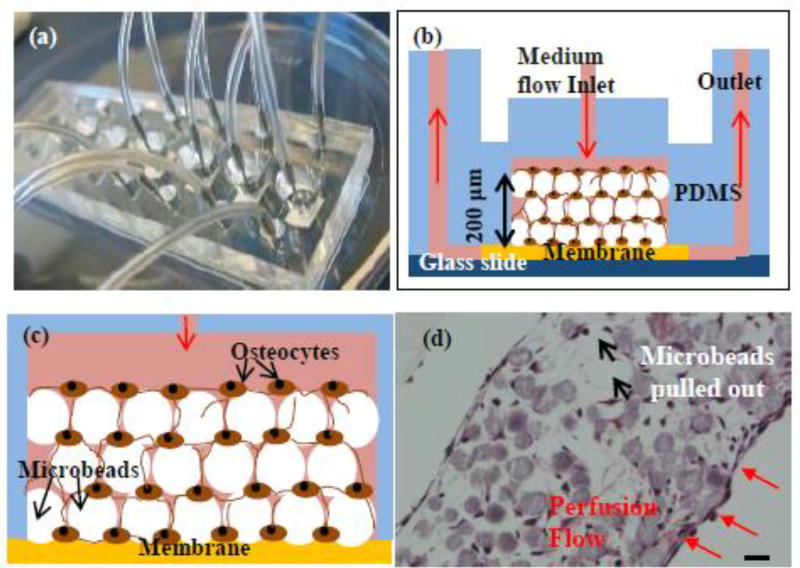
As summarized in Fig. 1, we previously reported[32] that the physiological morphology and biological functions of murine primary osteocytes can be replicated ex vivo by their 3D network construction in microfluidic culture chambers. We used a microbeads-guided assembly approach that: (1) consists of 3D cellular network of primary osteocytes, and (2) mitigate the rapid osteoblastic dedifferentiation and proliferation of primary osteoblast-like encountered in conventional 2D culture.[32], [33] In this biomimetic assembly approach[32], [34]and as illustrated in Fig. 1b, biphasic calcium phosphate (BCP) microbeads of 20–25 µm were used to: (1) spatially distribute osteocyte cell bodies into the interstitial spaces between the microbeads with one cell occupying each interstitial site while allowing them to develop processes with neighboring cells with the physiologically relevant lacuna and interlacunar dimensions and (2) provide a mechanically stable framework to maintain the microscale geometry and dimensions of the 3D cellular network during perfusion culture. Since osteocytes have a typical diameter of 8–10 µm, microbeads with diameters of 20~25 µm were chosen to allow a cell to be placed within the interstitial site that is sufficiently large, but small for occupation by more than a few cells. Compared to other state-of-the-art bone tissue models,[35]–[39] our approach uniquely replicates physiologically relevant cell-to-cell distance, phenotype, and functions.
Fig. 1. Construction of 3D-networked murine primary osteocytes with modified images from the our previous publication.
[32] (a) microfluidic perfusion device with 6 culture chambers, (b) cross-sectional view of a 3D culture chamber with the red arrows indicating the overall direction of culture medium flow through the device, (c) schematic illustration of microbeads-guided assembly, and (d) histologic image of 3D-networked osteocytes with the red arrows indicating medium flow direction with respect to the tissue sample. Scale bar: 20 µm.
In this study, we demonstrate that a human 3D osteocytic tissue model can be developed by: (1) applying the 3D network construction approach, (2) using primary human bone cells isolated from bone fragments discarded during total joint replacement surgeries, and (3) evaluating the viability, proliferation, and differentiation of the 3D-constructed cells.
2. Materials and Methods
2.1. Collection of human bone samples
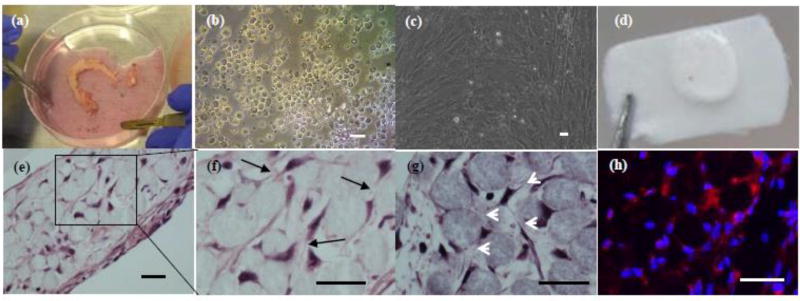
Discarded bone samples were obtained with informed consent from seven patients undergoing hip or knee joint replacement surgeries. Protocol (Pro5059) for collection of samples and consent of patients was approved by the Institutional Review Board (IRB) of Hackensack University Medical Center. Table 1 summarizes donor information, the location and nature of the bone samples obtained, and the experimental use of the samples. As an example, a hip fragment (Patient Sample #6) is shown in Fig. 2a.
Table 1.
Summary of human bone samples used.
| Patient sample |
Patient Characteristic |
Bone Type | Use |
|---|---|---|---|
| 1 |
|
|
|
| 2 |
|
|
|
| 3 |
|
|
|
| 4 |
|
|
|
| 5 |
|
|
|
| 6 |
|
|
|
OA: osteoarthritis. P&EC: prostate and esophageal cancer
Fig. 2. 3D-networked osteocyte construction using primary human bone cells.
(a) hip fragment shown as an example; (b) as-isolated cells after 4 collagenase digestion cycles; (c) proliferated osteoblastic cells after 10 days of 2D culture; (d) 3D tissue sample constructed using 20–25 µm microbeads and proliferated cells and 14 days of perfusion culture; (e) H&E histologic images showing the formation of 3D cellular network as indicated by black arrows in (f) and white arrows in (g); and (h) immunostaining for sclerostin (red). (d) –(f) from patient sample #6 and (g)–(h) from patient sample #4. Scale bar: 25 µm.
2.2. Cell isolation from human bone samples
Bone samples were cleaned using a scalpel to remove soft tissue and cartilage regions and cut into 1–5 mm chips in length and width. In initial experiments, bone chips were subjected to collagenase digestion procedures previously developed by Stern et al.[40] for murine long bone samples. In brief, bone chips were digested using a collagenase solution (300 active units/mL) in α-minimal essential medium (α-MEM) and an ethylenediaminetetraacetic acid (EDTA) solution of 5 mM with 1% (v/w) bovine serum albumin (BSA). A total of up to 7 consecutive digestion cycles (20 min per digestion cycle) were performed. The isolated cells were collected after each digestion step.
The isolated cells were cultured in a collagen-coated 6-well plate with a seeding cell density of 5×10⁵–1×10⁶ per well using α-MEM supplemented with 10% fetal bovine serum (FBS) and 1% penicillin/streptomycin (P/S) at 37°C and 5% CO2. Two modifications were made from the procedures of Stern et al.[40] The viability and number of isolated cells were increased by: (1) vortexing the bone chips in Hank's balanced salt solution (HBSS) for 3 s between digestions cycles to wash them thoroughly and (2) washing the isolated cells after overnight culture gently with PBS and refilling the culture wells with fresh medium gently.
2.3. Alkaline phosphatase (ALP) staining
Osteoblastic populations in fresh isolated and cultured cells (8 days after isolation) were analyzed for ALP expression. To assess the effect of digestion cycle on as-isolated osteocytic and osteoblastic populations, the isolated cells were stained at Day 0 with ALP after 4 to 7digestions. For the effects of digestion cycle on cell development of isolated cells, the isolated cells were stained at Day 8 with ALP after 4 to 7 digestions. Also, for the effects of digestion cycle on the osteoblastic differentiation of the isolated cells, the cells were stained with ALP at Day 14 after 1 to 4 digestions. The cells were fixed with 4% paraformaldehyde (PFA) for 10 min, washing with phosphate-buffered saline (PBS), staining with the TRACP&ALP double-stain Kit (TaKaRa) for 30 min at 37°C, and labeled with 4',6-diamidino-2-phenylindole (DAPI, Sigma-Aldrich) to identify cell nuclei. After staining, ALP-positive cells appeared purple-blue in color. The stained samples were washed with PBS and observed under a microscope (Eclipse Ti-E, Nikon). Cells were counted in 10 different randomly selected areas containing between 100–500 cells per view.
2.4. Microbeads-guided 3D network construction
As described elsewhere in detail,[41] we used a polydimethylsiloxane (PDMS)-based microfluidic culture device which consisted of eight perfusion culture chambers (6 mm × 200 µm in thickness) showed in Fig 1a. Cells were isolated from the fourth digestion cycle, cultured for 10 days in a 6 well plate, and removed by trypsinization for subsequent use in 3D construction experiments. The removed cells were mixed with BCP microbeads (68% of hydroxyapatite and 32% of β-tricalcium phosphate; CaP Biomaterials) prior to assembling them into the 3D culture chamber. The microbeads were sieved to a size range of 20–25 µm, coated with collagen type I (Sigma-Aldrich) using a collagen/acetic acid solution (0.15 mg/mL) for 1 h, and washed with PBS three times. 2×10⁷ cells/mL and 2×10⁷ microbeads/mL were mixed thoroughly in an osteogenic α-MEM with 10% (v/v) FBS, 50 µg/mL ascorbic acid (Sigma), 3 mM β-glycerophosphate (Sigma) and 1% (v/v) P/S. 10 µL of the mixture was placed into the culture chamber using a micropipette. Cells and microbeads were assembled with details described in our previous study[34], and as illustrated in Fig. 1b.
The culture device was then placed inside of a conventional incubator (5% CO2). The osteogenic α-MEM was supplied to the culture chambers using syringe pumps (KD Scientific) located outside of the incubator via polyethylene tubing. The reconstructed 3D samples were cultured up to 21 days at a flow rate of 1 µL/min. For 2D culture control, cells were seeded into a 24-well plate at a concentration of 10,000 cells/well. Medium was replaced every 1 to 2 days.
After 7 days of culture, the 3D-networked samples were harvested from the culture chambers and stained with a live/dead viability/cytotoxicity kit (Thermo Fisher Scientific). After the stained 3D network was broken down into single cells with a tissue grinder, live (green) and dead (red) cells were counted and averaged from 10 different randomly selected fields with 20–50 cells per field.
2.5. ELISA
Effluents from the 3D culture chambers were collected weekly up to 3 weeks (i.e., Days 1 through 7, Days 8 through 14, and Days 15 through 21). The weekly collections were needed to obtain sufficient quantities of the effluents for ELISA measurements. The effluents were concentrated 7× by protein concentration filtration (Millipore). Sclerostin expression was tested with the ELISA kit (R&D systems) according to the manufacturer’s instruction.
2.6. RT-PCR
For RT-PCR quantification of gene expressions, RNA was isolated from cells in 3D and 2D culture samples using a RNA Mini kit (Ambion) per the manufacturer’s instructions. One µg of the total extracted RNA from each sample was used for cDNA synthesis in the following manner: 3 µL of 10 mM Oligo-dT solution (Sigma) added to 16.5 µL of the RNA solution, heated at 75°C for 5 min, and cooled on ice. A total of 30 µL reaction solution was prepared by adding 1 µL RNasin ribonuclease inhibitor (Promega Corp), 1.5 µL dNTp (Promega), 2 µL reverse transcriptase (Promega) and 6 µL reverse transcriptase buffer (Promega). cDNA was prepared by incubating the reaction solution for 1.5 h at 37°C in a water bath. To stop the reaction process, the samples were heated at 95°C for 3 min, and immediately placed on ice. A final volume of the 20 µL reaction solution, consisting of 2 µL of the cDNA template, 1 µL of the primer, 10 µL of RT-PCR master mix (Taqman) and 7 µL of DEPC-treated water, was prepared for quantitative RT-PCR assay (StepOnePlus, Applied Biosystems). Amplification conditions were as follows: 95°C, 20s; 95°C, 1 s, 60°C, 20 s, 40 cycles.
Target gene expression was normalized to GAPDH and fold changes in expression relative to untreated control were determined using the 2−(Ct(target gene)−Ct(GAPDH)). Taqman gene expression probes (Applied Biosystems, Thermo Fisher Scientific) were used to analyzed the following genes: ALPL (encoding ALP, an osteoblast marker), PDPN (encoding podoplanin or E11, preosteocyte marker), Col1 (encoding type 1 collagen), SOST (encoding sclerostin) and FGF23 (encoding Fibroblast growth factor 23). All primers for gene expression are summarized in Supplementary Table 1.
2.7. Histology and immunohistology
The 3D culture samples were removed from the culture chambers and fixed with 4% PFA. The fixed samples were paraffin-embedded, cut into histological sections of 10-µm thick, and stained with hematoxylin and eosin (H&E, Sigma-Aldrich). The sections were deparaffinized and permeabilized using 0.1% (v/v) triton x-100 for 10 min followed by the steps described in Section 2.4 for sclerostin immunostaining.
2.8. Sclerostin immunostaining
Osteocytic populations in isolated and cultured cells were characterized for sclerostin production. Cells were fixed as described earlier and permeabilized using 0.1% (v/v) triton x-100 for 10 min. To block unspecific antibody binding, cells were incubated in PBS with 3% (w/v) BSA for 1 h at room temperature. The cells were then further incubated overnight at 4°C with a rabbit anti-human sclerostin antibody (Abcam) followed by secondary staining with a fluorescence-conjugated antibody (goat anti-rabbit TRITC, Abcam). Cells were also stained with DAPI. Early osteocytic cell line (MLO-A5) used as ALP-positive and sclerostin-negative control. Sclerostin-positive cells were counted in 10 different randomly selected areas containing between 100–500 cells per field.
2.9. Statistics
Immunostaining of isolated cells by ALP and sclerostin was performed in triplicate wells using one representative patient sample, as specifically noted in the captions of Figs. 4 and 7 and Supplementary Fig. 2b. ELISA was performed in quadruplicates using one patient. RT-PCR was performed in triplicates from two patient samples. Student t test was used when comparing two groups. P<0.05 was considered significant. Excel was used for the analysis. Standard errors of mean were used in this study.
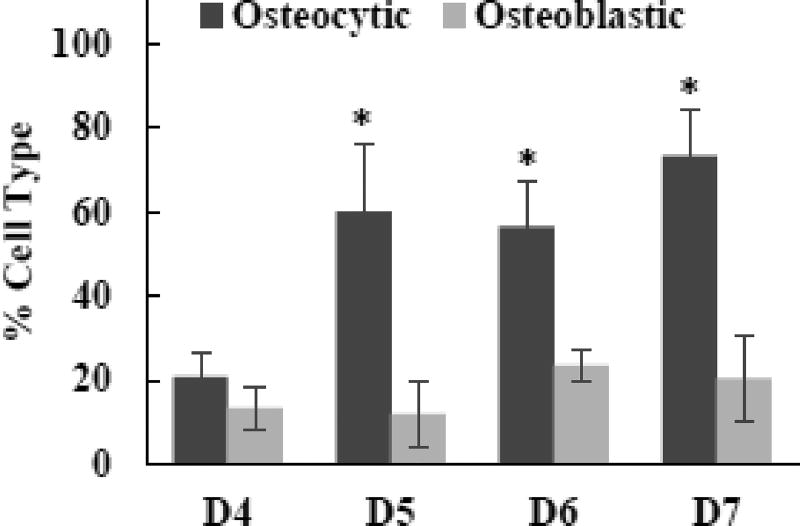
Fig. 4. Effects of digestion cycle on osteocytic and osteoblastic populations of isolated cells.
Data representative of one patient sample (#3). Freshly isolated cells were stained with ALP and sclerostin to detect osteoblastic and osteocytic cells, respectively. P<0.05,* comparing to D4.
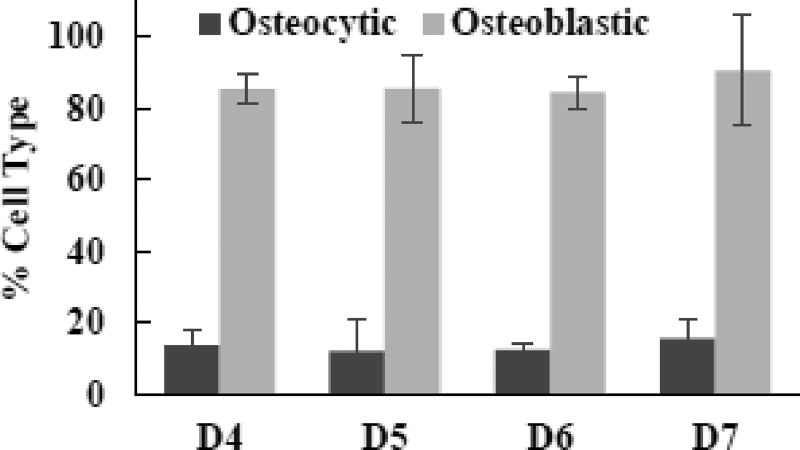
Fig. 7. Effects of digestion cycle on osteoblastic and osteocytic populations of isolated cells.
Data representative of one patient sample (#3). Digested cells were cultures for 8 days in 2D after isolation.
3. Results
3.1. General cell isolation behavior observed from human bone samples
In comparison to our previous results on murine long bone samples,[32] it took a less number of digestion cycles to isolate cells from human bone fragments. Also, the number of isolated cells became significantly less after the eighth digestion cycle (i.e., “D8”) for the human samples. The number of the isolated cells was around 0.5 to 1 million after each digestion.
When we used the procedures previously optimized for the murine bone samples,[32], [40] freshly isolated cells were not healthy and did not become viable during subsequent 2D culture. Hence, we modified the procedures by: (1) vortexing the bone chips between digestion steps to wash thoroughly and remove small bone debris and (2) further washing cells gently after overnight culture and refilling with a fresh medium. These procedural changes significantly increased the viability of isolated cells during 2D post-digestion culture. Isolated cells were round initially and took about 7 days to spread and proliferate (Supplementary Fig. 1).
3.2. Effects of the number of digestion cycles on the number and osteocytic nature of as-isolated cells
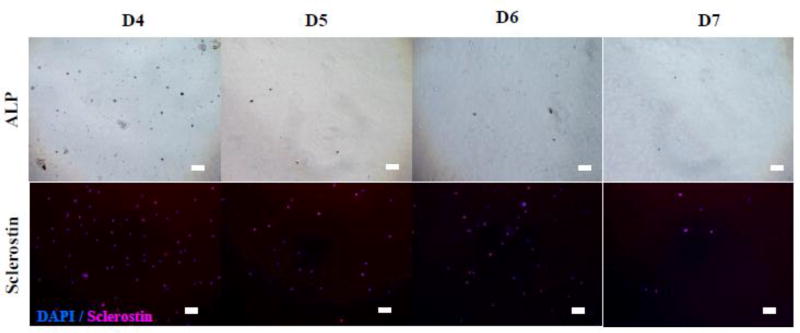
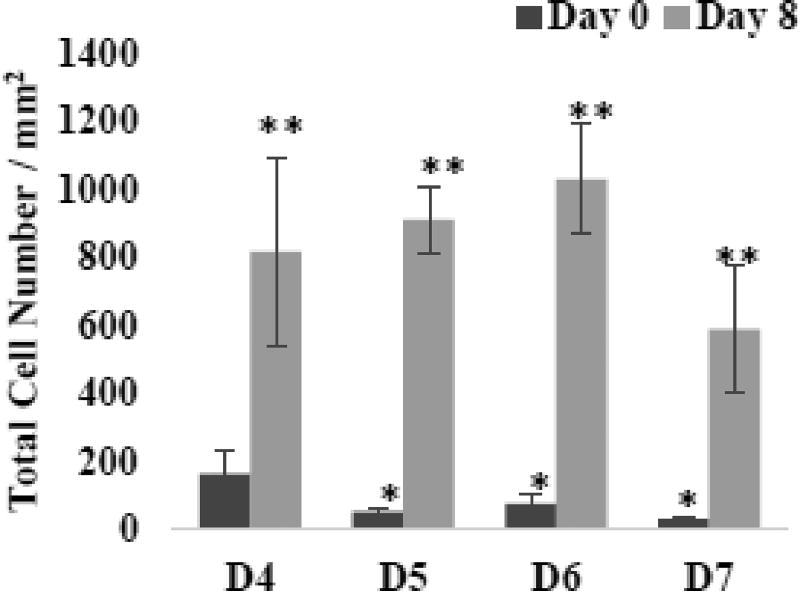
Fig. 3 shows the effects of the number of digestion cycles (D4 through D7) on the cells density and the osteocytic nature of isolated cells (i.e., at Day 0). ALP staining was used as an osteoblastic marker, and sclerostin staining as a mature osteocytic marker. The isolated cells, regardless of the digestion cycle number, were round in shape and not adherent. Also, many cells from D5, D6, and D7 were stained as sclerostin-positive. As quantified in Fig. 4, the fraction of sclerostin-positive cells was in the range of 56 to 73% for D5, D6, and D7 whereas that for D4 was only ~20% which is significant lower (P<0.05). However, as quantified in Fig. 5, the number density of isolated cells decreased considerably after D4. The results suggested that the freshly isolated cells were more osteocytic after D4, but with the lower density of cells.
Fig. 3. Effect of digestion cycle on osteocytic and osteoblastic populations.
Data representative of one patient sample (#3). Freshly isolated cells were stained with ALP & sclerostin to detect osteoblasts and osteocytes, respectively. Scale bar: 50 µm.
Fig. 5. Effects of digestion cycle on the proliferation of isolated cells.
Data representative of one patient sample (#3). Digested cells were cultured for 8 days in 2D after isolation. P<0.05, *compared to D4 and **compared to Day 0.
3.3. Effects of post-digestion 2D culture on the proliferation and differentiation of isolated cells
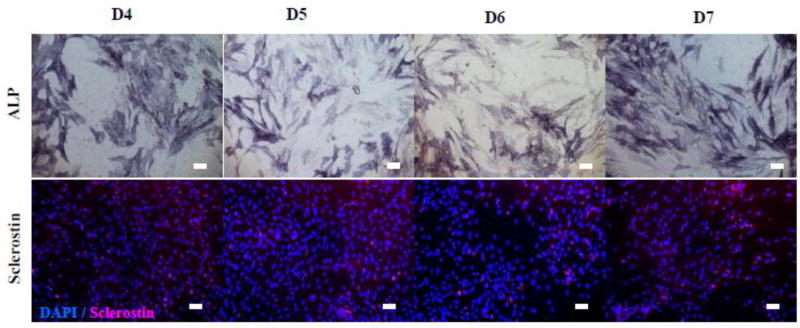
After 8 days of 2D culture, isolated cells became spread and adherent, independent of the digestion cycles (Fig. 6). Also, the cells proliferated significantly to reach confluence with the dominant presence of ALP-positive cells. The quantified data in Fig. 7 show that >80% of the cells were ALP-positive with <20% being sclerostin-positive, regardless of the digestion cycle number. The results suggested that a proliferating population containing >80% osteoblastic cells could be obtained upon post-isolation 2D culture of the isolated cells. Note that, when the digestion cycle number was less than 4 (i.e., D1, D2, and D3), post-isolation 2D culture produced much lower percentages of osteoblastic cells, only in the range of 8 to 36% (Supplementary Fig. 2).
Fig. 6. Effects of digestion cycle on the development of isolated cells.
Data representative of one patient sample (#3). Digested cells were cultured for 8 days in 2D after isolation and immunostained with ALP, DAPI (blue) and sclerostin (red).
3.4. Development of 3D-constructed bone cells
We used bone cells isolated at D4 (Fig. 2b) and cultured for 10 days (Fig. 2c) because the above results suggested that the highest number of healthy and osteoblastic cells could be obtained with D4. Fig. 2d shows that a mechanically integrated 3D network structure could be produced. The histologic images in Figs. 2e to 2h showed that cells resided in the interstitial sites between the microbeads. About 90% of the cells trapped in the interstitial were found to be viable (Supplementary Fig. 3). The entrapped cells formed cellular network through the dendritic processes (Figs. 2f and 2g). Also, by counting the number of cells and microbeads in the images, we determined that the number ratio of cells and microbeads remained in the range of 0.95 to 1.1. This result suggested that the entrapped cells did not proliferate. Collagen like ECM were stained in H&E staining and filled in the interstitial space. No mineralization deposited was found with 2 weeks culture.
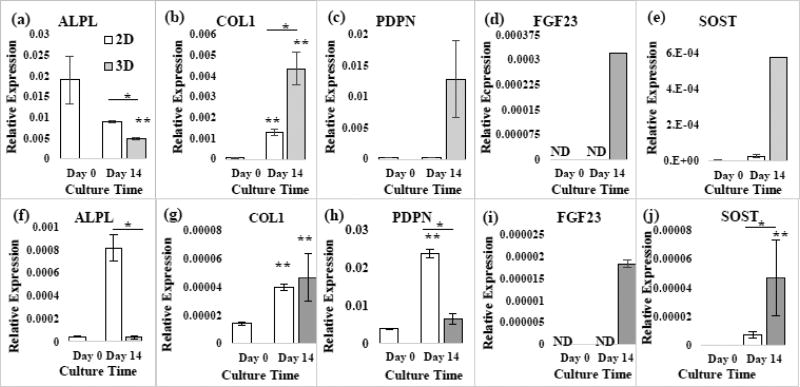
As shown in Fig. 8, the ALPL expression of the 3D-networked cells, constructed using two different patient samples, decreased after 14 days of culture. Also, COL1 significantly increased. FGF23 became detectable after 3D culture. SOST increase significantly (p<0.05). Meanwhile, PDPN increased with Patient Sample #6 and decreased with Patient Sample #4 after 3D culture. In comparison to 2D culture, ALPL was lower in 3D, but COL1 was upregulated. PDPN was higher in 3D, but to different levels between Patient Samples #4 and #6. FGF23 and SOST remained very low or were not detected during 2D culture.
Fig. 8. Effects of 2D versus and 3D culture on RT-PCR gene expressions using 2 patient samples.
(a)–(f) Patient #6 and (f)–(j) Patient #4. p<0.05, *2D vs. 3D. **Compared to Day 0.
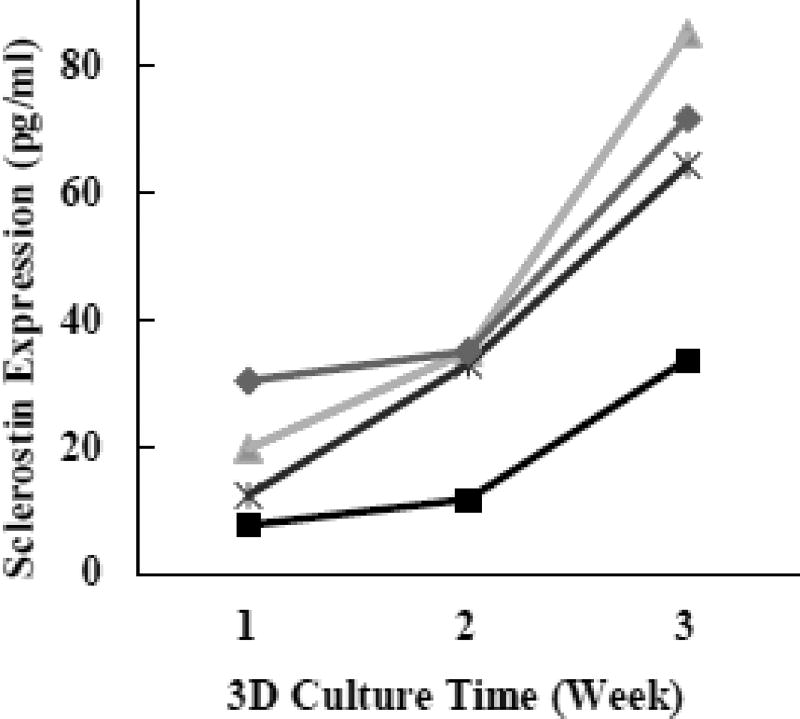
Immunohistology image in Fig. 2h showed that the 3D networked osteocytes expressed slcerostin after 14 days of culture. ELISA data shown in Fig. 9 showed that the level of sclerostin in the culture medium increased during the 3D culture period of 3 weeks. Note that, for each of four separate 3D culture chambers used in this experiment, the effluent stream was collected every week. The weekly medium collection was needed to obtain detectable quantities of sclerostin in the effluents.
Fig. 9. Sclerostin production measured by ELISA.
Effluent from 3D culture was collect up to 3 weeks. Four curves represent four culture chambers used in parallel for this experiment. The results were generated with patient sample #6.
4. Discussion
In this study, human primary bone cells were assembled with BCP microbeads and cultured to form 3D-networked osteocytes during microfluidic perfusion culture (Figs. 1 and 2d). The 3D-assembled osteocytes were connected via processes with an average cell-cell distance of 20–25 µm (Figs. 2e and 2f). The cell-to-cell distance was in part controlled by the diameter of the microbeads, as discussed in our prior publications.[32], [34] Cell proliferation was inhibited within the interstitial confine between the microbeads.
With increasing 3D culture time, the mature osteocytic expressions of SOST and FGF23 became significantly higher (Figs. 8 and 9). Also, the networked cells produced ECM to form a mechanically integrated tissue structure (Fig. 2d). The 3D culture results obtained for the human cells were similar to those observed with primary murine bone cells[32] and MLO-A5[34] except for that MLO-A5 produced significantly more ECM than the primary cells, and therefore a much denser tissue structure.[34]
In comparison to other 3D culture studies reported for osteocytic cells, the inhibited proliferative behavior of our 3D-constructed cells is particularly noteworthy and important. The proliferation of bone cells can lead to the formation of disordered and random cell aggregates, as reported by: (1) Prideaux et al.[35] for human primary osteocyte culture in collagen gel, Mulcahy et al.[36] and (2) Vazquez et al.[37] for MLO-Y4 cell cultures with matrigel and collagen gel, respectively. These 3D gel culture approaches resulted in very low cell densities and physiologically irrelevant cell-to-cell distance and 3D network structure. In another example, Boukhechba et al.[38] produced proliferated and aggregated osteocytic cells in the large interstitial space between 40–80 µm BCP particles.
Prior to the 3D construction, we isolated and cultured bone cells in 2D for 8 days to: (1) cell recovery from the stringent isolation procedure required to digest bone fragments (Supplementary Figs. 1 and (2) obtain sufficient cell numbers (Figs. 2b and 2c). We previously used a similar strategy to form the 3D-networked osteocytes using primary murine bone cells.[32] Consistent with our prior finding, the results from this study demonstrate that microbeads can be assembled with human primary osteoblastic cells to: (1) consists of 3D cellular network of primary human osteocytes, (2) mitigate the proliferation of the primary cells encountered in 2D culture, and (3) reproduce ex vivo the phenotype of human 3D-networked osteocytes.
Interestingly, we found that human bone cells were easier to digest than murine primary bone cells. Prideaux et al.[35] recently reported that they could isolated human osteocytes using 5 digestion cycles or more (<8 cycles) and reported similar results to ours. This study however focused only on the isolation and did not track the cell population change during 2D culture. We also found that the proliferated human primary osteoblastic population could be preserved in liquid nitrogen for subsequent use up to 4 passages (data not shown), as a practical source of constructing primary human 3D-networked osteocytes.
Further work is currently being conducted to demonstrate the utility of this ex vivo tissue model approach to study the regulatory functions of the 3D-networked osteocytes such as mechanotransduction and bone homeostasis. Currently, preclinical drug evaluation relies primarily on animal models. However, animal models have limited relevance to human disease and health, and are most often very poor at potential predicting clinical outcomes.[42]–[45] The human tissue model presented here is expected to provide a paradigm-changing avenue for alleviating current reliance on animal models, which are expensive and time consuming and yet often do not correlate with observed clinical responses.
5. Conclusions
A human 3D bone tissue model was developed by constructing ex vivo the 3D network of osteocytes via: (1) the biomimetic assembly of primary human osteoblastic cells with 20–25 µm and BCP microbeads and (2) subsequent microfluidic perfusion culture. The isolation and proliefration procedures of bone cells from human bone fragments were optimized to obtain a sufficient number of osteoblastic cells for the 3D construction experiments. The biomimetic assembly: (1) enabled 3D-constructed cells to form cellular network via processes with an average cell-to-cell distance of 20–25 µm and (2) inhibited cell proliferation within the interstitial confine between the microbeads while the confined cells produced ECM to form a mechanically integrated structure. With increasing 3D culture time, the mature osteocytic expressions of SOST and FGF23 genes became significantly higher. In contrast, these expressions remained very low or were not detected during 2D culture. The results validate that the 3D bone tissue model: (1) consists of 3D cellular network of primary human osteocytes, (2) mitigates the osteoblastic differentiation and proliferation of primary osteoblast-like cells encountered in 2D culture, and (3) therefore reproduces ex vivo the phenotype of human 3D-networked osteocytes.
Supplementary Material
Highlights.
Human bone tissue model, mimicking 3D-networked primary osteocytes
Enhanced expression of osteocyte markers and inhibited proliferation of primary human osteoblasts
Replicated in vivo phenotype of primary human osteocytes for the first time
Acknowledgments
Research in this publication was supported by grants from: (1) the National Institute of Arthritis and Musculoskeletal and Skin Diseases of the National Institutes of Health under Award Number 1R21AR065032 to WYL and JZ and (2) the National Science Foundation (DMR 1409779) to WYL and JZ. The content is solely the responsibility of the authors and does not necessarily represent the official views of the National Institutes of Health and the National Science Foundation. We would like to thank Professor Lynda Bonewald at Indiana University, Indianapolis for kindly providing us with the MLO-A5 cells. We thank Luke Fritzky at the Histology Core Facility at Rutgers-New Jersey Medical School for paraffin embedding and sectioning.
Footnotes
Publisher's Disclaimer: This is a PDF file of an unedited manuscript that has been accepted for publication. As a service to our customers we are providing this early version of the manuscript. The manuscript will undergo copyediting, typesetting, and review of the resulting proof before it is published in its final citable form. Please note that during the production process errors may be discovered which could affect the content, and all legal disclaimers that apply to the journal pertain.
References
- 1.Dallas SL, Prideaux M, Bonewald LF. The Osteocyte : An Endocrine Cell and More. Endocr Rev. 2013;34(5):658–90. doi: 10.1210/er.2012-1026. [DOI] [PMC free article] [PubMed] [Google Scholar]
- 2.Franz-odendaal TA, Hall BK, Witten PE. Buried Alive : How Osteoblasts Become Osteocytes. Dev. Dyn. 2005 Oct;:176–190. doi: 10.1002/dvdy.20603. 2006. [DOI] [PubMed] [Google Scholar]
- 3.Bonewald LF. The Amazing Osteocyte. J Bone Min. Res. 2011;26(2):229–238. doi: 10.1002/jbmr.320. [DOI] [PMC free article] [PubMed] [Google Scholar]
- 4.Loiselle AE DH, Jiang JX. Gap junction and hemichannel functions in osteocytes. Bone. 2013;54(2):205–12. doi: 10.1016/j.bone.2012.08.132. [DOI] [PubMed] [Google Scholar]
- 5.Kurata VH, Heino TJ K, Higaki H. Bone marrow cell differentiation induced by mechanically damaged osteocytes in 3D gel-embedded culture. J Bone Min. Res. 2006;21(4):616–25. doi: 10.1359/jbmr.060106. [DOI] [PubMed] [Google Scholar]
- 6.Sottnik JL, Dai J, Zhang H, Campbell B. Tumor-induced pressure in the bone microenvironment causes osteocytes to promote the growth of prostate cancer bone metastases. Cancer Res. 2015;75:2151–2158. doi: 10.1158/0008-5472.CAN-14-2493. [DOI] [PMC free article] [PubMed] [Google Scholar]
- 7.Giuliani N, et al. Increased osteocyte death in multiple myeloma patients : role in myeloma-induced osteoclast formation. Leukemia. 2011 Jul;:1391–1401. doi: 10.1038/leu.2011.381. 2012. [DOI] [PubMed] [Google Scholar]
- 8.Jesus Delgado-Calle TB, Anderson Judith, Cregor Meloney D, Hiasa Masahiro, Chirgwin John M, Carlesso Nadia, Yoneda Toshiyuki, Mohammad Khalid S, Plotkin Lilian I, David Roodman G. Bidirectional Notch Signaling and Osteocyte-Derived Factors in the Bone Marrow Microenvironment Promote Tumor Cell Proliferation and Bone Destruction in Multiple Myeloma. Cancer Res. 2016;76(5):1089–1100. doi: 10.1158/0008-5472.CAN-15-1703. [DOI] [PMC free article] [PubMed] [Google Scholar]
- 9.Delgado-Calle J RG, Bellido T. Role of osteocytes in multiple myeloma bone disease. Curr Opin Support Palliat Care. 2014;8(4):407–13. doi: 10.1097/SPC.0000000000000090. [DOI] [PMC free article] [PubMed] [Google Scholar]
- 10.Rosol PD Thomas J, DVM PhD, Tannehill-Gregg Sarah H, DVM, LeRoy Bruce E, DVM PhD, Mandl Stefanie, PhD, Contag Christopher H. Animal Models of Bone Metastasis. Cancer Treat Res. 2004;118:47–81. doi: 10.1007/978-1-4419-9129-4_3. [DOI] [PMC free article] [PubMed] [Google Scholar]
- 11.Zhang W LW, Gu Y, Hao Y, Sun Q, Konior K, Wang H, Zilberberg J. Well plate-based perfusion culture device for tissue and tumor microenvironment replication. Lab Chip. 2015;15(13):2854–63. doi: 10.1039/c5lc00341e. [DOI] [PMC free article] [PubMed] [Google Scholar]
- 12.Rutherford T HT, Orr J, Jr, Grendys E, Jr, Edwards R, Krivak TC, Holloway R, Moore RG, Puls L, Tillmanns T, Schink JC, Brower SL, Tian C. A prospective study evaluating the clinical relevance of a chemoresponse assay for treatment of patients with persistent or recurrent ovarian cancer. Gynecol Oncol. 2013;131(2):362–7. doi: 10.1016/j.ygyno.2013.08.009. [DOI] [PubMed] [Google Scholar]
- 13.Mi Z OJ, Holmes FA, Hellerstedt B, Pippen J, Collea R, Backner A, Bush JE, Gallion HH, Wells A. Feasibility assessment of a chemoresponse assay to predict pathologic response in neoadjuvant chemotherapy for breast cancer patients. Anticancer Res. 2008;28(3B):1733–40. [PubMed] [Google Scholar]
- 14.Yaccoby J author Shmuel, Ling Wen, Zhan Fenghuang, Walker Ronald, Barlogie Bart, Shaughnessy John D. Antibody-based inhibition of DKK1 suppresses tumor-induced bone resorption and multiple myeloma growth in vivo. Blood. 2007;109(5):2106–11. doi: 10.1182/blood-2006-09-047712. [DOI] [PMC free article] [PubMed] [Google Scholar]
- 15.Hutmacher DW KU, Horch RE, Loessner D, Rizzi S, Sieh S, Reichert JC, Clements JA, Beier JP, Arkudas A, Bleiziffer O. Translating tissue engineering technology platforms into cancer research. J Cell Mol Med. 2009;13(8A):1417–27. doi: 10.1111/j.1582-4934.2009.00853.x. [DOI] [PMC free article] [PubMed] [Google Scholar]
- 16.Holzapfel BM HD, Chhaya MP, Melchels FP, Holzapfel NP, Prodinger PM, von Eisenhart-Rothe R, van Griensven M, Schantz JT, Rudert M. Can bone tissue engineering contribute to therapy concepts after resection of musculoskeletal sarcoma? Sarcoma. 2013 doi: 10.1155/2013/153640. [DOI] [PMC free article] [PubMed] [Google Scholar]
- 17.Holzapfel BM HD, Thibaudeau L, Hesami P, Taubenberger A, Holzapfel NP, Mayer-Wagner S, Power C, Clements J, Russell P. Humanised xenograft models of bone metastasis revisited: novel insights into species-specific mechanisms of cancer cell osteotropism. Cancer Metastasis Rev. 2013;32(1):129–45. doi: 10.1007/s10555-013-9437-5. [DOI] [PubMed] [Google Scholar]
- 18.Li A, et al. Genomic Changes and Gene Expression Profiles Reveal That Established Glioma Cell Lines Are Poorly Representative of Primary Human Gliomas. Mol Cancer Res. 2008 Jan;6:21–30. doi: 10.1158/1541-7786.MCR-07-0280. [DOI] [PubMed] [Google Scholar]
- 19.Gillet J, Varma S, Gottesman MM. The Clinical Relevance of Cancer Cell Lines. J Natl Cancer Inst. 2013;105(7) doi: 10.1093/jnci/djt007. [DOI] [PMC free article] [PubMed] [Google Scholar]
- 20.Sandberg R, Ernberg I. Assessment of tumor characteristic gene expression in cell lines using a tissue similarity index (TSI) PNAS. 2005 doi: 10.1073/pnas.0408105102. [DOI] [PMC free article] [PubMed] [Google Scholar]
- 21.Rosser LF, Bonewald J. Studying osteocyte function using the cell lines MLO-Y4 and MLO-A5. Methods Mol Biol. 2012;816:67–81. doi: 10.1007/978-1-61779-415-5_6. [DOI] [PubMed] [Google Scholar]
- 22.Kato Y BL, Boskey A, Spevak L, Dallas M, Hori M. Establishment of an osteoid preosteocyte-like cell MLO-A5 that spontaneously mineralizes in culture. J Bone Min. Res. 2001;16:1622–23. doi: 10.1359/jbmr.2001.16.9.1622. [DOI] [PubMed] [Google Scholar]
- 23.Bodine PV KB, Vernon SK. Establishment and hormonal regulation of a conditionally transformed preosteocytic cell line from adult human bone. Endocrinology. 1996;137(11):4592–604. doi: 10.1210/endo.137.11.8895322. [DOI] [PubMed] [Google Scholar]
- 24.Winkler DG LJ, Sutherland MK, Geoghegan JC, Yu C, Hayes T, Skonier JE, Shpektor D, Jonas M, Kovacevich BR, Staehling-Hampton K, Appleby M, Brunkow ME. Osteocyte control of bone formation via sclerostin, a novel BMP antagonist. EMBO J. 2003;22(23):6267–76. doi: 10.1093/emboj/cdg599. [DOI] [PMC free article] [PubMed] [Google Scholar]
- 25.Atkins GJ FD, Rowe PS, Lim HP, Welldon KJ, Ormsby R, Wijenayaka AR, Zelenchuk L, Evdokiou A. Sclerostin is a locally acting regulator of late-osteoblast/preosteocyte differentiation and regulates mineralization through a MEPE-ASARM-dependent mechanism. J Bone Min. Res. 2011;26(7):1425–36. doi: 10.1002/jbmr.345. [DOI] [PMC free article] [PubMed] [Google Scholar]
- 26.Crockett JC, et al. Bone Remodelling at a Glance. J. Cell Sci. 2011;2011:991–998. doi: 10.1242/jcs.063032. [DOI] [PubMed] [Google Scholar]
- 27.Appelman-Dijkstra NM PS. Sclerostin Inhibition in the Management of Osteoporosis. Calcif Tissue Int. 2016;98(4):370–80. doi: 10.1007/s00223-016-0126-6. [DOI] [PMC free article] [PubMed] [Google Scholar]
- 28.Larson SR MC, Zhang X, Dumpit R, Coleman I, Lakely B, Roudier M, Higano CS, True LD, Lange PH, Montgomery B, Corey E, Nelson PS, Vessella RL. Characterization of osteoblastic and osteolytic proteins in prostate cancer bone metastases. Prostate. 2013;73:932–40. doi: 10.1002/pros.22639. [DOI] [PMC free article] [PubMed] [Google Scholar]
- 29.Brunetti G CS, Oranger A, Mori G, Specchia G, Rinaldi E, Curci P, Zallone A, Rizzi R, Grano M, Information A. Sclerostin is overexpressed by plasma cells from multiple myeloma patients. Ann N Y Acad Sci. 2011;1237:19–23. doi: 10.1111/j.1749-6632.2011.06196.x. [DOI] [PubMed] [Google Scholar]
- 30.Terpos E DM, Christoulas D, Katodritou E, Bratengeier C, Gkotzamanidou M, Michalis E, Delimpasi S, Pouli A, Meletis J, Kastritis E, Zervas K. Elevated circulating sclerostin correlates with advanced disease features and abnormal bone remodeling in symptomatic myeloma: reduction post-bortezomib monotherapy. Int J Cancer. 2012;131(6):1466–71. doi: 10.1002/ijc.27342. [DOI] [PubMed] [Google Scholar]
- 31.Walker RE CA, Lawson MA, Buckle CH, Snowden JA. Myeloma bone disease: pathogenesis, current treatments and future targets. Br Med Bull. 2014;111(1):117–38. doi: 10.1093/bmb/ldu016. [DOI] [PubMed] [Google Scholar]
- 32.Sun Q, Gu Y, Zhang W, Dziopa L, Zilberberg J, Lee W. Ex vivo 3D osteocyte network construction with primary murine bone cells. Bone Res. 2015 Aug;3:15026. doi: 10.1038/boneres.2015.26. [DOI] [PMC free article] [PubMed] [Google Scholar]
- 33.Torreggiani E KI, Matthews BG, Pejda S, Matic I, Horowitz MC, Grcevic D. Preosteocytes/Osteocytes Have the Potential to Dedifferentiate Becoming a Source of Osteoblasts. PLoS One. 2013;8(9) doi: 10.1371/journal.pone.0075204. [DOI] [PMC free article] [PubMed] [Google Scholar]
- 34.Gu Y, Zhang W, Sun Q, Hao Y. Microbead-guided reconstruction of the 3D osteocyte network during microfluidic perfusion culture. J. Mater. Chem. B. 2015;3(1):3625–3633. doi: 10.1039/C5TB00421G. [DOI] [PMC free article] [PubMed] [Google Scholar]
- 35.Prideaux M, et al. Isolation of osteocytes from human trabecular bone. Bone. 2016;88:64–72. doi: 10.1016/j.bone.2016.04.017. [DOI] [PubMed] [Google Scholar]
- 36.C T, Mulcahy D, Taylor LE, Lee D. RANKL and OPG activity is regulated by injury size in networks of osteocyte-like cells. Bone. 2011;48:182–188. doi: 10.1016/j.bone.2010.09.014. [DOI] [PubMed] [Google Scholar]
- 37.Vazquez M, et al. A new method to investigate how mechanical loading of osteocytes controls osteoblasts. Front Endocrinol. 2014 Dec;5:1–18. doi: 10.3389/fendo.2014.00208. [DOI] [PMC free article] [PubMed] [Google Scholar]
- 38.Boukhechba F, Balaguer T, Ackermann K, Quincey D. Human Primary Osteocyte Differentiation in a 3D Culture System. J Bone Min. Res. 2009;24(11):1927–1935. doi: 10.1359/jbmr.090517. [DOI] [PubMed] [Google Scholar]
- 39.Paola Divieti Pajevic LM, Spatz Jordan M, Garr Jenna, Adamson Chris. Osteocyte biology and space flight. Curr Biotechnol. 2014;2(3):179–183. doi: 10.2174/22115501113029990017. [DOI] [PMC free article] [PubMed] [Google Scholar]
- 40.Stern AR BL, Stern MM, Van Dyke ME, Jähn K, Prideaux M. Isolation and Culture of Primary Osteocytes from the Long Bones of Skeletally Mature and Aged Mice. Biotechniques. 2012;52(6):361–73. doi: 10.2144/0000113876. [DOI] [PMC free article] [PubMed] [Google Scholar]
- 41.Lee JH LW, Wang H, Kaplan JB. Microfluidic Approach to Create Three-Dimensional Tissue Models for Biofilm-Related Infection of Orthopaedic Implants. Tissue Eng Part C Methods. 2011;17(1):39–48. doi: 10.1089/ten.TEC.2010.0285. [DOI] [PubMed] [Google Scholar]
- 42.M J. The benefits and limitations of animal models for translational research in neurodegenerative diseases. Nat Med. 2010;16(11):1210–4. doi: 10.1038/nm.2224. [DOI] [PubMed] [Google Scholar]
- 43.T H. Thoughts on limitations of animal models. Park. Relat Disord. 2008;14:S81–3. doi: 10.1016/j.parkreldis.2008.04.003. [DOI] [PubMed] [Google Scholar]
- 44.Rhrissorrakrai K HJ, Belcastro V, Bilal E, Norel R, Poussin C, Mathis C, Dulize RH, Ivanov NV, Alexopoulos L, Rice JJ, Peitsch MC, Stolovitzky G, Meyer P. Understanding the limits of animal models as predictors of human biology: lessons learned from the sbv IMPROVER Species Translation Challenge. Bioinformatics. 2015;31(4):471–83. doi: 10.1093/bioinformatics/btu611. [DOI] [PMC free article] [PubMed] [Google Scholar]
- 45.Couzin-Frankel Jennifer. Hope in a mouse. Science (80-.) 2014;346:28–29. doi: 10.1126/science.346.6205.28. [DOI] [PubMed] [Google Scholar]
Associated Data
This section collects any data citations, data availability statements, or supplementary materials included in this article.


