Abstract
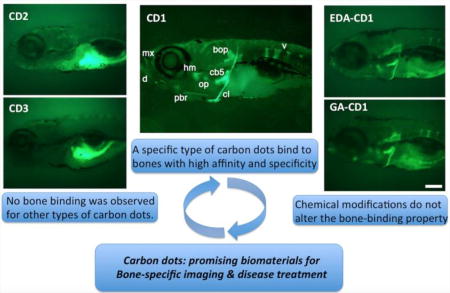
Bone-related diseases and dysfunctions are heavy burdens on our increasingly aged society. One important strategy to relieve this problem is through early detection and treatment of bone-related diseases. Towards this goal, there has been constant interest in developing novel bone-specific materials for imaging and drug delivery. Currently, however, materials that have high affinity and specificity towards bone are very limited. Carbon dots (C-dots) synthesized from carbon nanopowder bind to calcified bones in vivo with high affinity and specificity. In this study we show that bone binding is highly unique to a specific type of C-dots, and that this binding is non-toxic. Significantly, C-dots derived from other raw materials did not show any bone binding properties. These differences are attributed to differences in surface chemistry of C-dots preparations, highlighting the heterogeneous nature of C-dots. Importantly, bone-binding by carbon nanopowder derived C-dots are not significantly altered by chemical functionalization of their surface. These unique properties indicate the potential applications of carbon nanopowder-derived C-dots as highly bone-specific bioimaging agents and drug carriers.
Keywords: carbon dots, calcified bone, drug delivery, fluorescence imaging, zebrafish
Graphical abstract
1. INTRODUCTION
Bone-related diseases and dysfunctions are increasingly becoming heavy burdens to our aged society. It is estimated that over 54 million U.S. adults age 50 and older suffer from osteoporosis and low bone mass, diseases that weaken bones and impair normal function.1 Unfortunately, there is no cure for osteoporosis; current osteoporosis treatments only mitigate mineral bone degradation without properly stimulating mineral bone production (osteogenesis).2
Over the past several years, significant efforts have been devoted to develop novel early detection/imaging techniques that could identify and treat osteoporosis at its earliest stages. Among the most widely used bone imaging techniques are X-ray and computed tomography (CT), which have a wide number of clinical applications. However, both involve exposing part or whole body to ionizing radiation, which is potentially harmful especially when extent longer time or frequent imaging is required.3 Fluorescence imaging capable of imaging with high selectivity and sensitivity has been widely used in biological sciences for both in vitro cellular and in vivo imaging.4 Considering the potential risks associated with X-ray and CT imaging as well as the recent advances in fluorescence microscopic techniques, there has been constant interest in developing fluorescence imaging applications for early detection of bone-related diseases. In addition, equal if not more efforts have been devoted to the development of treatment approaches that could stimulate bone mineralization by osteoblasts and thus restore the bone density.5, 6 Although several signaling pathways can be potentially targeted to increase bone mineralization, their clinical use has been significantly limited due to their systemic non-skeletal effects.7, 8 One strategy to overcome this limitation is the development of bone-specific biomaterials to target ubiquitous pathways exclusively in bone tissues. However despite these efforts, materials suitable for in vivo bone fluorescence imaging and/or targeting ubiquitous pathways in bone are extremely rare. This lack of in vivo bone-specific biomaterials is presumably due to: [1] bones are normally buried deep within other soft tissues (i.e., muscles), making it extremely difficult to deliver imaging agents/drug carriers to bone without interacting and accumulating in other tissues; [2] the unique anatomical features of bone, which mainly consists of inorganic hydroxyapatite, make the targeted delivery of effecting imaging agents/drug carriers to bones rather difficult due to the limited ability of interaction.9
Carbon dots (C-dots), a class of amorphous spherical carbon-based nanoparticles,10 are among the most investigated fluorescence materials in the last decade due to their superior properties such as bright photoluminescence (PL), high photostability, wavelength dependent emission, high water solubility, excellent biocompatibility as well as relatively economic and wide availability.11–14 Applications of C-dots for in vitro cellular imaging include both cell-compartment and cell-type specific imaging.15 Also, C-dots use for in vivo imaging of tissues in mosquitos, zebrafish and mice have been reported.15–20 In most of the in vivo studies, however, C-dots were found to accumulate in various parts of the body without specificity.14, 21–23 The lack of specificity significantly limits their use for targeted applications, such as early detection and treatment of bone de-mineralization diseases. Only recently, interactions of C-dots with ex vivo samples, extracted and cracked bones, have been reported using C-dots functionalized with glutamic acid.24, 25
In our continuous efforts to develop C-dots based bioimaging and drug delivery systems,18, 26, 27 we recently reported that delivery of a particular class of C-dots into the heart or abdominal cavity of zebrafish larvae resulted in the deposition of these C-dots into calcified bones with high affinity and specificity.18 However, it is unknown whether the high specificity and affinity presented is unique to the type of C-dots prepared in our lab, or it might be a general property for C-dots. In addition, the surface modification and functionalization of C-dots for imaging and drug delivery would be necessary, thus it would be very important to know whether the high binding affinity and specificity of C-dots to bones is preserved after surface modification or conjugation. To address these questions, we analyzed the interaction of calcified bones with different type of C-dots and the possible interaction mechanism. In the study, we investigated the interaction of three different types of C-dots with zebrafish bones, showing that the high affinity and specificity towards calcified bones is unique to a specific type of C-dots prepared in our lab; C-dots prepared with other methods did not show any interaction with bone. Furthermore, we demonstrate that surface modification or functionalization of the C-dots did not alter their high binding affinity and specificity for bones. The nontoxic nature of these C-dots opens new venues for the targeted imaging, diagnosis and treatment of bones and associated diseases.
2. EXPERIMENTAL SECTION
2.1. Reagents and instruments
Carbon nanopowder, calcium chloride, critic acid, ethylenediamine (EDA), N-(3-Dimethylaminopropyl)-N′-ethylcarbodiimide hydrochloride (EDC), glycerin, glutamic acid (GA), poly(ethylene glycol) bis(3-aminopropyl) terminated (PEG diamine, M.W. ~ 1500), N-Hydroxysuccinimide (NHS) and chondroitin sulfate sodium salt from shark cartilage were purchased from Sigma-Aldrich (St. Louis, MO). 98% (w/w) sulfuric acid and 70% (w/w) nitric acid were obtained from VWR (Radnor, PA). Hydroxyapatite nanoparticles, 5–10% (w/v) aqueous colloidal dispersion, 20–50 nm particles were purchased from Alfa Aesar (Ward Hill, MA). All chemicals were used as received without further purification. Purified water, which has a surface tension of 72.6 mN·m−1 and a resistivity of 18 MΩ·cm at 20.0 ± 0.5 °C, was obtained from a Modulab 2020 water purification system (San Antonio, TX). Size exclusion chromatography column was packed with GE Healthcare Sephacryl S-300 (Uppsala, Sweden). Dialysis tubing with a molecular weight cutoff of 3500 was purchased from Thermo Scientific (Rockford, IL). Fluorescence was measured by a fluorescence spectrophotometer (Horiba Jobin Yvon Fluorolog–3) at 25 °C with a slit width of 5 nm for both excitation and emission. Solution-based zeta potential analyses were characterized using a Zetasizer Nano ZS System (Malvern, Inc., UK) with irradiation from a standard 633 nm laser. The UV/Vis absorption spectra were obtained using a Cary 100 UV-Vis spectrophotometer (Agilent Technologies, USA) with a 1 cm optical path length cell. Fourier-transform infrared (FTIR) spectra were obtained using a PerkinElmer FTIR (Frontier) spectrometer using the attenuated total reflection (ATR) technique with background of the ATR prism alone. Transmission electron microscopy (TEM) was performed on a JEOL 1200× TEM.
2.2. Synthesis and characterization of C-dots
Black powder C-dots (CD1) was synthesized from carbon nanopowder following our previously reported procedure.26 Briefly, 1 g of carbon nanopowder in a mixture of sulfuric acid (36 mL, 98%) and nitric acid (12 mL, 70%) were heated with reflux at 110 °C for 15 h to yield the C-dots. After the reaction, acids were neutralized with sodium hydroxide, and the resulting salts were removed by crystallization in cold water. This process was repeated three times. The solution was then further extracted with chloroform, and the aqueous layer obtained was subjected to dialysis with a semi membrane dialysis bag (MWCO 3500) against pure water for 4 days. C-dots in black powder form were obtained after the removal of water.
Gel-like C-dots (CD2) used in the experiments was prepared according to a previous procedure reported by our group.28 Briefly, a 50 ml, round-bottom flask with 5 ml ethylenediamine (EDA) was purged with argon for 5 min before it was heated with constant stirring. Citric acid (1 g) was quickly added when the temperature rose to 160 °C. The mixture was allowed to react for 50 min, and then it was removed from the bath and cooled to ambient temperature. The unreacted EDA was removed by washing with acetone, which yielded the as-formed C-dots deposited in the bottom of the reaction flask.
Glycerin C-dots (CD3) was prepared according to previously reported procedure.24, 29 Briefly, 3.0 mL of glycerin and 200 mg of PEG diamine were added to a 25 mL three-neck flask degassed with argon. The mixture was heated to 250 °C, and then 200 mg of citric acid was added and the reaction was stirred at same temperature for 3 hours. The resulting product was cooled to ambient temperature and subjected to dialysis with a semi membrane dialysis bag (MWCO 3500) against pure water for 2 days. Glycerin C-dots were obtained after the removal of water. All the C-dots synthesized above were characterized using UV–Vis, fluorescence, Fourier transform infrared spectroscopy (FTIR) and transmission electron microscopy (TEM), and compared to the values reported in literatures.
2.3. Synthesis and characterization of C-dots conjugates
Conjugation of CD1 with ethylenediamine (EDA): To conjugate CD1 to EDA, 8.34 mg of 1-ethyl-3-(3-dimethylaminopropyl) carbodiimide hydrochloride (EDC) was added to 2.0 mL of 2.5 mg/mL CD1 aqueous dispersion in PBS buffer at pH 7.4. After 20 min, 2.6 mg of EDA were added to the mixture, which was stirred at room temperature for 3 h. The product of the reaction was subjected to a size exclusion chromatography column (Sephacryl S-300) for purification. Sample was lyophilized to obtain solid EDA-modified C-dots (EDA-CD1), and then characterized by standard methods.
Conjugation of CD1 with glutamic acid (GA): To conjugate CD1 with GA, 8.34 mg of EDC was added to 2.0 mL of 2.5 mg/mL CD1 aqueous dispersion in PBS buffer at pH 7.4. After 20 min, 10.66 mg of GA were added, and the mixture was stirred at room temperature overnight. The resulting solution was then dialyzed with a semi membrane dialysis bag (MWCO 3500) against pure water for 2 days to remove the unreacted GA. The conjugates (GA-CD1) were obtained after the removal of water by lyophilization, and then characterized by standard methods.
Conjugation of CD3 with GA: the reaction was carried out according to a reported procedure24, with slight modification. Briefly, 230 mg of EDC was added to 2.0 mL of 2.5 mg/mL CD3 aqueous dispersion in PBS buffer at pH 7.4, followed by the adding of 138 mg of NHS. After 30 min, 8.8 mg of EDA were added, and the mixture was allowed to stir at ambient temperature overnight. The resulting solution was then dialyzed with a semi membrane dialysis bag (MWCO 3500) against pure water for 2 days to remove any unreacted chemicals. The conjugates (GA-CD3) were obtained by removal of water through lyophilization, and then characterized by standard methods.
2.4. Zebrafish injection
Wild-type zebrafish embryos were procured from the University of Miami Zebrafish Core Facility following standard husbandry protocols.30 All protocols were reviewed and supervised by the University of Miami Animal Care and Use Committee. Zebrafish embryos were collected after natural spawns during a period of 4 h, and grown until day 6 post fertilization. Larvae were then anaesthetized in 30 mL buffered embryo media containing 0.4% Tricaine using standard protocols.30 Anesthetized larvae were injected in the abdominal cavity with about 5 nL of carbon dots at the appropriate concentration. After a 30 min recovery in Embryo Media, surviving larvae were allowed to grow for the duration of the experiment. During this time, larvae were feed once a day, and fresh embryo media was replaced every two days.
2.5 Zebrafish imaging
For imaging, zebrafish embryos injected at day 6 were grown until day 8 post fertilization. Larvae were anaesthetized as described, and mounted on a concave glass slide coated with 3% methyl-cellulose and a few drops of embryo media with Tricaine. Embryo images were taken under bright light and 488 nm wavelength light using a Zeiss Axiocam MRc camera mounted on an AxioExaminer Z1 compound microscope. Time of exposure varied between specimens due to differences in the intensity of their staining, and to highlight the stark differences in fluorescence; larvae with strong staining (e.g., CD1) had shorter exposure times than larvae with weak or no staining (e.g., CD2, CD3). Images were processed using Zeiss AxioVision. Representative images were cropped and assembled with no further modification into figures using Photoshop CS4.
3. RESULTS AND DISCUSSION
3.1. Synthesis and characterization of C-dots
CD1 prepared according to our previously reported procedures26 are spherical in nature, with sizes ranging from 1.5 to 5.0 nm (Fig. SI 1A). These particles disperse very well in aqueous solutions presumably due to the presence of abundant carboxylic groups on the surface, although FTIR spectroscopic analysis also revealed the presence of some intact carbon structures with C-C or C=C bonds (Fig. SI 1B). CD1 also have very strong absorbance in the region of 200 – 500 nm (Fig. SI 1C) and demonstrate excitation-wavelength dependent emission spectra (Fig. SI 1D). All these parameters are in agreement with previously reported values.26
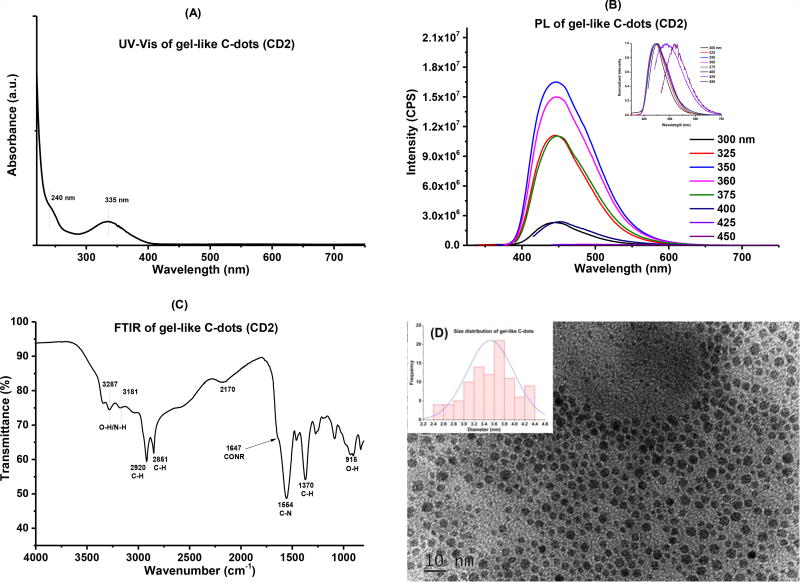
CD2 were synthesized via pyrolysis according to our previously reported procedure and obtained in colorless gel-like form.28 UV-Vis absorption, fluorescence, FTIR and TEM were used to characterize these particles (Fig. 1). Broad and strong absorption peaks were observed in the range from 400 – 200 nm, which were attributed to the n−π* transition of C=O bonds and π−π* transition of aromatic C=C bonds, respectively (Fig. 1A).31 CD2 present the characteristic PL behavior of most C-dots, in which the emission spectra depend on the excitation wavelengths (Fig. 1B). In the solid state FTIR spectrum, CD2 revealed various peaks at 3287 (OH), 3181 (NH), 2920 (CH), 2851 (CH), 1554 (C-N), 1370 (C-H), and 915 (O-H) cm−1, indicating the presence of rich surface functionalities (Fig. 1C). TEM image of CD2 shows spherical particles with a diameter distribution between 2.5 to 4.5 nm and an average size of 3.5 nm (Fig. 1D). All of the characteristics are in agreement with previous reports.28
Figure 1.
Characterization of gel-like C-dots (CD2). (A): UV-Vis absorption spectroscopy; (B): fluorescence spectroscopy, inset is the normalized spectra; (C): FTIR spectroscopy and (D) TEM, inset is the size distributions of the particles.
CD3 were prepared from three different components (glycerin, PEG diamine and citric acid) following recently published procedures.24, 29 UV-Vis absorption, fluorescence, FTIR and TEM were used to confirm the successful preparation of these particles (Fig. SI 2). UV-Vis absorption spectrum revealed that these particles have strong and continuous absorption from 600 to 200 nm (Fig. SI 2A). CD3 also demonstrate excitation-wavelength dependent emission spectra according to the PL study, where the maximum emission (486 nm) was observed when excited at 400 nm (Fig. SI 2B). Peaks at 3395 (OH/NH), 2877 (CH2/CH3), 1730 (C=O), 1340 (C-H), and 1106 cm−1 (C-O) in the FTIR spectrum indicate the presence of carboxyl, amino and aliphatic functionalities, which were expected considering the starting materials used to prepare these particles (Fig. SI 2C). According to TEM study, these particles are ranging from 2.5 to 5.5 nm in diameters and with an average size of 4.0 nm (Fig. SI 2D). In summary, characterizations of UV-Vis absorption, fluorescence, FTIR and TEM confirmed the successful preparation of CD3.
3.2. Modification of C-dots through EDC/NHS chemistry and their characterizations
All of the modifications on C-dots were carried out through the classical EDC/NHS crosslinking chemistry.32 Briefly, the carboxyl-containing C-dots were first activated by reacting with EDC in PBS buffer at pH of 7.4. The reactive intermediate formed was then allowed to react with amine-containing compounds to yield stable conjugates by the formation of amide bonds. Standard characterization methods were applied to confirm the conjugation of the different moieties.
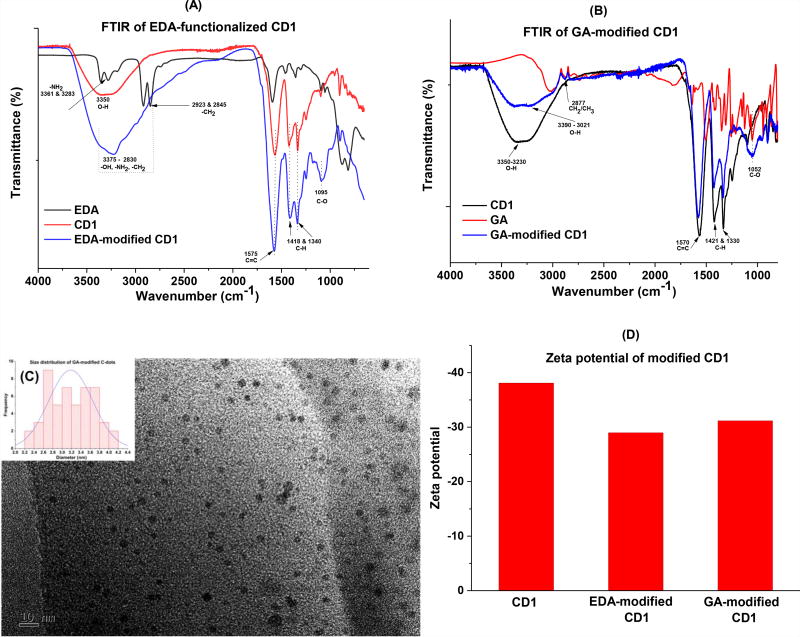
Generally, like the unmodified CD1, both EDA and GA-modified CD1 disperse well in water. In the UV-Vis spectra of the conjugates, characteristic absorptions of CD1 at 228 and 264 nm were observed in both EDA-CD1 and GA-CD1 conjugates (Fig. SI 3A). The fluorescence spectra of EDA-CD1 and GA-CD1 (Fig. SI. 3B and 3C, respectively) also present the characteristic information from CD1 such as excitation-wavelength-dependent emission spectra. Further, all of the three demonstrate the maximum emission peaks at 518 nm when excited at 440 nm (Fig. SI 1D, 3B and 3C), indicating the conjugation did not alter the PL property of CD1 significantly. In the FTIR spectra of EDA-CD1 (Fig. 2A), the conjugate presented a very strong and broad absorption from 2830 – 3375 cm−1, presumably due to the overlap of signals from –OH, -NH2 and –CH2 after conjugation; also the characteristic peaks at 1575 (C=C), 1418 and 1340 cm−1 (C-H) were observed in the conjugate, indicating the successful conjugation of EDA and CD1. In the FTIR spectra of GA-CD1 (Fig. 2B), similar results were observed due to the conjugation. Briefly, a much broader absorption at 3021 – 3390 cm−1 (-OH) was observed probably due to the signals overlap from GA and CD1; further, characteristic absorptions of both GA (2877 cm−1 for CH2/CH3) and CD1 (1570 for C=C, 1421 and 1330 cm−1 for C-H) were observed in the conjugate, indicating the successful conjugation of GA and CD1. In summary, according to the FTIR spectra study, the conjugates present the characteristic information from both C-dots and modification agents (i.e., EDA and GA), indicating the conjugation reactions were indeed successful (Fig.2A and 2B). TEM analysis indicate both conjugates (EDA-CD1 and GA-CD1) have increased particle sizes, which is expected since the successful attachment of EDA or GA would increase the sizes of CD1 (Fig. 2C and Fig. SI 3D). Further, the decreases in the zeta potential of the conjugates also suggest the successful conjugation of CD1 with the modification agents (Fig. 2D).
Figure 2.
Characterization of EDA-CD1and GA-CD1 conjugates. (A): FTIR spectra of EDA-CD1; (B): FTIR spectra of GA-CD1; (C): TEM of GA-CD1, inset is the size distributions of the particles; and (D) zeta potentials of modified CD1.
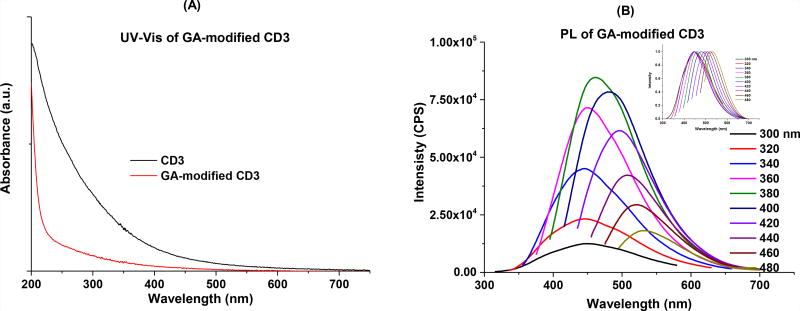
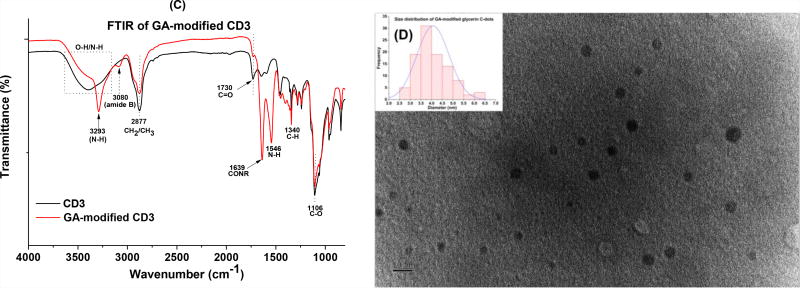
In the UV-Vis spectrum of the GA-CD3 conjugate, a continuous absorption from 500 to 200 nm was also observed, however, the absorption is overall less intense compared to unmodified CD3 and absorption beyond 500 nm is completely diminished (Fig. 3A). In the fluorescence spectra, GA-CD3 also demonstrates excitation-wavelength-dependent emission spectra (Fig 3B), however, the maximum emission (462 nm) was observed when excited at 380 nm, a slight blue shift compared to the unmodified CD3. In the FTIR spectra, GA-CD3 retained some of the characteristic peaks of the unmodified CD3, such as peaks at 2877 (CH2/CH3) and 1106 (C-O); meanwhile, a series of new peaks due to conjugation, such as 3293 (N-H), 1639 (CONR, amide I stretching) and 1546 (N-H, amide II bending), were observed (Fig. 3C). According to the TEM study (Fig. 3D), the conjugates have diameters in the range of 2.5 – 6.5 nm, with an average size of about 4.1 nm, which is slightly larger than that of free CD3. The fact that the zeta potential of GA-CD3 (−4.2) was significantly less negative than that of the unmodified CD3 (−15.2) also suggested the successful conjugation of GA and CD3 (Fig. SI 4).
Figure 3.
Characterization of GA-CD3 conjugates. (A): UV-Vis absorption spectroscopy; (B): fluorescence spectroscopy, inset is the normalized spectra; (C): FTIR spectroscopy; and (D) TEM, inset is the size distributions of the particles.
3.3. C-dots synthesized from black carbon powder (CD1) are non-toxic and unique in their ability to bind to calcified bones in vivo
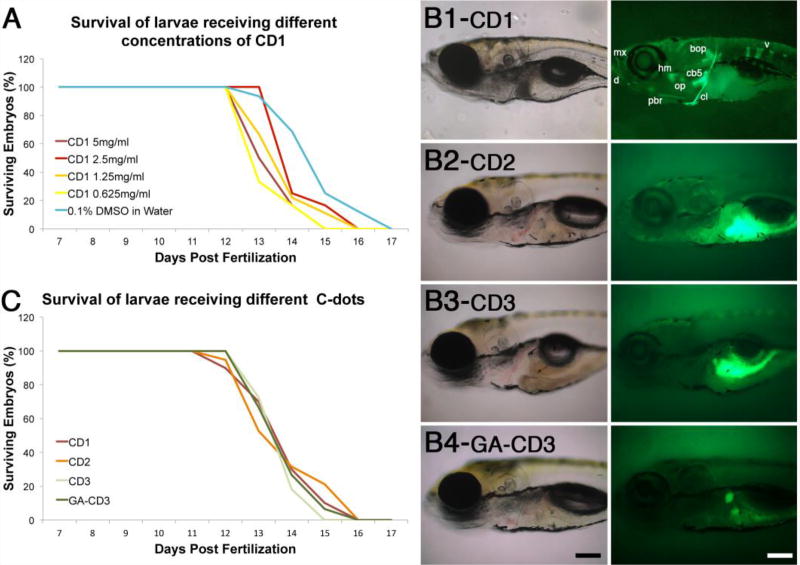
We have shown previously C-dots synthesized from carbon powder (CD1) can bind with high affinity and specificity to calcified bones in live zebrafish larvae,18 however it is not known if CD1-binding to bones is detrimental to larvae viability. We have used zebrafish in our experiments for several reasons, including its rapid development, excellent optical clarity and very similar and predictable skeleton and mineralizing tissue development to that of humans.33–37 To test for potential toxicity, we followed the survival of 6-day old larvae injected with different amounts of CD1 (3.1 ng to 25.0 ng). We did not observe any loss of viability in larvae injected with CD1 compared to mock controls, from day 7- to day 12-post fertilization (Fig. 4A). Loss of viability was observed in all experimental and control groups from day 12- to day 17-post fertilization when the experiment was terminated (Fig. 4A). The similarities in survival curves between control and experimental larvae demonstrate that CD1 up to 25 ng are well tolerated by the organism without any detrimental effects.
Figure 4.
Carbon dots synthesized from carbon powder (CD1) are non-toxic and unique in their ability to bind bone. (A) Survival curves of larvae injected with different amounts of CD1. (B) Transmitted and fluorescent images of 8-day old larvae injected at 6 days post fertilization with C-dots synthesized from carbon powder (B1, CD1), citric acid (B2, CD2), glycerin (B3, CD3), and glutamic acid-conjugated glycerin derived C-dots (B4, GA-CD3). In B1, bones are dentary (d), maxilla (mx), posterior branchiostegal ray (pbr), hyomandibula (hm), opercle (op), ceratobranchial 5 (cb5), cleithrum (cl), basioccipital articulatory process (bop), and vertebrae (v). Images in B2 and B3 were over-exposed to demonstrate that CD2 and CD3 do not bind to bones; the autofluorescence seen in the gut tissues is a result of image over exposure. In B4, the two stained structures correspond to primitive kidneys (pronephros). Scale bar is 100 microns. (C) Survival curves of larvae injected with different C-dots preparations. For both graphs, survival curves for control (0.1% DMSO in water) and C-dots injected larvae are not significantly different (n≥25 embryos per condition in at least two independent experiments).
Because C-dots can be synthesized from numerous starting materials and various methods,15 we next tested whether the starting material and preparation methods would influence C-dots’ bone-binding properties. Among the various methods available, there are generally two major strategies to prepare C-dots, namely “top-down” and “bottom-up” approach. In our previous study,18 CD1 were prepared from carbon nano powders in a “top-down” approach, thus for comparison, C-dots synthesized with the “bottom-up” method would be desired. To this end, a new type of C-dots (CD2) were prepared from citric acid and ethylenediamine through the bottom-up approach.28 Such C-dots generally have very high quantum yield, and have been broadly studied and used in many applications.38, 39 Besides these two C-dots, a third type of C-dots from glycerin (CD3) was also prepared to explore the bone-binding properties. These glycerin-based C-dots have been shown recently that they can accumulate at fresh bone cuts ex vivo,24, 25 thus it is of interest to explore their bone binding properties in vivo.
To test the bone binding properties of the various C-dots preparations, we injected 25 ng of these C-dots in the abdominal cavity of 6-day old larvae and, 2-days after injection, analyzed C-dots deposition in bones using the C-dots intrinsic fluorescence. As we have previously shown,18 CD1 bound to calcified bones with high affinity and specificity (Fig. 4, B1). However, C-dots prepared from citric acid (CD2) or glycerin (CD3) were not detected in bones, even after prolonged image exposure (Fig. 4, B2 and B3; fluorescence observed in gut regions is due to autofluoresence of yolk that was captured by the prolonged image exposure). To potentially increase bone-binding affinity of CD3, we conjugated glutamic acid to glycine C-dots (GA-CD3), as the acid’s negative charges have been shown in vitro to increase the C-dot’s calcium binding capacity.40 In contrast to the reported in vitro assay, GA-CD3 failed to bind to bones in vivo (Fig. 4, B4), although some accumulation was observed in the primitive kidney (pronephros; Fig. 4, B4). Thus, from all preparations tested, only the C-dots synthesized from carbon powder (CD1) using a “top down” approach had in vivo bone binding activity. Since the “top down” approach required strong oxidants (mixture of concentrated sulfuric and nitric acids) for the preparation of CD1, the extreme reaction condition which could produce abundant polar groups on the surface of CD1 might play an important role for their superior bone binding activity.
Although only CD1 exhibited bone-binding affinity, we wanted to test the toxicity of all C-dots preparations. Thus, we repeated the survival assay using 25 ng of C-dots synthesized from citric acid (CD2), glycerin (CD3), or glycerin conjugated to glutamic acid (GA-CD3). We did not observe any loss of viability in treated larvae for the first 5 days after injection (Fig. 4C). Starting at day 12 post fertilization, and continuing until day 16, larvae viability was lost in all conditions, including controls (Fig. 4A, C). The similarity in the survival of control and experimental groups suggest that for the developmental stages tested, none of the C-dots are toxic.
3.4. Mechanistic studies of interaction between C-dots and bone
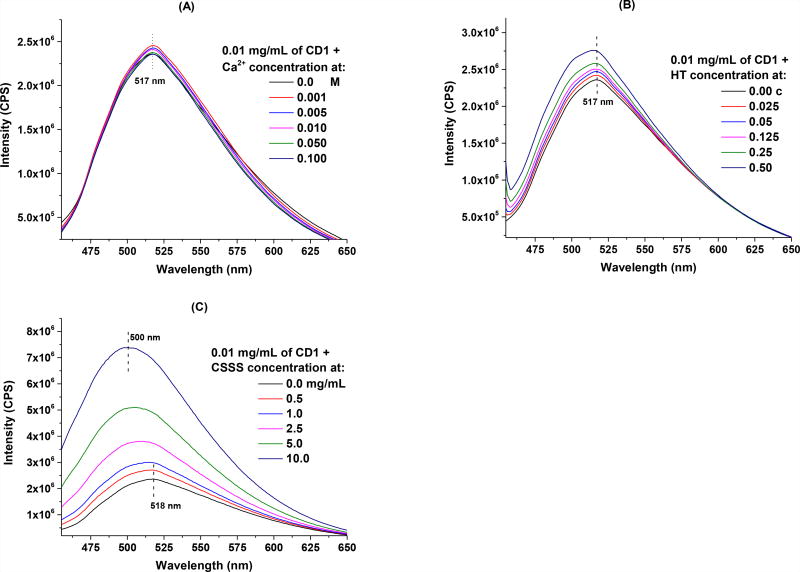
Bone fluorescence after systemic larva delivery of CD1 is significantly above the background fluorescence given by unbound circulating CD1 (Fig. 4B).18 One possibility for the above-background fluorescence in bones is that CD1 fluorescence is enhanced by the bone microenvironment. The bone microenvironment primarily consists of extracellular matrix containing large amounts of calcium in the form of hydroxyapatite (HT),41 a key mineral that can interact with the negative charges on the surface of CD1. In fact, according to the zeta potential, CD1 is significantly more negative than the other two C-dots (CD2 and CD3; Fig. SI 4), indicating abundant negative-charge carrying groups on the surface of CD1 (according to published titration study, there are about 5.8 mmol of carboxyl groups per each gram of CD142). Considering the strong affinity of these groups towards the calcium ions,43 this might be one reason that CD1 present such high affinity towards bones. To explore this possibility, we analyzed the fluorescent behavior of CD1 when mixed with calcium ions of various concentrations (0.001 – 0.1 M) in aqueous solution (Fig. 5A), or HT nanoparticles in an aqueous dispersion (Fig. 5B). Compared to free CD1, the presence of calcium ions did not change significantly the fluorescence behavior of CD1: all of the spectra presented a maximum emission peak centered at 517 nm, and only slight increase in intensity was observed (less than 5%) (Fig. 5A). It is worth noting, however, that no precipitates or cloudiness were observed even after one week of mixing, even though it is well known that the binding of carboxylic groups to calcium ions causes solute precipitation. With respect to HT, the fluorescence in the CD1 and HT mixture increased slightly as the concentrations of HT increased (Fig. 5B). However, HT solution itself is highly fluorescent and has a maximum emission at 518 nm (Fig. SI 5A), thus the increase in CD1 fluorescence after incubating with HT is more likely an overlapping effect of the individual spectra (Fig. SI 5B), rather than the interaction of CD1 and HT. Also, no precipitates or cloudiness were observed after one week, thus, it is less likely that the high affinity and specificity was due to the interaction of CD1 with HT. Together, these results suggest that CD1 fluorescence is not enhanced by the presence of calcium ions or HT.
Figure 5.
Mechanistic study of CD1 and bone interaction: fluorescence spectroscopy of 0.01 mg/mL of CD1 in the presence of various concentrations of (A): Ca2+; (B): hydroxyapatite (HT), “c” is the original concentration of commercially purchased hydroxyapatite nanoparticle aqueous dispersion (5 – 10% w/v); and (C): chondroitin sulfate sodium salt (CSSS).
During embryo development, cartilage mineralization gives rise to most of the vertebrate bones.44 Cartilage contains large amounts of chondroitin sulfate, which could potentially trap circulating CD1 as the tissue mineralizes. To explore this possibility, we investigated the interaction of CD1 with chondroitin sulfate, an important structural component of cartilage that has been widely used for the treatment of osteoarthritis.45, 46 In the experiment, CD1 (0.01 mg/mL) was mixed with various concentrations of chondroitin sulfate sodium salt (CSSS) and incubated at ambient temperature for 20 h before their fluorescence spectroscopy was measured. The fluorescence intensity of CD1 was significantly increased in the presence of CSSS and a large blue shift (18 nm) in the maximum emission spectra was observed (Fig. 5C). However, considering that CSSS solution is highly fluorescent with a maximum emission at 493.5 nm (Fig. SI 5C), the observed increase in fluorescence intensity and the wavelength shift in maximum emission are likely due to the simple fluorescence contribution of CSSS, rather than the intrinsic change in CD1. Indeed, we were able to obtain similar spectra to that shown in Fig. 5C by overlapping individual spectra from both CD1 and CSSS (Fig. SI 5D). Again, we did not observe any precipitates or cloudiness in the mixture after one week of incubation. Given the overlap in maximum emissions, we are unable to conclude whether CD1 interacts with CSSS in a way that changes its emission spectra.
3.5. Chemical modification of CD1 does not interfere with its bone binding affinity and specificity in vivo
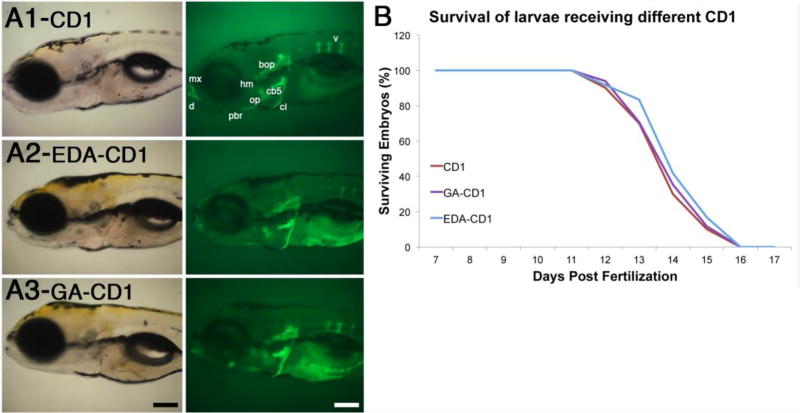
The high binding affinity and specificity of CD1 towards bones make them promising materials for bone-specific applications. CD1 have extensive carboxyl moieties at their surface,42 which may promote bone binding but also limit the type of cargo chemicals that can be delivered to the tissue. To function as effective bioimaging agents or drug delivery platforms, one may require to modify CD1’s surfaces to accommodate drug molecules or bio agents. In such occasions, it is important to know whether the bone binding properties are retained after surface modifications. We modified the surface of CD1 in two ways to increase bone binding affinity as well as cargo carrier capacity. To increase bone-binding affinity we attached glutamic acid, and to expand the repertoire of molecules that can be attached to CD1 we conjugated EDA that provides amine groups (Fig. 2A). Compared to controls, neither modification significantly changed CD1 deposition in calcified bones (Fig. 6A): abdominal injection of 20 ng of EDA-CD1 or 25 ng of GA-CD1 in 6-day old larvae resulted in strong and highly specific bone fluorescence 2 days after injection. In all conditions the number of vertebrae labeled by the CD1 preparation was the same, although in some cases the vertebrae appeared thinner. We attributed these differences to the natural variation between individual larvae in our population,47 as all types of individuals were observed in all conditions tested. Together, these results suggest that carboxyl or amine group surface modifications do not affect CD1 binding affinity and specificity for bones.
Figure 6.
Chemical modification of CD1 does not significantly affect their bone binding properties. (A) Transmitted and fluorescent images of 8-day old larvae injected at 6 days post fertilization with CD1, EDA-CD1 or GA-CD1. Name of bones are only indicated in CD1 image, as described in Fig. 4, but are present in all conditions. Scale bar is 100 microns. (B) Survival curves of larvae injected with CD1, EDA-CD1, and GA-CD1. All conditions have similar survival rates (n≥25 embryos per condition).
Finally, we tested whether these modifications altered the toxicity of CD1, using our larvae survival assay. We analyzed loss of viability in 6-day old larvae after injecting 20 ng of EDA-CD1, 25 ng of GA-CD1, or 25 ng of unmodified CD1 (control). No loss in larvae viability was observed in the first 5 days post-injection (Fig. 6B). Loss of viability was observed in control and experimental conditions starting at day 12-post fertilization, and continuing until day 16 (Fig. 6B). The similarity in the survival of control and experimental groups suggest that modified CD1 are non-toxic, at least for the developmental stages tested. This finding supports the potential for CD1 to be used as carriers for bone-specific applications including bioimaging and drug delivery.
4. CONCLUSION
In this study, several C-dots and their conjugates were synthesized, characterized and studied in the context of their bone binding properties in vivo: C-dots synthesized using “top-down” approaches bind to bones (CD1), while none of the C-dots synthesized using “bottom-up” approaches showed bone-binding characteristics (CD2, CD3). CD1 are fluorescent, and their fluorescence appears to intensify when binding to bones in vivo.18 This fluorescence intensification, however, is not stimulated by calcium, hydroxyapatite or chondroitin sulfate in vitro. While the nature of CD1 binding to bones remains unknown, it is clear that this binding and fluorescence is not affected by chemical modification of the CD1 surface. Retention of strong fluorescence signal is important for the developing of CD1 as imaging media for novel fluorescence detection methods, whereas retention of bone-binding properties is important for developing CD1 as bone-specific drug delivery platform. Most of the current pharmaceutical agents suffer from severe secondary side effects due to systemic delivery,48 which could potentially be avoided by using tissue-specific drug delivery systems such as CD1 is for bone. As such, we expect efforts on the development of novel bone targeting C-dots biomaterials will potentially benefit the treatment of skeletal diseases such as osteoporosis.
Supplementary Material
Acknowledgments
R.M.L. gratefully acknowledges the support from King Abdulaziz University, Saudi Arabia. I.S. and R.M.L. gratefully acknowledge the support of the University of Miami, USA, and the National Institute of Health grant R21 AR072226. E.H.M. work was partially supported by the University of Miami REU summer program sponsored by the National Science Foundation award 1560103.
Footnotes
COMPETING FINANCIAL INTERESTS
The authors declare no competing financial interests.
References
- 1.Wright NC, Looker AC, Saag KG, Curtis JR, Delzell ES, Randall S, Dawson-Hughes B. The recent prevalence of osteoporosis and low bone mass in the united states based on bone mineral density at the femoral neck or lumbar spine. J. Bone Miner. Res. 2014;29:2520–2526. doi: 10.1002/jbmr.2269. [DOI] [PMC free article] [PubMed] [Google Scholar]
- 2.Marie PJ, Kassem M. Osteoblasts in osteoporosis: past, emerging, and future anabolic targets. Eur. J. Endocrinol. 2011;165:1–10. doi: 10.1530/EJE-11-0132. [DOI] [PubMed] [Google Scholar]
- 3.Cnudde V, Masschaele B, De Cock HEV, Olstad K, Vlaminck L, Vlassenbroeck J, Dierick M, Witte YD, Van Hoorebeke L, Jacobs P. Virtual histology by means of high-resolution X-ray CT. J. Microsc. 2008;232:476–485. doi: 10.1111/j.1365-2818.2008.02142.x. [DOI] [PubMed] [Google Scholar]
- 4.Lichtman JW, Conchello JA. Fluorescence microscopy. Nat. Methods. 2005;2:910–919. doi: 10.1038/nmeth817. [DOI] [PubMed] [Google Scholar]
- 5.Cann CE, Roe EB, Sanchez SD, Arnaud CD. PTH effects in the femur: Envelope-specific responses by 3DQCT in postmenopausal women. J. Bone Miner. Res. 1999;14:S137–S137. [Google Scholar]
- 6.Neer RM, Arnaud CD, Zanchetta JR, Prince R, Gaich GA, Reginster JY, Hodsman AB, Eriksen EF, Ish-Shalom S, Genant HK, Wang O, Mitlak BH. Effect of parathyroid hormone (1–34) on fractures and bone mineral density in postmenopausal women with osteoporosis. N. Engl. J. Med. 2001;344:1434–41. doi: 10.1056/NEJM200105103441904. [DOI] [PubMed] [Google Scholar]
- 7.Enders GH. Wnt therapy for bone loss: golden goose or Trojan horse? J. Clin. Invest. 2009;119:758–760. doi: 10.1172/JCI38973. [DOI] [PMC free article] [PubMed] [Google Scholar]
- 8.Poon B, Kha T, Tran S, Dass CR. Bone morphogenetic protein-2 and bone therapy: successes and pitfalls. J. Pharm. Pharmacol. 2016;68:139–147. doi: 10.1111/jphp.12506. [DOI] [PubMed] [Google Scholar]
- 9.Hirabayashi H, Fujisaki J. Bone-specific drug delivery systems - approaches via chemical modification of bone-seeking agents. Clin. Pharmacokinet. 2003;42:1319–1330. doi: 10.2165/00003088-200342150-00002. [DOI] [PubMed] [Google Scholar]
- 10.Sun YP, Zhou B, Lin Y, Wang W, Fernando KAS, Pathak P, Meziani MJ, Harruff BA, Wang X, Wang HF, Luo PJG, Yang H, Kose ME, Chen BL, Veca LM, Xie SY. Quantum-sized carbon dots for bright and colorful photoluminescence. J. Am. Chem. Soc. 2006;128:7756–7757. doi: 10.1021/ja062677d. [DOI] [PubMed] [Google Scholar]
- 11.Xu XY, Ray R, Gu YL, Ploehn HJ, Gearheart L, Raker K, Scrivens WA. Electrophoretic analysis and purification of fluorescent single-walled carbon nanotube fragments. J. Am. Chem. Soc. 2004;126:12736–12737. doi: 10.1021/ja040082h. [DOI] [PubMed] [Google Scholar]
- 12.Baker SN, Baker GA. Luminescent carbon nanodots: emergent nanolights. Angew. Chem. Int. Ed. 2010;49:6726–6744. doi: 10.1002/anie.200906623. [DOI] [PubMed] [Google Scholar]
- 13.Yang ST, Wang X, Wang HF, Lu FS, Luo PJG, Cao L, Meziani MJ, Liu JH, Liu YF, Chen M, Huang YP, Sun YP. Carbon dots as nontoxic and high-performance fluorescence imaging agents. J. Phys. Chem. C. 2009;113:18110–18114. doi: 10.1021/jp9085969. [DOI] [PMC free article] [PubMed] [Google Scholar]
- 14.Yang ST, Cao L, Luo PGJ, Lu FS, Wang X, Wang HF, Meziani MJ, Liu YF, Qi G, Sun YP. Carbon dots for optical imaging in vivo. J. Am. Chem. Soc. 2009;131:11308–11309. doi: 10.1021/ja904843x. [DOI] [PMC free article] [PubMed] [Google Scholar]
- 15.Peng Z, Han X, Li S, Al-Youbi AO, Bashammakh AS, El-Shahawi MS, Leblanc RM. Carbon dots: biomacromolecule interaction, bioimaging and nanomedicine. Coord. Chem. Rev. 2017;343:256–277. [Google Scholar]
- 16.Huang YF, Zhou X, Zhou R, Zhang H, Kang KB, Zhao M, Peng Y, Wang Q, Zhang HL, Qiu WY. One-pot synthesis of highly luminescent carbon quantum dots and their nontoxic ingestion by zebrafish for in vivo imaging. Chem. Eur. J. 2014;20:5640–5648. doi: 10.1002/chem.201400011. [DOI] [PubMed] [Google Scholar]
- 17.Kang YF, Li YH, Fang YW, Xu Y, Wei XM, Yin XB. Carbon quantum dots for zebrafish fluorescence imaging. Sci. Rep. 2015;5 doi: 10.1038/srep11835. [DOI] [PMC free article] [PubMed] [Google Scholar]
- 18.Li S, Skromne I, Peng Z, Dallman J, Al-Youbi AO, Bashammakh AS, El-Shahawi MS, Leblanc RM. "Dark" carbon dots specifically "light-up" calcified zebrafish bones. J. Mater. Chem. B. 2016;4:7398–7405. doi: 10.1039/c6tb02241c. [DOI] [PubMed] [Google Scholar]
- 19.Li S, Peng Z, Dallman J, Baker J, Othman AM, Blackwelder PL, Leblanc RM. Crossing the blood-brain barrier with transferrin conjugated carbon dots: a zebrafish model study. Colloids Surf. B Biointerfaces. 2016;145:251–6. doi: 10.1016/j.colsurfb.2016.05.007. [DOI] [PubMed] [Google Scholar]
- 20.Saxena M, Sonkar SK, Sarkar S. Water soluble nanocarbons arrest the growth of mosquitoes. RSC Adv. 2013;3:22504–22508. [Google Scholar]
- 21.He H, Wang XJ, Feng ZZ, Cheng TT, Sun X, Sun YW, Xia YQ, Wang SJ, Wang JY, Zhang XD. Rapid microwave-assisted synthesis of ultra-bright fluorescent carbon dots for live cell staining, cell-specific targeting and in vivo imaging. J. Mater. Chem. B. 2015;3:4786–4789. doi: 10.1039/c5tb00570a. [DOI] [PubMed] [Google Scholar]
- 22.Tao HQ, Yang K, Ma Z, Wan JM, Zhang YJ, Kang ZH, Liu Z. In vivo NIR fluorescence imaging, biodistribution, and toxicology of photoluminescent carbon dots produced from carbon nanotubes and graphite. Small. 2012;8:281–290. doi: 10.1002/smll.201101706. [DOI] [PubMed] [Google Scholar]
- 23.Zheng M, Ruan SB, Liu S, Sun TT, Qu D, Zhao HF, Xie ZG, Gao HL, Jing XB, Sun ZC. Self-targeting fluorescent carbon dots for diagnosis of brain cancer cells. ACS Nano. 2015;9:11455–11461. doi: 10.1021/acsnano.5b05575. [DOI] [PubMed] [Google Scholar]
- 24.Krishna AS, Radhakumary C, Antony M, Sreenivasan K. Functionalized carbon dots enable simultaneous bone crack detection and drug deposition. J. Mater. Chem. B. 2014;2:8626–8632. doi: 10.1039/c4tb00918e. [DOI] [PubMed] [Google Scholar]
- 25.Krishna AS, Radhakumary C, Sreenivasan K. In vitro detection of calcium in bone by modified carbon dots. Analyst. 2013;138:7107–7111. doi: 10.1039/c3an01239e. [DOI] [PubMed] [Google Scholar]
- 26.Li SH, Wang LY, Chusuei CC, Suarez VM, Blackwelder PL, Micic M, Orbulescu J, Leblanc RM. Nontoxic carbon dots potently inhibit human insulin fibrillation. Chem. Mater. 2015;27:1764–1771. [Google Scholar]
- 27.Li S, Amat D, Peng Z, Vanni S, Raskin S, De Angulo G, Othman AM, Graham RM, Leblanc RM. Transferrin conjugated nontoxic carbon dots for doxorubicin delivery to target pediatric brain tumor cells. Nanoscale. 2016;8:16662–16669. doi: 10.1039/c6nr05055g. [DOI] [PubMed] [Google Scholar]
- 28.Zhou Y, Desserre A, Sharma SK, Li S, Marksberry MH, Chusuei C, Blackwelder PL, Leblanc RM. Gel-like carbon dots: characterization and their potential applications. ChemPhysChem. 2017;18:890–897. doi: 10.1002/cphc.201700038. [DOI] [PubMed] [Google Scholar]
- 29.Wang F, Pang SP, Wang L, Li Q, Kreiter M, Liu CY. One-step synthesis of highly luminescent carbon dots in noncoordinating solvents. Chem. Mater. 2010;22:4528–4530. [Google Scholar]
- 30.Westerfield M. The zebrafish book: a guide for the laboratory use of zebrafish (Brachydanio rerio) University of Oregon Press; Eugene, OR: 1995. [Google Scholar]
- 31.Li HT, Kang ZH, Liu Y, Lee ST. Carbon nanodots: synthesis, properties and applications. J. Mater. Chem. 2012;22:24230–24253. [Google Scholar]
- 32.Li SH, Peng ZL, Leblanc RM. Method to determine protein concentration in the protein nanoparticle conjugates aqueous solution using circular dichroism spectroscopy. Anal. Chem. 2015;87:6455–6459. doi: 10.1021/acs.analchem.5b01451. [DOI] [PubMed] [Google Scholar]
- 33.Nair S, Li W, Cornell R, Schilling TF. Requirements for Endothelin type-A receptors and Endothelin-1 signaling in the facial ectoderm for the patterning of skeletogenic neural crest cells in zebrafish. Development. 2007;134:335–345. doi: 10.1242/dev.02704. [DOI] [PubMed] [Google Scholar]
- 34.Gribble SL, Nikolaus OB, Dorsky RI. Regulation and function of Dbx genes in the zebrafish spinal cord. Dev. Dyn. 2007;236:3472–3483. doi: 10.1002/dvdy.21367. [DOI] [PMC free article] [PubMed] [Google Scholar]
- 35.Mackay EW, Apschner A, Schulte-Merker S. A bone to pick with zebrafish. BoneKEy Rep. 2013;2 doi: 10.1038/bonekey.2013.179. [DOI] [PMC free article] [PubMed] [Google Scholar]
- 36.Schilling TF, Kimmel CB. Segment and cell type lineage restrictions during pharyngeal arch development in the zebrafish embryo. Development. 1994;120:483–494. doi: 10.1242/dev.120.3.483. [DOI] [PubMed] [Google Scholar]
- 37.Lieschke GJ, Currie PD. Animal models of human disease: zebrafish swim into view. Nat. Rev. Genet. 2007;8:353–367. doi: 10.1038/nrg2091. [DOI] [PubMed] [Google Scholar]
- 38.Zhu SJ, Meng QN, Wang L, Zhang JH, Song YB, Jin H, Zhang K, Sun HC, Wang HY, Yang B. Highly photoluminescent carbon dots for multicolor patterning, sensors, and bioimaging. Angew. Chem. Int. Ed. 2013;52:3953–3957. doi: 10.1002/anie.201300519. [DOI] [PubMed] [Google Scholar]
- 39.Zhai XY, Zhang P, Liu CJ, Bai T, Li WC, Dai LM, Liu WG. Highly luminescent carbon nanodots by microwave-assisted pyrolysis. Chem. Commun. 2012;48:7955–7957. doi: 10.1039/c2cc33869f. [DOI] [PubMed] [Google Scholar]
- 40.Sajadi S. Metal ion-binding properties of L-glutamic acid and L-aspartic acid, a comparative investigation. Natural Science. 2010;2:85–90. [Google Scholar]
- 41.Clarke B. Normal bone anatomy and physiology. Clin J Am Soc Nephro. 2008;3:S131–S139. doi: 10.2215/CJN.04151206. [DOI] [PMC free article] [PubMed] [Google Scholar]
- 42.Peng Z, Li S, Han X, Al-Youbi AO, Bashammakh AS, El-Shahawi MS, Leblanc RM. Determination of the composition, encapsulation efficiency and loading capacity in protein drug delivery systems using circular dichroism spectroscopy. Anal. Chim. Acta. 2016;937:113–118. doi: 10.1016/j.aca.2016.08.014. [DOI] [PubMed] [Google Scholar]
- 43.Bala T, Prasad BLV, Sastry M, Kahaly MU, Waghmare UV. Interaction of different metal ions with carboxylic acid group: A quantitative study. J. Phys. Chem. A. 2007;111:6183–6190. doi: 10.1021/jp067906x. [DOI] [PubMed] [Google Scholar]
- 44.Mackie EJ, Ahmed YA, Tatarczuch L, Chen KS, Mirams M. Endochondral ossification: How cartilage is converted into bone in the developing skeleton. Int J Biochem Cell B. 2008;40:46–62. doi: 10.1016/j.biocel.2007.06.009. [DOI] [PubMed] [Google Scholar]
- 45.Baeurle SA, Kiselev MG, Makarova ES, Nogovitsin EA. Effect of the counterion behavior on the frictional-compressive properties of chondroitin sulfate solutions. Polymer. 2009;50:1805–1813. [Google Scholar]
- 46.Henrotin Y, Mathy M, Sanchez C, Lambert C. Chondroitin sulfate in the treatment of osteoarthritis: from in vitro studies to clinical recommendations. Ther Adv Musculoskelet Dis. 2010;2:335–48. doi: 10.1177/1759720X10383076. [DOI] [PMC free article] [PubMed] [Google Scholar]
- 47.Wang RL, Bencic DC, Garcia-Reyero N, Perkins EJ, Villeneuve DL, Ankley GT. Natural variation in fish transcriptomes: comparative analysis of the fathead minnow (pimephales promelas) and zebrafish (danio rerio) PLoS One. 2015;10 doi: 10.1371/journal.pone.0114178. [DOI] [PMC free article] [PubMed] [Google Scholar]
- 48.Appelman-Dijkstra NM, Papapoulos SE. Novel approaches to the treatment of osteoporosis. Best Pract. Res. Clin. Endocrinol. Metab. 2014;28:843–857. doi: 10.1016/j.beem.2014.07.003. [DOI] [PubMed] [Google Scholar]
Associated Data
This section collects any data citations, data availability statements, or supplementary materials included in this article.


