Abstract
Self-assembly of HIV-1 integrase (IN) in solution has been studied previously by time-resolved fluorescence, using tryptophan anisotropy decay. This approach provides information on the size of macromolecules via the determination of rotational correlation times (θ). We have shown that, at submicromolar concentration, IN is characterized by a long rotational correlation time (θ20°C = 90–100 ns) corresponding to a high-order oligomeric form, likely a tetramer. In the present work, we investigated the self-assembly properties of the DNA-bound IN by using three independent fluorophores. Under enzymatic assay conditions (10−7 M IN, 2 × 10⁻⁸ M DNA), using either fluorescein-labeled or fluorescent guanosine analog-containing oligonucleotides that mimic a viral end long terminal repeat sequence, we found that the DNA–IN complex was characterized by shorter θ20°C values of 15.5–19.5 and 23–27 ns, calculated from experiments performed at 25°C and 37°C, respectively. These results were confirmed by monitoring the Trp anisotropy decay as a function of the DNA substrate concentration: the θ of IN shifted from 90–100 ns to lower values (<30 ns) upon increasing the DNA concentration. Again, the normalized θ20°C values were significantly higher when monitored at 37°C as compared with 25°C. These results indicate that upon binding the viral DNA end, the multimeric enzyme undergoes a dissociation, most likely into a homogenous monomeric form at 25°C and into a monomer–dimer equilibrium at 37°C.
Integration of a DNA copy of the HIV-1 genome into the host genome is a critical step of the retrovirus life cycle. Integration is a multistep process including 3′ processing, strand transfer, and DNA repair. Integrase (IN) is responsible for 3′ processing and strand transfer and is sufficient to catalyze these two reactions in vitro, using short-length oligonucleotides (ODNs) that mimic the viral end long terminal repeat sequences. The repair step most likely is performed by a host system. IN is a member of the superfamily of polynucleotidyl transferases, and its catalytic core domain contains a triad of acidic residues that constitute the so-called D,D-35-E motif. This motif is strictly required for catalysis (1, 2) and is involved in the coordination of the metal cation cofactor (3, 4). Catalysis can be performed efficiently in vitro by using either Mn2+ or Mg2+, but several investigations suggest that these two divalent cations have different effects on the reaction specificity. Specific protein–DNA contacts occur preferentially in the presence of Mg2+ (5), and more nonspecific cleavage is detected in the presence of Mn2+ (6). The transfer pattern on the target DNA also depends on the nature of the cation (7). Consequently, the efficiency of inhibitors can be different by using either Mg2+ or Mn2+ in assays (8). In each case, the Mg2+-dependent activity may be more reliable because it is more physiologically relevant.
Specific recognition between IN and the substrate viral DNA is a prerequisite for the cleavage of two nucleotides at the 3′ end of the viral DNA. The catalytic core domain establishes specific contacts with the viral DNA, and it has been determined that the terminal 13-base region of the long terminal repeat plays a significant role for Mg2+-dependent processing in terms of specificity (5, 9). The C-terminal domain also mediates viral DNA–IN interactions, but in a nonspecific fashion, and more likely contributes to complex stabilization (10–12). Furthermore, it is strongly believed that self-association of IN plays a key role in governing the enzyme function (13–16). Recently, we have shown that the capability of IN to use Mg2+ is related to the protein self-association in solution (7, 17). When purified in the presence of detergent, IN has been found to be monomeric at submicromolar concentration and active only in the presence of Mn2+. In contrast, when purified in the absence of detergent and in the presence of zinc, two conditions that favor the multimerization process (7, 15–17), IN has been found to be mainly tetrameric and highly active in the presence of Mg2+.
In this work, we investigated the oligomeric state of the Mg2+-competent IN bound to the viral DNA under conditions typically used in in vitro enzymatic assays, i.e., 100–200 nM IN/20 nM substrate DNA. Time-resolved fluorescence anisotropy (TFA) is suitable for such a study because its sensitivity allows detection of low protein or DNA concentrations, and the rotational correlation time (θ) as determined by TFA is directly related to the apparent volume of macromolecules or complexes. A wealth of information about the size and the shape of macromolecules can be provided by anisotropy (or polarization) measurements (see ref. 18 and references therein). The anisotropy measurements are based on the principle of photoselective excitation of fluorophores by a polarized light leading to a subsequent polarized emission (high anisotropy). This approach can provide information about the displacement of the fluorophore between the times of photon absorption and emission. In fact, some events such as rotational diffusion or flexibility of the fluorophore represent a major cause of the depolarization of light (low anisotropy). In addition, the time-resolved data (obtained by measuring the anisotropy values after the pulsed excitation) provide quantitative information on the rotational dynamics of the fluorophore via the θ parameter. Therefore, the analysis of the anisotropy decay permits the determination of the volume of the hydrated particle and then is particularly well suited for the study of self-association properties of biomolecules. We used both fluorescein-labeled and fluorescent guanosine analog-containing ODNs to determine the oligomeric state of the substrate-bound IN. Results were confirmed by using Trp fluorescence. The different approaches, each based on a different fluorophore, indicate that the tetrameric form of IN in solution is completely converted to a monomeric form when bound to the viral-end DNA at 25°C and a monomer–dimer mixture at 37°C. This finding, taken together with our previous study, strongly suggests that (i) the self-association of IN plays a key role for Mg2+-dependent DNA binding, (ii) once bound to DNA, IN undergoes tetramer–dimer–monomer transitions, and (iii) under conditions of in vitro assays at 37°C, IN is characterized by a monomer–dimer equilibrium when bound to the viral DNA end.
Materials and Methods
Oligonucleotides.
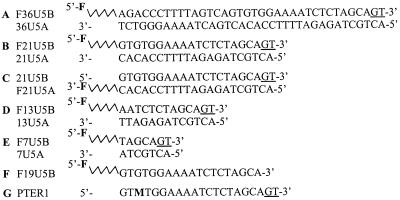
The HPLC-purified unlabeled and fluorescein-labeled synthetic ODNs (Fig. 1 A–F) were purchased from Cybergene (Evry, France). Incorporation of the 3-methyl-8-(2-deoxy-β-d-ribofuranosyl) isoxanthopterin (3MI) probe into ODN and fluorescence properties of the PTER1 ODN (Fig. 1G) have been described (19, 20). Double-stranded ODNs were obtained by mixing equimolar amounts of complementary strands in a 20 mM Tris⋅HCl buffer (pH 7.2) containing 100 mM NaCl. The mixture was heated to 85°C for 5 min, and annealing was allowed by slow cooling to room temperature.
Figure 1.
Oligonucleotide sequences. (A–E) Fluorescein-labeled double-stranded ODNs: 36-mer (A), 21-mer (B and C), 13-mer (D), and 7-mer (E). (F) Fluorescein-labeled single-stranded 19-mer. The preprocessed, double-stranded DNA was prepared by annealing equimolar amounts of complementary strands F19U5B and 21U5A. F designates the fluorescein probe. (G) 21-mer single-stranded ODN with 3MI (M) substituted for G. The 3MI-containing duplex was obtained by annealing PTER1 and 21U5A. Terminal bases removed by IN during the 3′ processing reaction are underlined.
IN and Activity Assay.
HIV-1 IN was purified as described previously under native conditions (7). Briefly, His-tagged IN containing a thrombin cleavage site adjacent to the His tag was overexpressed in Escherichia coli BL21(DE3). The purification was based on a batch procedure by using Ni-NTA agarose beads (Amersham Pharmacia). After several washing steps with increasing concentrations of imidazole (from 5 to 100 mM), His-tagged IN was eluted with a 20 mM Tris⋅HCl buffer (pH 8) containing 1 M NaCl, 4 mM 2-mercaptoethanol (buffer A), 50 μM ZnSO4, and 1 M imidazole. The His tag was removed by using biotinylated thrombin during a dialysis step against buffer A. After removal of thrombin by streptavidin-agarose magnetic beads (Novagen), a final dialysis was performed against buffer A containing 20% (vol/vol) glycerol. IN activity was assayed as reported (7).
TFA Experiments.
TFA parameters were obtained from the two polarized fluorescence decays Ivv(t) and Ivh(t) by using a time-correlated, single-photon counting technique. The instrumentation setup was similar to that described previously (17), except (i) a time-correlated single-photon counting SPC-430 card (Becker–Hickl, Berlin, Germany) was used for the acquisition and (ii) the time scaling was 11 ps per channel, and 4,096 channels were used. The excitation light-pulse source was a Ti-sapphire subpicosecond laser (Tsunami; Spectra-Physics) associated with either a third harmonic generator tuned at 299 nm for Trp fluorescence or with a second harmonic generator tuned at 370 nm and 492 nm for 3MI and fluorescein fluorescences, respectively. The two polarized components of the fluorescence decay were collected until the total count of the Ivv component reached 12–16 millions for Trp fluorescence or 25–35 millions for either the 3MI or fluorescein fluorescence emissions. The data were analyzed by the quantified maximum entropy method, which displays the θ distribution (21). The hydrated molecular volume (V) of a globular macromolecule is related to θ via the Perrin equation (θ = ηV/kT, where T is the temperature, η is the viscosity, and k is the Boltzmann constant). Unless otherwise specified, the fluorescence assay included 20 mM Tris⋅HCl, pH 7.2, 5 mM MgCl2, 50 mM NaCl, 20 nM ODN, and 100 nM IN in a volume of 100 μl.
Results
In our previous Trp fluorescence polarization study, we found that, in the presence of Mg2+ and in the absence of DNA, a submicromolar, detergent-solubilized IN preparation was characterized by a θ of 16 ns (17). This value is consistent with one expected for a monomeric form of IN (32 kDa). In contrast, when purified without any detergent (7), IN displayed a longer θ (90–100 ns), indicating a high-order multimeric organization. The same protein preparation (detergent-free) was used in the present work. Double-stranded ODNs of different sizes that mimic the viral DNA U5 end (Fig. 1) were used to measure the θ of the IN–DNA complex.
Tryptophan Fluorescence Measurements.
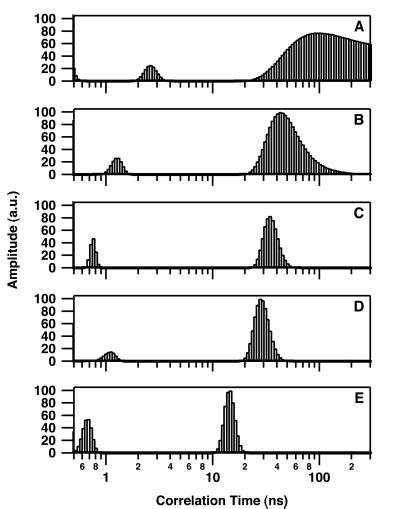
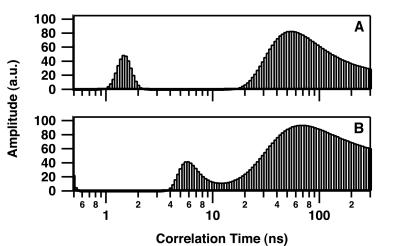
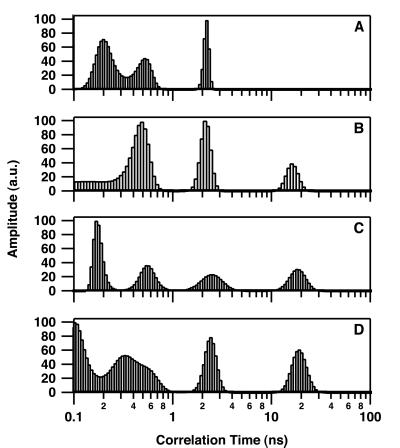
Fig. 2 shows the resulting changes in θ of intrinsic Trp at 25°C after addition of DNA to give concentrations of 0, 0.5, 0.85, 1.5, and 3.0 μM. Short θ values (<3 ns) are related to segmental motion or flexibility of Trp residues whereas longer θ values are related to the overall tumbling motion of the entire protein. Only the long θ values that provide information on the hydrated volume have been considered further in this study. In the absence of DNA, IN was characterized by a rather broad distribution of the long θ (maximum of about 90 ns) (Fig. 2A), indicating that the major form of IN in solution was a multimer according to our previous study (7). The distribution pattern above 150 ns suggests the presence of some aggregated forms. In the series represented in Fig. 2, the concentration of IN used was 100 nM; however, results were similar in the range of 50–200 nM (at concentrations above 200 nM, IN was characterized mainly by θ values higher than 150 ns). Increasing the 21-mer double-stranded ODN concentration to 3 μM induced a progressive shift from a large θ value to a smaller one (14 ns) (Fig. 2E), consistent with a monomer (similar observations were made by using either labeled or unlabeled ODN). Note that the intermediary distributions (Fig. 2 B–D) do not necessarily indicate that intermediary multimeric states such as dimers are DNA-bound. Because the Trp fluorescence is monitored in these experiments, the presence of intermediary distributions also can be interpreted by the existence of mixtures of monomeric (DNA-bound IN) and tetrameric (free IN) forms (17). Additional measurements done under conditions of weak DNA binding (see below), i.e., in the presence of 200 mM NaCl (Fig. 3A) or with a 7-mer double-stranded ODN (Fig. 3B), reveal only a slight shift in the θ. Note that the presence of a θ value centered about 6 ns in Fig. 3B was reproducible and may represent an average between a short θ (<3 ns) that is usually present (see Fig. 2 and 3A) and a low-populated θ centered in the 14- to 16-ns range. As suggested by our previous simulation analyses (17), the quantified maximum entropy method cannot recover the individual peaks in this case for statistics reasons. Therefore, it is not excluded that excess of 7-mer ODN dissociates a small part of the multimeric IN.
Figure 2.
Rotational correlation time of IN as a function of the substrate DNA concentration. Distributions were determined by monitoring the intrinsic Trp fluorescence at 25°C. IN concentration was 100 nM. 21-mer double-stranded ODN concentration was 0 μM (A), 0.5 μM (B), 0.85 μM (C), 1.5 μM (D), and 3 μM (E). Correlation time measurements were performed as described in Materials and Methods. Excitation and emission wavelengths were 299 and 350 nm (Δλ = 15 nm), respectively. The lifetime distribution was not influenced by the DNA binding: τ1 = 0.3 ± 0.1 ns (25%); τ2 = 0.7 ± 0.1 ns (25%); τ3 = 1.75 ± 0.05 ns (35%); τ4 = 3.9 ± 0.1 ns (15%).
Figure 3.
Rotational correlation time of IN under highly stringent conditions for DNA binding. Correlation time measurements were performed as described in the legend for Fig. 2. (A) IN (100 nM) in the presence of 3 μM 21-mer double-stranded ODN and 200 mM NaCl. (B) IN (100 nM) in the presence of 3 μM 7-mer double-stranded ODN.
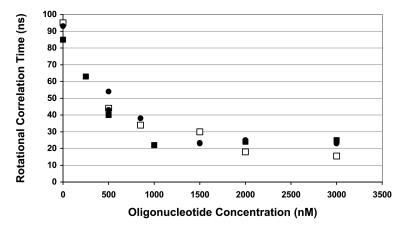
The experiment shown in Fig. 2 was repeated at 37°C. Because the tumbling motion is influenced not only by the hydrated molecular volume but also by temperature and viscosity factors (according to the Perrin equation), all of the θ values were normalized at 20°C. After such a normalization, the θ values are dependent only on the size of the macromolecule. The normalized values (θ20°C) obtained at two different temperatures and IN concentrations are summarized in the plot of Fig. 4. In the absence of DNA, both 100 and 200 nM IN preparations displayed a well defined, long θ distribution at 37°C, the maximum of which was centered about 60–65 ns (not shown). This result correlates well with that obtained in our previous work (17), and the calculated θ20°C value (86–93 ns) is compatible with a tetrameric form. The narrower distribution found at 37°C compared with 25°C suggests that the solution is more homogenous at higher temperatures. Again, the long θ was shortened by increasing the DNA concentration. Clearly, after DNA binding, the high-multimeric form dissociates to a lower oligomeric state to reach a plateau that corresponds to θ20°C values in the 15- to 25-ns range. In conditions of DNA saturation, the θ20°C values were higher in experiments done at 37°C (24 ± 2.4 ns) than at 25°C (16 ± 1.7 ns). This tendency has been confirmed by using extrinsically labeled fluorescein ODNs (see below). Furthermore, because the signal in these experiments was from intrinsic protein fluorescence, it is unclear whether the θ at the plateau corresponds to a stable IN–DNA complex or free protein, because the dissociation also could be due to transient complexes. To address this question, we performed TFA studies by using fluorescein-labeled DNA substrates.
Figure 4.
Normalized rotational correlation time of IN during the titration with the DNA substrate. IN concentration was 100 nM (squares) or 200 nM (circles). Temperature was 25°C (open symbols) or 37°C (filled symbols). The temperature of normalization was 20°C (see text). The ODN was double-stranded 21-mer. Because the results were similar using either labeled DNA (F21U5B/21U5A) or unlabeled DNA (21U5B/21U5A), the different data then were compiled. Relative errors are about 10%.
Determination of the θ of the IN–DNA Complex by Using Fluorescein-Labeled ODNs.
To minimize perturbation of the IN–DNA interaction, fluorescein was attached through a six-carbon linker to the opposite end from the processing site. Comparable 3′ processing and integration activities were detected by using either 21U5B/F21U5A or 21U5B/21U5A as a substrate (not shown). In the experiments represented in Fig. 5, DNA and IN concentrations were 20 nM and 100 nM, respectively, in a Tris buffer containing 5 mM MgCl2 (corresponding to activity assay conditions). Fig. 5A shows the θ distribution of the 21-mer duplex F21U5B/21U5A in solution at 25°C with no IN present. The overall motion of this fluorescein-labeled ODN displays a well defined peak centered at 2.1 ns. The independent rotation resulting from the fluorescein linker was evidenced by the presence of a large distribution in the short correlation time domain (<1 ns). Addition of IN to the duplex generated an additional correlation time centered at 14.5 ns (Fig. 5B). Similar results were obtained by using the 21-mer duplex ODN with the fluorescein attached on the opposite strand (21U5B/F21U5A) (data not shown). The 2-ns peak shown in Fig. 5B revealed the presence of free ODN in the solution, and saturation was not obtained even at 200 nM IN (data not shown). In the 50- to 200-nM range, no significant variation in the θ value was observed, showing that the long θ value does not depend strongly on the fractional saturation [which increases from 30% to 65% in this range of protein concentration, assuming a Kd value of ≈100 nM (22)]. The low θ obtained for the complex confirmed that IN undergoes a dissociation from the interaction with the ODN. Similar results were found with a 13-mer (θ = 14 ns; not shown) or a 36-mer ODN (θ = 17.5 ns; Fig. 5C), indicating that the oligomeric organization of the IN onto the DNA does not depend on the ODN length. Surprisingly, the θ values obtained for the different IN–DNA complexes were very similar to those obtained for the monomeric 32-kDa IN alone (θ = 16 ns), despite the relatively large molecular mass of DNA substrates (13-mer, 8.4 kDa; 21-mer, 13.6 kDa; 36-mer, 23.4 kDa). Geometrical considerations must be taken into account to explain this apparent paradox (see Discussion). Similar results also were seen between single-stranded ODNs as compared with double-stranded ODNs of similar lengths (not shown). Under similar conditions, the pattern of θ consistent with a DNA–IN complex was not seen with either a 7-mer or a 21-mer ODN in the presence of 200 mM NaCl (not shown). As shown in Fig. 5D for the 36-mer IN complex at 37°C, temperature did not dramatically influence the θ distribution (a similar result was found for the 21-mer IN complex). According to the Perrin equation, the different complexes then were characterized by a significantly longer, normalized θ (θ20°C = 24–27 ns) at 37°C than at 25°C (θ20°C = 15.5–19.5 ns). Because the acquisition time in TFA experiments is compatible with the enzymatic test conditions (1–1.5 h), one could expect a change in the oligomeric state of IN during the 3′ processing reaction at 37°C. In our experiments, no significant change of fluorescent parameters was observed between the beginning and the end of the acquisition. In addition, measurements of the θ parameter using the F21U5B/19U5A duplex that mimics the product of the 3′ processing reaction displayed no significant difference compared with the substrate F21U5B/21U5A mentioned above (data not shown).
Figure 5.
Correlation time distributions of the IN-DNA complex determined by monitoring fluorescein-labeled ODNs. (A) F21U5B/21U5A alone at 25°C. (B) F21U5B/21U5A in the presence of 100 nM IN at 25°C. (C) F36U5B/36U5A in the presence of 100 nM IN at 25°C. (D) F36U5B/36U5A in the presence of 100 nM IN at 37°C. Excitation and emission wavelengths were 492 and 530 nm, respectively. The lifetime distribution, as recovered by quantified maximum entropy method analysis, was not influenced by the protein binding: τ1 = 0.3 ± 0.1 ns (8%); τ2 = 1.8 ± 0.1 ns (16%); τ3 = 3.9 ± 0.1 ns (76%).
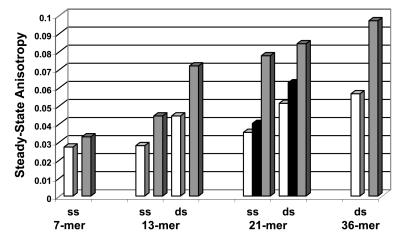
The calculation of steady-state anisotropy from time-dependent anisotropy decays (Fig. 6) confirmed that the interaction between IN and the 7-mer single strand was only marginal, in contrast to the one obtained with longer ODNs [double-stranded 7-mer ODN was not reported here because of the poor stability of such a short duplex in this condition of ODN chain concentration (<10−7 M)]. For longer ODNs, no significant difference was observed between single- and double-stranded ODNs. Interestingly, the steady-state anisotropies of 21-mer ODNs increased slightly upon addition of protein to a final concentration of 100 nM in the absence of Mg2+ (Fig. 6, solid bars) but increased more dramatically in the presence of 5 mM Mg2+. At relatively high ionic strength (200 mM NaCl as opposed to 50 mM), no significant change of the steady-state anisotropy was observed (data not shown).
Figure 6.
Steady-state anisotropies at 25°C of IN–DNA interaction with extrinsically labeled fluorescein ODNs. Represented are ODNs alone (open bars) and ODNs in the presence of 100 nM IN in a Tris buffer (pH 7.2) containing 50 mM NaCl in the absence (solid bars) or presence (shaded bars) of 5 mM Mg2+. ss, single strand; ds, double strand. Steady-state anisotropies were calculated from TFA data by integration of Ivv(t) and Ivh(t).
Determination of the θ of the IN–DNA Complex Using a Base-Modified ODN.
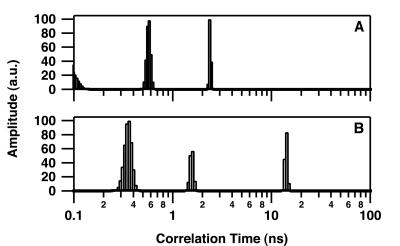
The flexibility of the fluorescein probe from the six-carbon linker leads to a very fast initial anisotropy decay (not shown) that could result in decreased resolution of the final part of the anisotropy decay. The experiments described above with fluorescein-labeled ODNs were repeated with the 21-mer, base-modified ODN, PTER1 (Fig. 1G), in which the guanosine at position 19 (from the 3′ end) was replaced by the fluorescent guanosine analog, 3MI (19, 20). This substitution had no detectable effect on either 3′ processing or integration reaction (not shown). As seen by the narrow correlation time distribution below 1 ns (Fig. 7), the heterogeneity of the flexibilities was reduced significantly with the duplex PTER1/21U5A as compared with the fluorescein-labeled ODN. Except for the reduced fluorophore flexibility, results were very similar irrespective of the nature of the fluorophore. The 3MI-containing duplex alone was characterized by a θ value centered at about 2 ns, and the addition of IN produced a peak centered at 14 ns (Fig. 7B) and 16 ns (not shown) at 25°C and 37°C, respectively. Again, (i) saturation was not observed under standard assay conditions even at IN concentrations of 200 nM (not shown), (ii) results were indicative of a monomer-sized DNA–IN complex at 25°C, and (iii) the complex size was increased significantly at 37°C (θ20°C = 23 ns) over that seen at 25°C (θ20°C = 15.5 ns).
Figure 7.
Correlation time distribution of the IN–DNA complex by monitoring 3MI-containing ODNs. (A) PTER1/21U5A alone at 25°C. (B) PTER1/21U5A in the presence of 100 nM IN at 25°C. Excitation and emission wavelengths were 370 and 440 nm, respectively. The lifetime distribution was not influenced by the protein binding: τ1 = 0.1 ± 0.05 ns (36%); τ2 = 0.5 ± 0.2 ns (32%); τ3 = 1.7 ± 0.1 ns (16%); τ4 = 4.9 ± 0.1 ns (16%).
Discussion
Three independent fluorescence probes were used to study the self-association of the DNA-bound IN by TFA. In this study, we chose to use IN purified according to Leh et al. (7), because of its ability to function efficiently in the 3′ processing reaction at relatively low protein concentration (10−7 M) with Mg2+ as a cofactor that is more relevant for the in vivo activity than Mn2+. The overall rotation of the IN–DNA complex was observed by using either the DNA signal (via the extrinsically linked fluorescein or the fluorescent guanosine analog 3MI) or the protein signal (via the Trp fluorescence). Altogether, the three approaches indicate that IN that is characterized by a high-order oligomeric form in the absence of DNA, as seen by its long θ of 90–100 ns, undergoes a dissociation upon binding DNA to yield a shorter θ (<30 ns). Furthermore, we found that complexes formed at 37°C were typically larger than those formed at 25°C.
DNA Binding.
Both steady-state and TFA parameters show that the terminal 13 bp of the viral DNA are sufficient for recognition by IN. This is in agreement with other results described in the literature (23, 24). No significant difference in binding properties were observed between ODNs of 13-, 21-, and 36-bp lengths. In contrast, a 7-mer ODN binds IN with a very low affinity because no binding was detected under in vitro assay conditions (Fig. 6) and only a slight shift of the IN θ was observed in the presence of an excess of ODN (Fig. 3) compared with the effect of the 21-mer ODN (Fig. 2). Our data confirm the single-strand binding capability of IN (22). Even with Mg2+-dependent DNA binding, which supposedly is more specific (5), IN binds single-stranded ODN as efficiently as the double-stranded ODN, suggesting that the DNA-binding step is less specific than the catalysis itself. To gain some insight into the IN–DNA interaction specificity, a complementary quantitative analysis currently is in progress. Our data also confirm that even if IN is capable of binding to DNA in the absence of any divalent cation, the complex formation clearly is favored in the presence of Mg2+ (12, 25, 26).
TFA Experiments.
Of the three fluorescence probes used in this work, intrinsic Trp has several advantages. (i) It is more suitable for a study of the global motion of the complex because there are seven Trp residues distributed among the three IN domains. This allows the study of the entire protein complex hydrodynamics by measuring θ. (ii) There is no risk of altering protein–protein or protein–DNA interactions as there is in some cases when using extrinsic probes. One disadvantage of Trp fluorescence in this study is related to the presence of an excess of free protein under assay condition, so that no significant change of the θ was observed between a 100 nM IN solution and the same solution containing 20 nM DNA substrate (θ = 90–100 ns). In contrast, with an excess of ODN (in the micromolar range) at 25°C, the θ decreases to 15.5–19.5 ns. Surprisingly, this value is very similar to the one obtained with monomeric IN in the absence of DNA (θ20°C = 17.5 ns) (17). Because the calculated θ is expected to be 14.4 ns at 20°C for a spherical protein (assuming a molecular mass of 32 kDa and a typical hydration of 50%), it appears that the IN geometry does not correspond rigorously to a sphere but, more likely, to a prolate ellipsoid characterized by an axial ratio of ≈2.1. For such a geometry, three different correlation times are predicted by the theory (18), but, in practice, one average value corresponding to the overall motion is found. One simple calculation leads to protein dimensions for IN, such as 88 Å for the unique long axis and 35 Å for the two short axes. The axial ratio of the complex naturally is shortened because of the binding of the DNA substrate such as the 21-mer duplex ODN, assuming a diameter and long axis of 25 Å and 71 Å (3.38 Å by bp), respectively, for hydrated DNA. A decrease of the complex axial ratio minimizes the increase of the θ that could be expected by a simple addition of the molecular mass of each partner of the final complex. Even this correction is not sufficient to explain the low θ value we obtained from characterization of the IN–ODN complex. Others parameters such as dehydration, docking with DNA grooves, and/or reorganization of protein domains also must be taken into account to explain this result. Other examples of protein–DNA complexes described in the literature display similar behavior. For TBP (27 kDa) and the TyrR homodimer (57.6 kDa), the θ values of the final protein–DNA complexes (8.5 and 28 ns, respectively) are similar to those predicted for the free proteins (27, 28).
Fluorophores such as 3MI and fluorescein that are attached to the DNA allow determination of the θ of the complex under conditions of the activity assay because free proteins are not seen at excitation wavelengths above 310 nm. In our study, the θ values of naked ODNs are relatively low as compared with those found by other groups (27–29). The origin of this discrepancy is not clear but our data show that the steady-state anisotropy is not proportional to the ODN length. This suggests that both spinning motion and flexibilities that are relatively size-independent have a dominant contribution over the tumbling in the depolarization process. However, in the following discussion, we assume that the motion of the ODN in the context of the complex is tightly coupled to the global motion (tumbling) of the protein. Similar θ values were obtained for labeled ODNs or Trp fluorescence suggesting that: (i) fluorescein or 3MI is suitable to determine a protein–DNA complex size; (ii) the transition moment of these fluorophores is not aligned with either the long or the short axis (in fact, in the case of isotropic rotation, the θ derived from fluorescein or 3MI should not be comparable to the one determined from Trp experiments because depolarization occurs only if the motion displaces the transition moment); and (iii) other causes affecting the Trp anisotropy decay can be neglected in our study, including the Trp-Trp homotransfer and the existence of independent motions of the protein domains in the context of the IN–DNA complex, as one could imagine based on the recent structure of the multidomain protein (catalytic core/C-terminal domain) (30).
Furthermore, the θ is significantly higher at 37°C (θ20°C = 23–27 ns) than at 25°C (θ20°C = 15.5–19.5 ns), suggesting that the complex is significantly larger at 37°C than at 25°C. The θ ratio suggests that a large part of IN is converted into a dimeric form when complexed with the DNA at 37°C. Recently, we have observed dimerization of the catalytic core at increased temperatures; a submicromolar-catalytic core preparation is homogeneously dimeric above 30°C but monomeric at lower temperatures (31). It is then possible that the dimerization of the entire protein at increased temperatures is based mainly on catalytic core dimerization. From the present study, it is not possible to determine whether all of the IN complexed with DNA is in form of a dimer. The expected θ for the dimer–DNA complex is between 30 and 40 ns. It is therefore likely that at physiologic temperature, the monomeric and dimeric INs complexed to the DNA substrate are in equilibrium. We did not observe significant changes in the θ distribution in the IN concentration range of 50–200 nM, however.
Multimeric Organization of the Active IN.
In a previous study, we demonstrated that detergents, such as CHAPS or Nonidet P-40, cause high-order multimeric forms of IN to dissociate (7, 17). It also has been shown by several groups (15–17) that zinc stimulates oligomerization, most likely via the pseudo-zinc-finger HHCC motif contained in the N-terminal domain. Therefore, IN that is purified in the absence of detergent and in the presence of zinc is characterized in the absence of DNA by a long θ of about 90 ns that reasonably can be attributed to a tetrameric form. This form binds the DNA substrate efficiently in the presence of Mg2+ and is highly active in Mg2+-dependent reactions (7). This is in good agreement with the idea that the different activities of IN require a multimeric enzyme (13, 32). One would expect that upon binding the DNA substrate, the θ of the complex would be higher than 90 ns. In the current study, however, we have found evidence that IN dissociates in the context of the DNA–IN complex and cannot be a tetramer when bound to the ODN under active conditions in vitro. This result does not depend on the specificity of the interaction because both double- and single-stranded DNA lead to similar results. As discussed above, at physiologic temperature, two forms of DNA-bound IN (monomer and dimer) are likely to be in equilibrium. We cannot exclude from our study that monomeric IN is active, at least for the 3′ processing reaction, and it is probable that a single active site could be responsible for in vitro catalysis in a manner similar to that described recently for Tn10 and phage Mu transposases (33). According to complementation studies in which certain combinations of individually inactive IN mutants can restore activity in vitro (13, 14), it is likely that the active form of IN for in vitro assays corresponds to a dimer. If the primary role of complementation is in specific IN–DNA recognition, however, a multimeric form of IN would be required for DNA binding, but, once bound, a protomer alone would ensure catalysis. What is the situation in vivo? For geometrical reasons (10), a dimer is unlikely to mediate concerted integration of both viral DNA ends, and, therefore, it is probable that a higher-order organization is responsible for the in vivo activity. In the current study, the in vitro substrate consists of only one end of the viral DNA. It is possible that, in the presence of the full HIV viral DNA, a multimeric organization such as a tetramer is stable. Physiologic partners in the context of the preintegration complexes also could stabilize a multimeric organization of IN. There also exists the possibility that the multimeric form of IN, as expressed in the context of the reducing E. coli environment, is labile, emphasizing a particular caution with regard to the disulfide bridges as shown by Petit et al. (34). This potential lability also could explain large differences in the coupled joining reaction between recombinant IN and preintegration complexes directly purified from infected cells (35, 36).
Acknowledgments
We thank P. Denjean for technical assistance. This work was supported by grants from the Agence Nationale de Recherches sur le SIDA and the Centre National de la Recherche Scientifique. E.D. is a fellow of SIDACTION.
Abbreviations
- IN
integrase
- ODN
oligonucleotide
- TFA
time-resolved fluorescence anisotropy
- θ
rotational correlation time
- 3MI
3-methyl-8-(2-deoxy-β-d-ribofuranosyl) isoxanthopterin
Footnotes
This paper was submitted directly (Track II) to the PNAS office.
References
- 1.Engelman A, Craigie R. J Virol. 1992;66:6361–6369. doi: 10.1128/jvi.66.11.6361-6369.1992. [DOI] [PMC free article] [PubMed] [Google Scholar]
- 2.Kulkosky J, Jones K S, Katz R A, Mack J P G, Skalka A M. Mol Cell Biol. 1992;12:2331–2338. doi: 10.1128/mcb.12.5.2331. [DOI] [PMC free article] [PubMed] [Google Scholar]
- 3.Goldgur Y, Dyda F, Hickman A B, Jenkins T M, Craigie R, Davies D R. Proc Natl Acad Sci USA. 1998;95:9150–9154. doi: 10.1073/pnas.95.16.9150. [DOI] [PMC free article] [PubMed] [Google Scholar]
- 4.Maignan S, Guilloteau J-P, Zhou-Liu Q, Clément-Mella C, Mikol V. J Mol Biol. 1998;282:359–368. doi: 10.1006/jmbi.1998.2002. [DOI] [PubMed] [Google Scholar]
- 5.Esposito D, Craigie R. EMBO J. 1998;17:5832–5843. doi: 10.1093/emboj/17.19.5832. [DOI] [PMC free article] [PubMed] [Google Scholar]
- 6.Engelman A, Craigie R. J Virol. 1995;69:5908–5911. doi: 10.1128/jvi.69.9.5908-5911.1995. [DOI] [PMC free article] [PubMed] [Google Scholar]
- 7.Leh H, Brodin P, Bischerour J, Deprez E, Tauc P, Brochon J-C, LeCam E, Coulaud D, Auclair C, Mouscadet J-F. Biochemistry. 2000;39:9285–9294. doi: 10.1021/bi000398b. [DOI] [PubMed] [Google Scholar]
- 8.Molteni V, Rhodes D, Rubins K, Hansen M, Bushman F D, Siegel J S. J Med Chem. 2000;43:2031–2039. doi: 10.1021/jm990600c. [DOI] [PubMed] [Google Scholar]
- 9.Jenkins T M, Esposito D, Engelman A, Craigie R. EMBO J. 1997;16:6849–6859. doi: 10.1093/emboj/16.22.6849. [DOI] [PMC free article] [PubMed] [Google Scholar]
- 10.Heuer T S, Brown P O. Biochemistry. 1998;37:6667–6678. doi: 10.1021/bi972949c. [DOI] [PubMed] [Google Scholar]
- 11.Puras Lutzke R A, Plasterk R H A. J Virol. 1998;72:4841–4848. doi: 10.1128/jvi.72.6.4841-4848.1998. [DOI] [PMC free article] [PubMed] [Google Scholar]
- 12.Vink C, Puras Lutzke R A, Plasterk R H A. Nucleic Acids Res. 1994;22:4103–4110. doi: 10.1093/nar/22.20.4103. [DOI] [PMC free article] [PubMed] [Google Scholar]
- 13.Engelman A, Bushman F D, Craigie R. EMBO J. 1993;12:3269–3275. doi: 10.1002/j.1460-2075.1993.tb05996.x. [DOI] [PMC free article] [PubMed] [Google Scholar]
- 14.van den Ent F M I, Vos A, Plasterk R H A. J Virol. 1999;73:3176–3183. doi: 10.1128/jvi.73.4.3176-3183.1999. [DOI] [PMC free article] [PubMed] [Google Scholar]
- 15.Lee S P, Xiao J, Knutson J R, Lewis M S, Han M K. Biochemistry. 1997;36:173–180. doi: 10.1021/bi961849o. [DOI] [PubMed] [Google Scholar]
- 16.Zheng R, Jenkins T M, Craigie R. Proc Natl Acad Sci USA. 1996;93:13659–13664. doi: 10.1073/pnas.93.24.13659. [DOI] [PMC free article] [PubMed] [Google Scholar]
- 17.Deprez E, Tauc P, Leh H, Mouscadet J-F, Auclair C, Brochon J-C. Biochemistry. 2000;39:9275–9284. doi: 10.1021/bi000397j. [DOI] [PubMed] [Google Scholar]
- 18.Lakowicz J R. Principles of Fluorescence Spectroscopy. 2nd Ed. New York: Plenum; 1999. pp. 291–366. [Google Scholar]
- 19.Hawkins M E, Pfleiderer W, Mazumder A, Pommier Y G, Balis F M. Nucleic Acids Res. 1995;23:2872–2880. doi: 10.1093/nar/23.15.2872. [DOI] [PMC free article] [PubMed] [Google Scholar]
- 20.Hawkins M E, Pfleiderer W, Balis F M, Porter D, Knutson J R. Anal Biochem. 1997;244:86–95. doi: 10.1006/abio.1996.9879. [DOI] [PubMed] [Google Scholar]
- 21.Brochon J-C. Methods Enzymol. 1994;240:262–311. doi: 10.1016/s0076-6879(94)40052-0. [DOI] [PubMed] [Google Scholar]
- 22.Pemberton I K, Buckle M, Buc H. J Biol Chem. 1996;271:1498–1506. doi: 10.1074/jbc.271.3.1498. [DOI] [PubMed] [Google Scholar]
- 23.LaFemina R L, Callahan P L, Cordingley M G. J Virol. 1991;65:5624–5630. doi: 10.1128/jvi.65.10.5624-5630.1991. [DOI] [PMC free article] [PubMed] [Google Scholar]
- 24.Vink C, van Gent D C, Elgersma Y, Plasterk R H A. J Virol. 1991;65:4636–4644. doi: 10.1128/jvi.65.9.4636-4644.1991. [DOI] [PMC free article] [PubMed] [Google Scholar]
- 25.Hazuda D J, Wolfe A L, Hastings J C, Robbins H L, Graham R L, LaFemina R L, Emini E A. J Biol Chem. 1994;269:3999–4004. [PubMed] [Google Scholar]
- 26.Yi J, Asante-Appiah E, Skalka A-M. Biochemistry. 1999;38:8458–8468. doi: 10.1021/bi982870n. [DOI] [PubMed] [Google Scholar]
- 27.Perez-Howard G N, Weil P A, Beechem J M. Biochemistry. 1995;34:8005–8017. doi: 10.1021/bi00025a006. [DOI] [PMC free article] [PubMed] [Google Scholar]
- 28.Bailey M, Hagman P, Millar D P, Davidson B E, Tony G, Haralambidis J, Sawyer W H. Biochemistry. 1995;34:15802–15812. doi: 10.1021/bi00048a026. [DOI] [PubMed] [Google Scholar]
- 29.Duhamel J, Kanyo J, Dinter-Gottlieb G, Lu P. Biochemistry. 1996;35:16687–16697. doi: 10.1021/bi9610919. [DOI] [PubMed] [Google Scholar]
- 30.Chen J, Krucinski J, Miercke L, Finer-Moore J, Tang A H, Leavitt A D, Stroud R M. Proc Natl Acad Sci USA. 2000;97:8233–8238. doi: 10.1073/pnas.150220297. . (First Published July 11, 2000; 10.1073/pnas.150220297) [DOI] [PMC free article] [PubMed] [Google Scholar]
- 31.Laboulais C, Deprez E, Leh H, Mouscadet J-F, Brochon J-C, Lebret M. Biophys J. 2001;81:473–489. doi: 10.1016/S0006-3495(01)75715-3. [DOI] [PMC free article] [PubMed] [Google Scholar]
- 32.Jenkins T M, Engelman A, Ghirlando R, Craigie R. J Biol Chem. 1996;271:7712–7718. doi: 10.1074/jbc.271.13.7712. [DOI] [PubMed] [Google Scholar]
- 33.Kennedy A K, Haniford D B, Mizuuchi K. Cell. 2000;101:295–305. doi: 10.1016/s0092-8674(00)80839-9. [DOI] [PubMed] [Google Scholar]
- 34.Petit C, Schwartz O, Mammano F. J Virol. 1999;73:5079–5088. doi: 10.1128/jvi.73.6.5079-5088.1999. [DOI] [PMC free article] [PubMed] [Google Scholar]
- 35.Farnet C M, Haseltine W A. Proc Natl Acad Sci USA. 1990;87:4164–4168. doi: 10.1073/pnas.87.11.4164. [DOI] [PMC free article] [PubMed] [Google Scholar]
- 36.Farnet C M, Bushman F D. Cell. 1997;88:483–492. doi: 10.1016/s0092-8674(00)81888-7. [DOI] [PubMed] [Google Scholar]


