

Summary
Current dogma asserts that mammalian life-long blood production is established by a small number of blood progenitors. However, this model is based on assays that require the disruption, transplantation and/or culture of embryonic tissues. Here, we used the sample-to-sample variance (SSV) of a multi-colored lineage trace reporter to assess the frequency of emerging life-long blood progenitors while avoiding the disruption, culture or transplantation of embryos. We find that approximately 719 Flk-1+ mesodermal precursors, 633 VE-Cadherin+ endothelial precursors and 545 Vav1+ nascent blood stem and progenitor cells emerge to establish the hematopoietic system at embryonic days (E) 7-E8.5, E8.5-E11.5 and E11.5-E14.5, respectively. We also determined that the spatio-temporal recruitment of endothelial blood precursors begins at E8.5 and ends by E10.5 and that many c-Kit+ clusters of newly specified blood progenitors in the aorta are polyclonal in origin. Our work illuminates the dynamics of the developing mammalian blood system during homeostasis.
Introduction
Hematopoietic stem cells (HSCs) emerge during embryogenesis from mesodermally-derived Runx1+ hemogenic endothelial cells (HE) in the dorsal aorta and arterial vasculature between embryonic day 10.5 (E10.5) and E11.5 of mouse ontogeny1. From here, they circulate to the fetal liver (FL), expand, and then seed the bone marrow (BM)1. Transplantation studies estimate <1 HSC/embryo at E10.5 and between 1-2 HSCs/embryo at E11.52-11. However, live imaging and multi-color fate mapping of zebrafish HE reveals much greater numbers of phenotypic HSCs and about 30 functional long-term HSC clones emerging from the mid-gestation dorsal aorta12-14. Recently, the reaggregation of mouse aorta-gonads-mesonephros (AGM) with BM-derived OP9 stromal cells and limiting dilution transplantation estimated 50 and 70 murine HSC precursors at E10.5 and E11.5, respectively15. It is impossible to know, however, if predictions made based on non-physiological ex vivo niches faithfully reflect in vivo HSC formation. Furthermore, recent work reveals that transplantation likely fails to read out the full repertoire of cells sustaining life-long hematopoiesis during homeostasis16-18. Thus, any transplantation-based approach almost certainly underestimates HSC and precursor numbers. Here, we sought to measure the number of independently specified precursors contributing to life-long hematopoiesis at distinct stages of mouse ontogeny using an approach unbiased by transplantation or ex vivo manipulation. We took advantage of the ROSA26+/Confetti allele (Confetti allele)19, which is recombined by Cre recombinase (CRE) to label cellular progeny randomly with GFP, YFP, RFP or CFP (i.e. Confetti-labeled cells) (Fig. 1a). Here, we establish that the SSV in the distribution of Confetti-colors in murine peripheral blood (PB) correlates with the number of cells initially labeled with CRE, either during embryogenesis or in adults. We exploit this observation to discover that hundreds of precursors emerge throughout mouse ontogeny to establish life-long hematopoiesis.
Figure 1. Sample-to-sample variance reliably estimates number of initiating events.
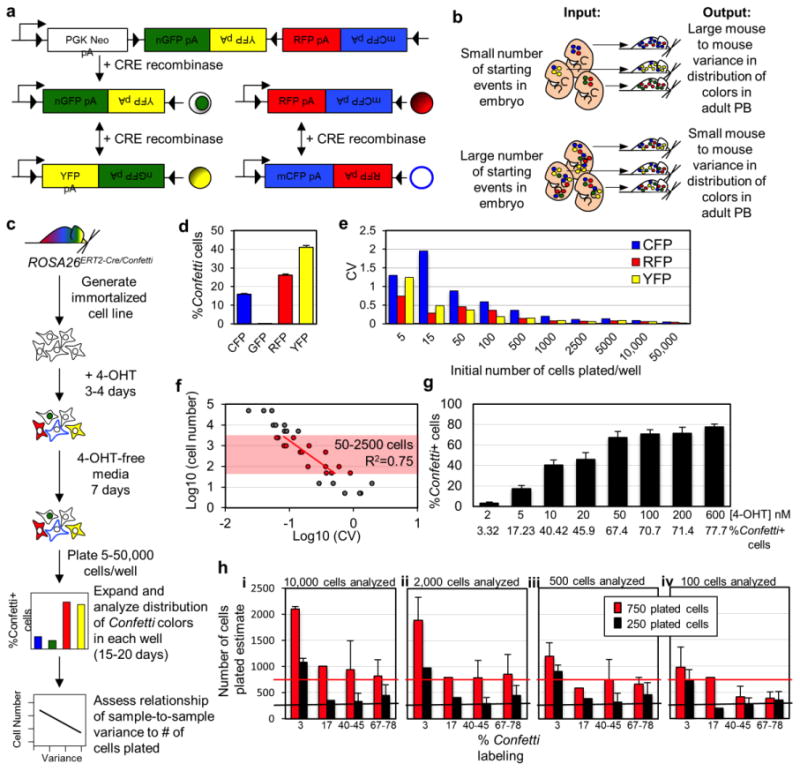
a, Schematic of Confetti allele. b, Sample-to-sample variance in the distribution of Confetti colors (output) inversely correlates with initiating events (input). c, Schematic of iCC experiment. d, Confetti labeling of 4-OHT treated iCCs. e, Well-to-well coefficient of variance (CV, standard deviation/mean) of each Confetti color in expanded iCCs. f, Average Log10(CV) of RFP, CFP, and YFP vs. Log10(cells plated/well). Shaded region indicates cell range in which slope minimally diverged from slope of Log10(CV) vs. Log10 (starting cell number) line yielded in simulations (50-2500 cells, Supplemental Fig. 1c). Linear regression yielded: cell number = 10(-1.56*Log10(CV)+1.47) with 95% confidence intervals defined by cell number = 10(-2.1*Log10(CV)+1.06) (lower bound) and cell number = 10(-1.02*(Log10(CV)+1.89) (upper bound). This linear regression had an R2 of 0.75 and an adjusted R2 of 0.73 and p-value <0.00001 (F(1,13) == 39.21). For the 15 residuals within the range tested the skew was 0.06 and the kurtosis 2.34, where a perfectly normal distribution would have a skew of 0 and a kurtosis of three. d, e, f, Results represent 3 independent similar experiments. g, Labeling efficiency of iCCs treated with different concentrations of 4-OHT. Error bars indicate ±s.d. of mean (n=9). This experiment was repeated twice. h, Confetti-based estimates were normalized to labeling efficiency as follows: Total initiating events = Estimate*(100/%Confetti+ cells). The resulting reporter labeling efficiencies were grouped into four categories (3%, 17%, 40-45% and 67-78%). The average Confetti-based estimate of numbers of initially plated cells after normalization is shown (error bars indicate ± s.d. of mean). Confetti-based estimates of numbers of initiating events maintains fidelity when the labeling efficiency is >3% and >500 cells are examined. Estimates were obtained from n≥9 plated replicates. Results represent two independent similar experiments.
Results
SSV in the distribution of Confetti-colors predicts initiating cells in vitro
Classic studies successfully employed SSV, using the binomial or Poisson models, to estimate HSC numbers in adult mice20-24. Here, we took a similar approach to analyze the embryo using the Confetti allele19 (Fig. 1a). This system has been used to visualize the clonal dynamics of solid tissue stem cells, but has not yet been applied to studies of hematopoiesis19,25. We hypothesized that the SSV in the distribution of Confetti-colors in the peripheral blood (PB) would correlate with the number of Confetti-labeled precursors contributing to life-long hematopoiesis such that large numbers of Confetti+ precursors would yield a low variance and a small number of Confetti+ precursors would produce a high variance (Fig. 1b). We tested this hypothesis empirically by generating an immortalized fibroblast cell line from ROSA26ERT2-Cre/Confetti mice (“inducible Confetti cells” or iCCs)(Fig. 1c). 4-OHT treatment of iCCs resulted in a distribution of Confetti-colors that was stable and specific to this cell line (Fig. 1d and Supplementary Fig. 1). Here, the GFP+ allele was under-favored, as has been previously reported19. We plated replicates of 5-50,000 4-OHT-treated iCCs, expanded these cells in culture, and then analyzed the distribution of Confetti-colors by flow cytometry (Fig. 1c). The coefficient of variance (CV, standard deviation/mean) amongst colors and between wells was calculated for each individual Confetti-color at each plated cell number. As expected, a decrease in the initial plated cell number correlated with an increase in the observed CV for each individual Confetti-color (Fig. 1e). From here onwards, CV will refer to the SSV in the distribution of the Confetti-colors. Next, we examined the average Log10(CV) for YFP, CFP and RFP versus the Log10(cell number) and observed a linear relationship between 50 and 2500 starting cells that yielded the following formula for estimating starting cell numbers based on SSV: cell number = 10(-1.56(log10CV) + 1.47) (Fig. 1f, see Methods and Legend for additional details on formula derivation). This formula yielded accurate starting cell numbers estimates at Confetti labeling efficiencies of >3% and when >500 cells were analyzed (Fig. 1g-h, Supplementary Table 1).
SSV in the distribution of Confetti-colors predicts the number of blood precursors in vivo
To assess if our formula could accurately estimate starting cell numbers when applied to hematopoiesis, CD45.1+CD45.2+ mice were transplanted with 5×10⁶, 1×10⁶ or 2×10⁵ whole bone marrow (WBM) cells isolated from CD45.2+ ROSA26+/ConfettiVE-Cadherin+/Cre mice (Fig. 2a-b). Because blood derives from endothelium, VE-cadherinCre labels the entire hematopoietic compartment26. Historically, the frequency of transplantable WBM HSCs is consistently estimated as about 1/10,00027-33. Thus, we expected recipients to engraft with about 500, 100 and 20 long-term HSCs (LT-HSCs), respectively. By 32 weeks post-transplant, in three independent experiments, the observed Log(CV) of the Confetti-colors in CD45.2+ PB estimated reconstitution with an average of 592±260, 220±19, and 121±16 LT-HSCs in recipients of 5×10⁶, 1×10⁶ or 2×10⁵ WBM cells, respectively (Fig. 2b, Supplementary Table 2). As 20 initiating events falls outside our window of precision (Fig. 1f), it is not surprising that our formula did not accurately estimate this value. The Log(CV) of Confetti-colors in CD45.2+ PB at earlier time-points post-transplant (4-16 weeks) revealed large numbers of initiating events (i.e. repopulating units, RUs) in all transplanted mice (Fig. 2b). This number steadily declined over time in recipients. This pattern reflects the well established gradual exhaustion of short-term HSCs and progenitors over time post-transplant 34-36. In a second experiment, Confetti+ WBM was transplanted at limiting dilution (Fig. 2a, 2c, Supplementary Fig. 2a-b). Here, the precise input of RUs could be independently confirmed by limiting dilution analysis (LDA). Our Confetti-based RU estimate correlated precisely with that predicted via LDA at 20 weeks post-transplant (Fig. 2c, Supplementary Fig. 2a-b, Supplementary Table 3). These experiments confirm that SSV in the distribution of Confetti-colors accurately reflects changes in initiating cell numbers in a reconstituting hematopoietic system.
Figure 2. Mouse-to-Mouse peripheral blood Confetti variance reliably estimates number of repopulating units after transplantation.
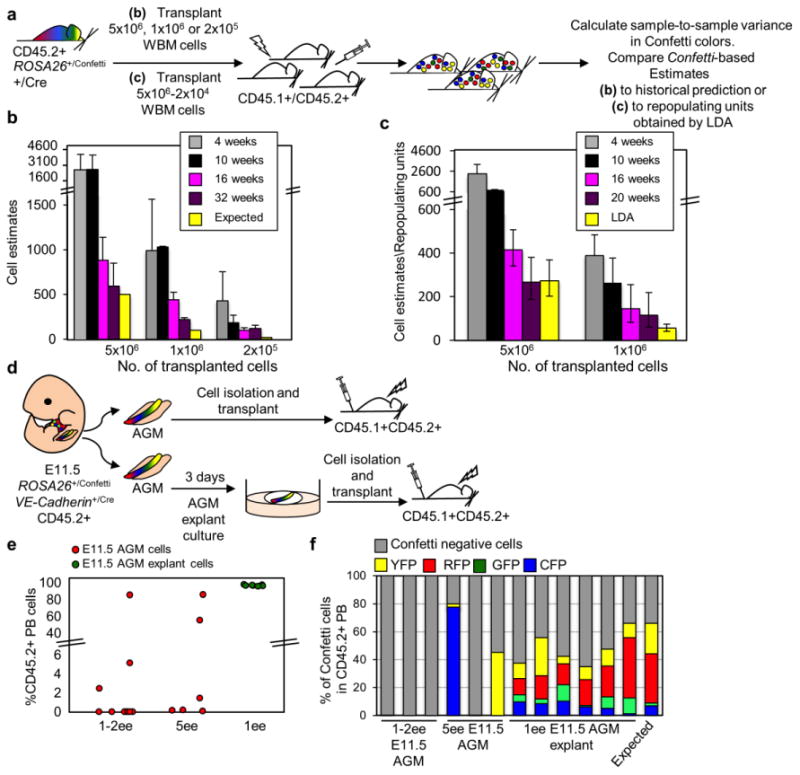
a, Experimental schematic. Here, “+/Cre” refers to any mouse heterozygous for CRE. b, 5×10⁶, 1×10⁶, 2×10⁵ ROSA26 +/ConfettiVE-Cadherin+/Cre WBM cells were transplanted into irradiated mice. Sample-to-sample variance in the PB Confetti colors estimated the number of repopulating units (RUs). Confetti estimate of RU relative to expected number of RU based on historical controls (i.e. 1 LT-HSC/10,000 WBM cells). Data are the average of 3 independent experiments (Supplementary Table 2). Error bars = s.d. c, CD45.2+ ROSA26+/ConfettiFlk1+/Cre WBM was transplanted at limiting dilution into irradiated CD45.1+CD45.2+ mice along with 2×10⁵ CD45.1+ WBM cells. Confetti colors in the CD45.2+ PB was examined between 4-20 weeks post-transplant, along with the distribution of total CD45.2+ PB chimerism (see Supplementary Fig. 2a-b). LDA indicates 1 RU/18,320 WBM cells transplanted (yellow bars, Supplementary Fig. 2b). Confetti-based estimates of RUs is shown at 4, 10, 16 and 20 weeks post-transplant. Error bars in LDA bar represent standard error. For Confetti-based estimates, error bars represent the 95% CI (Supplementary Table 3). d, Experimental schematic. CD45.2+ ROSA26+/ConfettiVE-Cadherin+/Cre cells from E11.5 AGM (n=16) or E11.5 AGM explants (n=7) were transplanted into irradiated CD45.1+CD45.2+ mice along with 2×10⁵ CD45.1+ WBM cells . e, %CD45.2+ PB 16 weeks post-transplantation. Each circle is an individual recipient. f, Frequency of unlabeled and Confetti+ cells within CD45.2+ PB of recipients. Each bar is an individual recipient (Supplementary Table 4).
Transplantable HSCs in the E11.5 AGM expand dramatically during ex vivo explant culture37. Thus, we tested if our Confetti approach could detect this increase. One to five embryo-equivalents (EE) of E11.5 AGM-derived cells were isolated from CD45.2+ ROSA26+/ConfettiVE-Cadherin+/Cre embryos and transplanted into lethally irradiated CD45.1+CD45.2+ mice (Fig. 2d). There was significant CD45.2+ engraftment in 6/15 recipients (Fig. 2e). In two of these recipients, the CD45.2+ PB was primarily labeled with a single Confetti color (Fig. 2f), reflecting engraftment with very few HSCs. CD45.2+ PB in the remaining recipients was Confetti-, which is consistent with both a small number of engrafted HSCs and a recombination efficiency of only about 45% in ROSA26+/ConfettiVE-Cadherin+/Cre mice (Supplementary Fig. 2c). This confirms previous reports that few newly specified HSCs are detected when transplanted into adult recipients2-4. E11.5 CD45.2+ ROSA26+/ConfettiVE-Cadherin+/Cre AGMs were next cultured as explants for three days, dissociated, and then transplanted at 1EE into lethally irradiated CD45.1+CD45.2+ recipients (Fig. 2d). Here, 7/7 recipients displayed >90% CD45.2+ PB, of which 25-65% was Confetti+ (Fig. 2e-f). The resulting average Log10(CV) of the well-represented Confetti colors of the CD45.2+ PB estimated that AGM-explant cell recipients were repopulated by 222 HSCs (95% CI[128,384]), Table 1, Supplementary Table 4, Supplementary Fig. 2d). These data confirm a >150-fold expansion of HSCs during ex vivo AGM explant culture, as reported previously37. The de novo appearance of Confetti+ cells in the PB of AGM-explant recipients (Fig. 2f) indicates that some of this expansion is due to ongoing nascent specification, as previously reported37. This experiment further confirms that SSV in the distribution of Confetti colors faithfully reflects changes in initiating cell numbers in vivo.
Table 1. Estimates of initiating cell numbers.
| Lineage labeled | TAM treatment | Cell population analyzed for Confetti label | 1N | 2Average Log10(CV) | 3CRE efficiency (%) | 4Normalized Cell Number Estimate | 5Confidence Interval | |
|---|---|---|---|---|---|---|---|---|
| VE-Cadherin-Cre | E11.5 AGM explant; endothelium | - | Blood of transplant recipients | 67 | 7-0.334 | 45 | 7222 | 128 – 384 |
| ROSA26ERT2-Cre | Adult mice; labels all cell types | Adults | Adult blood | 7 | -1.073 | 16 | 88572 | 5943 – 12,363 |
| E2aCre | Pre-implantation; labels all cell types | - | Adult blood | 13 | 0.074 | 81 | 828 | 10 – 81 |
| Flk1Cre | Multi-potent mesoderm progenitors | - | Adult blood | 7 | -0.77 | 66 | 8719 | 713– 726 |
| VE-Cadherin-Cre | Endothelium | - | Adult blood | 12 | -0.626 | 45 | 8633 | 524– 763 |
| Vav1Cre | HSPCs post-specification | Adult blood | 10 | -0.75 | 80 | 8545 | 524 - 567 | |
| UbiqERT2-Cre | Ubiquitous | E7.5 | Adult blood | 5 | -0.26 | 12 | 9617 | 324-1174 |
| UbiqERT2-Cre | Ubiquitous | E8.5 | Adult blood | 6 | -0.23 | 13 | 9538 | 273-1057 |
| Cdh5ERT2-Cre | Endothelium | E8.5 | Adult blood | 5 | -0.172 | 16 | 9341 | 161 – 723 |
| Cdh5ERT2-Cre | Endothelium | E9.5 | Adult blood | 7 | -0.152 | 16 | 9319 | 147 – 691 |
Number of mice, embryos, or transplant recipients
GFP is excluded from all analyses, because GFP+ PB cells always fell below the minimum threshold for precision
CRE efficiency calculated as % labeling of the total PB
Estimates normalized to CRE efficiency = (10(-1.56*Log10(CV)+1.47))/(efficiency/100)
95% confidence interval calculated as: (10(-2.1*Log10(CV)+1.06)) – (10(-1.02*(Log10(CV)+1.89))
Seven independent explants transplanted into seven recipients
16 weeks post-transplant
Based on analysis of mice between 10 and 16 weeks of age of both sexes
Based on analysis of mice at 10 weeks of age of both sexes
Please see also Supplementary Table 4
We next tested our formula for estimating numbers of initiating cells in a non-transplant based biological context. Hematopoiesis in adult mice is sustained by thousands of hematopoietic progenitors16,18. Thus, we utilized tamoxifen (TAM) treated adult ROSA26ERT2-Cre/Confetti mice as a control for large numbers of PB contributing events, expecting low SSV of Confetti-colors to reflect large numbers of newly labeled independent clones (Fig. 3a-b). Four weeks after TAM-treatment, the Confetti+ PB of ROSA26ERT2-Cre/Confetti mice was approximately 33% CFP, 33% RFP, 3%GFP and 29%YFP in all mature lineages examined (Supplementary Figs. 3a-c). As predicted, the observed SSV in the Confetti-colors was very low (Fig. 3c, Supplementary Table 4). This variance yielded an estimate of 8572 initiating events (95%CI[5943,12363]) (Table 1, Supplementary Table 4). This estimate agrees with recent reports of the highly polyclonal nature of hematopoiesis during homeostasis in adult mice16,18. To approximate small numbers of initiating events, we employed the E2a driver, which is first expressed by blastomeres during early murine development (Fig. 3a)38. ROSA26+/ConfettiE2a+/Cre mice thus represent a control for few initiating events and should yield a large SSV in PB Confetti-colors. Indeed, the observed variance in the PB of adult ROSA26+/ConfettiE2a+/Cre mice was very high and yielded an estimate of only 28 initiating events (95% CI[10, 81]) (Table 1, Fig. 3c, Supplementary Fig. 3a, Supplementary Table 4). Further, the distribution of Confetti-colors in the blood and other mesodermal, ectodermal, and endodermal tissues was similar and stochastic in individual ROSA26+/Confetti E2a+/Cre mice, confirming E2a-Cre activation early in development in very few cells (Supplementary Figs. 3d-f). Thus, the estimated numbers of initiating events for both ROSA26ERT2-Cre/Confetti and ROSA26+/Confetti E2a+/Cre mice demonstrate that our formula performs as expected in a biological context.
Figure 3. Estimate of hematopoietic precursor numbers and activity during distinct stages of hematopoietic development.
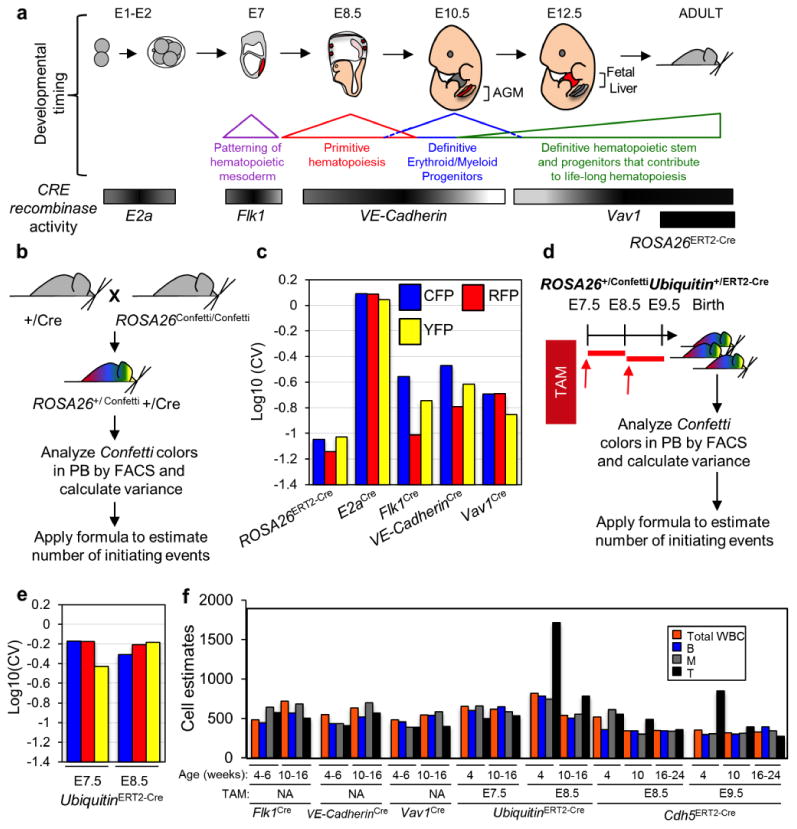
a, Schematic of window and site of CRE activity during murine development for E2aCre, Flk1Cre, VE-CadherinCre and Vav1Cre. ROSA26ERT2-Cre was activated by TAM in adult mice. b, +/Cre mice were mated with ROSA26Confetti/Confetti and the resulting adult offspring analyzed by flow cytometry for Confetti labeling. c, Log10(CV) of each Confetti color in ROSA26+/Confetti+/Cre mice. GFP is excluded because it represented <10% PB (Supplementary Table 4). d, 10 week old ROSA26+/ConfettiUbiquitin+/ERT2-Cre mice were analyzed for Confetti label after exposure to a single dose of TAM at E7.5 (n=5) or E8.5 (n=6). e, Log10(CV) of each Confetti color in ROSA26+/Confetti Ubiquitin+/ERT2-Cre mice. GFP is excluded because it represented <10% PB (Supplementary Table 4). f, The number of precursors generating Myeloid (M), B-cells (B) and T-cells (T) are depicted in parallel to the global estimate (total white blood cells, WBC) in PB of adult (age indicated in weeks) ROSA26+/ConfettiFlk1+/Cre, ROSA26+/ConfettiVE-Cadherin+/Cre, and ROSA26+/ConfettiVav1+/Cre mice. ROSA26+/Confetti Ubiquitin+/ERT2-Cre and ROSA26+/ConfettiCdh5+/ERT2-Creanimals exposed to TAM at different embryonic stages are also shown (Supplementary Table 4).
Hundreds of embryonic precursors contribute to life-long hematopoiesis
We next sought to measure the number of independently specified precursors contributing to life-long hematopoiesis at distinct stages of mouse development. HSCs derive from hemogenic endothelium that is mesodermal in origin1. Thus, we interrogated the clonal complexity of hematopoietic precursors as they emerge from mesoderm and endothelium by analyzing the SSV of PB Confetti-colors in cohorts of ROSA26+/ConfettiFlk1+/Cre (n=7) and ROSA26+/ConfettiVE-Cadherin-Cre+/Cre (n = 12) mice, which begin to express CRE in the mesoderm at E7 and the endothelium at E8.5, respectively26,39(Fig. 3a). We also examined cohorts of ROSA26+/ConfettiVav1+/Cre (n=10) mice, which express CRE in newly specified hematopoietic stem and progenitor cells (HSPCs) beginning at E11.5 (Fig. 3a, Fig. 4a-b)40. Confetti-allele recombination efficiency ranged from 45% to 80% amongst these mouse strains (Supplementary Fig. 2c, Table 1). Confetti color distribution in the PB of ROSA26+/ConfettiFlk1+/Cre, ROSA26+/ConfettiVE-Cadherin+/Cre, and ROSA26+/ConfettiVav1+/Cre mice was similar to that observed in TAM-treated ROSA26ERT2-Cre/Confetti mice (Supplementary Fig. 3a, c). By inputing the resulting average Log10(CV) of RFP, YFP, and CFP in the PB of each of these mouse cohorts into our formula for estimating cell numbers and adjusting for recombination efficiency, we calculated that approximately 719 (95% CI[713,726]), 633 (95% CI[524,763]) and 545 (95% CI[524,567]) mesodermal precursors, hemogenic endothelial precursors and newly specified HSPCs contribute to life-long hematopoiesis during mouse ontogeny, respectively (Fig. 3c, Table 1, Supplementary Table 4). These estimates were stable for ≥16 weeks of age for all mice (Supplementary Fig. 4d) and fell well within the cell range in which we empirically demonstrated that SSV in Confetti-colors is a reliable predictor of initiating cell numbers (Fig. 1f, Supplementary Table 1)2-4,15. We did not observe any dramatic differences in the number of precursors contributing to distinct blood lineages in these strains (Fig. 3f).
Figure 4. Onset of Confetti labeling in ROSA26+/Confetti Vav1+/Cre embryos.
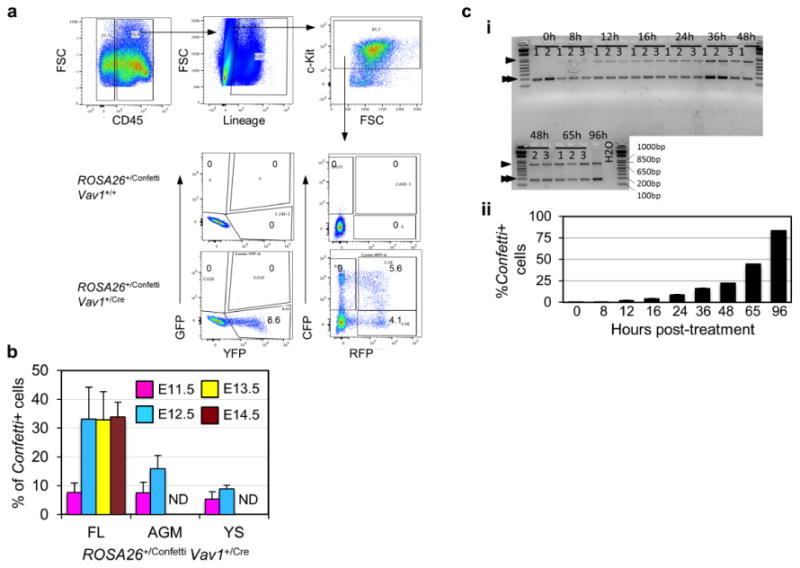
a, Representative Confetti analysis of CD45+Lineage-c-Kit+ E14.5 ROSA26+/ConfettiVav1+/Cre FL cells. RFP+CFP+ cells likely result from residual fluorophore protein previously expressed from same cassette before it “flipped” to allow expression of second fluorophore. b, Confetti labeling in CD45+ cells of the FL, AGM, and yolk sac of E11.5 (n=5) and CD45+c-Kit+ cells of E12.5 (n=3), E13.5 (n=13), and E14.5 (n=11) ROSA26+/ConfettiVav1+/Cre embryos (Supplementary Table 5). c, To assess the temporal delay between allele recombination and detectable fluorescence, iCCs treated with 4-OHT were monitored from 0 to 96 hours post-treatment by genomic PCR (i) and flow cytometry (ii). The average of % of Confetti+ cells is shown (error bars indicate ± s.d. of mean) (n=3) (Supplementary Table 5). Single arrow in (i) indicates recombined Confetti allele and double arrow in (i) indicates Cre allele as a control for gDNA content. Numbers indicate biological replicates. See Supplementary Fig. 6 for unprocessed scan of the gel.
To validate these estimates using an unbiased system, ROSA26+/ConfettiUbiquitin+/ERT2-Cre mice were subjected to a single dose of TAM at E7.5 (n=5) or E8.5 (n=6) (Fig. 3d). Here, CRE expression is ubiquitous and can be activated via TAM treatment41. The average Log10(CV) of RFP, YFP, and CFP in the PB of cohorts of ROSA26+/Confetti Ubiquitin+/ERT2-Cre mice exposed to TAM at E7.5 and E8.5 yielded, respectively, estimates of 617 (95% CI[324,1174]) and 538 (95% CI[273,1057]) initiating events (Table 1, Supplementary Table 4). These data confirm that hundreds of precursors present between E7.5-E8.5 and E8.5-E9.5 contribute to life-long hematopoiesis.
Vav1-Cre drives CRE expression throughout FL hematopoietic ontogeny when FL HSPCs are thought to expand rapidly42-44. Given that Vav1-Cre labeling of hematopoietic cells begins at E11.5, we expected Vav1-Cre to capture this expansion and were therefore surprised that Vav1-Cre yielded similar initiating cell number estimates as Flk-1-Cre and VE-Cadherin-Cre (Table 1, Supplementary Table 4). One technical explanation for this result is that Vav1-Cre driven labeling might saturate prior to the expansion of FL HSPCs. However, Vav1-Cre labeled 80% of adult PB but only about 33% of E13.5 and E14.5 CD45+c-Kit+ FL cells, suggesting that Vav1-Cre labeling has not yet saturated the hematopoietic system at these developmental time-points (Supplementary Figs. 2c, Figs. 4a-b). Further, we observed minimal delay in the onset of detectable Confetti fluorescence in 4-OHT-treated iCCs and recombination of the Confetti allele (Fig. 4c). However, we did note a slight delay between administration of 4-OHT and detectable DNA recombination (Fig. 4ci, Supplemental Fig. 6). Thus, altogether these data suggest the presence of a previously unappreciated developmental bottleneck in the FL, or temporally downstream of Vav1-Cre-dependent label saturation, that restricts the number of cells that ultimately establish the final pool of HSPCs that sustain life-long hematopoiesis. In sum, our data show that 600-700 precursors emerging first from the mesoderm and then from the endothelium before transiting through the FL ultimately establish the pool of HSPCs that sustain life-long hematopoiesis.
Hemogenic endothelium is specified between E8.5-E10.5
We next sought to define the temporal window when HE precursors are specified. Here, we employed ROSA26+/ConfettiCdh5+/ERT2-Cre mice, in which CRE activity is activated in the endothelium by TAM45. The temporal window post-delivery of TAM during which CRE is active has not been rigorously defined. To estimate this window, CD45.1+CD45.2+ mice treated with a single dose of TAM were transplanted with CD45.2+ ROSA26ERT2-Cre /Confetti WBM three, two, one or zero days after treatment (Fig. 5a). Here, Confetti+ PB was only detected in mice transplanted with ROSA26ERT2-Cre /Confetti WBM on the same day as TAM treatment (Fig. 5bi), despite high CD45.2+ PB engraftment in all recipients (>90%, Fig. 5bii). Recipients were treated with TAM 12 weeks post-transplant, resulting in 10-40% Confetti+ PB, confirming robust engraftment of ROSA26ERT2-Cre /Confetti WBM (Fig. 5biii and iv). These data suggest that the effective window of TAM-mediated Confetti allele recombination following a single treatment with TAM is <24 hours. Dams pregnant with ROSA26+/ConfettiCdh5+/ERT2-Cre embryos were treated with a single dose of TAM at E7.5, E8.5, E9.5, E10.5 or E11.5 (Fig. 5c). Remarkably, 10-24 weeks after birth, Confetti+ cells were mostly observed in the PB of mice treated with TAM at E8.5 (≈7% Confetti+ PB) and E9.5 (≈8% Confetti+ PB) (Fig. 5d, Fig. 3f), with minimal labeling at E7.5. Labeling abruptly disappeared in the PB of mice treated with TAM at E10.5 and E11.5 (Fig. 5d), even though yolk sac and AGM endothelium were clearly labeled (Fig. 5e). Since the window of TAM activity is <24 hours, our data suggest that all HE throughout the embryo that contribute to life-long hematopoiesis are established by E10.25, after which new recruitment ceases. To test this further, E11.5 AGMs isolated from CD45.2+ ROSA26+/ConfettiCdh5+/ERT2-Cre embryos subjected to TAM at E10.5 were cultured as explants for three days before transplantation into ablated CD45.2+CD45.1+ recipients (Fig. 5f). We and others have shown that nascent HSC specification occurs during AGM explant culture (Fig. 2e-f)37. Strikingly, Confetti labeling was undetectable in the CD45.2+ PB of 4/4 mice transplanted with AGM explant cells (Fig. 5g), confirming that recruitment of HE ceases before E10.5 and is not reactivated during AGM explant culture. The sum of the average estimate of the frequency of hemogenic precursors contributing to life-long hematopoiesis at E8.5 and E9.5 is ≈660 (Table 1, Supplementary Table 4). Although the same hemogenic precursor might be Confetti labeled at both E8.5 and E9.5, this value matches our estimates of the number of hematopoietic precursors contributing to life-long hematopoiesis gleaned from ROSA26+/ConfettiFlk1+/Cre, ROSA26+/ConfettiVE-Cadherin+/Cre, and ROSA26+/ConfettiVav1+/Cre mice.
Figure 5. Hemogenic endothelium is specified between E8.5 and E10.5 of murine ontogeny.
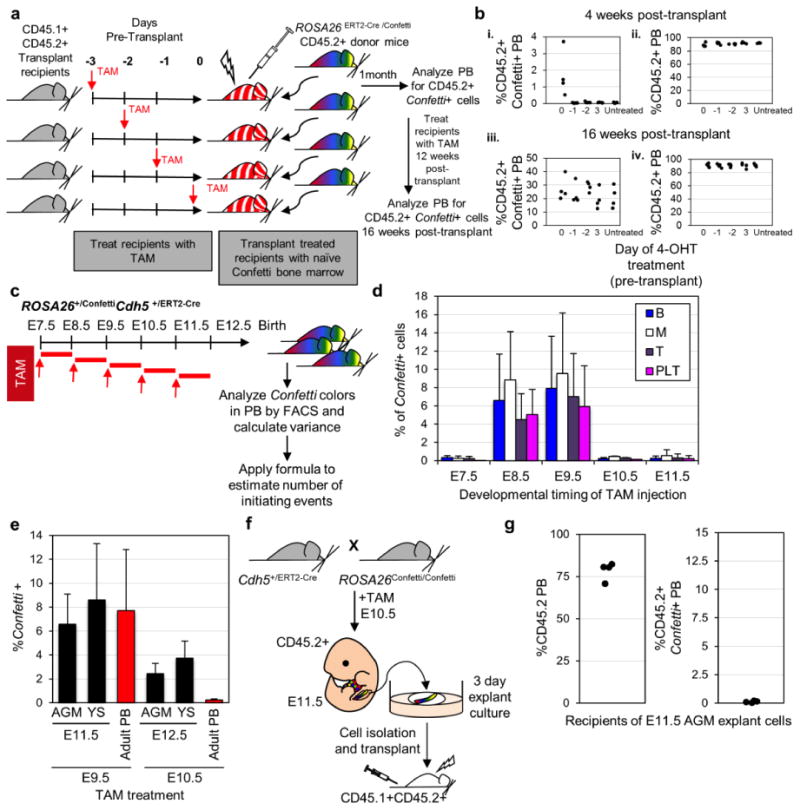
a, Experimental schematic. ROSA26ERT2-Cre /Confetti (CD45.2+) WBM was transplanted into irradiated CD45.1+CD45.2+ mice treated with a single dose of TAM at 3, 2, 1, or 0 days pre-transplant (n=4 for each time-point). Recipients were treated again with five doses of TAM 12 weeks post-transplant. b, i) Confetti label in CD45.2+ PB of transplant recipients 4 weeks post-transplant. ii) CD45.2+ PB cells in transplant recipients 4 weeks post-transplant. iii) Confetti label in PB of transplant recipients treated again with TAM 12 weeks post-transplant. iv) PB CD45.2+ cells of transplant recipients treated again with TAM 12 weeks post-transplant. c, 10 week old ROSA26+/ConfettiCdh5+/ERT2-Cre mice were analyzed for Confetti label after exposure to a single dose of TAM at E7.5 (n=6), E8.5 (n=5), E9.5 (n=7), E10.5 (n=5) and E11.5 (n=3, which were 0.03, 0.69, 0.3% Confetti+ of total white cells). ≥Two independent litters were analyzed in each cohort. d, % Confetti label at 10 weeks of age in PB lineages of ROSA26+/ConfettiCdh5+/ERT2-Cre mice exposed to TAM during gestation. Error bars indicate ± s.d. of mean (Supplementary Table 5). e, Confetti labeling in VE-Cadherin+ endothelial cells in the AGM and YS; and in adult PB cells isolated from ROSA26+/ConfettiCdh5+/ERT2-Cre mice exposed to TAM during gestation (Supplementary Table 5). f, Dams pregnant with CD45.2+ ROSA26+/ConfettiCdh5+/ERT2-Cre embryos were treated with a single dose of TAM at E10.5. At E11.5, AGMs were collected (n=4), cultured as explants, and then transplanted. g, %CD45.2+ and %CD45.2+Confetti+ PB of recipients of ROSA26+/ConfettiCdh5+/ERT2-Cre AGM explant cells four weeks post-transplant (Supplementary Table 5).
Many c-Kit+ intra-aortic clusters are polyclonal
Finally, we investigated the clonality of intra-aortic hematopoietic clusters (IACs) by examining the dorsal aorta of E11.5 ROSA26+/ConfettiVE-Cadherin+/Cre mice (Fig. 6a). Here, among c-Kit+ clusters harboring at least one Confetti color, 38/50 IACs ≥3 cells/cluster were a mixture of unlabeled cells and cells expressing distinct Confetti-colors (Fig. 6b, Supplementary Fig. 4 and 5a). These data suggest a polyclonal origin for many IACs. As polychromatic IACs could result from ongoing CRE activity, we examined CRE expression in VE-Cadherin+CD45- Confetti+ and Confetti- cells isolated from ROSA26+/ConfettiVE-Cadherin+/Cre E8.5 embryos, E9.5 caudal halves or E10.5 AGMs via qRT-PCR. We observed that CRE mRNA increased from E8.5 to E10.5 (Supplementary Fig. 5b). To functionally examine the likelihood of ongoing CRE activity in Confetti+ and Confetti- cells, VE-cadherin+CD45- Confetti-, CFP+, YFP+, or RFP+ cells were isolated by flow cytometry from E10.5 ROSA26+/ConfettiVE-Cadherin+/Cre embryos, cultured for seven days, and then analyzed for Confetti-labeling (Supplementary Fig. 5c and d). Cultured Confetti- cells remained Confetti- (Supplementary Fig. 5d). Expanded YFP+, CFP+, and RFP+ cultures were composed nearly entirely of cells expressing the original Confetti-color plated (Supplementary Fig. 5d). These data suggest that color identity is fixed by E10.5 and are consistent with the idea that polyclonal clusters do not result from ongoing CRE activity post-specification. However, to definitively rule out this possibility, we examined c-Kit+ IACs in E11.5 ROSA26+/ConfettiCdh5+/ERT2-Cre embryos treated with TAM at E7.5 and E8.5. Here, we also observed clusters composed of a mixture of unlabeled and Confetti+ cells, further supporting that many IACs are polyclonal (Fig. 6a).
Figure 6. Intra-aortic cell clusters are polyclonal in origin.
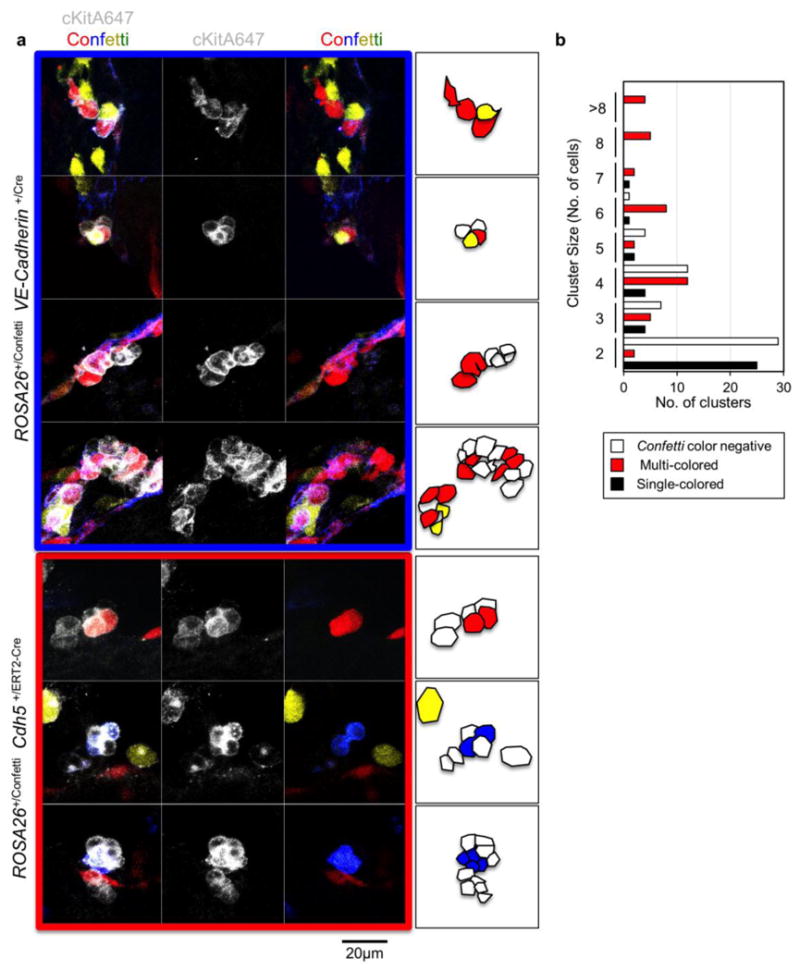
a, Analysis of c-Kit+Confetti+ intra-aortic clusters in E10.5 and E11.5 AGMs isolated from ROSA26+/ConfettiVE-Cadherin+/Cre embryos or ROSA26+/ConfettiCdh5+/ERT2-Cre embryos exposed to TAM at E7.5 and E8.5 of gestation. b, E10.5 and E11.5 ROSA26+/Confetti VE-Cadherin+/Cre intra-aortic clusters classified by size and cell composition. (2-cell clusters, n=56; 3-cell clusters, n=16; 4-cell clusters, n=28; 5-cell clusters, n=8; 6-cell clusters, n=10; 7-cell clusters, n=3; 8-cell clusters, n=5; ≥8-cell clusters, n=4) (Supplementary Table 5).
Discussion
Recent studies have taken advantage of multicolor labeling to study unappreciated blood properties13,46. In zebrafish, a brainbow-based zebrabow system revealed that 30 HSC clones are present during peak production from aortic endothelium. Here, we analyze the clonal complexity of the emerging mammalian hematopoietic system using an approach that avoids transplantation, disruption or culture of the developing embryo. We observed that, within a defined range of initiating events (Fig. 1f), a linear relationship exists between the SSV in the distribution of Confetti allele-driven colors and the number of initially labeled cells. Via this approach, we estimated that between 600-700 developmental precursors contribute to life-long hematopoiesis. This is far greater than previous estimates of the frequency of HSC and HSPC precursors in the E10.5 and E11.5 AGM2-11,15. However, our data are consistent with the large number of IACs observed in E10.5 embryos (609±84 c-Kit+ cells in the dorsal aorta and about 300 in the vitelline and umbilical arteries)47. Our findings also agree with the rapid expansion (i.e. 200-fold) of nascent HSPCs during AGM explant culture (Fig. 2f, Table 1)37. Importantly, AGM explant culture likely underestimates this potential, as explant culture conditions are almost certainly sub-optimal relative to the in vivo specification niche. Further, transplantation-based methods of estimation yield a snap-shot view of the frequency of functional HSCs at a given point in time, while our approach captures the cumulative formation of nascent HSPCs that emerge and then exit the AGM. Perhaps more importantly, our approach did not require an artificial ex vivo niche or nascent HSCs to repopulate adult recipients. Indeed, newly specified E9.5 yolk sac and E10.5 AGM HSPCs are more readily functionally detected when transplanted into neonatal, rather than adult mice48-51. These studies strongly suggest that many nascent HSPCs have not yet acquired the ability to robustly engraft the adult BM microenvironment.
We also report that the specification of HE from endothelium occurs between E8.5 and E10.5 of murine development, after which it abruptly quenches and cannot be reactivated. Recent reports in zebrafish suggest the presence of an active cellular niche promoting the specification of nascent HSCs from the HE52. Our data suggest that a similar niche may also exist during mammalian development. It would be interesting to explore whether the abrupt quenching of HE specification results from an active mechanism of suppression or the passive loss of critical signals that cease or become distal as the embryo develops and grows.
Our study exposed several unexpected layers of active regulation of hematopoietic development. Importantly, our data suggest the presence of a developmental bottleneck in or downstream of the FL that restricts the number of cells contributing to life-long hematopoiesis. We speculate that this “bottleneck” could represent finite niche space capable of supporting the expanding FL HSPC pool or early BM. Further, the polyclonal nature of many IACs suggests that the cells that form these clusters may be highly migratory (i.e. IACs may result from the migration and coalescence of multiple nascent HSPC throughout the dorsal aorta or other sites of active hematopoietic specification). Interestingly, clusters composed of only two cells (and labeled with at least one Confetti-color) were nearly always monoclonal (25/27, Fig. 6b), suggesting that many nascent HSPCs divide shortly after specification from HE before incorporating into larger IACs. Although it was recently demonstrated that some cluster-derived cells are functional HSCs in vivo, more work is required to determine if each cell within a cluster contributes to life-long hematopoiesis53.
In sum, our data reveal unexpected layers of active regulation of hematopoietic development, including a developmental bottleneck in or downstream of the FL and an abrupt quenching in the recruitment of hemogenic endothelium. Remarkably, we reveal that life-long mammalian hematopoiesis is founded by hundreds of mesodermal and endothelial precursors during embryogenesis.
Supplementary Material
Supplementary Figure 1. Representative iCC Confetti analysis and Confetti-based estimate fidelity. a, CFP, GFP, YFP or mCherry positive HL60 cells were used as single color controls during flow cytometry Confetti analysis. b, Untreated and 4-OHT treated iCC cultures are shown to illustrate gating strategy for distinct Confetti colors. c, Results of computer simulation of variance in the proportion of Confetti colors across a range of starting cell numbers (10 to 10,000 cells) and a range of starting percentages of a given Confetti color. The Log10(CV) vs. Log10(cell number) is shown. Simulated data was fixed at each percentage and sampled 15,000 times for each sample size of each percentage. The resulting regression lines were stable with respect to slope (-0.5) across all percentages except the 10% simulation measured the minimumnumber of times (top line). d-e, Immortalized fibroblasts, like iCC's, are susceptible to polyploidy or chromosomal duplication during in vitro culture. Thus, a subset of cells acquire extra Confetti alleles and can be labeled with multiple Confetti colors after exposure to 4-OHT (e.g. RFP+CFP+ cells in b). d, About 2% of iCCs displayed >4N DNA content. e, Karyotype confirms presence of polyploid iCCs.
Supplementary Figure 2. Limiting dilution transplantation to assess fidelity of Confetti-based estimates, efficiency of Confetti labeling in adult PB of +/Cre mice and Log10(CV)s of Confetti frequency in AGM explant recipient PB. a, 5×10⁶-2×10⁴CD45.2+ROSA26+/ConfettiFlk1+/Cre WBM was transplanted at limiting dilution into irradiated CD45.1+CD45.2+mice along with 2×10⁵ CD45.1+ WBM cells (see also Fig. 2c). Total CD45.2+ PB chimerism 16 weeks post-transplant is indicated. Black dots represent individual engrafted recipients and red dots represent individual non-cngraftcd recipients. b, LDA was applied to estimate number of repopulating units (RUs). The data fit well the LDA assumption (Pearson Chi-square and Deviance Chi-square >0.05). c, Average Confetti labeling efficiency in adult PB of ROSA26+/Confetti+/Cre mice. ROSA26+/ConfettiE2a+/Cre (E2aCre, n= 13), ROSA26+/ConfettiFlk1+/Cre (Flk1Cre, n= 7), ROSA26+/ConfettiVE-Cadherin+/Cre(VE-CadherinCre, n= 12), ROSA26+/ConfettiVav1+/Cre (Vav1Cre, n= 10), ROSA26+/ConfettiUbiquitin+/ERT2-Cre (UbiquitinERT2-Cre) treated at E7.5 (n=5) or E8.5 (n=6) and ROSA26+/Confetti Cdh5+/ERT2-Cre (Cdh5ERT2-Cre) treated at E8.5 (n=5) or E9.5 (n=7). Error bars indicate ± s.d. of mean a-c (Supplementary Table 5). d, Log10(CV) of sample-to-sample variance in Confetti color distribution in CD45.2+ PB of recipients of 1.0EE AGM explant-derived cells at 16 weeks post-Transplant (Supplementary Table 4).
Supplementary Figure 3. Distribution of Confettilabeling and representative Confetti gating in +/Cre mice a, Average Confetti color frequencies in adult PB of +/Cre mice at 10-16 weeks of age. Error bars denote s.d. of the mean among mice. b, Representative gating of Confetti colors in PB myeloid cells, B-cells, T-cells, and platelets. A ROSA26ERT2-Cre/Confetti mouse and a ROSA26+/Confetti mousc are shown. c, The average distribution of Confetti colors was similar in PB B-cells (B), T-cells (T), myeloid cells (M), and platelets (Plt) for all +/Cre mice examined. For panels a and c, ROSA26+/Confetti E2a+/Cre (E2aCre, n= 13), ROSA26 +/Confetti Flk1+/Cre (Flk1Cre, n=7), ROSA26+/Confetti VE-Cadkerin+/Cre(VE-CadherinCre, n= 12), ROSA26+/ConfettiVav1+/Cre mice (Vav1Cre, n= 10). a,c, (Supplementary Table 4). d, Confetti labeling of PB B cells in five individual adult ROSA26+/ConfettiE2a+/Cre mice to show the high variability in Confetti color distribution between mice in this cohort. Note: Mouse #1 and Mouse #2 display largely only one Confetti color in their PB, reflective of activity of E2a-Cre early in development. e-f, Confetti-labeling in tissues derived from all three germ layers are shown. Note, here, only YFP+ cells are detectable, reflecting early allele recombination in development.
Supplementary Figure 4. Intra-aortic cell clusters are polyclonal in origin. Extended images of the same intra-aortic cell clusters shown Fig. 6. For better appreciation, all single colors are shown here.
Supplementary Figure 5. Analysis of Confettifluorescence in intra-aortic cell clusters, CRE expression in VE-Cadherin+/Cre embryos and Confetti color stability in embryo-derived cells. a, Extended image of the same intra-aortic cell cluster shown in the second row of Fig. 5a and Supplemental Fig. 5 to illustrate non-specific GFP signal. Green arrow denotes true GFP+ cells while white arrow denotes non-specific GFP signal. b, qRT-PCR for CRE expression in Confetti+ and Confetti- VE-Cadherin+CD45- cells isolated from E8.5, E9.5, or E10.5 ROSA26+/Confetti VE-Cadherin+/Cre and ROSA26+/Confetti VE-Cadherin+/+ embryos. Here, iCCs were used as a positive control for CRE expression. mRNA relative expression levels were normalized to CRE expression in iCCs. Each bar represents an independent biological replicate generated after pooling the indicated embryonic tissue from embryos of the indicated genotypes in different experiments. mRNA extraction, cDNA generation and qRT-PCR were run at the same time for all samples. c, Experimental schematic. YFP+, CFP+, RFP+ or Confetti- VE-Cadherin+CD45- cells were collected by FACS from E10.5 ROSA26+/Confetti VE-Cudherin+/Cre embryos and then co-cultured with OP9 stromal cells for seven days. Cultures were then analyzed by flow cytometry for Confetti colors. d, Distribution of Confetti colors in cultures of YFP+, CFP+, RFP+ or Confetti- VE-Cadhcrin+ CD45- E10.5 ROSA26+/Confetti VE-Cadherin+/Cre cells co-cultured for seven days on OP9 stroma. b and d, Supplementary Table 5.
Supplementary Figure 6. Unprocessed scan related to gel on Figure 4c.
Acknowledgments
We thank W. Clements, P. Holmfeldt, F. Camargo, S. Patel, L. Grimes, B. Hadland, I. Bernstein and the McKinney-Freeman laboratory and Department of Hematology at St. Jude Children's Research Hospital (St. Jude) for critical discussions and reading of the manuscript; D. Ashmun, S. Schwemberger, and J. Laxton for FACS support; C. Davis-Goodrum, Krista Millican and C. Savage for help with injections and timed pregnancies; V. Frohlich and J. Peters for help with confocal imaging; Cdh5+/ERT2-Cre mice were a gift from the laboratory of Dr. Ralf Adams (Max Planck Institute for Molecular Biomedicine, Germany) by way of Dr. Ann Zovein (UCSF, CA USA). Vav1-Cre+/T mice were a gift from the laboratory of Thomas Graf (Center for Genomic Regulation, Spain) by way of Dr. Nancy Speck (University of Pennsylvania, PA USA). VE-Cadherin-Cre+/T mice were a gift from the laboratory of Dr. Guillermo Oliver (Northwestern University, IL USA). This work was supported by the American Society of Hematology (S.M.-F.), the Hartwell Foundation (S.M.-F.), the NIDDK (K01DK080846 and R01DK104028, S.M.-F.), the American Lebanese Syrian Associated Charities (ALSAC) (S.M.-F. and St. Jude Cell & Tissue Imaging Center), and the NCI (P30 CA021765-35, SJCRH Cell & Tissue Imaging Center). The St. Jude Cancer Center Core Cytogenetics laboratory is supported by the National Cancer Institute at the National Institute of Health, (P30 CA21765) and ALSAC.
Footnotes
Supplementary Information is linked to the online version of the paper at www.nature.com/nature.
Author Contributions: M.G. designed the study, analyzed Confetti mice, generated and performed iCC experiments, analyzed intra-aortic clusters, performed and analyzed transplants, collected and analyzed data, and wrote the paper. T.H. performed and analyzed transplants, contributed to study design, and analyzed data. D.F. performed computer simulations to derive the formula for estimating cell numbers, analyzed data, contributed to study design, and wrote relevant sections of paper. A.C. analyzed Confetti+ blood and resulting data, G.K. performed statistical analyses, S.M.-F. designed the study, analyzed data, and wrote the paper. All authors discussed the results and commented on the manuscript.
Author Information: Reprints and permissions information is available at www.nature.com/reprints. The authors declare competing financial interests: details accompany the full-text HTML version of the paper at www.nature.com/nature.
References
- 1.Medvinsky A, Rybtsov S, Taoudi S. Embryonic origin of the adult hematopoietic system: advances and questions. Development. 2011;138:1017–1031. doi: 10.1242/dev.040998. doi:138/6/1017[pii]10.1242/dev.040998. [DOI] [PubMed] [Google Scholar]
- 2.Kumaravelu P, et al. Quantitative developmental anatomy of definitive haematopoietic stem cells/long-term repopulating units (HSC/RUs): role of the aorta-gonad-mesonephros (AGM) region and the yolk sac in colonisation of the mouse embryonic liver. Development. 2002;129:4891–4899. doi: 10.1242/dev.129.21.4891. [DOI] [PubMed] [Google Scholar]
- 3.Medvinsky A, Dzierzak E. Definitive hematopoiesis is autonomously initiated by the AGM region. Cell. 1996;86:897–906. doi: 10.1016/s0092-8674(00)80165-8. doi:S0092-8674(00)80165-8 [pii] [DOI] [PubMed] [Google Scholar]
- 4.Muller AM, Medvinsky A, Strouboulis J, Grosveld F, Dzierzak E. Development of hematopoietic stem cell activity in the mouse embryo. Immunity. 1994;1:291–301. doi: 10.1016/1074-7613(94)90081-7. [DOI] [PubMed] [Google Scholar]
- 5.de Bruijn MF, Speck NA, Peeters MC, Dzierzak E. Definitive hematopoietic stem cells first develop within the major arterial regions of the mouse embryo. EMBO J. 2000;19:2465–2474. doi: 10.1093/emboj/19.11.2465. [DOI] [PMC free article] [PubMed] [Google Scholar]
- 6.Gekas C, Dieterlen-Lievre F, Orkin SH, Mikkola HK. The placenta is a niche for hematopoietic stem cells. Dev Cell. 2005;8:365–375. doi: 10.1016/j.devcel.2004.12.016. doi:S1534-5807(04)00468-X[pii] 10.1016/j.devcel.2004.12.016. [DOI] [PubMed] [Google Scholar]
- 7.Gordon-Keylock S, Sobiesiak M, Rybtsov S, Moore K, Medvinsky A. Mouse extraembryonic arterial vessels harbor precursors capable of maturing into definitive HSCs. Blood. 2013;122:2338–2345. doi: 10.1182/blood-2012-12-470971. [DOI] [PMC free article] [PubMed] [Google Scholar]
- 8.Mikkola HK, Gekas C, Orkin SH, Dieterlen-Lievre F. Placenta as a site for hematopoietic stem cell development. Exp Hematol. 2005;33:1048–1054. doi: 10.1016/j.exphem.2005.06.011. doi:S0301-472X(05)00293-6 [pii] 10.1016/j.exphem.2005.06.011. [DOI] [PubMed] [Google Scholar]
- 9.Ottersbach K, Dzierzak E. The murine placenta contains hematopoietic stem cells within the vascular labyrinth region. Dev Cell. 2005;8:377–387. doi: 10.1016/j.devcel.2005.02.001. [DOI] [PubMed] [Google Scholar]
- 10.Robin C, et al. Human placenta is a potent hematopoietic niche containing hematopoietic stem and progenitor cells throughout development. Cell Stem Cell. 2009;5:385–395. doi: 10.1016/j.stem.2009.08.020. [DOI] [PMC free article] [PubMed] [Google Scholar]
- 11.Yoder MC, Hiatt K. Engraftment of embryonic hematopoietic cells in conditioned newborn recipients. Blood. 1997;89:2176–2183. [PubMed] [Google Scholar]
- 12.Bertrand JY, et al. Haematopoietic stem cells derive directly from aortic endothelium during development. Nature. 2010;464:108–111. doi: 10.1038/nature08738. doi:nature08738 [pii] 10.1038/nature08738. [DOI] [PMC free article] [PubMed] [Google Scholar]
- 13.Henninger J, et al. Clonal fate mapping quantifies the number of haematopoietic stem cells that arise during development. Nat Cell Biol. 2017;19:17–27. doi: 10.1038/ncb3444. [DOI] [PMC free article] [PubMed] [Google Scholar]
- 14.Kissa K, Herbomel P. Blood stem cells emerge from aortic endothelium by a novel type of cell transition. Nature. 2010;464:112–115. doi: 10.1038/nature08761. doi:nature08761 [pii] 10.1038/nature08761. [DOI] [PubMed] [Google Scholar]
- 15.Rybtsov S, Ivanovs A, Zhao S, Medvinsky A. Concealed expansion of immature precursors underpins acute burst of adult HSC activity in foetal liver. Development. 2016;143:1284–1289. doi: 10.1242/dev.131193. [DOI] [PMC free article] [PubMed] [Google Scholar]
- 16.Busch K, et al. Fundamental properties of unperturbed haematopoiesis from stem cells in vivo. Nature. 2015 doi: 10.1038/nature14242. [DOI] [PubMed] [Google Scholar]
- 17.Schoedel KB, et al. The bulk of the hematopoietic stem cell population is dispensable for murine steady-state and stress hematopoiesis. Blood. 2016 doi: 10.1182/blood-2016-03-706010. [DOI] [PubMed] [Google Scholar]
- 18.Sun J, et al. Clonal dynamics of native haematopoiesis. Nature. 2014;514:322–327. doi: 10.1038/nature13824. [DOI] [PMC free article] [PubMed] [Google Scholar]
- 19.Snippert HJ, et al. Intestinal crypt homeostasis results from neutral competition between symmetrically dividing Lgr5 stem cells. Cell. 2010;143:134–144. doi: 10.1016/j.cell.2010.09.016. [DOI] [PubMed] [Google Scholar]
- 20.Harrison DE, Astle CM, Lerner C. Number and continuous proliferative pattern of transplanted primitive immunohematopoietic stem cells. Proc Natl Acad Sci U S A. 1988;85:822–826. doi: 10.1073/pnas.85.3.822. [DOI] [PMC free article] [PubMed] [Google Scholar]
- 21.Abkowitz JL, Golinelli D, Harrison DE, Guttorp P. In vivo kinetics of murine hemopoietic stem cells. Blood. 2000;96:3399–3405. [PubMed] [Google Scholar]
- 22.Chen J, Astle CM, Harrison DE. Development and aging of primitive hematopoietic stem cells in BALB/cBy mice. Exp Hematol. 1999;27:928–935. doi: 10.1016/s0301-472x(99)00018-1. [DOI] [PubMed] [Google Scholar]
- 23.Harrison DE, Astle CM, Stone M. Numbers and functions of transplantable primitive immunohematopoietic stem cells. Effects of age. J Immunol. 1989;142:3833–3840. [PubMed] [Google Scholar]
- 24.Zhong RK, Astle CM, Harrison DE. Distinct developmental patterns of short-term and long-term functioning lymphoid and myeloid precursors defined by competitive limiting dilution analysis in vivo. J Immunol. 1996;157:138–145. [PubMed] [Google Scholar]
- 25.Rios AC, Fu NY, Lindeman GJ, Visvader JE. In situ identification of bipotent stem cells in the mammary gland. Nature. 2014;506:322–327. doi: 10.1038/nature12948. [DOI] [PubMed] [Google Scholar]
- 26.Chen MJ, Yokomizo T, Zeigler BM, Dzierzak E, Speck NA. Runx1 is required for the endothelial to haematopoietic cell transition but not thereafter. Nature. 2009;457:887–891. doi: 10.1038/nature07619. doi:nature07619 [pii] 10.1038/nature07619. [DOI] [PMC free article] [PubMed] [Google Scholar]
- 27.Boggs DR, Boggs SS, Saxe DF, Gress LA, Canfield DR. Hematopoietic stem cells with high proliferative potential. Assay of their concentration in marrow by the frequency and duration of cure of W/Wv mice. J Clin Invest. 1982;70:242–253. doi: 10.1172/JCI110611. [DOI] [PMC free article] [PubMed] [Google Scholar]
- 28.Cho RH, Sieburg HB, Muller-Sieburg CE. A new mechanism for the aging of hematopoietic stem cells: aging changes the clonal composition of the stem cell compartment but not individual stem cells. Blood. 2008;111:5553–5561. doi: 10.1182/blood-2007-11-123547. [DOI] [PMC free article] [PubMed] [Google Scholar]
- 29.Szilvassy SJ, Humphries RK, Lansdorp PM, Eaves AC, Eaves CJ. Quantitative assay for totipotent reconstituting hematopoietic stem cells by a competitive repopulation strategy. Proc Natl Acad Sci U S A. 1990;87:8736–8740. doi: 10.1073/pnas.87.22.8736. [DOI] [PMC free article] [PubMed] [Google Scholar]
- 30.Kiel MJ, Yilmaz OH, Iwashita T, Terhorst C, Morrison SJ. SLAM family receptors distinguish hematopoietic stem and progenitor cells and reveal endothelial niches for stem cells. Cell. 2005;121:1109–1121. doi: 10.1016/j.cell.2005.05.026. doi:S0092-8674(05)00540-4 [pii] 10.1016/j.cell.2005.05.026. [DOI] [PubMed] [Google Scholar]
- 31.Sieburg HB, et al. The hematopoietic stem compartment consists of a limited number of discrete stem cell subsets. Blood. 2006;107:2311–2316. doi: 10.1182/blood-2005-07-2970. [DOI] [PMC free article] [PubMed] [Google Scholar]
- 32.Sudo K, Ema H, Morita Y, Nakauchi H. Age-associated characteristics of murine hematopoietic stem cells. J Exp Med. 2000;192:1273–1280. doi: 10.1084/jem.192.9.1273. [DOI] [PMC free article] [PubMed] [Google Scholar]
- 33.Trevisan M, Yan XQ, Iscove NN. Cycle initiation and colony formation in culture by murine marrow cells with long-term reconstituting potential in vivo. Blood. 1996;88:4149–4158. [PubMed] [Google Scholar]
- 34.Jordan CT, Lemischka IR. Clonal and systemic analysis of long-term hematopoiesis in the mouse. Genes Dev. 1990;4:220–232. doi: 10.1101/gad.4.2.220. [DOI] [PubMed] [Google Scholar]
- 35.Purton LE, Scadden DT. Limiting factors in murine hematopoietic stem cell assays. Cell Stem Cell. 2007;1:263–270. doi: 10.1016/j.stem.2007.08.016. [DOI] [PubMed] [Google Scholar]
- 36.Yang L, et al. Identification of Lin(-)Sca1(+)kit(+)CD34(+)Flt3- short-term hematopoietic stem cells capable of rapidly reconstituting and rescuing myeloablated transplant recipients. Blood. 2005;105:2717–2723. doi: 10.1182/blood-2004-06-2159. [DOI] [PubMed] [Google Scholar]
- 37.Taoudi S, et al. Extensive hematopoietic stem cell generation in the AGM region via maturation of VE-cadherin+CD45+ pre-definitive HSCs. Cell Stem Cell. 2008;3:99–108. doi: 10.1016/j.stem.2008.06.004. doi:S1934-5909(08)00283-X [pii] 10.1016/j.stem.2008.06.004. [DOI] [PubMed] [Google Scholar]
- 38.Lakso M, et al. Efficient in vivo manipulation of mouse genomic sequences at the zygote stage. Proc Natl Acad Sci U S A. 1996;93:5860–5865. doi: 10.1073/pnas.93.12.5860. [DOI] [PMC free article] [PubMed] [Google Scholar]
- 39.Motoike T, Markham DW, Rossant J, Sato TN. Evidence for novel fate of Flk1+ progenitor: contribution to muscle lineage. Genesis. 2003;35:153–159. doi: 10.1002/gene.10175. [DOI] [PubMed] [Google Scholar]
- 40.Stadtfeld M, Graf T. Assessing the role of hematopoietic plasticity for endothelial and hepatocyte development by non-invasive lineage tracing. Development. 2005;132:203–213. doi: 10.1242/dev.01558. [DOI] [PubMed] [Google Scholar]
- 41.Ruzankina Y, et al. Deletion of the developmentally essential gene ATR in adult mice leads to age-related phenotypes and stem cell loss. Cell Stem Cell. 2007;1:113–126. doi: 10.1016/j.stem.2007.03.002. [DOI] [PMC free article] [PubMed] [Google Scholar]
- 42.Bowie MB, et al. Hematopoietic stem cells proliferate until after birth and show a reversible phase-specific engraftment defect. J Clin Invest. 2006;116:2808–2816. doi: 10.1172/JCI28310. [DOI] [PMC free article] [PubMed] [Google Scholar]
- 43.Fleming WH, et al. Functional heterogeneity is associated with the cell cycle status of murine hematopoietic stem cells. J Cell Biol. 1993;122:897–902. doi: 10.1083/jcb.122.4.897. [DOI] [PMC free article] [PubMed] [Google Scholar]
- 44.Morrison SJ, Hemmati HD, Wandycz AM, Weissman IL. The purification and characterization of fetal liver hematopoietic stem cells. Proc Natl Acad Sci U S A. 1995;92:10302–10306. doi: 10.1073/pnas.92.22.10302. [DOI] [PMC free article] [PubMed] [Google Scholar]
- 45.Wang Y, et al. Ephrin-B2 controls VEGF-induced angiogenesis and lymphangiogenesis. Nature. 2010;465:483–486. doi: 10.1038/nature09002. [DOI] [PubMed] [Google Scholar]
- 46.Yu VW, et al. Epigenetic Memory Underlies Cell-Autonomous Heterogeneous Behavior of Hematopoietic Stem Cells. Cell. 2016;167:1310–1322 e1317. doi: 10.1016/j.cell.2016.10.045. [DOI] [PubMed] [Google Scholar]
- 47.Yokomizo T, Dzierzak E. Three-dimensional cartography of hematopoietic clusters in the vasculature of whole mouse embryos. Development. 2010;137:3651–3661. doi: 10.1242/dev.051094. [DOI] [PMC free article] [PubMed] [Google Scholar]
- 48.Yoder MC, et al. Characterization of definitive lymphohematopoietic stem cells in the day 9 murine yolk sac. Immunity. 1997;7:335–344. doi: 10.1016/s1074-7613(00)80355-6. doi:S1074-7613(00)80355-6 [pii] [DOI] [PubMed] [Google Scholar]
- 49.Yoder MC, Hiatt K, Mukherjee P. In vivo repopulating hematopoietic stem cells are present in the murine yolk sac at day 9.0 postcoitus. Proc Natl Acad Sci U S A. 1997;94:6776–6780. doi: 10.1073/pnas.94.13.6776. [DOI] [PMC free article] [PubMed] [Google Scholar]
- 50.Fraser ST, Ogawa M, Yu RT, Nishikawa S, Yoder MC. Definitive hematopoietic commitment within the embryonic vascular endothelial-cadherin(+) population. Exp Hematol. 2002;30:1070–1078. doi: 10.1016/s0301-472x(02)00887-1. doi:S0301472X02008871 [pii] [DOI] [PubMed] [Google Scholar]
- 51.Arora N, et al. Effect of developmental stage of HSC and recipient on transplant outcomes. Dev Cell. 2014;29:621–628. doi: 10.1016/j.devcel.2014.04.013. [DOI] [PMC free article] [PubMed] [Google Scholar]
- 52.Damm EW, Clements WK. Pdgf signalling guides neural crest contribution to the haematopoietic stem cell specification niche. Nat Cell Biol. 2017 doi: 10.1038/ncb3508. [DOI] [PMC free article] [PubMed] [Google Scholar]
- 53.Boisset JC, et al. Progressive maturation toward hematopoietic stem cells in the mouse embryo aorta. Blood. 2015;125:465–469. doi: 10.1182/blood-2014-07-588954. [DOI] [PMC free article] [PubMed] [Google Scholar]
Associated Data
This section collects any data citations, data availability statements, or supplementary materials included in this article.
Supplementary Materials
Supplementary Figure 1. Representative iCC Confetti analysis and Confetti-based estimate fidelity. a, CFP, GFP, YFP or mCherry positive HL60 cells were used as single color controls during flow cytometry Confetti analysis. b, Untreated and 4-OHT treated iCC cultures are shown to illustrate gating strategy for distinct Confetti colors. c, Results of computer simulation of variance in the proportion of Confetti colors across a range of starting cell numbers (10 to 10,000 cells) and a range of starting percentages of a given Confetti color. The Log10(CV) vs. Log10(cell number) is shown. Simulated data was fixed at each percentage and sampled 15,000 times for each sample size of each percentage. The resulting regression lines were stable with respect to slope (-0.5) across all percentages except the 10% simulation measured the minimumnumber of times (top line). d-e, Immortalized fibroblasts, like iCC's, are susceptible to polyploidy or chromosomal duplication during in vitro culture. Thus, a subset of cells acquire extra Confetti alleles and can be labeled with multiple Confetti colors after exposure to 4-OHT (e.g. RFP+CFP+ cells in b). d, About 2% of iCCs displayed >4N DNA content. e, Karyotype confirms presence of polyploid iCCs.
Supplementary Figure 2. Limiting dilution transplantation to assess fidelity of Confetti-based estimates, efficiency of Confetti labeling in adult PB of +/Cre mice and Log10(CV)s of Confetti frequency in AGM explant recipient PB. a, 5×10⁶-2×10⁴CD45.2+ROSA26+/ConfettiFlk1+/Cre WBM was transplanted at limiting dilution into irradiated CD45.1+CD45.2+mice along with 2×10⁵ CD45.1+ WBM cells (see also Fig. 2c). Total CD45.2+ PB chimerism 16 weeks post-transplant is indicated. Black dots represent individual engrafted recipients and red dots represent individual non-cngraftcd recipients. b, LDA was applied to estimate number of repopulating units (RUs). The data fit well the LDA assumption (Pearson Chi-square and Deviance Chi-square >0.05). c, Average Confetti labeling efficiency in adult PB of ROSA26+/Confetti+/Cre mice. ROSA26+/ConfettiE2a+/Cre (E2aCre, n= 13), ROSA26+/ConfettiFlk1+/Cre (Flk1Cre, n= 7), ROSA26+/ConfettiVE-Cadherin+/Cre(VE-CadherinCre, n= 12), ROSA26+/ConfettiVav1+/Cre (Vav1Cre, n= 10), ROSA26+/ConfettiUbiquitin+/ERT2-Cre (UbiquitinERT2-Cre) treated at E7.5 (n=5) or E8.5 (n=6) and ROSA26+/Confetti Cdh5+/ERT2-Cre (Cdh5ERT2-Cre) treated at E8.5 (n=5) or E9.5 (n=7). Error bars indicate ± s.d. of mean a-c (Supplementary Table 5). d, Log10(CV) of sample-to-sample variance in Confetti color distribution in CD45.2+ PB of recipients of 1.0EE AGM explant-derived cells at 16 weeks post-Transplant (Supplementary Table 4).
Supplementary Figure 3. Distribution of Confettilabeling and representative Confetti gating in +/Cre mice a, Average Confetti color frequencies in adult PB of +/Cre mice at 10-16 weeks of age. Error bars denote s.d. of the mean among mice. b, Representative gating of Confetti colors in PB myeloid cells, B-cells, T-cells, and platelets. A ROSA26ERT2-Cre/Confetti mouse and a ROSA26+/Confetti mousc are shown. c, The average distribution of Confetti colors was similar in PB B-cells (B), T-cells (T), myeloid cells (M), and platelets (Plt) for all +/Cre mice examined. For panels a and c, ROSA26+/Confetti E2a+/Cre (E2aCre, n= 13), ROSA26 +/Confetti Flk1+/Cre (Flk1Cre, n=7), ROSA26+/Confetti VE-Cadkerin+/Cre(VE-CadherinCre, n= 12), ROSA26+/ConfettiVav1+/Cre mice (Vav1Cre, n= 10). a,c, (Supplementary Table 4). d, Confetti labeling of PB B cells in five individual adult ROSA26+/ConfettiE2a+/Cre mice to show the high variability in Confetti color distribution between mice in this cohort. Note: Mouse #1 and Mouse #2 display largely only one Confetti color in their PB, reflective of activity of E2a-Cre early in development. e-f, Confetti-labeling in tissues derived from all three germ layers are shown. Note, here, only YFP+ cells are detectable, reflecting early allele recombination in development.
Supplementary Figure 4. Intra-aortic cell clusters are polyclonal in origin. Extended images of the same intra-aortic cell clusters shown Fig. 6. For better appreciation, all single colors are shown here.
Supplementary Figure 5. Analysis of Confettifluorescence in intra-aortic cell clusters, CRE expression in VE-Cadherin+/Cre embryos and Confetti color stability in embryo-derived cells. a, Extended image of the same intra-aortic cell cluster shown in the second row of Fig. 5a and Supplemental Fig. 5 to illustrate non-specific GFP signal. Green arrow denotes true GFP+ cells while white arrow denotes non-specific GFP signal. b, qRT-PCR for CRE expression in Confetti+ and Confetti- VE-Cadherin+CD45- cells isolated from E8.5, E9.5, or E10.5 ROSA26+/Confetti VE-Cadherin+/Cre and ROSA26+/Confetti VE-Cadherin+/+ embryos. Here, iCCs were used as a positive control for CRE expression. mRNA relative expression levels were normalized to CRE expression in iCCs. Each bar represents an independent biological replicate generated after pooling the indicated embryonic tissue from embryos of the indicated genotypes in different experiments. mRNA extraction, cDNA generation and qRT-PCR were run at the same time for all samples. c, Experimental schematic. YFP+, CFP+, RFP+ or Confetti- VE-Cadherin+CD45- cells were collected by FACS from E10.5 ROSA26+/Confetti VE-Cudherin+/Cre embryos and then co-cultured with OP9 stromal cells for seven days. Cultures were then analyzed by flow cytometry for Confetti colors. d, Distribution of Confetti colors in cultures of YFP+, CFP+, RFP+ or Confetti- VE-Cadhcrin+ CD45- E10.5 ROSA26+/Confetti VE-Cadherin+/Cre cells co-cultured for seven days on OP9 stroma. b and d, Supplementary Table 5.
Supplementary Figure 6. Unprocessed scan related to gel on Figure 4c.