Abstract
G-quadruplexes are noncannonical four-stranded DNA or RNA structures formed by guanine-rich repeating sequences. Guanines nucleotides can hydrogen bond to form a planar tetrad structure. Such tetrads can stack to form quadruplexes of various molecularities with a variety of types of single-stranded loops joining the tetrads. High-resolution structures may be obtained by X-ray crystallography or NMR spectroscopy for quadruplexes formed by short (≈25 nt) sequences but these methods have yet to succeed in characterizing higher-order quadruplex structures formed by longer sequences. An integrated computational and experimental approach was implemented in our laboratory to obtain structural models for higher-order quadruplexes that might form in longer telomeric or promoter sequences. In our approach atomic-level models are built using folding principles gleaned from available high-resolution structures and then optimized by molecular dynamics. The program HYDROPRO is then used to construct bead models of these structures to predict experimentally testable hydrodynamic properties. Models are validated by comparison of these properties with measured experimental values obtained by analytical ultracentrifugation or other biophysical tools. This chapter describes our approach and practical procedures.
Introduction
The human genome has about 3 billion base pairs in its 23 pairs of chromosomes. Each chromosome has one long piece of DNA. Most of this DNA is in cannonical Watson-Crick duplex form, but certain sequences can adopt alternate forms such as three- or four-stranded structures called triplexes and quadruplexes, respectively. Quadruplex structures can form in guanine-rich repetitive sequences with the motif -GxNy GxNy GxNy GxNy-, with x>2 and y=1–7 (Lane, Chaires, Gray, & Trent, 2008). Strand segments in folded or assembled quadruplexes may be oriented in either parallel or antiparallel directions. Uni- and bimolecular quadruplexes feature stacked planar G-tetrads linked by single-stranded loops of various types. Quadruplex-forming sequences are highly conserved and are distributed nonrandomly in the genome (Huppert, 2008; Huppert & Balasubramanian, 2005, 2007). Telomeric and gene promoter sequences are particularly enriched in quadruplex-forming sequences. The structure and function of genomic quadruplexes are of great current interest and are under active investigation. X-ray crystallography and NMR spectroscopy have been used to study quadruplex structures formed by folding of short oligonucleotides sequences, with some 190 high-resolution structures deposited in the structural databases. These are, with few exceptions, single quadruplex structures (with or without bound ligands) that are either uni-, bi-, or tetramolecular and typically containing roughly 20 – 25 nt. The choice of these sequences for crystallographic or NMR studies is driven by expediency. Short pieces of DNA or RNA are chosen because they will crystallize or they contain few enough atoms to be tractable for structure determination by NMR studies. Such sequences are often arbitrarily clipped from their longer genomic contexts, and are then often manipulated or modified from their actual wild-type sequence in order to provide a more homogenous conformational distribution. Longer, unmodified genomic sequences might well form more complex higher-order quadruplex structures and methods are needed to explore that possibility.
Hydrodynamic bead modeling offers an approach for the structural characterization of biological macromolecules refractory to high-resolution methods (Byron, 2008: also see Chapter 8 of this volume). There are many possible approaches for constructing models, but Garcia de la Torre has provided the particularly useful HYDROPRO (Garcia de la Torre & Harding, 2013; Garcia De La Torre, Huertas, & Carrasco, 2000; Ortega, Amoros, & Garcia de la Torre, 2011) suite of programs to facilitate hydrodynamic bead modeling. HYDROPRO has been validated by studies of both short DNA oligonucleotides (Fernandes, Ortega, Lopez Martinez, & Garcia de la Torre, 2002) and of longer DNA polymers (Amorós, Ortega, & García de la Torre, 2011). Our laboratory has used HYDROPRO to study a variety of G-quadruplex structures. In an initial application, we showed that a parallel propeller-shaped quadruplex structure determined in crystals by X-ray diffraction did not predict hydrodynamic properties consistent with experimental values and was therefore not the predominant form in solution (Li, Correia, Wang, Trent, & Chaires, 2005). In contrast, an antiparallel basket quadruplex structure in Na+ solution determined by NMR spectroscopy predicted hydrodynamic properties fully consistent with experimentally determined values. Recently we reported a more extensive validation of HYDROPRO predictions for a variety of quadruplex structures obtained by NMR (Le, Buscaglia, Dean, Chaires, & Trent, 2013; Le, Dean, Buscaglia, Chaires, & Trent, 2014; Le et al., 2012; Miller et al., 2011). We have also used this approach to access higher-order quadruplex structures (Petraccone, Garbett, Chaires, & Trent, 2010; Petraccone et al., 2011; Petraccone, Trent, & Chaires, 2008). hTERT promoter sequences were explored by building plausible models, predicting their hydrodynamic properties and testing the predictions by comparison to measured biophysical properties (Chaires et al., 2014). These higher-order structures could not otherwise be determined by NMR or crystallography because of current limitations in methodology.
Figure 1 shows a schematic of our approach. The process begins on the computational side with either available structures taken from databases or constructed using principles obtained from relevant available structures. Structures are then optimized by molecular dynamics simulations. HYDROPRO software is then employed to construct bead models from which hydrodynamic properties may be calculated. On the experimental side, measurements are made using sequences identical to those used in the calculations to obtain actual values for hydrodynamic properties for comparison and validation. The sedimentation coefficient (S20,w) is the most convenient and useful parameter for comparisons, along with translational diffusion coefficients (Dt). Both of these may be readily obtained by analytical ultracentrifugation studies. We have on occasion used steady-state fluorescence anisotropy methods to estimate rotational diffusion coefficients (Dr) to provide an additional parameter for comparison. Fluorescence resonance energy transfer (FRET) methods could in principle be used to test models by measuring end-to-end distances or other distances (dFRET) between strategically placed FRET pairs. This chapter will describe the methods used at the various steps shown in Figure 1, with comments about key parameters needed for analysis and possible pitfalls and problems encountered all the way.
Figure 1.
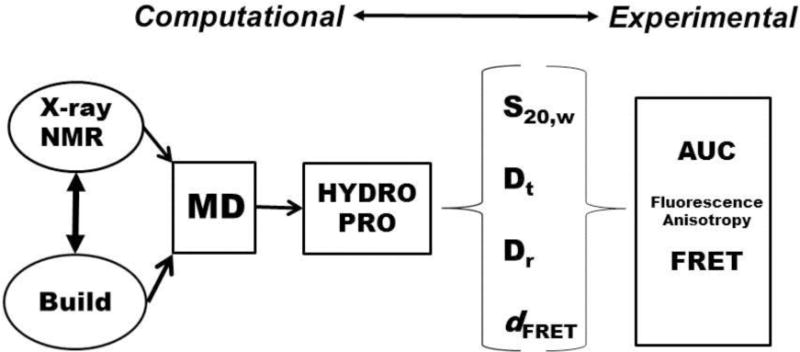
Work flow for hydrodynamic modeling of quadruplex structures.
Correlating Molecular Structure with Experimental Solution Hydrodynamic Measurements-General Comments
HYDROPRO is a program that calculates many hydrodynamic properties based on three-dimensional structure and hydrodynamic bead modeling. These properties include sedimentation and translational coefficients, intrinsic viscosity, rotational relaxation times, and the radius of gyration. The sedimentation coefficient (S20,w) is the most accessible to compare directly with the experimentally derived analytical ultracentrifugation measurement. Thus, we correlate an assumed structural model to actual experimental solution measurements. This is a powerful strategy to infer what structures are possible and, importantly, what structures are not possible in solution. It is important to note that this strategy cannot determine the detailed three-dimensional structure, but can only show what structures are consistent with the experimentally observed data, i.e. S20,w. We note that structures derived from X-ray crystallography and NMR spectroscopy are also only models, albeit models that are derived from a more extensive set of experimental constraints (reflection intensities and angles or distance constraints). In the case of molecular models, it is logical to build with known structural topologies and work with combinations of such. The limitation of this approach is that we may not have three-dimensional structural examples of all possible quadruplex topologies. This in itself can be useful in identifying that a sequence forms a yet unidentified topology. This was the case in our initial report (Li, et al., 2005) on this approach investigating the human telomere sequence. We had shown that the crystal structure of d[AGGG(TTAGGG)3] was not the predominant form in solution, but also that the other known topologies were not the best fit either. Subsequently, the hybrid 1 (Ambrus et al., 2006)and 2 (Luu, Phan, Kuryavyi, Lacroix, & Patel, 2006) topologies were reported and are well correlated with the experimental S20,w. It can be seen in Figure 2 that the parallel form of the human telomere and hybrid-1 have dramatically different shape, which leads to different hydrodynamic properties and hydrodynamic bead models.
Figure 2. Hydrodynamic bead modeling of the human quadruplex hybrid-1 and parallel forms.
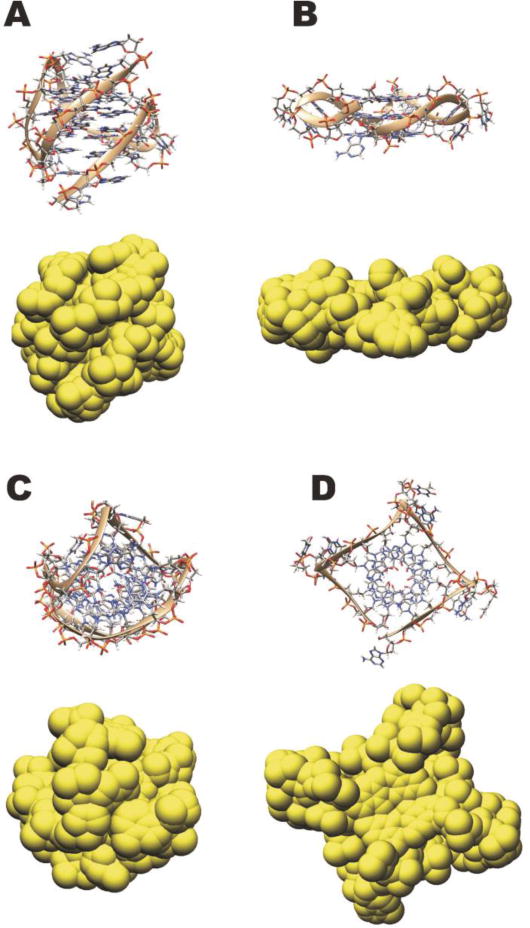
Side view of hybrid-1 form (2HY9.pdb)(A) and parallel form (1KF1.pdb)(B) in structural representations with the hydrodynamic bead model below. Top view of hybrid-1 form (2HY9.pdb)(C) and parallel form (1KF1.pdb)(D) in structural representations with the hydrodynamic bead model below.
HYDROPRO Software
The software package HYDROPRO is available for download at: http://leonardo.inf.um.es/macromol/programs/hydropro/hydropro.htm. It is available as a Windows or Unix binary executable file and the two required files to run it are the binary executable and a text input file “hydropro.dat”.
Getting Structure Files and Building Models
The structure files for known structures are available from the Protein Databank (www.pdb.org) or the Nucleic Acids Database (ndbserver.rutgers.edu) in PDB format.
Software for model building
The initial models can be constructed in any modeling software package that has the following features: 1) it is able to read a PDB formatted file correctly, 2) it can create standard DNA/RNA bases and strands, 3) it can perform minimization/implicitly solvated molecular dynamics of the structures, 4) it can freeze regions of the structure during minimization/implicitly solvated molecular dynamics (for example the quartet guanines constrained/restrained when minimizing new loop configurations), and 5) it can write a correctly formatted PDB file. Our model building software preference is the Schrodinger Maestro package and Macromodel, although we use our in-house program DNAsar to take any DNA-containing PDB file and correctly format the bases in order with correct atom names and connectivity. Maestro does not automatically do this. We subsequently optimize the models by running fully solvated molecular dynamics using the AMBER suite (D.A. Case et al., 2014; D. A. Case et al., 2005) of programs (leap, sander, and pmemd, current version 14). Numerous errors will occur in leap if the PDB file does not have the correct atoms names and connectivity.
Protocol for running HYDROPRO on quadruplex nucleic acid structure files
Obtain a structure file in PDB format. This can either be from X-ray crystallography, NMR, or from a constructed molecular model.
Strip the PDB file of non-nucleic acid components unless they are part of what you are actually observing in solution. If it is a NMR-derived file, separate out individual entries and run individually. When dealing with PDB files it is important to check the files carefully, including the addition of hydrogen atoms to X-ray crystal structures, missing bases, or dual occupancy. Do not automatically assume the PDB file is correct and complete.
Calculate the molecular weight of the nucleotide in the PDB file. For quadruplex DNA, add the mass for the central quartet coordinated ions, i.e. K+ or Na+ to the molecular weight.
Change the Name and molecular weight variables in the hydropro.dat file (in bold in Figure 3).
Run HYDROPRO with the following default hydropro.dat file (Figure 3) for an atomic-level primary model shell calculation. This has been shown (Le, et al., 2014) to reproduce the experimental values within 2% error.
The summary of input data and the results, including the sedimentation coefficient value, is in the Name-res.txt output file. The primary hydrodynamic model is in the PDB-formatted file Name-pri.bea and VRML-formatted file Name-pri.vrml file.
f/f0 can be calculated by dividing the translational equivalent radii by the volume, although we find that this is less useful than the S20,w.
Figure 3.
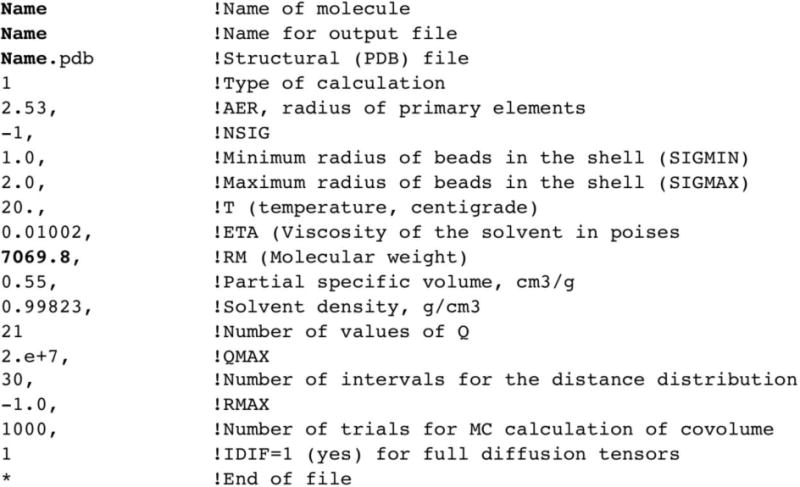
Example of a “hydropro.dat” file with typical values for modeling quadruplex structures.
An example of an actual quadruplex HYDROPRO data file is shown in Figure 3, with comments.
The standard parameters for an aqueous solvated system are given in Figure 3. We have successfully applied this strategy to quadruplex-forming sequences from the human telomere to several promoter regions. The hydrodynamic radius of the elements in the atomic level primary shell model (Type of calculation =1) of AER=2.53 was parameterized using extensive simulations (Le, et al., 2014) of the different morphologies of the human telomere quadruplex. The default value of AER=2.9 was recommended for standard protein analysis.
Extending the Static Hydrodynamic Bead Modeling By Analyzing Molecular Dynamics Trajectories
Molecular dynamics trajectories can be analyzed to obtain a representative distribution of sedimentation coefficient values by extracting the frames into individual PDB files and consecutively running HYDROPRO calculations. This can be easily automated by scripting a loop around the trajectory coordinate extraction and the HYDROPRO calculation as only the Name variable changes in the required hydropro.dat file for trajectory analysis. For example, an AMBER pmemd molecular dynamics trajectory can be analyzed by looping the extraction of the nucleic acid residues into a PDB file from the mdcrd file using cpptraj with the desirable start, stop, and offset values to sample the trajectory, and subsequently running HYDROPRO on the individual PDB files. Care should be taken over the looped Name variable so that it is consecutive under unix commands if the trajectory is to analyzed with respect to time. Please note that while there is no limit to the number of atoms used in HYDROPRO, operating system and memory limitations may become an issue on larger systems. Another useful analysis is to cluster the trajectory and obtain representative sedimentation coefficient values for the different resident substates and compare with experimental data (Le, et al., 2014). This can be performed in two ways to generate useful information. The first is to cluster structurally by RMSD and determine the range of sedimentation coefficient values associated with a substate cluster. The second is to cluster by sedimentation coefficient values to obtain sets of conformations that are consistent with the range of values.
We have used these methods to examine the reported structural forms of the human telomere sequence, Figure 4. The distributions of the calculated (red and blue) and measured S20,w are in close agreement. There are two major outliers, 143D and 1KF1. The 143D structure was obtained under sodium buffer conditions, and in fact the sequence sediments with an experimental S20,w of 1.97 in potassium buffer, in close agreement with the predicted value. The distributions for the human parallel form 1KF1, Figure 4B, are not in agreement and this reproduces the original observation that the human telomere parallel form is not the predominant form in solution.
Figure 4.
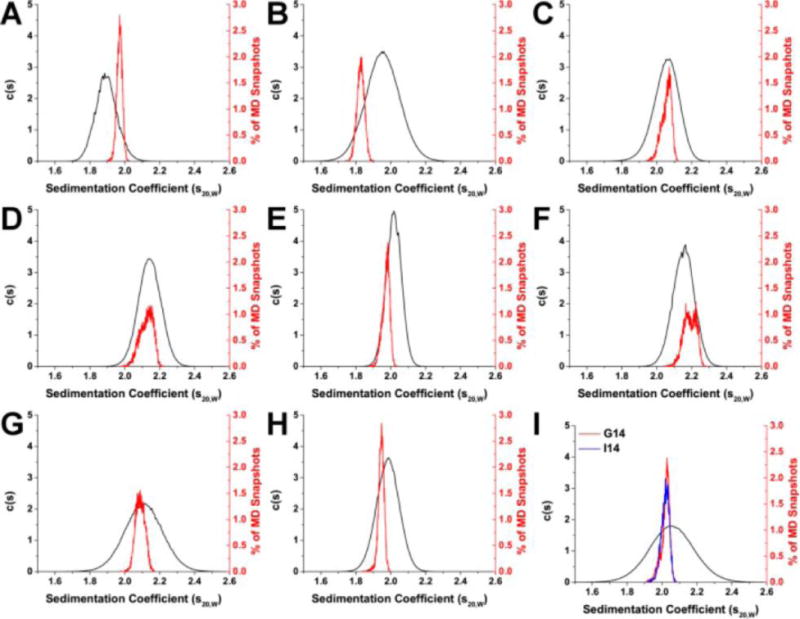
Comparison of experimentally determined and HYDROPRO calculated sedimentation coefficient distributions for hybrid quadruplex forms: 143D (A), 1KF1 (B), 2GKU (C), 2HY9 (D), 2JSM (E), 2JPZ (F), 2JSL (G), 2KF8 (H), and 2KKA (2KKA-G, red; 2KKA-I, blue) (I). For each G-quadruplex structure, sedimentation coefficients (S20,w) were determined experimentally by AUC (black) and calculated from MD “snapshots” using HYDROPRO (red and blue). Reproduced with permission from reference (Le, et al., 2014).
Accelerated Molecular Dynamics Can Explore More Conformational Space
To explore conformational states on a longer timescale, accelerated molecular dynamics can be used (Chaires, et al., 2014). In this study, we examined the hTERT promoter as there are several recently reported mutations in the quadruplex-forming sequence of the promoter that are overexpressed in some forms of cancer. There was an existing proposed (Palumbo, Ebbinghaus, & Hurley, 2009) topology for the hTERT promoter region, but no three dimensional structure or model reported. This topology did not explain how the mutants would affect quadruplex stability. To explore possible structures consistent with the observed circular dichroism and AUC-determined S20,w, several molecular models were built, including that of the previous topology. The experimental S20,w =4.0 for this sized sequence was unusually high indicating that it is a highly compact structure. The calculated S20,w =3.3 for the modeled existing topological form was inconsistent with the S20,w as well as the circular dichroism spectra. A new folded form of the hTERT promoter was modeled that combined the parallel forms, supported by the circular dichroism spectra, Figure 5. Explicitly solvated molecular dynamics was employed, followed by accelerated molecular dynamics to cover more conformational space, particularly of the loop regions, as starting with molecular models can lead to bias for preconceived conformations or can lock into local minima. The analysis of the molecular dynamics trajectory using HYDROPRO showed that the newly proposed molecular model was fully consistent with all experimental observations.
Figure 5. Improved hTERT structure.
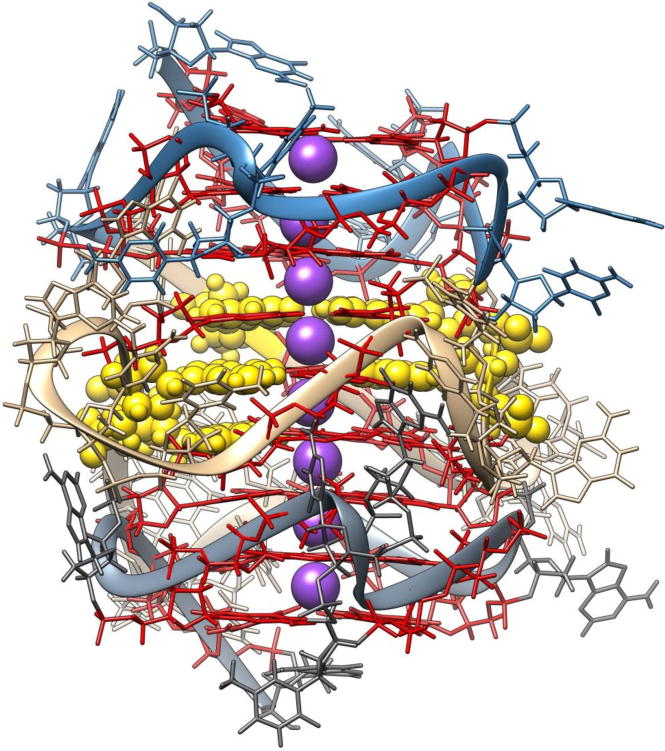
Molecular model of a structure consistent with all biophysical data. Quadruplex guanine bases in red, potassium ions in purple, and guanine mutations in yellow ball and stick representation.
One major advantage of accelerated molecular dynamics sampling arises when investigating new topologies. This is particularly relevant when there are long quaduplex loop regions that have no known structural reference, or higher order quadruplex-component systems. Longer loops will have their own conformational substates, so efficient sampling will greatly aid in answering the fundamental question of “Is the calculated S20,w of the structural model consistent with the experimental S20,w?”.
Examining Higher Order Quadruplexes From The Human Telomere Sequence
There has been considerable interest in the human telomere single strand overhang comprising of up to ~400 nt (Cimino-Reale et al., 2001). However, the detailed structural study of single strand multimeric quadruplex forms is intractable by current X-ray and NMR methods. Therefore, molecular dynamics and hydrodynamic measurement may provide some insight into these structural motifs (Petraccone, et al., 2010; Petraccone, et al., 2011; Petraccone, et al., 2008). Three questions that have been examined are “what topological forms are present?”, “do successive quadruplexes form from the single strand?”, and “what interactions are there between successive quadruplexes?”. The last question is summed up by determining if the successive quadruplexes are “beads on a string” or dependent on stacking interactions. To examine this we extended the human telomere sequence of interest from 24nt to 48nt, 72nt, 96nt, and 192nt capable of forming 2, 3, 4, and 8 successive quadruplexes, respectively, Table 1. Molecular models of various stacked and unstacked conformations were created based on our previous studies (Petraccone, et al., 2010; Petraccone, et al., 2011; Petraccone, et al., 2008) and allowed to evolve using molecular dynamics simulations. Overall, there appears to be some interaction between successive quadruplexes since the measured S20,w is between those calculated for stacked and unstacked models. Representative molecular models that are consistent (and inconsistent) with the experimental values are shown in Figure 6. The successive quadruplexes are not independent as in “beads on a string”, but they are also not rigidly stacked.
Table 1.
Sedimentation values of higher order telomere sequences.
| Sequence | Mwcalc* | ε260 | S20,w | MWExpt | f/f0 | Hydropro Calculated S20,w |
|---|---|---|---|---|---|---|
| (TTAGGG)4 | 7574 | 244600 | 2.21 | 7740 | 1 | 2.11 |
| (TTAGGG)8 | 15211 | 489000 | 2.80 | 13600 | 1.25 | stacked 2.87, unstacked 2.85 |
| (TTAGGG)12 | 22848 | 733400 | 3.56 | 20800 | 1.31 | stacked 3.49, unstacked 2.98 |
| (TTAGGG)16 | 30485 | 977800 | 3.87 | 29200 | 1.42 | stacked 4.20, unstacked 3.68, |
| (TTAGGG)32 | 61033 | 1955400 | 5.43 | 59600 | 1.65 | stacked 5.45, unstacked 4.83 |
Nucleotide bases, central potassium ions are included in the Hydropro Calculated S20,w
Figure 6. Simulated, experimentally validated higher-order telomeric quadruplex structures.
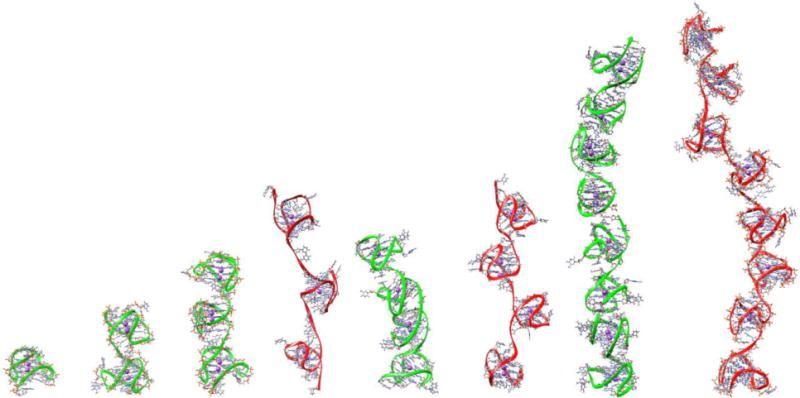
The experimentally consistent structures are shown with a green ribbon for the single, dimer, trimer, tetramer, and octamer quadruplexes. The inconsistent trimer and tetramer are shown with a red backbone.
Experimental determination by analytical ultracentrifugation
Determination of sedimentation and diffusion coefficients uses standard sedimentation velocity methods and analysis. Oligonucleotides of defined sequence are obtained from commercial sources (Integrated DNA Technologies, Inc., Coralville, Iowa 52241). For long sequences it is essential to purchase gel purified material to minimize sample heterogeneity. In sample preparation, the annealing protocol used can play an important role in G-quadruplex formation (Le, et al., 2012). Samples at working concentrations of 2 – 10 μM (strand) are annealed by imersion into boiling water contained in a 1 L beaker for 5 minutes, after which the beaker is removed from the heat source and allowed to slow cool to room temperature overnight (12 – 24 hr).
AUC is carried out in a Beckman Coulter ProteomeLab XL-A analytical ultracentrifuge using standard 2 sector cells with quartz windows in 4- or 8-hole rotors. All sedimentation velocity experiments are at 50,000 rpm with a preset scan number of 100 per cell. The reference sector is filled with 450 μL of buffer and the sample sector is filled with 430 μL of sample with an absorbance at 260 nm (1 cm path length) between 0.2 and 1.0. Centrifugation is started after the rotor has equilibrated to 20° C for approximately 1 hour. Buffer density is measured at 20.0° C in a Mettler/Paar Calculating Density Meter DMA 55A. Buffer viscosity is measured in an Anton Parr AMVn Automated Microviscometer. Data are analyzed using the program Sedfit (www.sedfit.com). Hydrodynamic parameters are determined using the continuous c(s) model for S20,w and the non-interacting discrete species model for D20,w in the sedfit program. The instrument has been calibrated for elapsed time, scan velocity, temperature and radial magnification (Zhao et al (2015) Plos One in press). S20,w for several compact quadruplex structures was determined in the range of 1–4 μM (absorbance at 260 nm from 0.2–1.0) and essentially no concentration dependence was observed.
Pitfalls
1. There is pronounced dependency of the sedimentation coefficient on monovalent salt concentration for nucleic acids due to their charge. For quadruplex structures salt concentrations of 0.2 –0.4 M are needed to obtain S20,w values that are independent of salt concentration for comparison to calculated hydrodynamic parameters. 2. For most quadruplex-forming sequences that are not heavily modified to reduce polymorphism, there are likely to be more than one species in solution. Such polymorphism may be manifested in multiple peaks or by broad, possibly asymmetric, single peaks in c(s) profiles. It may be difficult in these cases to compare experimental values to computed ones. Additional purification steps are then needed to prepare homogeneous samples (Miller Current protocols 2014). Finally for longer sequences that may have extended structures, extrapolation to zero concentration is necessary to obtain correct S20,w values.
The partial specific volume problem
There is no convenient way to compute partial specific volume (psv) estimates for DNA oligonucleotides from their composition, unlike for proteins in which psv may usually be reliably estimated from amino acid composition. For most nucleic acids a value of 0.55 g/L appears to be applicable (Bloomfield, Crothers, Tinoco). Use of this value for quadruplexes was validated by fitting sedimentation equilibrium data of samples of known molecular weight to obtain psv estimates (Li, et al., 2005). More recently Hellman, Rodgers and Fried (Hellman, Rodgers, & Fried, 2010) determined psv values by varying solution density using either NaCl or KCl in the range of 0–2 M and obtained values near 0.55 g/L. Since Na+ and K+ bind to quadruplex structures as a function of salt concentration and also affect solution ideality the reported results may contain subtle errors due to uncertainties in the contribution of ion binding to the molecular weight. We further investigated the psv problem by additional studies using 18O water to vary solution densities.
For partial specific volume determinations, buffers are prepared in 0–80% 18O-H2O and resulting densities and viscosities are measured directly. M(1-vρ) is calculated using sedfit from both sedimentation velocity measurements at 50,000 rpm and sedimentation equilibrium measurements at several rotor speeds. Using the method of Edelstein and Schachman (Edelstein & Schachman, 1967), M(1-vρ) is plotted versus solution density to allow for simultaneous determination of apparent partial specific volume (v) and molecular weight (M), as shown in Figure 7. The resultant value for v are: 2JSM = 0.58 ± 0.07; 2JSL= 0.56 ± 0.07; Tel22 = 0.58 ± 0.07. These values for the partial specific volume are slightly larger for all 3 structures than the value of 0.55 mL/g used previously but within the standard error of that value. The standard error is similar to that reported by Hellman, Rodgers and Fried using this method. However the Fried laboratory used KCl and NaCl to manipulate solution density in the range of 0–2 M, and we have shown that KCl binding to quadruplex structures such as hTel22 and 2GKU is considerably greater than the value of 2 K+ assumed by Fried over the range of KCl concentrations used (Gray & Chaires, 2011). The increased partial specific volume in 0.4 M KCl indicates that significant amounts of K+ are bound thus increasing the apparent partial specific volume and the molecular weight of hTel22, 2JSL and 2JSM.
Figure 7.
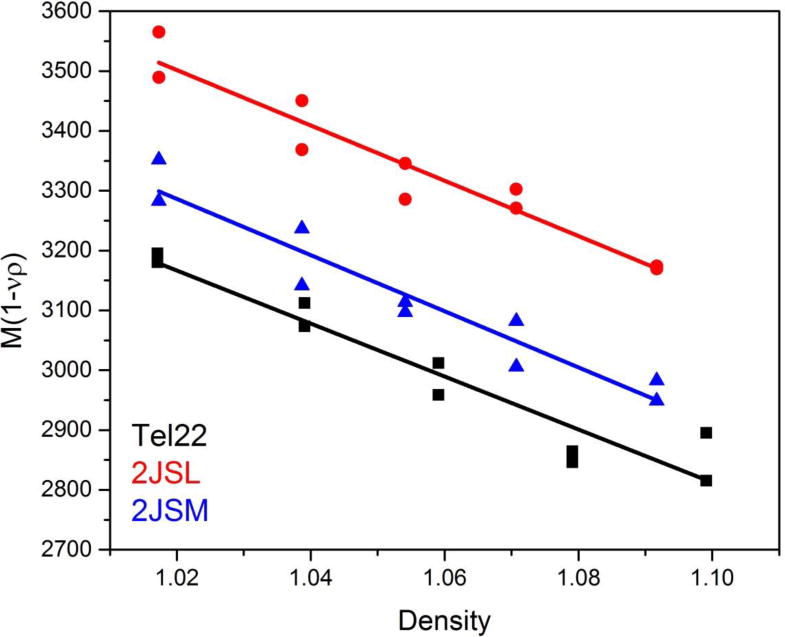
Partial specific volume data obtained in 0.4 M KCl.
Correlation of calculated and measured hydrodynamic properties
HYDROPRO has been proven to be able to accurately predict the hydrodynamic properties of short DNA duplex strucutures (Fernandes, et al., 2002), longer worm-like DNA duplexes (Amorós, et al., 2011) and monomeric folded quadruplex structures (Le, et al., 2014). These validations lend confidence to efforts to use HYDROPRO to predict more complex higher-order quadruplex structures and to use the predictions to select plausible models for structures that would otherwise be intractable by current crystallographic and NMR methods. Figure 8 shows the correlation between predicted and measured sedimentation coefficients for a wide range of structures. The correlation is excellent (Pearson’s r =0.991; slope=0.999 ±0.008), validating our approach for the characterization of complex quadruplex structures.
Figure 8.
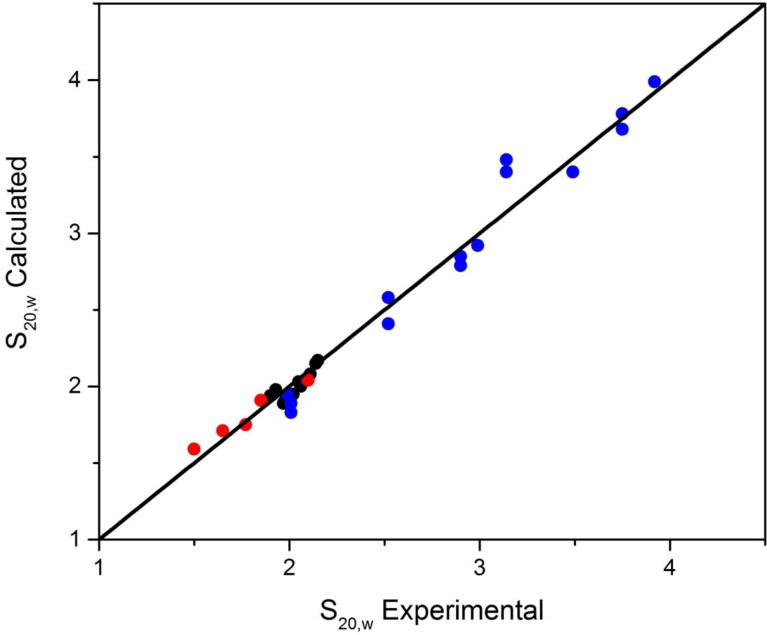
Correlation of predicted and measured sedimentation coefficients. The points in red are for short DNA duplexes taken from Fernandes, et al., 2002). The black points are for known human telomere structures taken from (Le, et al., 2014). The blue points are for a variety of higher-order quadruplex structures determined in our laboratory.
References
- Ambrus A, Chen D, Dai J, Bialis T, Jones RA, Yang D. Human telomeric sequence forms a hybrid-type intramolecular G-quadruplex structure with mixed parallel/antiparallel strands in potassium solution. Nucleic Acids Res. 2006;34(9):2723–2735. doi: 10.1093/nar/gkl348. [DOI] [PMC free article] [PubMed] [Google Scholar]
- Amorós D, Ortega A, García de la Torre J. Hydrodynamic Properties of Wormlike Macromolecules: Monte Carlo Simulation and Global Analysis of Experimental Data. Macromolecules. 2011;44(14):5788–5797. doi: 10.1021/ma102697q. [DOI] [Google Scholar]
- Byron O. Hydrodynamic modeling: the solution conformation of macromolecules and their complexes. Methods in cell biology. 2008;84:327–373. doi: 10.1016/S0091-679X(07)84012-X. [DOI] [PubMed] [Google Scholar]
- Case DA, Babin V, Berryman JT, Betz RM, Cai Q, Cerutti DS, Kollman PA. AMBER 14. San Francisco: University of California; 2014. [Google Scholar]
- Case DA, Cheatham TE, 3rd, Darden T, Gohlke H, Luo R, Merz KM, Jr, Woods RJ. The Amber biomolecular simulation programs. Journal of computational chemistry. 2005;26(16):1668–1688. doi: 10.1002/jcc.20290. [DOI] [PMC free article] [PubMed] [Google Scholar]
- Chaires JB, Trent JO, Gray RD, Dean WL, Buscaglia R, Thomas SD, Miller DM. An Improved Model for the hTERT Promoter Quadruplex. PLoS ONE. 2014;9(12):e115580. doi: 10.1371/journal.pone.0115580. [DOI] [PMC free article] [PubMed] [Google Scholar]
- Cimino-Reale G, Pascale E, Battiloro E, Starace G, Verna R, D’Ambrosio E. The length of telomeric G-rich strand 3′-overhang measured by oligonucleotide ligation assay. [Research Support, Non-U.S. Gov’t] Nucleic acids research. 2001;29(7):E35. doi: 10.1093/nar/29.7.e35. [DOI] [PMC free article] [PubMed] [Google Scholar]
- Edelstein SJ, Schachman HK. The simultaneous determination of partial specific volumes and molecular weights with microgram quantities. The Journal of biological chemistry. 1967;242(2):306–311. [PubMed] [Google Scholar]
- Fernandes MX, Ortega A, Lopez Martinez MC, Garcia de la Torre J. Calculation of hydrodynamic properties of small nucleic acids from their atomic structure. Nucleic Acids Res. 2002;30(8):1782–1788. doi: 10.1093/nar/30.8.1782. [DOI] [PMC free article] [PubMed] [Google Scholar]
- Garcia de la Torre J, Harding SE. Hydrodynamic modelling of protein conformation in solution: ELLIPS and HYDRO. Biophysical reviews. 2013;5(2):195–206. doi: 10.1007/s12551-013-0102-6. [DOI] [PMC free article] [PubMed] [Google Scholar]
- Garcia De La Torre J, Huertas ML, Carrasco B. Calculation of hydrodynamic properties of globular proteins from their atomic-level structure. Biophys J. 2000;78(2):719–730. doi: 10.1016/S0006-3495(00)76630-6. [DOI] [PMC free article] [PubMed] [Google Scholar]
- Gray RD, Chaires JB. Linkage of cation binding and folding in human telomeric quadruplex DNA. Biophysical chemistry. 2011;159(1):205–209. doi: 10.1016/j.bpc.2011.06.012. [DOI] [PMC free article] [PubMed] [Google Scholar]
- Hellman LM, Rodgers DW, Fried MG. Phenomenological partial-specific volumes for G-quadruplex DNAs. European biophysics journal: EBJ. 2010;39(3):389–396. doi: 10.1007/s00249-009-0411-7. [DOI] [PMC free article] [PubMed] [Google Scholar]
- Huppert JL. Hunting G-quadruplexes. Biochimie. 2008;90(8):1140–1148. doi: 10.1016/j.biochi.2008.01.014. [DOI] [PubMed] [Google Scholar]
- Huppert JL, Balasubramanian S. Prevalence of quadruplexes in the human genome. Nucleic Acids Research. 2005;33(9):2908–2916. doi: 10.1093/nar/gki609. [DOI] [PMC free article] [PubMed] [Google Scholar]
- Huppert JL, Balasubramanian S. G-quadruplexes in promoters throughout the human genome. Nucleic Acids Research. 2007;35(2):406–413. doi: 10.1093/nar/gkl1057. [DOI] [PMC free article] [PubMed] [Google Scholar]
- Lane AN, Chaires JB, Gray RD, Trent JO. Stability and kinetics of G-quadruplex structures. Nucleic Acids Research. 2008;36(17):5482–5515. doi: 10.1093/nar/gkn517. [DOI] [PMC free article] [PubMed] [Google Scholar]
- Le HT, Buscaglia R, Dean WL, Chaires JB, Trent JO. Calculation of hydrodynamic properties for G-quadruplex nucleic acid structures from in silico bead models. Topics in current chemistry. 2013;330:179–210. doi: 10.1007/128_2012_351. [DOI] [PMC free article] [PubMed] [Google Scholar]
- Le HT, Dean WL, Buscaglia R, Chaires JB, Trent JO. An investigation of G-quadruplex structural polymorphism in the human telomere using a combined approach of hydrodynamic bead modeling and molecular dynamics simulation. The journal of physical chemistry. B. 2014;118(20):5390–5405. doi: 10.1021/jp502213y. [DOI] [PMC free article] [PubMed] [Google Scholar]
- Le HT, Miller MC, Buscaglia R, Dean WL, Holt PA, Chaires JB, Trent JO. Not all G-quadruplexes are created equally: an investigation of the structural polymorphism of the c-Myc G-quadruplex-forming sequence and its interaction with the porphyrin TMPyP4. Organic & biomolecular chemistry. 2012;10(47):9393–9404. doi: 10.1039/c2ob26504d. [DOI] [PMC free article] [PubMed] [Google Scholar]
- Li J, Correia JJ, Wang L, Trent JO, Chaires JB. Not so crystal clear: the structure of the human telomere G-quadruplex in solution differs from that present in a crystal. Nucleic acids research. 2005;33(14):4649–4659. doi: 10.1093/nar/gki782. [DOI] [PMC free article] [PubMed] [Google Scholar]
- Luu KN, Phan AT, Kuryavyi V, Lacroix L, Patel DJ. Structure of the human telomere in K+ solution: an intramolecular (3 + 1) G-quadruplex scaffold. Journal of the American Chemical Society. 2006;128(30):9963–9970. doi: 10.1021/ja062791w. [DOI] [PMC free article] [PubMed] [Google Scholar]
- Miller MC, Le HT, Dean WL, Holt PA, Chaires JB, Trent JO. Polymorphism and resolution of oncogene promoter quadruplex-forming sequences. Organic & biomolecular chemistry. 2011;9(22):7633–7637. doi: 10.1039/c1ob05891f. [DOI] [PMC free article] [PubMed] [Google Scholar]
- Ortega A, Amoros D, Garcia de la Torre J. Prediction of hydrodynamic and other solution properties of rigid proteins from atomic- and residue-level models. Biophysical journal. 2011;101(4):892–898. doi: 10.1016/j.bpj.2011.06.046. [DOI] [PMC free article] [PubMed] [Google Scholar]
- Palumbo SL, Ebbinghaus SW, Hurley LH. Formation of a unique end-to-end stacked pair of G-quadruplexes in the hTERT core promoter with implications for inhibition of telomerase by G-quadruplex-interactive ligands. Journal of the American Chemical Society. 2009;131(31):10878–10891. doi: 10.1021/ja902281d. [DOI] [PMC free article] [PubMed] [Google Scholar]
- Petraccone L, Garbett NC, Chaires JB, Trent JO. An integrated molecular dynamics (MD) and experimental study of higher order human telomeric quadruplexes. Biopolymers. 2010;93(6):533–548. doi: 10.1002/bip.21392. [DOI] [PMC free article] [PubMed] [Google Scholar]
- Petraccone L, Spink C, Trent JO, Garbett NC, Mekmaysy CS, Giancola C, Chaires JB. Structure and stability of higher-order human telomeric quadruplexes. Journal of the American Chemical Society. 2011;133(51):20951–20961. doi: 10.1021/ja209192a. [DOI] [PMC free article] [PubMed] [Google Scholar]
- Petraccone L, Trent JO, Chaires JB. The tail of the telomere. J Am Chem Soc. 2008;130(49):16530–16532. doi: 10.1021/ja8075567. [DOI] [PMC free article] [PubMed] [Google Scholar]


