

Abstract
Chronic fructose ingestion is linked to the global epidemic of metabolic syndrome (MetS), and poses a serious threat to brain function. We asked whether a short period (one week) of fructose ingestion potentially insufficient to establish peripheral metabolic disorder could impact brain function. We report that the fructose treatment had no effect on liver/body weight ratio, weight gain, glucose tolerance and insulin sensitivity, was sufficient to reduce several aspects of hippocampal plasticity. Fructose consumption reduced the levels of the neuronal nuclear protein NeuN, Myelin Basic Protein, and the axonal growth-associated protein 43, concomitant with a decline in hippocampal weight. A reduction in peroxisome proliferator-activated receptor gamma coactivator-1 alpha and Cytochrome c oxidase subunit II by fructose treatment is indicative of mitochondrial dysfunction. Furthermore, the GLUT5 fructose transporter was increased in the hippocampus after fructose ingestion suggesting that fructose may facilitate its own transport to brain. Fructose elevated levels of ketohexokinase in the liver but did not affect SIRT1 levels, suggesting that fructose is metabolized in the liver, without severely affecting liver function commensurable to an absence of metabolic syndrome condition. These results advocate that a short period of fructose can influence brain plasticity without a major peripheral metabolic dysfunction.
Keywords: Energy homeostasis, fructose, hippocampus, mitochondria, neurons, plasticity
1. Introduction
The rise in consumption of foods high in calories has been associated with an epidemic of metabolic disorders over the last thirty years [1]. Dietary fructose has been affirmed as a major contributor to the development of obesity, Type 2 Diabetes, and cardiovascular disease [2,3], and overall metabolic syndrome (MetS). Data from the third National Health Examination Survey (NHANES) reported that approximately 10% of Americans’ daily calories is obtained from fructose [4], with daily fructose intakes ranging from 8–23% [5]. Development of MetS is associated with impairment of brain function, and a progressive decline in cognitive abilities such as learning and memory [6,7]. A deficiency in peripheral glucose regulation is one of the primary conditions associated with establishment of MetS, and it is likely that its effects spread to the brain leading to functional and structural alterations [7,8]. MetS is a chronic condition that takes at least six weeks to develop in rats [9], and it is important to determine whether shorter periods of fructose exposure can pose a threat for body and brain.
The liver plays a crucial action on the metabolism of fructose [10,11], development of MetS, and is one of the primary organs affected by overconsumption of fructose resulting in non-alcoholic fatty liver disease (NAFLD) [12]. NAFLD is characterized by reduced SIRT1 levels and altered lipid metabolism, and often associated with the development of MetS [13]. The enzyme fructokinase or ketohexokinase (KHK) is important for fructose metabolism [14]. It has been shown in the liver that excessive fructose promotes upregulation of GLUT5, and elevation in KHK and aldolase B activities [14,15]. GLUT5, a member of the facilitative glucose transporter family is specific for fructose transport, and helps in the passive transport of fructose across membranes [16] into the brain. In the current report, we have explored the short-term effects of fructose consumption on the liver in conjunction with the brain to try to establish the initial events associated with the brain pathology.
A potential action of fructose on brain can be manifested in alterations in neuronal and glia cells. The neuronal nuclear Antigen (NeuN) is considered a marker of phenotypic and functional changes in neurons [17]. Another important factor that results in brain dysfunction and interfere with cognition is demyelination [18]. In the CNS, myelin basic protein (MBP) found in myelinating oligodendrocytes is indispensable for the formation of myelin sheath [19]. Notable reduction in MBP depicts disruption in myelin stability, causing degradation of myelin sheath and resultant loss [19,20]. Mitochondrial biogenesis is crucial for cell function and its failure can have important implications for the pathogenesis of various neurodegenerative diseases [21]; therefore, we also examined molecular systems associated with mitochondria, notably PGC-1α and COX2 [9]. PGC-1 α is a transcriptional co-activator that plays a critical role in the regulation of mitochondrial biogenesis and energy production. The present study reveals that a short-term fructose treatment in rats reduces several aspects of cellular plasticity. Information about the early influence of fructose ingestion on the molecular roots of brain function and plasticity is crucial for understanding the impact of fructose on the initial events that may predispose neurological disorders.
2. Materials and Methods
2.1. Animals and diets
Eighteen male Sprague-Dawley rats (Charles River Laboratories, Inc., MA, USA) (two months old; weight 200–220 g) were housed in polyacrylic cages (two animals per cage) in a temperature-controlled room (22°C) with a 12- light/12-h dark cycle. All experiments were performed in accordance with the United States National Institutes of Health Guide for the Care and Use of Laboratory Animals. The animal studies and experimental procedures were approved by the University of California at Los Angeles Chancellor’s Animal Research Committee (ARC). One week before starting the fructose treatment, all animals were maintained under standard conditions (above indicated). Rat chow diet and water were supplied ad libitum, after the acclimatization period, the body weight was measured and the animals were homogenously divided to the next groups: Control group (C) received water only. Fructose 8% (F8), group received water with fructose at 8% (w/v). Fructose 15% (F15), group received water with fructose at 15% (w/v), the protocol was applied during seven days. All animals were fed with standard rat chow. During the protocol, all the groups had free access to food and water. The body weight (BW) of the rats was evaluated before and after the fructose treatment. Daily water intake and food intake were measured as the difference of the pre weighed portion of food and water before and after a 24 hours period; this protocol has been previously reported [22].
2.2. Barnes maze test
To assess learning and memory functions, all rats were tested on the Barnes maze before and after experimental diets [7]. The maze was manufactured from acrylic plastic to form a disk 1.5 cm thick and 115 cm in diameter, with 18 evenly spaced 7 cm holes at its edges. In brief, animals were trained to locate a dark escape chamber hidden underneath a hole positioned around the perimeter of a disk. The disk was brightly illuminated by four overhead halogen lamps to provide aversive stimulus. All trials were recorded simultaneously by a video camera installed directly overhead at the center of the maze. Animals were trained with two trials per day for ve consecutive days before fructose treatment. A trial was started by placing the animal in the center of the maze covered under a cylindrical start chamber; after a 10s delay, the start chamber was raised. A training session ended after the animal had entered the escape chamber or when a pre-determined time (5 min) had elapsed, whichever came rst. To assess memory retention, two trials were given after 1 week of fructose. All surfaces were routinely cleaned before and after each trial to eliminate possible olfactory cues from preceding animals.
2.3. Glucose Tolerance Test (GTT) and Insulin Tolerance Test
By the end of the fructose treatment, animals were fasted for 12 h, and received i.p. Injections of D-glucose (2 g/kg). The blood collected from the tail vein was used for glucose measurement at 15 min, 30 min, 60 min and 120 min. After the glucose injection, one hand-held glucometer and specific test strips (Bayer’s Contour meter) were used during the GTT. Blood glucose was calculated as the area under the curve (AUC) for each rat using the trapezoidal method. 24 h after the GTT, all the rats were exposed to 4 h fasting, basal glucose was determined; immediately after this, the animals received i.p. injection of insulin (Novolin R regular human insulin; 0.75 U/kg), the blood glucose was determined as in GTT. Blood glucose response to ITT was calculated as % basal, and the AUC for each rat according with the trapezoidal method. The GraphPad Prism FAQ82 5.0 software (USA) was employed for AUC analysis, the method used for evaluate the response during the GTT and ITT has been reported [23].
2.4. Western blot
The hippocampal and liver tissues (50mg) were homogenized in 10 ml of lysis buffer (137 mM NaCl, 20 mM Tris–HCl pH 8.0, 1% NP40, 10% glycerol, 1 mM phenylmethylsulfonylfluoride (PMSF), 10 μg ml−1 aprotinin, 0.1 mM benzethonium chloride, and 0.5 mM sodium vanadate). The homogenate was centrifuged at 12000 g (4 °C) for 30 min; the supernatant was collected and used for the protein concentration. The Pierce BCA Protein (Thermo scientific, USA) kit was employed to determine the total protein concentration; Bovine Serum Albumin (BSA) was used as a standard protein. 50 μg of total protein was loaded in each well and resolved by 10% SDS-PAGE acrylamide gel. Proteins were then transferred to a PDVF membrane (Millipore, MA, USA). The membranes were blocked with 5% nonfat dry milk (Labscientific, USA), and incubated overnight at 4°C with one of the following specific primary antibodies anti- NeuN (1/500, MAB377, Millipore); anti-Myelin Basic Protein (MBP) (1/1000, # sc-271524, Santa Cruz), anti-Peroxisome proliferator activated-receptor gamma, coactivator 1 alpha (PGC-1α) (1/1000 # ST1202, Millipore), anti-Cytochrome c oxidase subunit II (COX 2) (1/1000 # sc-23984; Santa Cruz), anti-Ketohexokinase (KHK) (1/1000 # sc-366024, Santa Cruz), anti-SIRT1 (Millipore) anti-GLUT5 (1/1000 # sc-30109, Santa Cruz), anti- Glial fibrillary protein (GFAP) (1/1000, # sc-6170, Santa Cruz), anti-Ionized calcium binding adaptor molecule 1 (Iba1), (1: 500# sc-32725, Santa Cruz), anti-growth associated protein 43 (GAP-43) (1:1000, # sc-17790, Santa Cruz,), anti-β-actin (1/1000, sc-1616, Santa Cruz). The primary antibodies were detected with their corresponding secondary antibodies: Horseradish peroxidase (HRP)–conjugated goat anti-rabbit IgG (1/100,000, #sc-2054 Santa Cruz), HRP conjugated goat anti-mouse IgG (1/100,000, #sc-2055 Santa Cruz), HRP conjugated donkey anti-goat IgG (1/100,000, #sc-2020, Santa Cruz). The protein bands were detected using a chemiluminescent HRP substrate kit (WBKLS0500, Millipore). The membranes were scanned (Image Lab Software, Version 3.0, Bio Rad). The relative density of each band of interest was measured with the software ImageJ v 1.46. The intensity of the interest band was normalized to β-actin.
2.5. Immunohistochemistry
Additional rats (n=18) were anesthetized with isoflurane, and perfused with PBS (pH 7.4), followed by 4% paraformaldehyde (4% PFA) in 0.1 M phosphate buffer (PBS, pH 7.4), and 20% sucrose in 4% PFA. Brain tissues were incubated overnight in 20% sucrose, 4% PFA solution at 4°C until they sank. Tissues were then quickly frozen on dry ice and stored at −80 °C until the time of use. Coronal sections (30 μm) were cut on a cryostat (CM1900, Leica) and kept at −20 °C in an antifreeze solution (30% w/v Sucrose, 30% v/v Ethylene glycol, 1% w/v Polyvinylpyrroline-40 in 0.1 M PB) (Watson et al. 1986). After washing three times in PBS, free-floating sections were blocked with 0.1% Triton x-100, and 2% BSA in PBS for 1 h at room temperature, washed two times in 1X PBS (10 minutes per washing), and incubated in antibodies: Anti NeuN (1/500, MAB377, Millipore); anti MBP (1/500, # sc-271524, Santa Cruz), Anti-Glut5 (1/500 # sc-30109, Santa Cruz) diluted in 2% BSA in 1X PBS overnight at 4 °C. After washing in PBS, sections were incubated in respective secondary antibody (anti rabbit, anti-mouse or anti goat) (Cy3; 1:1000; Jackson Immunoresearch) for 1 h at room temperature. Sections were mounted using Prolong Gold antifade reagent with Dapi (Life technologies, New York). Images were acquired using the Zeiss microscope (Zeiss Imager Z1; Gottingen DE) and Axiovision 4.6 software (Carl Zeiss Vision, version 4.6).
2.6. Cortical cell culture
Mixed cortical cell cultures, containing both neurons and astrocytes, were prepared as described previously[24] from fetal mice at 14–16 days of gestation. Briefly, dissociated cortical cells were plated onto a previously established astroglial cell monolayer in a 24-well plate (Nunc) using plating medium (Dulbecco’s modified Eagle medium supplemented with 20 mM glucose, 38 mM sodium bicarbonate, 2 mM glutamine, 5% fetal bovine serum, and 5% horse serum). Cytosine arabinoside (10 μM) was added 5–6 days after plating to halt the growth of non-neuronal cells. Astroglial cultures were prepared from neocortices of newborn mice (Postnatal Day 1–3) and plated at 0.5 hemispheres per 24-well plate, in the same plating medium but supplemented with 10% fetal bovine serum and 10% horse serum and, treated with 1 or 5 mM of fructose for 1 week in the medium. Glial cultures were used for neuronal plating between 14 and 28 days in vitro (DIV), when they formed a confluent monolayer. Primary near-pure neuronal cultures were prepared from fetal wild type mice at 16 days of gestation. Briefly, dissociated hippocampal cells were plated on PLL/laminin-coated plates (8 hemispheres per 6-well plate) in plating medium (Dulbecco’s modified Eagle medium (DMEM; Gibco BRL, Rockville, MD) supplemented with 20 mM glucose, 38mM sodium bicarbonate, 2 mM glutamine, 5 % fetal bovine serum and 5 % horse serum) and adding Cytosine arabinoside (Ara C, 10 μM) 3 days after plating. Dissociated cells were used 5 days (DIV 5) after seeding.
Cells were fixed with 4% paraformaldehyde for 1 h and permeabilized with 0.3% Triton X-100 for 30 min. After blocking with 2% bovine serum albumin, cells were incubated in anti-Glut5 (1:200; Santa Cruz), anti-NeuN (1:500; Millipore), or anti-GFAP (1:750; Abcam) antibodies, and Alexa Fluor-conjugated secondary antibodies (1:1000). The immunofluorescence staining was visualized under Zeiss microscope (Zeiss Imager. Z1; Gottingen, DE) using the Axiovision software (Carl Zeiss Vision, version 4.6). Images were collected using a black and white camera (Axiocam MRm, Zeiss, Gottingen, DE).
2.7. Statistical Analysis
All data are presented as mean ± standard deviation (SD). Difference between groups was established by the non-parametric t test and one-way analysis of variance (ANOVA) followed by Tukey’s test. A p value of p<0.05 was considered statistically significant.
3. Results
3.1. Short-term fructose ingestion and peripheral glucose regulation
The liver weight/body weight ratio is considered an indicator of MetS [6,25], and no significant difference was observed in any of the experimental groups (One way ANOVA, F (2, 15) = 0.234, p = 0.794. Table 1). The fructose treatment had no effect on the glucose tolerance test (F (2, 15) = 1.017, p=0.385; Fig. 1A, B) nor insulin sensitivity (F (2,15) = 1.506, p = 0.253. Fig. 1C, D). These data indicate that fructose supplementation at 8% or 15% for one week did not affect glucose homeostasis, insulin sensitivity, or fatty liver disease characteristics.
Table 1.
Effect of Fructose on food intake, water intake, kilocalories ingested, fructose intake and liver/body weight ratio.
| C | F8 | F15 | |
|---|---|---|---|
| Food intake (g/rat/day) | 33.07 ± 1.04 | 25.13 ± 1.58* | 23.53 ± 3.4* |
| Water intake (ml/rat/day) | 36.33 ± 2.7 | 84.87 ± 1.03*# | 52.0 ± 9.8* |
| Kcal intake (Kcal/rat/day) | 128.8 ± 4.0 | 123.3 ± 6.4 | 121.0 ± 18.7 |
| Fructose intake (g/rat/day) | 0 | 6.67 ± 0.09 | 7.8 ± 1.4 |
| % Kcal provided by fructose | 0 | 20.67 ± 0.51# | 24.0 ± 1.54 |
| Liver/Body weight ratio | 27.71 ± 2.03 | 28.70 ± 1.53 | 28.17 ± 3.47 |
Data represents mean ± SD; n =18 rats/group
p<0.05 vs C
p<0.05 vs F15
Fig. 1. Effects of short-term fructose ingestion on glucose tolerance and insulin sensitivity.

(A) Glucose tolerance test (GTT) after one week of fructose supplementation, (B) Area under the curve (AUC, arbitrary units) for GTT, (C) Insulin tolerance test (ITT) after fructose supplementation, glucose values expressed as percentage of basal levels (D) AUC for ITT. F8, F15: 8% and 15% fructose concentration, respectively.
3.2. Short- term fructose ingestion and metabolic proteins in the liver
The liver is considered as one of the principal splanchnic organs metabolizing ingested fructose [10,11]. One of the principal enzymes for fructose metabolism is ketohexokinase (KHK) [26], and KHK catalyzes the phosphorylation of fructose to fructose-1-phosphate. In the present study, fructose supplementation showed a marked increase in hepatic KHK levels (One way ANOVA (F (2,14) = 5.94, p = 0.013) followed by Tukey post hoc test (F8 vs. C: p = 0.013; F15 vs. C: p = 0.048). Fig. 2A), suggesting that fructose is metabolized in the liver. However, results that fructose supplementation did not alter hepatic SIRT1 levels (One way ANOVA, F (2,14) = 1.182, p = 0.335. Fig. 2B) is consistent with the absence of liver/body weight changes (Table 1), and the lack of onset of metabolic syndrome (Fig. 1). One of the principal features of chronic fructose ingestion is the development of non-alcoholic fatty liver disease (NAFLD) characterized by increased free fatty acids levels and hepatic adiposity [14]. SIRT1 a class III protein deacetylase is associated with the regulation of glucose and lipid metabolism, and activation of SIRT1 down regulates the expression of lipogenic enzymes thereby suppressing the development of fatty liver [27].
Fig. 2. Effects of short-term fructose ingestion on metabolic proteins in liver.

Levels of KHK (A) and SIRT1 (B). Data are expressed as mean ± standard deviation (SD) *p<0.05 vs. C. One-way ANOVA followed by Tukey post hoc comparison. F8, F15: 8% and 15% fructose concentration, respectively.
3.3. Effect of short-term fructose ingestion on hippocampal cells
Fructose supplementation reduced hippocampal weight (One way ANOVA, F (2, 15) = 7.804, p = 0.004) followed by Tukey post hoc test: F8 vs. C, p = 0.002; F 15 vs. C, p = 0.008; Fig. 3A); hence we assessed various molecular indicators of cellular structure to account for changes in the hippocampus using western blotting. The neuronal nuclear protein NeuN is expressed in most of the neurons and serves as a reliable marker of neuronal identity [28], and fructose supplementation reduced NeuN levels (One way ANOVA (F (2, 15) = 19.32, P < 0.0001) followed by Tukey post hoc test: F8 vs C: p < 0.0001; F15 vs. C: p = 0.010. Fig. 3B). Interestingly, F8 showed lower NeuN levels compared to F15 (p=0.033; Fig. 3B), and NeuN levels were positively correlated with hippocampal weight (r=0.610, p=0.009, Fig. 3D). The levels of the myelin MBP [19] were also reduced (One way ANOVA, F(2, 15) = 7.363, p = 0.006) after fructose supplementation in F8 group vs C: p = 0.006; in F15 group vs. C: p = 0.045 (Fig. 3C) and showed positive correlation with the hippocampus weight (r=0.503, p=0.03; Fig. 3E). The glial fibrillary acidic protein GFAP (marker of astrocytes activation) was unchanged in any of the experimental groups (Data not shown). We further aimed at identifying phenotypical changes in the hippocampus in response to fructose ingestion using immunostaining. Results revealed a qualitative reduction in NeuN expression in the F8 group as compared to the control group in CA3 region (Fig. 3F). Similarly, the hippocampal MBP immunohistochemistry appeared to be reduced in F8 group in both CA1 and DG regions (Fig. 3G). The overall data indicate that short-term fructose ingestion principally affects mainly neuronal parameters.
Fig 3. Effects of short-term fructose ingestion on hippocampal weight, neuronal and myelin markers.

(A) wet hippocampus weight. Data are expressed as mean ± standard deviation. (SD) **p< 0.005 vs C. One-way ANOVA followed by Tukey post hoc comparison. Levels of the (B) Neuronal marker (NeuN) and myelin basic protein MBP (C). Correlation analysis of NeuN levels (D) and MBP Vs hippocampal weight (E). Data are expressed as mean ± standard deviation (SD) *** p<0.0001 vs C, *p<0.05 vs. C, # p<0.05 vs F8. One-way ANOVA followed by Tukey post hoc comparison. Representative immunostaining of NeuN (F) and MBP (G) for F8 and Control.
3.4. Effect of short-term fructose ingestion on axonal markers
Impaired neuronal integrity can be associated with alterations in the dynamics of neuronal cytoskeleton or axonal growth with subsequent decrease in brain weight [17]. Therefore, we determined the levels of GAP 43 and phosphorylated TAU (pTAU), both of which are known to have important roles in axonal function [29,30]. Fructose ingestion for one week reduced the GAP 43 levels in hippocampus (One way ANOVA: F (2, 14) = 8.645, P = 0.0041) followed by Tukey post hoc test: F8 vs. C; p = 0.004; F15 vs. C: p = 0.034; Fig. 4A). TAU protein plays a prominent role in the microtubule stabilization in axon [30], and our results showed that short-term fructose supplementation did not alter the levels of pTau in the hippocampus (One way ANOVA: F (1,14) = 3.129, p = 0.075; Fig. 4B).
Fig. 4. Effects of short-term fructose ingestion on axonal markers in hippocampus.

(A) Levels of GAP 43 (B) and pTau (B). Data are expressed as mean ± standard deviation (SD) **p<0.005 vs C, *p<0.05 vs. C. One-way ANOVA followed by Tukey post hoc comparison. F8, F15: 8% and 15% fructose concentration, respectively.
3.5. Effect of short-term fructose ingestion on mitochondrial proteins in the hippocampus
Mitochondrial dysfunction has an early and predominant role in the pathogenesis of neurological disorders, and long-term fructose consumption reduces mitochondrial markers such as PGC-1α in the hippocampus [9]. Hence, we wanted to determine whether short-term fructose ingestion has any effect on PGC-1α in the hippocampus. The levels of PGC-1α (One way ANOVA: F (2, 15) = 13.19, p= 0.001) were decreased in both F8 (p= 0.001) and F15 (p=0.008) groups as compared to control groups (Fig. 5A). Moreover, we analyzed the proteins levels of Cytochrome c oxidase subunit II (COX2), which is coded by mitochondrial DNA, and is considered as one of the markers of mitochondrial function in the brain [31]. The COX2 levels were considerably reduced (One way ANOVA: F (2, 14) = 20.51, p<0.0001) after one week of fructose supplementation in F8 group (p = 0.0006) and F15 group (p = 0.0001) as compared to controls (Fig. 5B). These data suggest that short-term fructose ingestion (8% or 15%) compromises mitochondrial function.
Fig 5. Effects of short-term fructose ingestion on mitochondrial markers in hippocampus.

(A) Levels of PGC-1α (A), and COX 2 (B). Data are expressed as mean ± standard deviation (SD). **p<0.005 vs C, *p<0.05 vs. C. One-way ANOVA followed by Tukey post hoc comparison. F8, F15: 8% and 15% fructose concentration, respectively.
3.6. Effect of short-term fructose ingestion on GLUT5 levels in the hippocampus
GLUT5 is considered a specific fructose transporter into cells [16], and its function is susceptible to several physiological and disease conditions [16]. We found that levels of GLUT5 were elevated in the hippocampus (One way ANOVA: F (2,14) = 8.019, p = 0.004 followed by Tukey post hoc test: F8 vs. C: p = 0.004 and F15 vs. C: p= 0.04; Fig. 6A)
Fig. 6. Effects of short-term fructose ingestion on GLUT5 levels.

(A) Representative western blot for GLUT5 in the hippocampus. (B) Representative western blot for GLUT5 in astrocytes cultures treated with fructose (1, 5mM). (C) Representative western blot for GLUT5 in astrocyte-neuron co-culture treated with fructose (5mM). Data are expressed as mean ± standard deviation (SD). **p<0.005 vs C, #p<0.05 vs. F8. One-way ANOVA followed by Tukey post hoc comparison. Confocal micrographs of GLUT5 in astrocytic (D, arrows show astrocytes) or neuronal (E) cultures treated with fructose. Hoescht and NeuN stain nuclear elements.
3.7. Effect of fructose on astrocytic and neuronal cultures
To further evaluate the specificity of the effects of fructose on neurons and astrocytes, we conducted in vitro experiments using primary culture of astrocytes. We performed preliminary experiments with concentrations ranging from 1mM–200mM, based on levels of fructose in the systemic circulation after fructose consumption [32]. At basal levels, the fructose concentrations in systemic circulation range from 0.05 to 2 mM [32–34]. The results showed that the fructose treatment did not promote qualitative changes in density of astrocytes, nor affected GLUT5 levels in astrocytic cultures (Fig. 6B). Next, we performed co-culture experiments involving neurons and astrocytes to determine if the interaction between neurons and astrocytes could influence GLUT5. After 1 week of fructose treatment (5mM), GLUT5 levels were increased in culture containing both neurons and astrocytes, suggesting that either astrocytes requiring neuronal interaction or neurons themselves were the main contributor to the increase of GLUT5 levels (Fig. 6C). GLUT5 immunofluorescence was not qualitatively affected in astrocytic cultures (Fig. 6D) while seemed stronger in neuronal culture (Fig. 6E) treated with fructose.
3.8. Food intake and Body weight
We investigated the impact of short-term fructose ingestion on the overall metabolic state of the rats. Interestingly, there was no significant difference in the fructose (p=0.11) intake or calories (p=0.10) between both F8 and F15 groups (Table 1). This apparent discrepancy can be explained by the fact that the water intake was higher in F8 as compared to F15 (Table 1), which compensated for the fewer amount of fructose and calories in F8. The total number of calories between F8 and F15 groups were not statistically different (One way ANOVA, F (2,15) = 0.709, p = 0.507). Control group showed increased food intake as compared to F8 and F15 groups (Table 1) that seems to explain why the total number of calories were the same among the groups. There was no significant difference in body weight between the experimental groups at the beginning (F (2,15) = 0.609, p = 0.556) nor by the end of the experiments (F (2,15) = 2.830, p = 0.090). Insert Table 1
3.9. Short-term fructose ingestion and cognitive function
All rats were trained in the Barnes maze for spatial learning for five days before being exposed to fructose diet. The latency time to find the escape hole was similar in all rats in last day. The results did not show significant changes in memory retention test 7 days after fructose consumption (C vs F8: p = 0.645; C vs F15: p=0.622; F8 vs F15 p = 0.211). The latency time to find the escape hole in memory test were 13.83+/−3.99s for control; 14.41+/−5.28s for F8; 13.08+/−1.24s for F15.
4. Discussion
The effects of fructose on the brain are being perceived as secondary to establishment of peripheral metabolic dysfunction (glucose intolerance, increase in body weight, and obesity) [7]. Hence, we sought to determine whether some of the fructose effects on brain could be detached from development of MetS. Our results show that short-term fructose supplementation that did not alter peripheral metabolic markers of MetS, resulted in a marked reduction in hippocampal weight and markers of cellular plasticity. The results also showed that fructose elevated levels of GLUT5 which is the main fructose transporter, suggesting that fructose could directly impact brain function as neuronal cells are capable of metabolizing fructose as an energy substrate [35]. According to our results, short-term fructose ingestion disrupts molecular system essential for mitochondrial biogenesis notably PGC-1α and COX2 suggesting that mitochondrial dysfunction could be one of the initial effects of fructose in the hippocampus. In conclusion, short-term fructose ingestion evokes early biochemical and structural alterations in the hippocampus, which could be the initial events evolving into dysfunctional neuronal circuits.
High fructose consumption has paralleled the increasing prevalence of metabolic sequelae and is thought to promote disruptions in peripheral metabolism including weight gain, insulin resistance, hyperglycemia, hyperinsulinemia or liver fat deposition [36]. The MetS is a conglomerate of characteristics including insulin resistance, fasting hyperglycemia, glucose intolerance, obesity and dyslipidemia [37,38]. There is a consensus that 3 of these features are required to classify as MetS and in our present study the animals did not show obesity, glucose intolerance and insulin resistance. According to our results, animals consume 9–10 g of fructose per day, such that 30–40% of the caloric intake comes from fructose while the 60–70% comes from chow. Since animals exposed to fructose consume less chow, the total caloric intake is the same in both groups. The fructose intake in our study is about double what reported for fructose consumption in regular adolescent humans (17%; [39] of the total caloric intake such that our results are relevant to the ever-increasing portion of the population consuming an excessive amount of sugar. Our short-term ingestion of fructose did not modify body weight, blood glucose or insulin levels in rats indicating no clear signs of obese state or metabolic burden.
Fructose treatment increased levels of KHK in liver, corroborating that fructose metabolism takes place in the liver [26]. It is known that KHK is the main enzyme involved in fructose metabolism in the liver. An increase in liver/body weight ratio is another MetS indicator [6,25], and earlier studies have demonstrated disruptions in glucose metabolism and liver fat accumulation in rats exposed to fructose for 14 days [40]. Overconsumption of dietary fructose has been implicated as a cause of non-alcoholic fatty liver disease (NAFLD) [12], involving altered lipid metabolism and deposition and increased liver weight [13]. In addition, low SIRT1 levels in the liver after fructose ingestion has been implicated in the pathogenesis of NAFLD. Deletion of SIRT1 in hepatocytes was shown to promote disruption in PPARγ signaling and a subsequent decrease in fatty acid beta-oxidation [41,42]. Fructose could affect brain function by causing a surge in various peripheral metabolic parameters such as insulin levels, adiposity, and triglycerides as some of these metabolites could penetrate the brain. However, our findings report that a one-week fructose ingestion neither modifies glucose metabolism, liver/body weight ratio, nor alters hepatic SIRT1 levels (F (2, 14) = 1.182, P = 0.3356, Fig. 2F) in rats.
Our findings showed that fructose reduces levels of the protein related to structural plasticity in the hippocampus concomitant to a reduction in hippocampal weight. Neuroplasticity or brain plasticity can be defined as structural or functional changes in brain cells [43] through alterations in the size or shape of cellular structures in response to a particular activity [44–47]. Our short term fructose reduced NeuN protein levels suggesting changes in mature neurons, MBP levels indicating changes in the myelin formation (white matter plasticity), and GAP-43 levels suggesting modifications in axonal or synaptic sprouting. Similarly, we also observed a reduction in NeuN immunoreactivity in CA3 and DG regions of the hippocampus. NeuN is expressed in the nucleus and cell body of most neuronal cell types in humans and rodents [48], and is regarded as a universal biomarker of neurons [28]. Additionally, NeuN levels in the hippocampus were positively correlated with hippocampal weight (r=0.59, p=0.008). Reductions in NeuN immunoreactivity has been linked to neuronal damage [49]. MBP is the second most abundant protein in the central nervous system consisting of an assembly of amino acid residues that aid in the compaction of myelin sheath [50], and its degradation can result in demyelinating disease [51]. Our current results indicated decreased levels of MBP positively correlated with hippocampal weight and qualitative reduction in MBP immunoreactivity in the hippocampus of fructose fed animals. A similar pattern was observed for GAP 43, which is involved in axonal growth and sprouting [52]. Taken together, these data reveal that short-term fructose supplementation disturbs neuronal integrity, which could be the initial steps for developing into alterations in cell growth and plasticity.
Given the lack of significant effects of fructose on peripheral metabolism, it is possible that fructose can have direct effects on brain function. The hippocampus is structurally plastic and particularly vulnerable to nutritional stressors [53,54]. Diets rich in saturated fats and/or fructose or combination diets (also termed as ‘Western Diets’) have been shown to contribute to inflammation, gliosis, and neuronal stress in the hippocampus [55–57]. Furthermore, advanced glycation end-products (AGEs) are elevated in metabolic dysfunction and are known to increase the risk of neurodegenerative diseases [58]. Glycation of proteins in the brain is induced via the receptor for AGE (RAGE) and further contributes to oxidative damage and subsequent mitochondrial dysfunction [59]. Thus, we were interested in analyzing the source of changes associated with structural alterations within the hippocampus.
Our short-term fructose ingestion disrupts molecular systems essential for mitochondrial biogenesis, notably PGC-1α and COX2. Due to the limited regenerative capacity of neurons and high-energy demands, impaired mitochondrial function can exert detrimental effects on neuronal function and the pathogenesis of various neurodegenerative diseases [21] Our previous study reports long-term fructose ingestion compromised mitochondrial function as evidenced by a reduced mitochondrial respiratory capacity linked with ATP turnover [9]. PGC-1α is a transcriptional co-activator that plays a critical role in the regulation of mitochondrial biogenesis and energy production [60], and decreased hippocampal PGC-1α levels has been associated with mitochondrial dysfunction in AD [61]. Studies have reported that fructose exerts detrimental effects on the mitochondrial activity and impairs the anti-oxidative defense system [9]. Therefore, it is likely that mitochondrial dysfunction could possibly be one of the initial effects of fructose ingestion in the hippocampus. Furthermore, it is noteworthy that this effect is induced even before the establishment of MetS.
Given that central inflammation and reactive astrogliosis have been found in the hippocampus in response to caloric diets [8], we determined the effect of short term fructose supplementation on astroglial activation. Our results did not show significant changes in the astrocytic marker GFAP in neither of the experimental groups in vivo. The results of the in vitro experiments showing that fructose did alter levels of GLUT5 in mixed astrocyte/neuronal but not in pure astrocytic cultures seem to indicate that neuronal cells are the main cells assimilating fructose. The range of fructose concentrations was selected based on the reported fructose concentrations in systemic circulation [32,33]. In our study, we observed a robust increase in the levels of GLUT 5 at 5 mM of fructose. We did not find changes in the expression of Iba1 (Ionizing calcium-binding adaptor molecule 1); a novel protein specifically expressed in activated microglia. Overall, these findings suggest that short-term fructose treatment did not induce significant astroglial or microglial activation.
Our data shows fructose increased the levels of GLUT5 in the hippocampus, which likely facilitates fructose uptake into the brain. An emerging line of evidence suggests that fructose could directly impact the brain as neuronal cells are capable of metabolizing fructose as an energy substrate [35]. GLUT5 is the main fructose transporter in the brain and is essential for neuronal function [15,62–64]. Our in vivo and in vitro results indicate that fructose ingestion significantly increases GLUT5 levels in the hippocampus, suggesting that fructose affects neuronal cells, consistent with alterations in NeuN and MBP. Taken together, these data indicate that the specific decrease in hippocampal weight is principally due to the reduction of neuronal, myelin and axonal markers in the hippocampus, and the associated morphological changes.
It has been shown that peripheral short-term fructose administration reduces cerebral blood flow in specific regions such as hippocampus and thalamus [65]. Interestingly, glucose administration reduces the cerebral blood flow in hypothalamus, and insula but not in the hippocampus [65]. Accordingly, it is possible that our short-term fructose ingestion can affect the hippocampus by engaging mechanisms associated with blood supply and metabolic alterations even before the establishment of MetS in the periphery. Although evidence indicates that fructose intake is linked to cognitive deficits [66,67], our results seems to indicate that one-week fructose ingestion is at the early initial phase to consolidate disrupted brain plasticity that can be translated into cognitive deficit.
In conclusion, our model of short-term fructose ingestion did not exhibit modifications in peripheral metabolic markers such as blood glucose, insulin levels, and liver weight ratio. These results indicate that fructose ingestion appears to affect the brain without a major involvement of the periphery at this early stage (Fig. 7). The augmented fructose intake in the past couple of decades has been a major contributor to the pandemic of MetS. Our findings delineate the early molecular and cellular alterations in the hippocampus with regards to cellular plasticity, and mitochondrial biogenesis in response to short term fructose intake. These results provide further insight into challenges imposed by high fructose consumption on brain function and potential neurological disorders.
Fig. 7. Proposed mechanism by which short-term fructose compromises brain function. by disrupting the interplay between neuronal plasticity and mitochondrial biogenesis in the hippocampus.
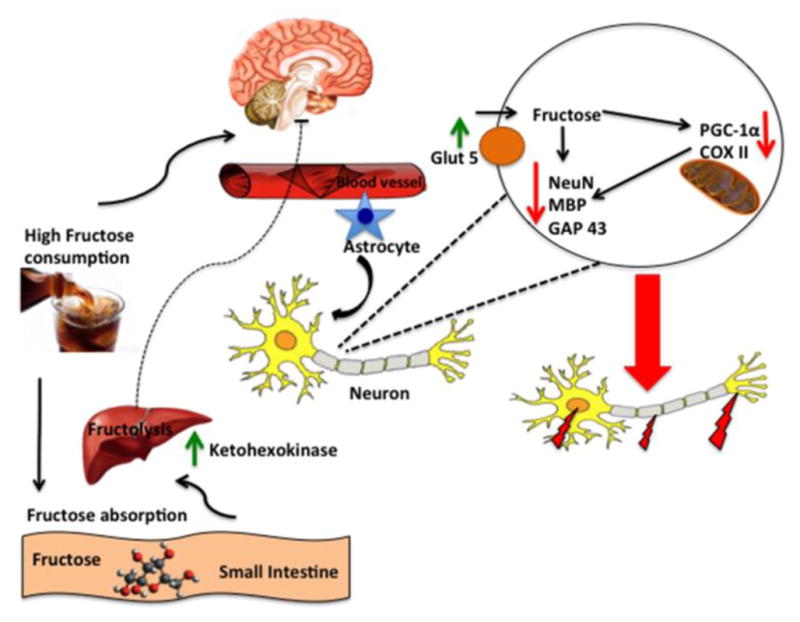
Fructose is known to be metabolized in the liver (fructolysis); however, it is not clear what is the role of peripheral fructose metabolism on the effects of fructose on brain. Long-term fructose consumption stimulates events associated with metabolic syndrome (lipid deposition, obesity, insulin resistance, etc.), but according to our results, these manifestations are not observed after one week of fructose consumption. Ingested fructose is rapidly metabolized into fructose-1- phosphate under the action of the enzyme ketohexokinase (KHK) through a process called fructolysis. Our results indicate that fructose increases the levels of KHK in liver, and suggest that fructose metabolism takes place in liver. However, fructose does not alter peripheral metabolic markers of MetS. In the brain, fructose alters markers of cellular plasticity such as NeuN, MBP and GAP-43, and elevates levels of GLUT5 suggesting that fructose may increase its own transport to the brain. Short-term fructose also interferes with molecular system essential for mitochondrial biogenesis such as PGC-1α and COX2. Collectively, the schematic illustration portrays the general mechanisms by which short-term high fructose consumption can influence brain function, without a major involvement of periphery.
Highlights.
Short-term fructose reduces neuronal plasticity before the onset of metabolic syndrome.
Short-term fructose disturbs mitochondrial biogenesis in the hippocampus.
Fructose may predispose the brain to neurological disorders
Acknowledgments
This work was supported by National Institutes of Health award R01 NS050465.
Dr. Alberto Jimenez-Maldonado was supported by a fellowship from UC MEXUS-CONACYT Program.
Abbreviations
- COX2
Cytochrome c oxidase subunit II
- GAP 43
growth-associated protein 43
- GFAP
Glial fibrillary acidic protein
- GLUT
glucose transporter
- Iba 1
Ionized calcium binding adaptor molecule 1
- KHK
ketohexokinase
- MBP
Myelin Protein Basic
- MetS
metabolic syndrome
- NAFLD
non-alcoholic fatty liver disease
- NeuN
Neuronal Nuclei
- PGC1α
peroxisome proliferator-activated receptor gamma coactivator-1 alpha
Footnotes
Author Contributions
Conceived and designed the experiments: AJM & FGP. Performed experiments: AJM, HRB, ZY. Analyzed the data: AJM. Contributed reagents/materials/analysis tools: FGP. Wrote the manuscript: FGP and AJM. All authors reviewed the manuscript.
Competing financial interests: The authors declare no competing financial interests
Publisher's Disclaimer: This is a PDF file of an unedited manuscript that has been accepted for publication. As a service to our customers we are providing this early version of the manuscript. The manuscript will undergo copyediting, typesetting, and review of the resulting proof before it is published in its final citable form. Please note that during the production process errors may be discovered which could affect the content, and all legal disclaimers that apply to the journal pertain.
References
- 1.Cowie CC, Rust KF, Ford ES, Eberhardt MS, Byrd-Holt DD, Li C, Williams DE, Gregg EW, Bainbridge KE, Saydah SH, Geiss LS. Full accounting of diabetes and pre-diabetes in the U.S. population in 1988–1994 and 2005–2006. Diabetes Care. 2009;32:287–294. doi: 10.2337/dc08-1296. [DOI] [PMC free article] [PubMed] [Google Scholar]
- 2.Tran LT, Yuen VG, McNeill JH. The fructose-fed rat: a review on the mechanisms of fructose-induced insulin resistance and hypertension. Mol Cell Biochem. 2009;332:145–159. doi: 10.1007/s11010-009-0184-4. [DOI] [PubMed] [Google Scholar]
- 3.Elliott SS, Keim NL, Stern JS, Teff K, Havel PJ. Fructose, weight gain, and the insulin resistance syndrome. Am J Clin Nutr. 2002;76:911–922. doi: 10.1093/ajcn/76.5.911. [DOI] [PubMed] [Google Scholar]
- 4.Vos MB, Kimmons JE, Gillespie C, Welsh J, Blanck HM. Dietary fructose consumption among US children and adults: the Third National Health and Nutrition Examination Survey. Medscape J Med. 2008;10:160. [PMC free article] [PubMed] [Google Scholar]
- 5.Sun SZ, Anderson GH, Flickinger BD, Williamson-Hughes PS, Empie MW. Fructose and non-fructose sugar intakes in the US population and their associations with indicators of metabolic syndrome. Food Chem Toxicol Int J Publ Br Ind Biol Res Assoc. 2011;49:2875–2882. doi: 10.1016/j.fct.2011.07.068. [DOI] [PubMed] [Google Scholar]
- 6.Cisternas P, Salazar P, Serrano FG, Montecinos-Oliva C, Arredondo SB, Varela-Nallar L, Barja S, Vio CP, Gomez-Pinilla F, Inestrosa NC. Fructose consumption reduces hippocampal synaptic plasticity underlying cognitive performance. Biochim Biophys Acta. 2015;1852:2379–2390. doi: 10.1016/j.bbadis.2015.08.016. [DOI] [PMC free article] [PubMed] [Google Scholar]
- 7.Agrawal R, Gomez-Pinilla F. “Metabolic syndrome” in the brain: deficiency in omega-3 fatty acid exacerbates dysfunctions in insulin receptor signalling and cognition. J Physiol. 2012;590:2485–2499. doi: 10.1113/jphysiol.2012.230078. [DOI] [PMC free article] [PubMed] [Google Scholar]
- 8.Calvo-Ochoa E, Hernández-Ortega K, Ferrera P, Morimoto S, Arias C. Short-term high-fat-and-fructose feeding produces insulin signaling alterations accompanied by neurite and synaptic reduction and astroglial activation in the rat hippocampus. J Cereb Blood Flow Metab Off J Int Soc Cereb Blood Flow Metab. 2014;34:1001–1008. doi: 10.1038/jcbfm.2014.48. [DOI] [PMC free article] [PubMed] [Google Scholar]
- 9.Agrawal R, Noble E, Vergnes L, Ying Z, Reue K, Gomez-Pinilla F. Dietary fructose aggravates the pathobiology of traumatic brain injury by influencing energy homeostasis and plasticity. J Cereb Blood Flow Metab Off J Int Soc Cereb Blood Flow Metab. 2016;36:941–953. doi: 10.1177/0271678X15606719. [DOI] [PMC free article] [PubMed] [Google Scholar]
- 10.Theytaz F, de Giorgi S, Hodson L, Stefanoni N, Rey V, Schneiter P, Giusti V, Tappy L. Metabolic fate of fructose ingested with and without glucose in a mixed meal. Nutrients. 2014;6:2632–2649. doi: 10.3390/nu6072632. [DOI] [PMC free article] [PubMed] [Google Scholar]
- 11.Tappy L, Lê KA, Tran C, Paquot N. Fructose and metabolic diseases: new findings, new questions. Nutr Burbank Los Angel Cty Calif. 2010;26:1044–1049. doi: 10.1016/j.nut.2010.02.014. [DOI] [PubMed] [Google Scholar]
- 12.Vos MB, Lavine JE. Dietary fructose in nonalcoholic fatty liver disease. Hepatol Baltim Md. 2013;57:2525–2531. doi: 10.1002/hep.26299. [DOI] [PubMed] [Google Scholar]
- 13.Ishimoto T, Lanaspa MA, Rivard CJ, Roncal-Jimenez CA, Orlicky DJ, Cicerchi C, McMahan RH, Abdelmalek MF, Rosen HR, Jackman MR, MacLean PS, Diggle CP, Asipu A, Inaba S, Kosugi T, Sato W, Maruyama S, Sánchez-Lozada LG, Sautin YY, Hill JO, Bonthron DT, Johnson RJ. High-fat and high-sucrose (western) diet induces steatohepatitis that is dependent on fructokinase. Hepatol Baltim Md. 2013;58:1632–1643. doi: 10.1002/hep.26594. [DOI] [PMC free article] [PubMed] [Google Scholar]
- 14.Koo HY, Wallig MA, Chung BH, Nara TY, Cho BHS, Nakamura MT. Dietary fructose induces a wide range of genes with distinct shift in carbohydrate and lipid metabolism in fed and fasted rat liver. Biochim Biophys Acta BBA - Mol Basis Dis. 2008;1782:341–348. doi: 10.1016/j.bbadis.2008.02.007. [DOI] [PubMed] [Google Scholar]
- 15.Shu R, David ES, Ferraris RP. Luminal fructose modulates fructose transport and GLUT-5 expression in small intestine of weaning rats. Am J Physiol. 1998;274:G232–239. doi: 10.1152/ajpgi.1998.274.2.G232. [DOI] [PubMed] [Google Scholar]
- 16.Douard V, Ferraris RP. Regulation of the fructose transporter GLUT5 in health and disease. Am J Physiol Endocrinol Metab. 2008;295:E227–237. doi: 10.1152/ajpendo.90245.2008. [DOI] [PMC free article] [PubMed] [Google Scholar]
- 17.Wang HY, Hsieh PF, Huang DF, Chin PS, Chou CH, Tung CC, Chen SY, Lee LJ, Gau SSF, Huang HS. RBFOX3/NeuN is Required for Hippocampal Circuit Balance and Function. Sci Rep. 2015;5:17383. doi: 10.1038/srep17383. [DOI] [PMC free article] [PubMed] [Google Scholar]
- 18.Sun JJ, Ren QG, Xu L, Zhang ZJ. LINGO-1 antibody ameliorates myelin impairment and spatial memory deficits in experimental autoimmune encephalomyelitis mice. Sci Rep. 2015;5:14235. doi: 10.1038/srep14235. [DOI] [PMC free article] [PubMed] [Google Scholar]
- 19.Han H, Myllykoski M, Ruskamo S, Wang C, Kursula P. Myelin-specific proteins: A structurally diverse group of membrane-interacting molecules. BioFactors. 2013;39:233–241. doi: 10.1002/biof.1076. [DOI] [PubMed] [Google Scholar]
- 20.Frid K, Einstein O, Friedman-Levi Y, Binyamin O, Ben-Hur T, Gabizon R. Aggregation of MBP in chronic demyelination. Ann Clin Transl Neurol. 2015;2:711–721. doi: 10.1002/acn3.207. [DOI] [PMC free article] [PubMed] [Google Scholar]
- 21.Johri A, Beal MF. Mitochondrial Dysfunction in Neurodegenerative Diseases. J Pharmacol Exp Ther. 2012;342:619–630. doi: 10.1124/jpet.112.192138. [DOI] [PMC free article] [PubMed] [Google Scholar]
- 22.van der Borght K, Köhnke R, Göransson N, Deierborg T, Brundin P, Erlanson-Albertsson C, Lindqvist A. Reduced neurogenesis in the rat hippocampus following high fructose consumption. Regul Pept. 2011;167:26–30. doi: 10.1016/j.regpep.2010.11.002. [DOI] [PubMed] [Google Scholar]
- 23.Hezel MP, Liu M, Schiffer TA, Larsen FJ, Checa A, Wheelock CE, Carlström M, Lundberg JO, Weitzberg E. Effects of long-term dietary nitrate supplementation in mice. Redox Biol. 2015;5:234–242. doi: 10.1016/j.redox.2015.05.004. [DOI] [PMC free article] [PubMed] [Google Scholar]
- 24.Noh KM, Kim YH, Koh JY. Mediation by Membrane Protein Kinase C of Zinc-Induced Oxidative Neuronal Injury in Mouse Cortical Cultures. J Neurochem. 1999;72:1609–1616. doi: 10.1046/j.1471-4159.1999.721609.x. [DOI] [PubMed] [Google Scholar]
- 25.Gary-Bobo M, Elachouri G, Gallas JF, Janiak P, Marini P, Ravinet-Trillou C, Chabbert M, Cruccioli N, Pfersdorff C, Roque C, Arnone M, Croci T, Soubrié P, Oury-Donat F, Maffrand JP, Scatton B, Lacheretz F, Le Fur G, Herbert JM, Bensaid M. Rimonabant reduces obesity-associated hepatic steatosis and features of metabolic syndrome in obese Zucker fa/fa rats. Hepatol Baltim Md. 2007;46:122–129. doi: 10.1002/hep.21641. [DOI] [PubMed] [Google Scholar]
- 26.Khitan Z, Kim DH. Fructose: A Key Factor in the Development of Metabolic Syndrome and Hypertension. J Nutr Metab. 2013;2013:e682673. doi: 10.1155/2013/682673. [DOI] [PMC free article] [PubMed] [Google Scholar]
- 27.Yamazaki Y, Usui I, Kanatani Y, Matsuya Y, Tsuneyama K, Fujisaka S, Bukhari A, Suzuki H, Senda S, Imanishi S, Hirata K, Ishiki M, Hayashi R, Urakaze M, Nemoto H, Kobayashi M, Tobe K. Treatment with SRT1720, a SIRT1 activator, ameliorates fatty liver with reduced expression of lipogenic enzymes in MSG mice. Am J Physiol Endocrinol Metab. 2009;297:E1179–1186. doi: 10.1152/ajpendo.90997.2008. [DOI] [PubMed] [Google Scholar]
- 28.Duan W, Zhang YP, Hou Z, Huang C, Zhu H, Zhang CQ, Yin Q. Novel Insights into NeuN: from Neuronal Marker to Splicing Regulator. Mol Neurobiol. 2016;53:1637–1647. doi: 10.1007/s12035-015-9122-5. [DOI] [PubMed] [Google Scholar]
- 29.Bird CW, Gardiner AS, Bolognani F, Tanner DC, Chen C-Y, Lin W-J, Yoo S, Twiss JL, Bizzozero NP. KSRP Modulation of GAP-43 mRNA Stability Restricts Axonal Outgrowth in Embryonic Hippocampal Neurons. PLOS ONE. 2013;8:e79255. doi: 10.1371/journal.pone.0079255. [DOI] [PMC free article] [PubMed] [Google Scholar]
- 30.Spires-Jones TL, Stoothoff WH, de Calignon A, Jones PB, Hyman BT. Tau pathophysiology in neurodegeneration: a tangled issue. Trends Neurosci. 2009;32:150–159. doi: 10.1016/j.tins.2008.11.007. [DOI] [PubMed] [Google Scholar]
- 31.Perez-Pinzon MA, Stetler RA, Fiskum G. Novel mitochondrial targets for neuroprotection. J Cereb Blood Flow Metab. 2012;32:1362–1376. doi: 10.1038/jcbfm.2012.32. [DOI] [PMC free article] [PubMed] [Google Scholar]
- 32.Hui H, Huang D, McArthur D, Nissen N, Boros LG, Heaney AP. Direct spectrophotometric determination of serum fructose in pancreatic cancer patients. Pancreas. 2009;38:706–712. doi: 10.1097/MPA.0b013e3181a7c6e5. [DOI] [PubMed] [Google Scholar]
- 33.Münstedt K, Böhme M, Hauenschild A, Hrgovic I. Consumption of rapeseed honey leads to higher serum fructose levels compared with analogue glucose/fructose solutions. Eur J Clin Nutr. 2011;65:77–80. doi: 10.1038/ejcn.2010.186. [DOI] [PubMed] [Google Scholar]
- 34.Wahjudi PN, Patterson ME, Lim S, Yee JK, Mao CS, Lee WNP. Measurement of glucose and fructose in clinical samples using gas chromatography/mass spectrometry. Clin Biochem. 2010;43:198–207. doi: 10.1016/j.clinbiochem.2009.08.028. [DOI] [PMC free article] [PubMed] [Google Scholar]
- 35.Funari VA, Crandall JE, Tolan DR. Fructose metabolism in the cerebellum. The Cerebellum. n.d;6:130–140. doi: 10.1080/14734220601064759. [DOI] [PubMed] [Google Scholar]
- 36.Basciano H, Federico L, Adeli K. Fructose, insulin resistance, and metabolic dyslipidemia. Nutr Metab. 2005;2:5. doi: 10.1186/1743-7075-2-5. [DOI] [PMC free article] [PubMed] [Google Scholar]
- 37.Srikanthan K, Feyh A, Visweshwar H, Shapiro JI, Sodhi K. Systematic Review of Metabolic Syndrome Biomarkers: A Panel for Early Detection, Management, and Risk Stratification in the West Virginian Population. Int J Med Sci. 2016;13:25–38. doi: 10.7150/ijms.13800. [DOI] [PMC free article] [PubMed] [Google Scholar]
- 38.Kaur J. A comprehensive review on metabolic syndrome. Cardiol Res Pract. 2014;2014:943162. doi: 10.1155/2014/943162. [DOI] [PMC free article] [PubMed] [Google Scholar] [Retracted]
- 39.Ervin RB, Kit BK, Carroll MD, Ogden CL. Consumption of added sugar among U.S. children and adolescents, 2005–2008. NCHS Data Brief. 2012:1–8. [PubMed] [Google Scholar]
- 40.Rebollo A, Roglans N, Baena M, Padrosa A, Sánchez RM, Merlos M, Alegret M, Laguna JC. Liquid fructose down-regulates liver insulin receptor substrate 2 and gluconeogenic enzymes by modifying nutrient sensing factors in rats. J Nutr Biochem. 2014;25:250–258. doi: 10.1016/j.jnutbio.2013.10.014. [DOI] [PubMed] [Google Scholar]
- 41.Purushotham A, Schug TT, Xu Q, Surapureddi S, Guo X, Li X. Hepatocyte-specific deletion of SIRT1 alters fatty acid metabolism and results in hepatic steatosis and inflammation. Cell Metab. 2009;9:327–338. doi: 10.1016/j.cmet.2009.02.006. [DOI] [PMC free article] [PubMed] [Google Scholar]
- 42.Baena M, Sangüesa G, Dávalos A, Latasa M-J, Sala-Vila A, Sánchez RM, Roglans N, Laguna JC, Alegret M. Fructose, but not glucose, impairs insulin signaling in the three major insulin-sensitive tissues. Sci Rep. 2016;6 doi: 10.1038/srep26149. [DOI] [PMC free article] [PubMed] [Google Scholar]
- 43.Leuner B, Gould E. Structural plasticity and hippocampal function. Annu Rev Psychol. 2010;61:111–140. C1–3. doi: 10.1146/annurev.psych.093008.100359. [DOI] [PMC free article] [PubMed] [Google Scholar]
- 44.Bruel-Jungerman E, Davis S, Laroche S. Brain plasticity mechanisms and memory: a party of four. Neurosci Rev J Bringing Neurobiol Neurol Psychiatry. 2007;13:492–505. doi: 10.1177/1073858407302725. [DOI] [PubMed] [Google Scholar]
- 45.Lamprecht R, LeDoux J. Structural plasticity and memory. Nat Rev Neurosci. 2004;5:45–54. doi: 10.1038/nrn1301. [DOI] [PubMed] [Google Scholar]
- 46.Holtmaat A, Svoboda K. Experience-dependent structural synaptic plasticity in the mammalian brain. Nat Rev Neurosci. 2009;10:647–658. doi: 10.1038/nrn2699. [DOI] [PubMed] [Google Scholar]
- 47.Butz M, Wörgötter F, van Ooyen A. Activity-dependent structural plasticity. Brain Res Rev. 2009;60:287–305. doi: 10.1016/j.brainresrev.2008.12.023. [DOI] [PubMed] [Google Scholar]
- 48.Mullen RJ, Buck CR, Smith AM. NeuN, a neuronal specific nuclear protein in vertebrates. Development. 1992;116:201–211. doi: 10.1242/dev.116.1.201. [DOI] [PubMed] [Google Scholar]
- 49.Gusel’nikova VV, Korzhevskiy DE. NeuN As a Neuronal Nuclear Antigen and Neuron Differentiation Marker. Acta Naturae. 2015;7:42–47. [PMC free article] [PubMed] [Google Scholar]
- 50.Richter-Landsberg C. The oligodendroglia cytoskeleton in health and disease. J Neurosci Res. 2000;59:11–18. doi: 10.1002/(sici)1097-4547(20000101)59:1<11::aid-jnr2>3.0.co;2-o. [DOI] [PubMed] [Google Scholar]
- 51.Schaecher KE, Shields DC, Banik NL. Mechanism of myelin breakdown in experimental demyelination: a putative role for calpain. Neurochem Res. 2001;26:731–737. doi: 10.1023/a:1010903823668. [DOI] [PubMed] [Google Scholar]
- 52.Allegra Mascaro AL, Cesare P, Sacconi L, Grasselli G, Mandolesi G, Maco B, Knott GW, Huang L, De Paola V, Strata P, Pavone FS. In vivo single branch axotomy induces GAP-43-dependent sprouting and synaptic remodeling in cerebellar cortex. Proc Natl Acad Sci U S A. 2013;110:10824–10829. doi: 10.1073/pnas.1219256110. [DOI] [PMC free article] [PubMed] [Google Scholar]
- 53.Monti JM, Baym CL, Cohen NJ. Identifying and characterizing the effects of nutrition on hippocampal memory. Adv Nutr Bethesda Md. 2014;5:337S–43S. doi: 10.3945/an.113.005397. [DOI] [PMC free article] [PubMed] [Google Scholar]
- 54.Hoeijmakers L, Lucassen PJ, Korosi A. The interplay of early-life stress, nutrition, and immune activation programs adult hippocampal structure and function. Front Mol Neurosci. 2014;7:103. doi: 10.3389/fnmol.2014.00103. [DOI] [PMC free article] [PubMed] [Google Scholar]
- 55.Koga S, Kojima A, Ishikawa C, Kuwabara S, Arai K, Yoshiyama Y. Effects of diet-induced obesity and voluntary exercise in a tauopathy mouse model: implications of persistent hyperleptinemia and enhanced astrocytic leptin receptor expression. Neurobiol Dis. 2014;71:180–192. doi: 10.1016/j.nbd.2014.08.015. [DOI] [PubMed] [Google Scholar]
- 56.Calvo-Ochoa E, Arias C. Cellular and metabolic alterations in the hippocampus caused by insulin signalling dysfunction and its association with cognitive impairment during aging and Alzheimer’s disease: studies in animal models. Diabetes Metab Res Rev. 2015;31:1–13. doi: 10.1002/dmrr.2531. [DOI] [PubMed] [Google Scholar]
- 57.Freeman LR, Haley-Zitlin V, Stevens C, Granholm AC. Diet-induced effects on neuronal and glial elements in the middle-aged rat hippocampus. Nutr Neurosci. 2011;14:32–44. doi: 10.1179/174313211X12966635733358. [DOI] [PMC free article] [PubMed] [Google Scholar]
- 58.Gugliucci A. Formation of Fructose-Mediated Advanced Glycation End Products and Their Roles in Metabolic and Inflammatory Diseases. Adv Nutr Bethesda Md. 2017;8:54–62. doi: 10.3945/an.116.013912. [DOI] [PMC free article] [PubMed] [Google Scholar]
- 59.Uribarri J, del Castillo MD, de la Maza MP, Filip R, Gugliucci A, Luevano-Contreras C, Macías-Cervantes MH, Markowicz Bastos DH, Medrano A, Menini T, Portero-Otin M, Rojas A, Sampaio GR, Wrobel K, Wrobel K, Garay-Sevilla ME. Dietary advanced glycation end products and their role in health and disease. Adv Nutr Bethesda Md. 2015;6:461–473. doi: 10.3945/an.115.008433. [DOI] [PMC free article] [PubMed] [Google Scholar]
- 60.Ettcheto M, Petrov D, Pedrós I, Alva N, Carbonell T, Beas-Zarate C, Pallas M, Auladell C, Folch J, Camins A. Evaluation of Neuropathological Effects of a High-Fat Diet in a Presymptomatic Alzheimer’s Disease Stage in APP/PS1 Mice. J Alzheimers Dis JAD. 2016;54:233–251. doi: 10.3233/JAD-160150. [DOI] [PubMed] [Google Scholar]
- 61.Sheng B, Wang X, Su B, Lee H, Casadesus G, Perry G, Zhu X. Impaired mitochondrial biogenesis contributes to mitochondrial dysfunction in Alzheimer’s disease. J Neurochem. 2012;120:419–429. doi: 10.1111/j.1471-4159.2011.07581.x. [DOI] [PMC free article] [PubMed] [Google Scholar]
- 62.Funari VA, Herrera VLM, Freeman D, Tolan DR. Genes required for fructose metabolism are expressed in Purkinje cells in the cerebellum. Mol Brain Res. 2005;142:115–122. doi: 10.1016/j.molbrainres.2005.09.019. [DOI] [PubMed] [Google Scholar]
- 63.Ueno M, Nishi N, Nakagawa T, Chiba Y, Tsukamoto I, Kusaka T, Miki T, Sakamoto H, Yamaguchi F, Tokuda M. Immunoreactivity of glucose transporter 5 is located in epithelial cells of the choroid plexus and ependymal cells. Neuroscience. 2014;260:149–157. doi: 10.1016/j.neuroscience.2013.12.006. [DOI] [PubMed] [Google Scholar]
- 64.Maher F, Vannucci SJ, Simpson IA. Glucose transporter proteins in brain. FASEB J. 1994;8:1003–1011. doi: 10.1096/fasebj.8.13.7926364. [DOI] [PubMed] [Google Scholar]
- 65.Page KA, Chan O, Arora J, Belfort-Deaguiar R, Dzuira J, Roehmholdt B, Cline GW, Naik S, Sinha R, Constable RT, Sherwin RS. Effects of fructose vs glucose on regional cerebral blood flow in brain regions involved with appetite and reward pathways. JAMA. 2013;309:63–70. doi: 10.1001/jama.2012.116975. [DOI] [PMC free article] [PubMed] [Google Scholar]
- 66.Ross AP, Bartness TJ, Mielke JG, Parent MB. A high fructose diet impairs spatial memory in male rats. Neurobiol Learn Mem. 2009;92:410–416. doi: 10.1016/j.nlm.2009.05.007. [DOI] [PMC free article] [PubMed] [Google Scholar]
- 67.Ye X, Gao X, Scott T, Tucker KL. Habitual sugar intake and cognitive function among middle-aged and older Puerto Ricans without diabetes. Br J Nutr. 2011;106:1423–1432. doi: 10.1017/S0007114511001760. [DOI] [PMC free article] [PubMed] [Google Scholar]