Abstract
Spectral photon counting computed tomography (SPCCT) is an emerging medical imaging technology. SPCCT scanners record the energy of incident photons, which allows specific detection of contrast agents due to measurement of their characteristic x-ray attenuation profiles. This approach is known as K-edge imaging. Nanoparticles formed from elements such as gold, bismuth or ytterbium have been reported as potential contrast agents for SPCCT imaging. Furthermore, gold nanoparticles have many applications in medicine, such as adjuvants for radiotherapy and photothermal ablation. Specific, longitudinal imaging of the biodistribution of nanoparticles would be highly attractive for their clinical translation. We therefore studied the capabilities of a novel SPCCT scanner to quantify the biodistribution of gold nanoparticles in vivo. PEGylated gold nanoparticles were used. Phantom imaging showed that concentrations measured on gold images correlated well with known concentrations (slope = 0.94, intercept = 0.18, RMSE = 0.18, R2 = 0.99). The SPCCT system allowed repetitive and quick acquisitions in vivo, and follow-up of changes in the AuNP biodistribution over time. Measurements performed on gold images correlated with the Inductively coupled plasma-optical emission spectrometry (ICP-OES) measurements in the organs of interest (slope = 0.77, intercept = 0.47, RMSE = 0.72, R2 = 0.93). TEM agreed with the imaging and ICP-OES in that much higher concentrations of AuNP were observed in the liver, spleen, bone marrow and lymph nodes (mainly in macrophages). In conclusion, we found that SPCCT is capable of repetitive and non invasive determination of the biodistribution of gold nanoparticles in vivo.
Keywords: Spectral photon-counting computed tomography, blood pool, gold nanoparticles, biodistribution, pharmacokinetics, K-edge imaging, contrast agent
Novelty of the work
A new spectral photon-counting CT prototype has the potentiel for non-invasive quantitative determination of gold nanoparticle biodistribution in vivo over time.
Introduction
Since its introduction in the early 1970s, computed tomography (CT) has become the workhorse of diagnostic imaging owing to its cost effectiveness, wide availability, high spatial resolution, high temporal resolution, and diagnostic benefits. A current major area of research in CT is the use of photon counting detectors, referred to as spectral photon-counting CT (SPCCT), or as multicolor CT1–4. The photon-counting detectors are able to measure the energy of individual photons transmitted through the subject based on pulse height analysis, and to allocate this information between multiple energy thresholds, called bins, leading to energy-based attenuation profiles of tissue3. One of the strengths of SPCCT is its ability to specifically detect exogenous contrast media. This is possible due to edges in the x-ray attenuation profiles of elements such as gold, which have their K-edge binding energy in the relevant energy range of the x-ray spectrum (K-edge energy of gold is 80.7 keV). This approach is known as K-edge imaging and eliminates the need for imaging before and after injection, since the location of the contrast media can be determined solely from post-injection scan, streamlining the imaging and image analysis process. For instance, De Vries et al. investigated the feasibility and the accuracy of a small animal SPCCT scanner to determine the concentration and localization of iodine-based contrast agents in mice5.
Clinical computed tomography relies on the use of iodinated contrast agents. However, these iodinated agents have a number of limitations. Some patients are hypersensitive to iodinated agents6. These agents are contra-indicated for use in patients with renal insufficiency, as their use in such patients can lead to further reduction in kidney function, an event known as contrast-induced nephropathy7. Moreover, they are non-specific with diffuse interstitial distribution and suffer from short imaging windows due to rapid renal clearance. Finally, the K-edge energy of iodine, 33.2 keV, is too low to be detected with clinical SPCCT systems, because of low x-ray flux at that point in the energy spectrum caused by high patient absorption. Thus there is a compelling need to develop novel contrasts agents for use with SPCCT.
Meanwhile, the field of nanoparticle contrast agents for CT has expanded rapidly over the past decade. Nanoparticles based on heavy elements, such as gold nanoparticles (AuNP), can overcome the drawbacks of small molecule iodinated CT contrast agents8–13. Several groups have demonstrated AuNP to be highly effective x-ray contrast agents, producing stronger contrast than iodinated agents, having the potential to circulate longer than iodinated contrast agents for improved blood pool imaging and possessing high biocompatibility9,12,14–16. In addition, gold nanoparticles have been shown to be potent contrast agents for SPCCT17 and have been shown to be effective imaging agents for characterization of atherosclerosis with a preclinical system18. Moreover, gold nanoparticles and nanoparticles based on other heavy elements have been employed in a plethora of biomedical applications such as adjuvants for radiotherapy, photothermal ablation, drug delivery, photoacoustics, surface enhanced Raman imaging and others19. Methods that would allow the non-invasive assessment of the biodistribution of such agents at multiple time points would be highly valuable.
SPCCT has the potential to track the biodistribution and elimination of heavy element based agents over time via repeated scanning, sparing the need to sacrifice animals at each time point to perform ex vivo analyses or to perform radiolabeling. However, to the best of our knowledge, studying the biodistribution of agents over extended timeframes with SPCCT has not been previously reported. This was due to the limitations of early SPCCT systems, such as very long scan times5 that prevented in vivo image acquisitions. SPCCT systems have now been developed with image acquisition times of 1 second that allow dynamic and repetitive imaging in vivo, such as a small field of vue (FOV) SPCCT prototype system derived from a modified clinical CT system4.
The purpose of this study was to investigate the feasibility of SPCCT for specific characterization and quantification of a gold nanoparticle contrast agent’s organ biodistribution in vivo over time.
Results and Discussion
Nanoparticle preparation and characterization
AuNP were prepared from reduction of gold chloride with sodium citrate in boiling water, and then capped with thiol-PEG-2000. This process yielded gold nanoparticles (Fig. 1A) with a core size of 12.5 nm as found from transmission electron microscopy (TEM) (Fig. 1B) and mean hydrodynamic diameter of 18 nm as determined by dynamic light scattering (DLS). The concentration of the gold solution was determined from inductively coupled plasma-optical emission spectroscopy (ICP-OES) to be 65 mg/ml. The pH was the same as that of iopamidol and phosphate buffered saline (PBS) solutions (7.46 ± 0.05). The viscosity of an x-ray contrast agent needs to be low to allow rapid injection and to avoid adverse side effect20. We therefore measured the viscosity of the AuNP. The dynamic viscosity of the gold nanoparticles was lower than that of iopamidol, being 1.14 ± 0.03 mPa/s and 1.28 ± 0.18 mPa/s respectively, indicating the gold nanoparticles have good viscosity for in vivo applications.
Figure 1.
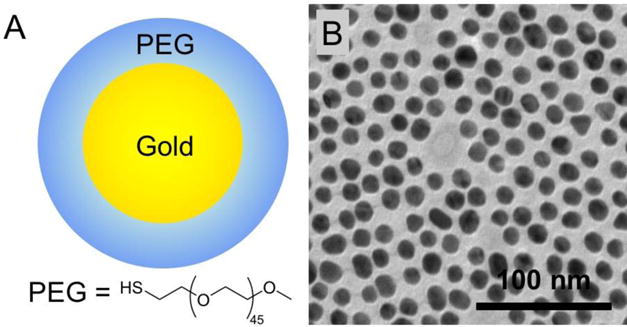
(A) Schematic representation of the AuNP. (B) Transmission electron micrograph of the AuNP.
SPCCT phantom imaging
We performed phantom imaging experiments to test the specific material discrimination capabilities of this SPCCT prototype. The images of the phantom provided by the SPCCT system are conventional CT images, water material decomposition images and gold images (Fig. 2B). As can be seen, the scanner could specifically detect and accurately quantify the range of concentrations of AuNP, with a very good linear correlation between the concentrations measured on the gold images and the concentrations prepared having a slope close to 1 (slope = 0.94, intercept = 0.17, R2 = 0.99, RMSE = 0.18), and good agreement with a bias of 0.11 demonstrated by the Bland-Altman analysis (Fig. 2C–D). The PBS in the tubes is seen in the water images, as is the plastic of the phantom and the tubes, since it has a similar x-ray attenuation profile to water.
Figure 2.
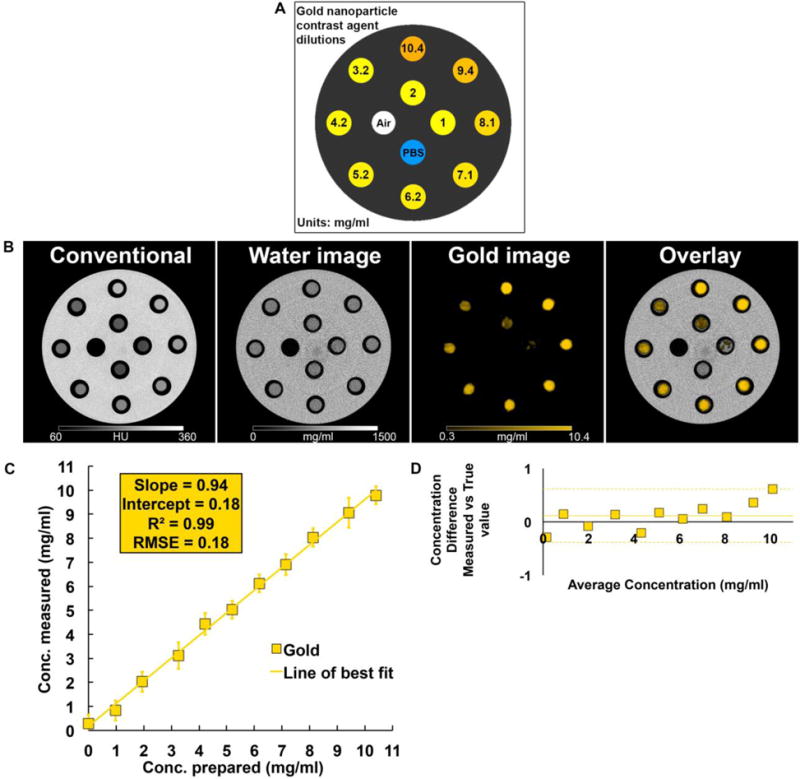
(A) Diagram of the phantom used. (B) SPCCT derived images (left to right: conventional CT image, water material decomposition, gold image, overlay of gold image on water image). (C) Comparison between the expected and measured concentrations. (D) Bland-Altman plot depicting the comparison of gold content between the prepared and measured concentration as determined by SPCCT image analysis.
In vivo SPCCT imaging
New Zealand White rabbits were injected with AuNP without any obvious side effects and scanned three times on the day of injection (once pre- (T0) and twice post-injection (T1, T2)). They were also scanned at one week (W1), one month (M1) and six months (M6) post-injection in order to determine and quantify the biodistribution of the contrast agent. The contrast agent was chosen because its K-edge is at 80.7 keV, relatively close to the effective energy of the x-ray spectrum used (30–120 keV). Furthermore, these AuNP have long circulation times permitted by the hydrodynamic diameter of 18 nm and the thiol-PEG coating9. Last, there is widespread interest in the use of gold nanoparticles in an array of diagnostic and therapeutic applications21–25.
The SPCCT system allowed us to perform repetitive imaging in vivo with 1-second acquisition times and provided conventional CT and quantitative gold images (Figs. 3–6). The gold images allowed specific detection of gold nanoparticles in the organs of interest and showed differential temporal uptake between organs (Figs. 3 & 6). For example, AuNP were highly concentrated in blood at 8 min post injection (4.76±0.51 mg/ml), but negligible values were found at one week and one month post-injection (0.16±0.42 mg/ml), matching the expected blood pool pharmacokinetics9. On the other hand, the gold content in the liver, spleen, and bone marrow, was lower at T1 and T2 (gold content at these time points is likely due to AuNP in the blood perfusing the organs) with persistent higher concentrations in scans acquired at 1 week, 1 month and 6 months (Figs. 3–6). At the last time point, the SPCCT system was used to perform a helical scan that covered the entire body of the animal (Fig. 5). This whole body scan revealed lymph nodes that contained gold with a concentration in the same range as the spleen. The liver, spleen and bone marrow are part of the mononuclear phagocyte system (MPS), and had sustained gold uptake and retention over time (Fig. 6). The gold content observed in the muscle and brain was close to zero at all time points, which is as expected since the nanoparticles are too large to extravasate in these organs. In the kidney and the urinary cavity, about 2 mg/ml of gold was detected at T1 and T2 without any signal at follow-up. A table with the gold concentrations in the organs, as determined from image analysis is presented in the supplementary information.
Figure 3.
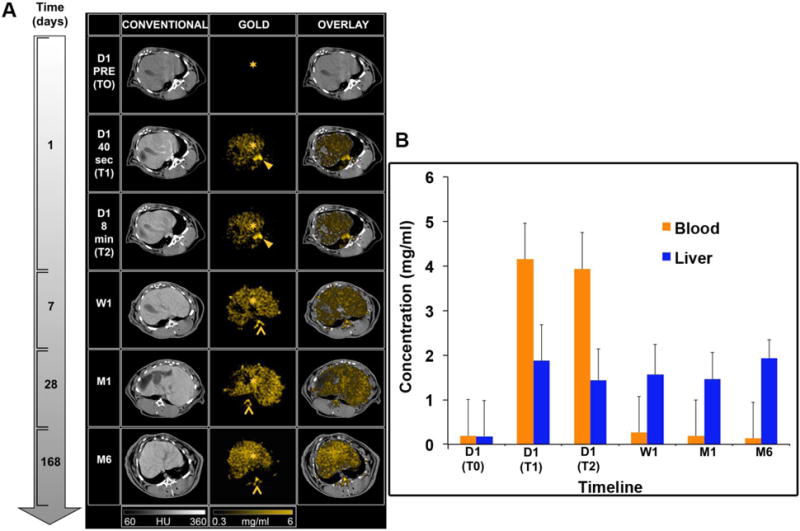
(A) SPCCT images displaying the AuNP biodistribution in the liver over time (left to right: conventional CT image, gold image, overlay). Star: liver, arrowhead: aorta, chevron: bone marrow. (B) Gold content in the liver and blood at various time points, as determined from SPCCT image analysis.
Figure 6.
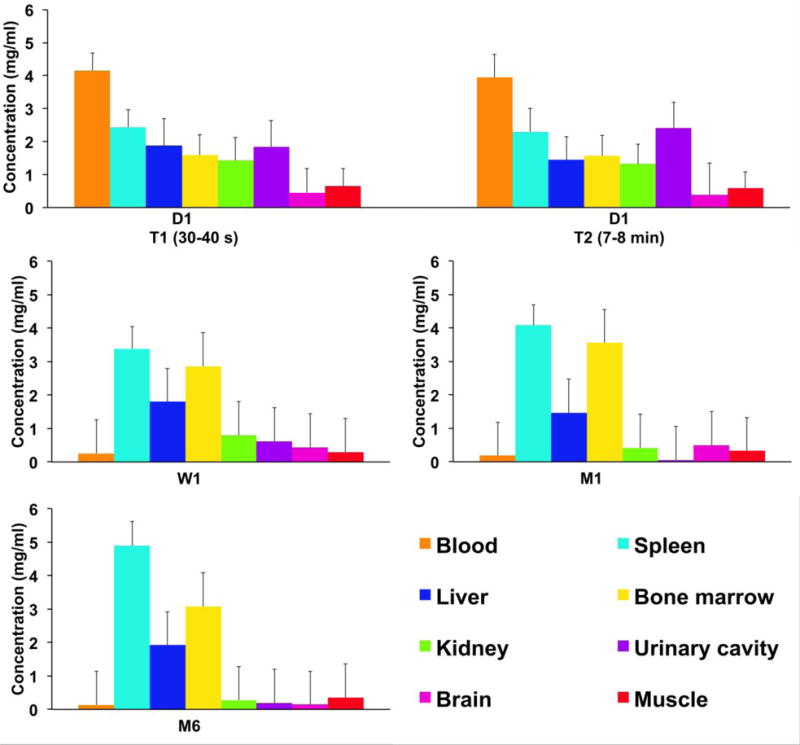
The biodistribution of AuNP among the organs of interest at several time points. Error bars represent the mean of the noise in the ROIs.
Figure 5.
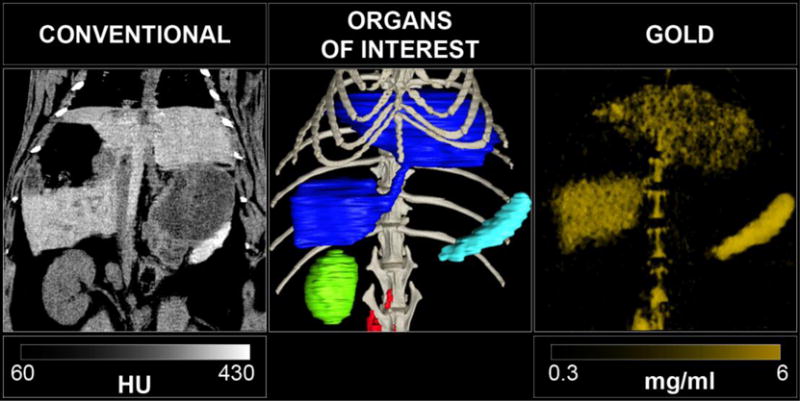
Left: Abdomen SPCCT images of a rabbit at 6 months after injection of gold nanoparticles with coronal conventional CT image, center: 3D volume rendering reconstruction of the conventional HU images with segmentation of the organs of interest (dark blue: liver, light blue: spleen, green: right kidney, red: lymph nodes, light grey: bone structure), right: 3D volume rendering reconstruction of the gold images.
Ex vivo analysis
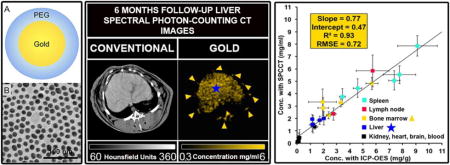
In order to determine whether the measurements acquired from the SPCCT system were accurate, we sacrificed the animals (2 animals at 6 months, 2 animals at 1 month, 1 animal at one week) and performed ICP-OES on the organs (n=25). Comparison between concentrations measured with SPCCT and ICP-OES showed a linear correlation between the two measurements (R2 = 0.93, intercept = 0.47, RMSE = 0.77) (Fig. 7A), and agreement with a bias of 0.11 demonstrated by the Bland-Altman analysis (Fig. 7B). SPCCT underestimated the gold concentration in the organs by 23% on average with an offset of 0.47, compared to ICP-OES values, however, this indicates quite good accuracy (Fig. 7A). There was no significant difference with a paired-T test analysis (p>0.05). Moreover, the data indicates that the highest concentration of AuNP is in the spleen.
Figure 7.
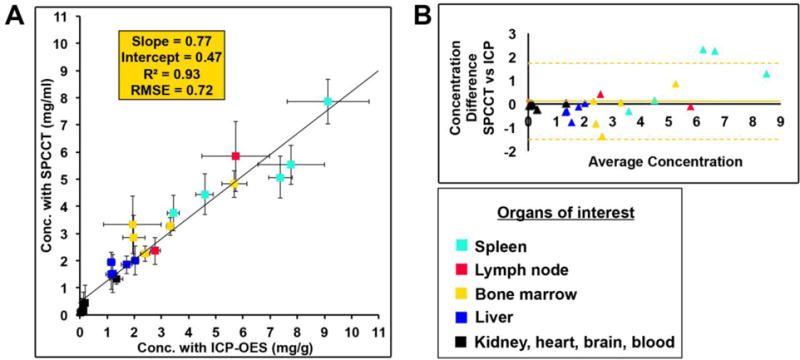
(A) Comparison between the expected and measured concentrations. (B) Bland-Altman plot depicting the comparison of gold content in rabbit organs as determined via ICP-OES and SPCCT image analysis.
Furthermore, to probe the localization of AuNP in organs, we performed TEM on tissues excised from the animals at the 6 month time point. We found the AuNP in these tissues to be intact and of similar size to those injected. We mostly observed AuNP aggregated inside lysosomes within macrophages in the organs of the MPS, i.e. liver, spleen, bone marrow and lymph nodes (Fig. 8A–L). AuNP were absent in cardiac and brain tissues (Fig. S1A–F). Moreover, surprisingly, we observed small amounts of AuNP in the renal mesangial cells behind the glomerular membrane (Fig. S1G–I).
Figure 8.
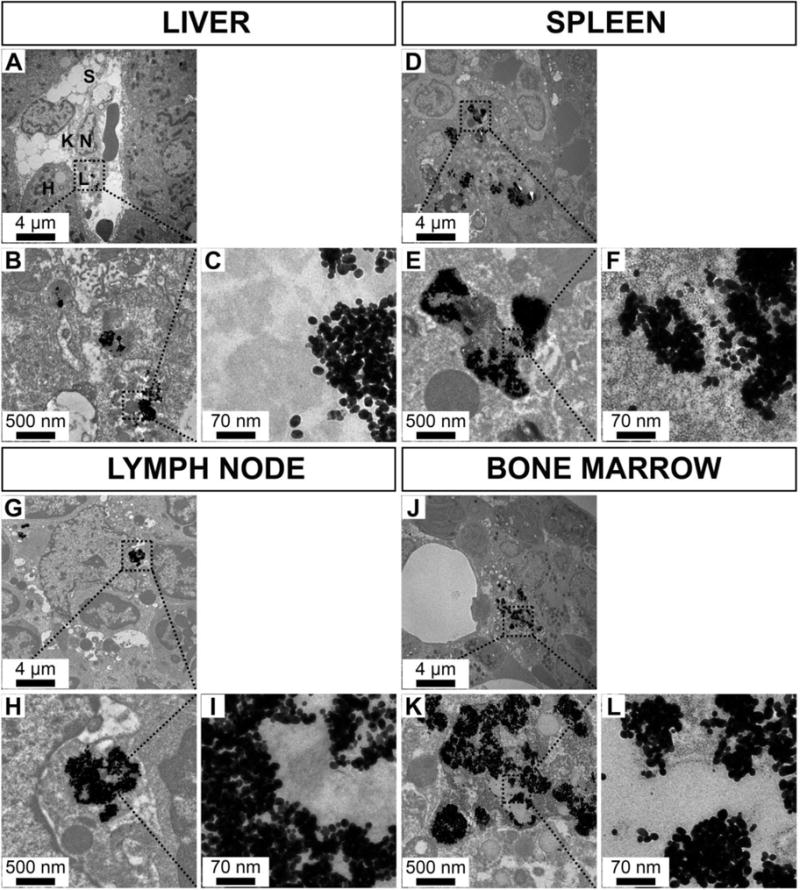
Transmission electron micrographs of rabbit organs from the mononuclear phagocyte system 6 months after AuNP injection over a range of magnifications. A-C: liver, D-F: spleen, G-I: lymph node, J-L: bone marrow (H: hepatocyte, K: Kuppfer cell, L: lysosome, N: nucleus, S: sinusoid).
In this study, we demonstrated that a small FOV spectral photon-counting computed tomography prototype system derived from a modified clinical CT system enables repeated, noninvasive quantitative biodistribution analysis of AuNP in vivo with good accuracy compared to ICP-OES. We also demonstrated the capability of the SPCCT system to detect and quantify AuNP that accumulated in the MPS.
In SPCCT, the transmitted spectrum is collected by photon-counting detectors that have the ability to respond individually to every single photon received and discriminate their energy26,27. The photons are divided into multiple different energy windows, referred to as bins, for which one or more boundaries can be adjusted to match the K-edge of the contrast agent studied, the K-edge being the binding energy of the K shell electron of an atom3,28–30. The limitation of previous SPCCT systems was their lengthy scan times, which were as much as 24 hours for whole body imaging of a mouse31. This was due to the low photon flux needed to avoid pulse pileup in the detectors and limited number of detector rows. The small FOV SPCCT prototype scanner used for this study is equipped with detectors that have high flux capacity allowing high temporal resolution (1–1.5 seconds) compared to the previously reported prototypes32, allowing for the dynamic and repetitive imaging in vivo reported herein33.
Several advantages of using SPCCT for gold imaging have been highlighted in this study. First, the detection of AuNP in the bone marrow is remarkable, since contrast arising in that tissue would likely have gone unnoticed or be undetectable on conventional images due to the nearby presence of bone, although the accuracy of detection in the bone marrow is not as good as for other organs as can be seen in Figure 7, which may be due to factors such as beam hardening34. This highlights the strength of SPCCT, i.e. detection of contrast material close to calcified structures. Moreover, a good linear correlation in phantom imaging between SPCCT and prepared concentrations, and in vivo imaging between ICP-OES and SPCCT derived concentrations has been demonstrated, indicating that SPCCT is a non-invasive quantitative imaging technique5,28,35. This capacity is promising as a new tool for assessing non-invasively the biodistribution of materials that have a K-edge between ~40–100 keV, as opposed to ICP-OES based approaches, in which multiple groups of animals have to be sacrificed in a serial fashion and their organs dissected to obtain the biodistribution of contrast media at different time points. In addition, K-edge images benefit from the high spatial resolution provided by the photon-counting detectors as well as for the conventional CT images26. Finally, the added value provided by the multi bin photon-counting data is to provide both anatomical information from conventional CT images and specific information from material decomposition images simultaneously, allowing tracking of a targeted heavy element for functional information. Some of the competing techniques requiring two scans to be acquired can suffer from motion between the acquisitions and therefore image registration issues36, and expose the subject to higher radiation dose.
Gold nanoparticles are being explored in many applications in the biomedical field such as contrast agents for medical imaging11,14, drug delivery, targeted killing of cells21 and also therapeutic applications, such as theranostic agents37 and radiosensitization38. This has led to numerous investigations of their toxicity and biodistribution. Previously, Naha et al.12 have shown good cytocompatibility in vitro for this AuNP, with no effect on cell cytoskeleton or cell spreading.
In vivo, we confirmed the blood pool effect of the AuNP with scant change in blood concentration between scans acquired immediately after injection and acquired at 8 minutes post injection. Indeed, the gold nanoparticles are designed for long lasting vascular phase CT imaging, and are referred to as a blood pool contrast agent. They are designed to be biocompatible without toxicity at very high concentrations, as Cai et al. showed in mice9, due to the PEG coating that increases its circulation half-life and reduces interactions with serum proteins. As they are 18 nm in diameter, theoretically no renal excretion was expected39. While, some gold signal was observed in the renal pelvis, ICP and UV/vis analysis of the urine did not indicate the presence of and AuNP. Therefore the signal in the renal pelvis is likely due to AuNP in the blood in this tissue.
Retention of AuNP over time was demonstrated in organs of MPS, e.g. the bone marrow, the liver, and the spleen, confirmed by the TEM of these tissues, which revealed retention in the macrophages. These findings supported the results of Naha et al.12 that typically observed macrophages to be more sensitive to AuNP as compared to epithelial and fibroblast cells, likely due to their higher phagocytic activity and thus higher uptake of nanoparticles. Thus we corroborated the results of Cai et al.9 who demonstrated that AuNP are taken up by the MPS organs.
Moreover, retention of AuNP at six months is consistent with the life span of tissue macrophages, which is several months or years, as well as the data of others9,40. Finally, we noticed retention in the mesenteric lymph nodes via hyper-intensities that appeared in the gold images, but would likely not have been noticed on conventional CT images. In summary, our study of biodistribution kinetics of these Au-NP demonstrated a biphasic clearance of the nanoparticles, i.e. a steady state of the agent in the blood compartment after injection and a subsequent slow clearance of the dose into the organs of the MPS, indicating poor biological elimination leading to potential concerns over long-term safety, although Hainfeld et al. did not find any evidence of toxicity in mice over one year41.
These findings emphasize the potential of SPCCT for mapping specific tissues due to their uptake of a contrast agent within clinically significant range of sensitivity and detection threshold (1 mg/ml), similar to previous publications using dual energy CT13 and spectral CT42. This capability should be used for diagnosing pathologic conditions with a differing uptake of the contrast agent. Indeed, this diagnostic approach is known and has already been used clinically, i.e. for localization of the sentinel lymph nodes in breast cancer with MRI via the use of an iron oxide nanoparticle that is not taken up by pathologic lymph nodes43 or imaging of the biliary tract via the use of an MRI-specific gadolinium contrast agent that is not excreted in cases of biliary cancer44. Compared with other techniques such as MRI or nuclear imaging, the strengths of SPCCT for this type of application would be its high temporal and spatial resolution, as well as whole-body imaging capabilities. Moreover, SPCCT, as a pragmatic non-invasive tool for determining quantitative biodistribution in vivo over time, may be advantageous for use in the developing field of nanotechnology, which frequently uses heavy elements such as gold, bismuth, ytterbium, tantalum8,27,45–47.
Quantification of gold using ICP-OES was only performed at late time points. At these time points, significant quantities of gold were only found in the MPS organs, therefore the accuracy of the system was not tested in blood, muscle, brain. However, physics suggests that the system should be accurate for those tissues as well. We only compared ICP-OES to SPCCT for a limited number of animals, i.e. n=5, although the total number of organs compared was 25. The scanner used currently has small field of view and z-coverage, limiting its ability to perform rapid, whole body imaging. Only five animals were used for the in vivo imaging, limiting statistical power. In addition, we did not study human subjects, for whom results may vary compared to this relatively small animal model, as the X-ray attenuation of humans will be greater. Finally, we have only studied gold based agents in this report, while agents based on bismuth, tantalum, ytterbium and other elements have been reported as CT contrast agents and for other applications10,47–51.
Conclusions
In summary, we have demonstrated the potential of the newly developed small FOV SPCCT prototype imaging system for non-invasive quantitative determination of gold nanoparticle biodistribution in vivo over time, giving us confidence about the impact of SPCCT on nanoparticle development. Moreover, we have shown that the AuNP used in this study are effective contrast agents for the vascular system initially and for the MPS over time, providing potential applications in the field of cardiovascular disease and cancer.
Experimental
SPCCT system
The SPCCT scanner (Philips Healthcare, Haifa, Israel) is a modified clinical base prototype that has a small field-of-view (FOV) of 168 mm in-plane and with 2 mm z coverage, equipped with a conventional X-ray tube. Energies below 30 keV are filtered by pre-patient collimation and not transmitted, such as with a conventional clinical CT system. The photon-counting detectors are energy-sensitive detectors that have 5 rate counters with 5 different configurable energy thresholds52. For this study, the energy bins were set to 30–53, 53–78, 78–83, 83–98, 98–120 keV in order to benefit from high differential sensitivity to materials with differing atomic numbers, and in particular from the K-edge absorption of gold (80.7 keV). A full description of the SPCCT system can be found elsewhere. Axial acquisitions were performed at 100 mA and 120 kVp with a gantry rotation time of 1 s and 2400 projections per rotation for the phantom and animal experiments. One additional helical acquisition was performed at the last time point to visualize whole body nanoparticle uptake.
SPCCT images
Multi-bin photon-counting data were pre-processed and a conventional CT image was derived from the information contained in all energy bins using a proprietary algorithm, corresponding to sum counts prior to reconstruction. After pile-up correction, material decomposition images were derived from the multi-bin photon-counting data and included a maximum-likelihood based material decomposition of the attenuation into water, iodine and gold material bases3,33. The iodine images were formed as part of the standard reconstruction protocol, but were not analyzed as no iodine contrast agent injection was done. The resulting gold and water images are displayed in units mg/ml. Note that the gold images are K-edge images since they are formed from information derived from bins placed around the K-edge of gold. Images were reconstructed on a voxel grid of 0.25×0.25×0.25 mm³ using conventional filtered back-projection without further post-processing besides removal of ring artifacts and utilization of a 2 pixel sigma Gaussian filter. For the analysis, the gold and water images were averaged to a slice thickness of 2 mm. For the representation of the organs of interest in the Figure 7, segmentation was done on the conventional images, while bone delineation was performed using windowing thresholds. No segmentation for the gold images was performed because of the specificity of the gold signal based on the gold images.
Gold nanoparticles preparation and characterization
Gold nanoparticles were synthesized, based on previously reported methods12,53. The cores were formed by reducing gold chloride via addition of sodium citrate while at boiling point. Methoxy-PEG-2000-thiol was used to coat the resulting gold nanoparticles. The nanoparticles were washed three times with phosphate-buffered saline (PBS), concentrated and sterilized via syringe filtration. Samples of the final product were characterized with transmission electron microscopy (TEM) using a JEOL 1010 microscope, dynamic light scattering (DLS) using a Malvern Instruments Nano ZS 90 and inductively coupled plasma-optical emission spectroscopy (ICP-OES) using a Spectro Genesis system. The dynamic viscosity and the pH were also evaluated and compared to an iodinated contrast agent, iopamidol (65 mg/ml), and PBS. Viscosity was measured using a RFS3 rheometer from TA Instruments (New Castle DE). A pH meter was used.
Phantom imaging
In order to validate the quantification of gold using K-edge information, a cylindrical phantom of 15 cm diameter and made of acetal homopolymer was used. Ten 1.5 ml polypropylene centrifuge tubes, 1 cm in diameter, were filled with AuNP samples ranging in concentration from 1 to 10.4 mg/ml, diluted with PBS, and one was only filled with PBS. The design of the phantom is schematically depicted in Fig. 2A.
Animal experiments
Experiments were conducted with approval from the Institutional Animal Care and Use Committee (Council Directive No. 2010/63/UE on the protection of animals used for scientific purpose) under authorization number APAFIS#1732-2015091411181645v3. Five New Zealand white rabbits (Charles River, Canada, mean weight, 3.1 ± 0.5 kg; 2 females, 3 males; mean age, 7.4 ± 2.7 months) were anesthetized with 0.25 mg/kg intramuscular injection of médétomidine (1.0 mg/ml, Orion Pharma, Orion Corporation, Espoo, Finland) and 20 mg/kg intramuscular injection of ketamine (10.0 mg/ml, Merial, Lyon, France). 22-gauge auricular vein catheters were placed. A veterinary handheld pulse oximeter and carbon dioxide detector (Model 9847V, Nonin Medical, Inc, Plymouth, Minnesota) with a remote sensor pulse placed on earlobe was used to monitor heart beat and oxygen saturation. Rabbits are the smallest animal model whose blood vessels are practical to image with a clinical scanner and have the benefit that the doses of contrast agent that need to be synthesized are relatively low compared with a larger animal model such as a pig.
3.5 ml/kg (about 12 ml) of gold nanoparticles were injected through the catheter placed in the auricular vein at 1 ml/sec. After the last imaging session, animals were euthanized using a lethal dose of Dolethal (Vetoquinol, Kontichsesteenweg, Aartselaar, Belgium). Specific organs were removed and prepared for gold content analysis using ICP-OES for comparison with SPCCT-based quantification of gold.
Images were acquired on the day of injection (D1), one week (W1), one month (M1) and six months later (M6). Imaging was performed at three time points on the day of injection, i.e. before injection (T0), 30–45 seconds (T1) and 7–8 minutes (T2) after injection of AuNP, with images acquired at the level of the heart, liver, spleen, kidney, urinary cavity and brain. Images were acquired in the same organs at W1, M1 and M6 without additional injection of gold nanoparticles. A whole body scan was performed at the M6 time point. SPCCT images were acquired using the same scan parameters as used for the phantom scan.
Image processing
Axially acquired conventional CT images, water and gold images were analyzed using ImageJ software54. The attenuation values in HU were recorded from one slice, and the concentrations of gold (mg/ml) were recorded from an average of eight adjacent slices measurements, by manually drawing regions of interest (ROIs) in all rabbits for the imaged organs: thoracic aorta, myocardium, liver, spleen, left kidney and/or right kidney, bladder, paravertebral muscle, adipose tissue, bone marrow and brain. All ROIs were manually traced in the organs of interest by a senior radiologist (SSM, 6 years of experience) on the conventional images prior to retrieval of the gold concentrations per organ to avoid operator bias and then automatically copied on the gold images.
Inductively coupled plasma-optical emission spectrometry (ICP-OES)
Ex vivo analysis of the biodistribution of the gold nanoparticle was done using ICP-OES (Spectro Genesis ICP) according a protocol published elsewhere23. The organs taken from the sacrificed animals were weighed, minced into small pieces and then 1 g portions were digested using 800 μl of concentrated nitric acid at 75 °C for 16 hours. After digestion with nitric acid, 250 μl of concentrated hydrochloric acid was added to each sample and the samples were incubated at 37 °C for 3 hours. After this incubation, the final volume of each sample was made to 3.5 ml with DI water. The gold content in each sample was analyzed using ICP-OES, reporting concentrations in mg/g. The SPCCT, since the images acquired were volumes, reported gold content as mg/ml.
Transmission electron microscopy
Organs of interest (liver, spleen, bone marrow, kidney, brain) were harvested, cut into one millimeter cubes, prefixed in 2.5% glutaraldehyde and prepared for TEM analysis using a conventional method55. Sections were examined with a JEOL 1400JEM (Tokyo, Japan) transmission electron microscope equipped with an Orius 1000 camera and Digital Micrograph.
Statistics
For phantom analysis, linear regression was used to assess correlation between the measured and the expected concentrations. For the in vivo study, linear regression and paired T-test were used to assess correlation and difference respectively between the measured concentrations by SPCCT and the concentration determined by the gold standard ICP-OES. Bland-Altman analysis was performed for both experiments.
Supplementary Material
Figure 4.
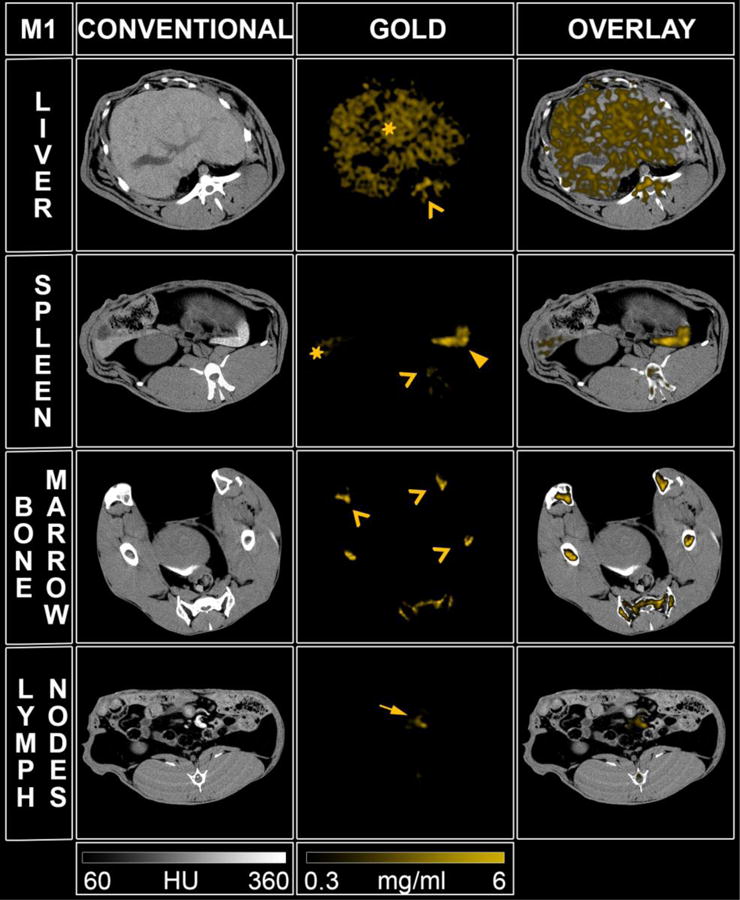
SPCCT images displaying the AuNP retention at one month (M1) in the organs of the mononuclear phagocyte system (left to right: conventional CT image, gold image, overlay). Star: liver, head arrow: spleen, chevron: bone marrow, full arrow: lymph node.
Acknowledgments
This project has received funding from the EU’s H2020 research and innovation program under the grant agreement No. 633937. This work was supported by funding from NIH grant R01 HL131557 (DPC).
Footnotes
Supplementary information: the online supplementary information file contains a table with the organ gold content, as determined from SPCCT image analysis. Transmission electron micrographs of the heart, kidney and brain are also provided.
References
- 1.McCollough CH, Leng S, Yu L, Fletcher JG. Radiology. 2015;276:637–653. doi: 10.1148/radiol.2015142631. [DOI] [PMC free article] [PubMed] [Google Scholar]
- 2.Roessl E, Brendel B, Engel KJ, Schlomka JP, Thran A, Proksa R. IEEE Trans Med Imaging. 2011;30:1678–1690. doi: 10.1109/TMI.2011.2142188. [DOI] [PubMed] [Google Scholar]
- 3.Schlomka JP, Roessl E, Dorscheid R, Dill S, Martens G, Istel T, Bäumer C, Herrmann C, Steadman R, Zeitler G, Livne A, Proksa R. Phys Med Biol. 2008;53:4031–4047. doi: 10.1088/0031-9155/53/15/002. [DOI] [PubMed] [Google Scholar]
- 4.Si-Mohamed S, Bar-Ness D, Sigovan M, Cormode DP, Coulon P, Coche E, Vlassenbroek A, Normand G, Boussel L, Douek P. Nucl Instrum Methods Phys Res Sect Accel Spectrometers Detect Assoc Equip. doi: 10.1016/j.nima.2017.04.014. [DOI] [Google Scholar]
- 5.de Vries A, Roessl E, Kneepkens E, Thran A, Brendel B, Martens G, Proska R, Nicolay K, Grüll H. Invest Radiol. 2015;50:297–304. doi: 10.1097/RLI.0000000000000126. [DOI] [PubMed] [Google Scholar]
- 6.Cochran ST. Curr Allergy Asthma Rep. 2005;5:28–31. doi: 10.1007/s11882-005-0051-7. [DOI] [PubMed] [Google Scholar]
- 7.McCullough PA, Adam A, Becker CR, Davidson C, Lameire N, Stacul F, J. Tumlin and CIN Consensus Working Panel Am J Cardiol. 2006;98:5K–13K. doi: 10.1016/j.amjcard.2006.01.019. [DOI] [PubMed] [Google Scholar]
- 8.Cormode DP, Naha PC, Fayad ZA. Contrast Media Mol Imaging. 2014;9:37–52. doi: 10.1002/cmmi.1551. [DOI] [PMC free article] [PubMed] [Google Scholar]
- 9.Cai QY, Kim SH, Choi KS, Kim SY, Byun SJ, Kim KW, Park SH, Juhng SK, Yoon KH. Invest Radiol. 2007;42:797–806. doi: 10.1097/RLI.0b013e31811ecdcd. [DOI] [PubMed] [Google Scholar]
- 10.Jakhmola A, Anton N, Vandamme TF. Adv Healthc Mater. 2012;1:413–431. doi: 10.1002/adhm.201200032. [DOI] [PubMed] [Google Scholar]
- 11.Hainfeld JF, Slatkin DN, Focella TM, Smilowitz HM. Br J Radiol. 2006;79:248–253. doi: 10.1259/bjr/13169882. [DOI] [PubMed] [Google Scholar]
- 12.Naha PC, Chhour P, Cormode DP. Toxicol In Vitro. 2015;29:1445–1453. doi: 10.1016/j.tiv.2015.05.022. [DOI] [PMC free article] [PubMed] [Google Scholar]
- 13.Ghann WE, Aras O, Fleiter T, Daniel MC. Langmuir ACS J Surf Colloids. 2012;28:10398–10408. doi: 10.1021/la301694q. [DOI] [PubMed] [Google Scholar]
- 14.Galper MW, Saung MT, Fuster V, Roessl E, Thran A, Proksa R, Fayad ZA, Cormode DP. Invest Radiol. 2012;47:475–481. doi: 10.1097/RLI.0b013e3182562ab9. [DOI] [PMC free article] [PubMed] [Google Scholar]
- 15.Clark DP, Ghaghada K, Moding EJ, Kirsch DG, Badea CT. Phys Med Biol. 2013;58:1683–1704. doi: 10.1088/0031-9155/58/6/1683. [DOI] [PMC free article] [PubMed] [Google Scholar]
- 16.Cormode DP, Naha PC, Fayad ZA. Contrast Media Mol Imaging. 2014;9:37–52. doi: 10.1002/cmmi.1551. [DOI] [PMC free article] [PubMed] [Google Scholar]
- 17.Pan D, Schirra CO, Wickline SA, Lanza GM. Contrast Media Mol Imaging. 2014;9:13–25. doi: 10.1002/cmmi.1571. [DOI] [PMC free article] [PubMed] [Google Scholar]
- 18.Cormode DP, Roessl E, Thran A, Skajaa T, Gordon RE, Schlomka JP, Fuster V, Fisher EA, Mulder WJM, Proksa R, Fayad ZA. Radiology. 2010;256:774–782. doi: 10.1148/radiol.10092473. [DOI] [PMC free article] [PubMed] [Google Scholar]
- 19.Thakor AS, Jokerst J, Zavaleta C, Massoud TF, Gambhir SS. Nano Lett. 2011;11:4029–4036. doi: 10.1021/nl202559p. [DOI] [PMC free article] [PubMed] [Google Scholar]
- 20.Lusic H, Grinstaff MW. Chem Rev. doi: 10.1021/cr200358s. [DOI] [PMC free article] [PubMed] [Google Scholar]
- 21.Weintraub K. Nature. 2013;495:S14–S16. doi: 10.1038/495S14a. [DOI] [PubMed] [Google Scholar]
- 22.Kim D, Park S, Lee JH, Jeong YY, Jon S. J Am Chem Soc. 2007;129:7661–7665. doi: 10.1021/ja071471p. [DOI] [PubMed] [Google Scholar]
- 23.Naha PC, Lau KC, Hsu JC, Hajfathalian M, Mian S, Chhour P, Uppuluri L, McDonald ES, Maidment ADA, Cormode DP. Nanoscale. 2016;8:13740–13754. doi: 10.1039/c6nr02618d. [DOI] [PMC free article] [PubMed] [Google Scholar]
- 24.Ngwa W, Kumar R, Sridhar S, Korideck H, Zygmanski P, Cormack RA, Berbeco R, Makrigiorgos GM. Nanomed. 2014;9:1063–1082. doi: 10.2217/nnm.14.55. [DOI] [PMC free article] [PubMed] [Google Scholar]
- 25.Popovtzer R, Agrawal A, Kotov NA, Popovtzer A, Balter J, Carey TE, Kopelman R. Nano Lett. 2008;8:4593–4596. doi: 10.1021/nl8029114. [DOI] [PMC free article] [PubMed] [Google Scholar]
- 26.Taguchi K, Iwanczyk JS. Med Phys. 2013;40:100901. doi: 10.1118/1.4820371. [DOI] [PMC free article] [PubMed] [Google Scholar]
- 27.Schirra CO, Brendel B, Anastasio MA, Roessl E. Contrast Media Mol Imaging. 2014;9:62–70. doi: 10.1002/cmmi.1573. [DOI] [PubMed] [Google Scholar]
- 28.Roessl E, Brendel B, Engel KJ, Schlomka JP, Thran A, Proksa R. IEEE Trans Med Imaging. 2011;30:1678–1690. doi: 10.1109/TMI.2011.2142188. [DOI] [PubMed] [Google Scholar]
- 29.Iwanczyk JS, Nygård E, Meirav O, Arenson J, Barber WC, Hartsough NE, Malakhov N, Wessel JC. IEEE Trans Nucl Sci. 2009;56:535–542. doi: 10.1109/TNS.2009.2013709. [DOI] [PMC free article] [PubMed] [Google Scholar]
- 30.Roessl E, Proksa R. Phys Med Biol. 2007;52:4679. doi: 10.1088/0031-9155/52/15/020. [DOI] [PubMed] [Google Scholar]
- 31.Cormode DP, Roessl E, Thran A, Skajaa T, Gordon RE, Schlomka JP, Fuster V, Fisher EA, Mulder WJM, Proksa R, Fayad ZA. Radiology. 2010;256:774–782. doi: 10.1148/radiol.10092473. [DOI] [PMC free article] [PubMed] [Google Scholar]
- 32.de Vries A, Roessl E, Kneepkens E, Thran A, Brendel B, Martens G, Proska R, Nicolay K, Grüll H. Invest Radiol. 2015;50:297–304. doi: 10.1097/RLI.0000000000000126. [DOI] [PubMed] [Google Scholar]
- 33.Blevis IM, Altman A, Berman Y, et al. Introduction of Philips preclinical photon counting scanner and detector technology development. Presented at the IEEE Nuclear Science Symposium and Medical Imaging Conference; San Diego, Calif. October 31–November 7, 2015. [Google Scholar]
- 34.McGinnity TL, Dominguez O, Curtis TE, Nallathamby PD, Hoffman AJ, Roeder RK. Nanoscale. 2016;8:13627–13637. doi: 10.1039/c6nr03217f. [DOI] [PubMed] [Google Scholar]
- 35.Schlomka JP, Roessl E, Dorscheid R, Dill S, Martens G, Istel T, Bäumer C, Herrmann C, Steadman R, Zeitler G, Livne A, Proksa R. Phys Med Biol. 2008;53:4031–4047. doi: 10.1088/0031-9155/53/15/002. [DOI] [PubMed] [Google Scholar]
- 36.Grosjean R, Sauer B, Guerra RM, Daudon M, Blum A, Felblinger J, Hubert J. Am J Roentgenol. 2008;190:720–728. doi: 10.2214/AJR.07.2466. [DOI] [PubMed] [Google Scholar]
- 37.Butterworth KT, Nicol JR, Ghita M, Rosa S, Chaudhary P, McGarry CK, McCarthy HO, Jimenez-Sanchez G, Bazzi R, Roux S, Tillement O, Coulter JA, Prise KM. Nanomed. 2016;11:2035–2047. doi: 10.2217/nnm-2016-0062. [DOI] [PubMed] [Google Scholar]
- 38.Laurent G, Bernhard C, Dufort S, Sánchez GJiménez, Bazzi R, Boschetti F, Moreau M, Vu TH, Collin B, Oudot A, Herath N, Requardt H, Laurent S, Vander Elst L, Muller R, Dutreix M, Meyer M, Brunotte F, Perriat P, Lux F, Tillement O, Duc GLe, Denat F, Roux S. Nanoscale. 2016;8:12054–12065. doi: 10.1039/c6nr01228k. [DOI] [PubMed] [Google Scholar]
- 39.Choi HS, Liu W, Misra P, Tanaka E, Zimmer JP, Ipe BItty, Bawendi MG, Frangioni JV. Nat Biotechnol. 2007;25:1165–1170. doi: 10.1038/nbt1340. [DOI] [PMC free article] [PubMed] [Google Scholar]
- 40.Sadauskas E, Danscher G, Stoltenberg M, Vogel U, Larsen A, Wallin H. Nanomedicine Nanotechnol Biol Med. 2009;5:162–169. doi: 10.1016/j.nano.2008.11.002. [DOI] [PubMed] [Google Scholar]
- 41.Hainfeld JF, Slatkin DN, Focella TM, Smilowitz HM. Br J Radiol. 2006;79:248–253. doi: 10.1259/bjr/13169882. [DOI] [PubMed] [Google Scholar]
- 42.Clark DP, Badea CT. Phys Med Biol. 2014;59:6445–6466. doi: 10.1088/0031-9155/59/21/6445. [DOI] [PMC free article] [PubMed] [Google Scholar]
- 43.Pouw JJ, Grootendorst MR, Bezooijen R, Klazen CAH, Bruin WIDe, Klaase JM, Hall-Craggs MA, Douek M, Ten Haken B. Br J Radiol. 2015;88:20150634. doi: 10.1259/bjr.20150634. [DOI] [PMC free article] [PubMed] [Google Scholar]
- 44.Seale MK, Catalano OA, Saini S, Hahn PF, Sahani DV. Radiogr Rev Publ Radiol Soc N Am Inc. 2009;29:1725–1748. doi: 10.1148/rg.296095515. [DOI] [PubMed] [Google Scholar]
- 45.Schirra CO, Senpan A, Roessl E, Thran A, Stacy AJ, Wu L, Proska R, Pan D. J Mater Chem. 2012;22:23071–23077. doi: 10.1039/C2JM35334B. [DOI] [PMC free article] [PubMed] [Google Scholar]
- 46.Pan D, Roessl E, Schlomka JP, Caruthers SD, Senpan A, Scott MJ, Allen JS, Zhang H, Hu G, Gaffney PJ, Choi ET, Rasche V, Wickline SA, Proksa R, Lanza GM. Angew Chem Int Ed Engl. 2010;49:9635–9639. doi: 10.1002/anie.201005657. [DOI] [PMC free article] [PubMed] [Google Scholar]
- 47.Pan D, Schirra CO, Senpan A, Schmieder AH, Stacy AJ, Roessl E, Thran A, Wickline SA, Proska R, Lanza GM. ACS Nano. 2012;6:3364–3370. doi: 10.1021/nn300392x. [DOI] [PMC free article] [PubMed] [Google Scholar]
- 48.FitzGerald PF, Colborn RE, Edic PM, Lambert JW, Torres AS, Bonitatibus PJ, Yeh BM. Radiology. 2016;278:723–733. doi: 10.1148/radiol.2015150577. [DOI] [PMC free article] [PubMed] [Google Scholar]
- 49.Bonitatibus PJ, Torres AS, Kandapallil B, Lee BD, Goddard GD, Colborn RE, Marino ME. ACS Nano. 2012;6:6650–6658. doi: 10.1021/nn300928g. [DOI] [PubMed] [Google Scholar]
- 50.Brown AL, Naha PC, Benavides-Montes V, Litt HI, Goforth AM, Cormode DP. Chem Mater Publ Am Chem Soc. 2014;26:2266–2274. doi: 10.1021/cm500077z. [DOI] [PMC free article] [PubMed] [Google Scholar]
- 51.Rathnayake S, Mongan J, Torres AS, Colborn R, Gao DW, Yeh BM, Fu Y. Contrast Media Mol Imaging. doi: 10.1002/cmmi.1687. [DOI] [PMC free article] [PubMed] [Google Scholar]
- 52.Steadman R, Herrmann C, Livne A. Nucl Instrum Methods Phys Res Sect Accel Spectrometers Detect Assoc Equip. 2017;862:18–24. [Google Scholar]
- 53.Blasi F, Oliveira BL, Rietz TA, Rotile NJ, Day H, Naha PC, Cormode DP, Izquierdo-Garcia D, Catana C, Caravan P. J Nucl Med Off Publ Soc Nucl Med. 2015;56:1088–1093. doi: 10.2967/jnumed.115.157982. [DOI] [PMC free article] [PubMed] [Google Scholar]
- 54.Schneider CA, Rasband WS, Eliceiri KW. Nat Methods. 2012;9:671–675. doi: 10.1038/nmeth.2089. [DOI] [PMC free article] [PubMed] [Google Scholar]
- 55.Horak D, Babic M, Jendelová P, Herynek V, Trchová M, Pientka Z, Pollert E, Hájek M, Syková E. Bioconjug Chem. 2007;18:635–644. doi: 10.1021/bc060186c. [DOI] [PubMed] [Google Scholar]
Associated Data
This section collects any data citations, data availability statements, or supplementary materials included in this article.


