

SUMMARY
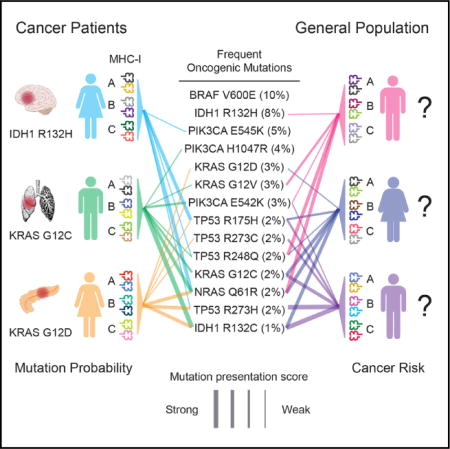
MHC-I molecules expose the intracellular protein content on the cell surface, allowing T cells to detect foreign or mutated peptides. The combination of six MHC-I alleles each individual carries defines the sub-peptidome that can be effectively presented. We applied this concept to human cancer, hypothesizing that oncogenic mutations could arise in gaps in personal MHC-I presentation. To validate this hypothesis, we developed and applied a residue-centric patient presentation score to 9,176 cancer patients across 1,018 recurrent oncogenic mutations. We found that patient MHC-I genotype-based scores could predict which mutations were more likely to emerge in their tumor. Accordingly, poor presentation of a mutation across patients was correlated with higher frequency among tumors. These results support that MHC-I genotype-restricted immunoediting during tumor formation shapes the landscape of oncogenic mutations observed in clinically diagnosed tumors and paves the way for predicting personal cancer susceptibilities from knowledge of MHC-I genotype.
Graphical Abstract
INTRODUCTION
Avoiding immune destruction is a hallmark of cancer (Hanahan and Weinberg, 2011), suggesting that the ability of the immune system to detect and eliminate neoplastic cells is a major deterrent to tumor progression. Indeed, recent studies have demonstrated that the immune system is capable of eliminating tumors when the mechanisms that tumor cells employ to evade detection are countered (Brahmer et al., 2012; Hodi et al., 2010; Topalian et al., 2012). This discovery has motivated new efforts to identify the characteristics of tumors that render them susceptible to immunotherapy (Rizvi et al., 2015; Rooney et al., 2015). Less attention has been directed toward the role of the immune system in shaping the tumor genome prior to immune evasion; however, such early interactions may have important implications for the characteristics of the developing tumor.
The theory of cancer immunosurveillance dictates that the immune system should exert a negative selective pressure on tumor cell populations through elimination of tumor cells that harbor antigenic mutations or aberrations. Under this model, tumor precursor cells with antigenic variants would be at higher risk for immune elimination and, conversely, tumor cell populations that continue to expand should be biased toward cells that avoid producing neoantigens. In model organisms, there is accumulating experimental evidence supporting that immunosurveillance sculpts the genomes of tumors through detection and elimination of cancer cells early in tumor progression (DuPage et al., 2012; Kaplan et al., 1998; Koebel et al., 2007; Matsushita et al., 2012; Shankaran et al., 2001). In humans, the observed frequency of neoantigens has been reported to be unexpectedly low in some tumor types (Rooney et al., 2015), suggesting that immunoediting could be taking place. However, this phenomenon has been challenging to study systematically because of the temporality of tumor-immune interactions as well as the difficulty accounting for individual differences in antigen presentation.
The binding affinity of the MHC-I complex for peptides is a major determinant of antigenicity and depends predominantly on three genes encoded at the human leukocyte antigen (HLA) locus on chromosome 6: HLA-A, HLA-B, and HLA-C (Sidney et al., 2008). The HLA locus is highly polymorphic, with over 10,000 distinct alleles for the three genes documented to date (Robinson et al., 2015). This diversity raises the possibility that the set of oncogenic mutations that create neoantigens may differ substantially among individuals. Indeed, neoantigens found to drive tumor regression in response to immunotherapy were almost always unique to the responding tumor (Lu and Robbins, 2016). Several studies have also reported that nonsynonymous mutation burden, rather than the presence of any particular mutation, is the common factor among responsive tumors (Rizvi et al., 2015). The paucity of recurrent oncogenic mutations driving effective responses to immunotherapy is suggestive that these mutations may less frequently be antigenic, possibly as a result of selective pressure by the immune system during tumor development.
These observations led us to hypothesize that antigenic oncogenic mutations are eliminated during the early stages of tumor development in a manner that is dependent on the subset of the oncogenic peptidome that can be presented by an individual’s MHC-I. To find evidence in support of our hypothesis, we set out to systematically characterize the interactions between patient MHC-I allele combinations and recurrent cancer mutations for thousands of tumors from The Cancer Genome Atlas (TCGA). Currently, existing state-of-the-art in silico tools allow prediction of HLA-specific MHC-I peptide binding affinities. We thus needed to first devise a score capable of estimating the qualitative likelihood of MHC-I-based presentation of sequences containing specific mutations based on peptide binding affinities while accounting for each individual’s 6 MHC alleles. We then used this score to study interactions between patient HLA alleles and the corresponding MHC-I binding affinities for over a thousand recurrent mutations in known oncogenes and tumor suppressors, which are likely to be enriched for driver mutations and other early events in cancer development (Bozic et al., 2010; McGranahan et al., 2015). This analysis revealed that patient MHC-I genotypes directly influence the probability that their tumor will acquire a recurrent oncogenic mutation, providing new evidence that immunoediting of oncogenic mutations occurs in humans and setting the stage for HLA-based precision strategies in cancer prevention and immunotherapy.
RESULTS
MHC-I Affinity-Based Scoring Scheme for Mutated Residues
To study the influence of MHC-I genotype in shaping the genomes of tumors, we developed a qualitative residue-centric presentation score and evaluated its potential to predict whether a sequence containing a residue will be presented on the cell surface. The score relies on aggregating MHC-I binding affinities across possible peptides that include the residue of interest. MHC-I peptide binding affinity predictions were obtained using the NetMHCPan3.0 tool (Vita et al., 2015), and following published recommendations (Nielsen and Andreatta, 2016), peptides receiving a rank threshold <2 and <0.5 were designated MHC-I binders and strong binders respectively. For evaluation of missense mutations, we based our score on the affinities of 38 possible peptides of length 8–11 that incorporate the amino acid position of interest (Figure 1A), while for insertions and deletions, any resulting novel peptides of length 8–11 were considered (Figure S1A).
Figure 1. Development of a Residue-Centric Presentation Score.
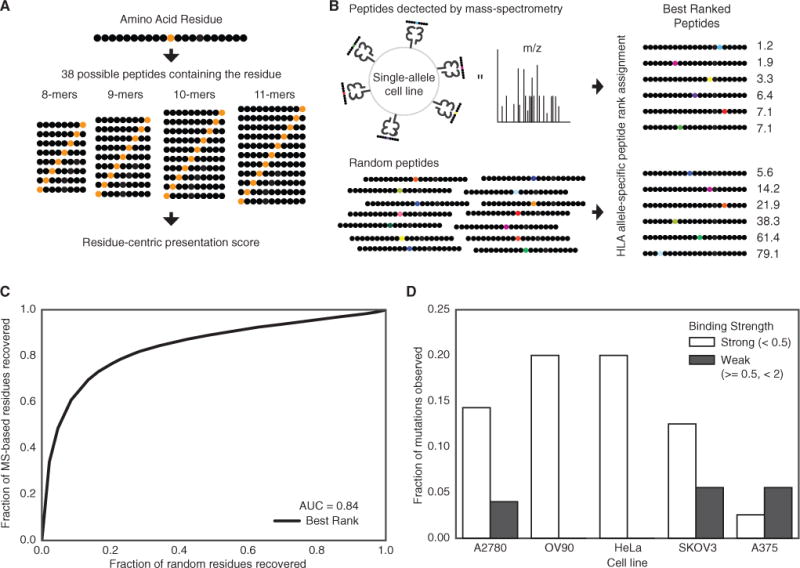
(A) A graphical representation of calculating the presentation score for a particular residue. Each residue can be presented in 38 different peptides of differing lengths between 8 and 11.
(B) Single-allele MS data from Abelin et al. (2017) was compared to a random background of peptides to determine the best residue-centric score for quantifying of extracellular presentation (best rank score shown).
(C) A ROC curve showing the accuracy of the best rank residue presentation score for classifying the extracellular presentation of a residue by an MHC allele. The aggregated presentation scores for MS data from 16 different alleles was compared to a random set of residues with the same 16 alleles.
(D) The fraction of native residues found for the list of mutations identified in five different cancer cell lines for strong (rank <0.5) and weak (0.5 % ≤ rank <2) binders. The mutated version of the residue is assumed to be presented if the mutation does not disrupt the binding motif.
See also Figure S1 and Table S1.
We evaluated several strategies for combining peptide affinities to approximate presentation of a specific residue on the cell surface using an existing dataset of peptides bound to MHC-I molecules encoded by 16 different HLA alleles in mono-allelic lymphoblastoid cell lines determined using mass spectrometry (MS) (Abelin et al., 2017), the most comprehensive database of cell surface presented peptides currently available. These strategies included assigning the best rank among peptides, the total number of peptides with rank <2, the total number peptides with rank <0.5, and the best rank weighted by predicted proteasomal cleavage (Figures S1B–S1K). We then compared the ability of these scores to discriminate these MS-derived residues from a size-matched set of randomly selected residues (STAR Methods). The best rank score (Figure 1B) provided the most reliable prediction that a particular residue position would be included in a sequence presented by the MHC-I the cell surface (Figure 1C); thus, this score was used for all subsequent analysis.
Finally, to test the best rank score’s ability to assess the presentation of cancer-related mutations, we scored the set expressed mutations in 5 cancer cell lines to predict which would be presented by an HLA-A*02:01-derived MHC-I (Tables S1A–S1E). Unless a mutation affects an anchor position, a peptide harboring a single amino acid change has a modest impact on peptide binding affinity and should be presented on the cell surface provided that the corresponding native sequence is presented (Tables S1F–S1J). Indeed, analyzing a database of native peptides found in complex with an HLA-A*02:01 MHC-I in these 5 cell lines, we found that across cell lines, 9.8% of mutations predicted to strongly bind and 4.0% of mutations predicted to bind an HLA-A*02:01 MHC-I at any strength were also supported by MS-derived peptides (Figure 1D). These experimental results validate the ability of a score derived from MHC-I binding affinities to identify mutations with a higher likelihood of generating neoantigens and support the application of this score to evaluate MHC-I genotype as a determinant of the antigenic potential of recurrent mutations in tumors.
Quantifying Individual Variation in Presentation of Recurrent Oncogenic Mutations
To determine whether individual variation in MHC-I genotypes results in patient-level differences in the presentation of mutations in a large human cancer cohort, we called HLA alleles for patients in the TCGA. We successfully assigned HLA-A, -B, and -C allele pairs to 9,176 of 9,839 cancer patients using three algorithms (Figure S2A) (Jia et al., 2013; Shukla et al., 2015; Szolek et al., 2014). Most alleles were called from the consensus of Optitype and Polysolver, allowing only 1 disagreement out of 6 alleles (Figure S2B), and a minority of patients without exome sequencing data were called based on genotype data using SNP2HLA (STAR Methods; Figure S2C). The remaining patients were successfully called by either Optitype or Polysolver (Figure S2D; Table S2). Only 245 of the known HLA alleles were observed in TCGA patients, and few alleles were present in more than 10% patients (Figures S2E–S2G). Allele frequencies were highly correlated with reported frequencies among healthy individuals of matched ancestry but weakly to allele frequencies of other populations (Figures S2H–S2J). We did not observe any unexpected bias in allele frequencies among cancer patients relative to matched healthy populations.
To represent a patient’s ability to present a particular mutation, we devised a score for aggregating the Best Rank scores across the patient’s six MHC-I alleles (Figure 2A). We selected the harmonic mean to combine the six best rank scores across the 6 alleles because it has the desirable property that it is dominated by the minimal value. Thus, the Patient Harmonic-mean Best Rank (PHBR) score is highly influenced by the best allele but also integrates information about presentation by the other alleles. To determine the performance of the PHBR score for predicting actual presentation, an independent MS data was used including 5 cell lines expressing 6 HLA alleles typed to the fourth digit (Bassani-Sternberg et al., 2015; Figure 2B). Receiver operating characteristic (ROC) curves were constructed from the PHBR scores for each cell line as well as the aggregated scores across the cell lines (Figure 2C) and demonstrated that the PHBR score was indeed predictive of peptide presentation in a multi-allelic setting.
Figure 2. Development of a Patient Specific Residue-Centric Score.
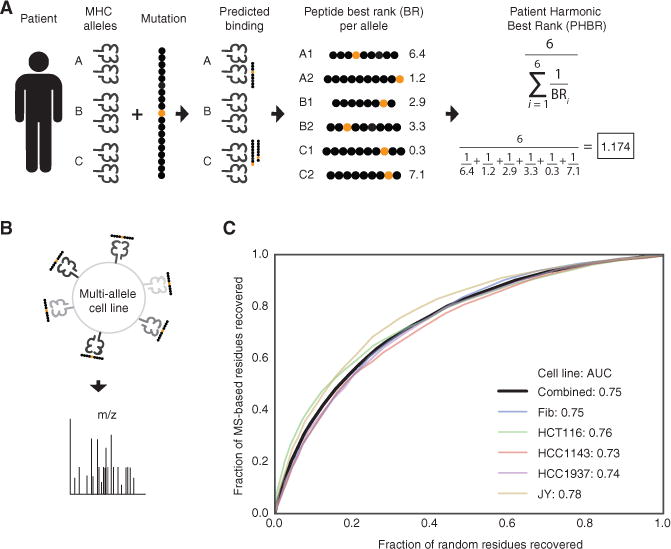
(A) A graphical representation of calculating the patient presentation score for a particular residue. Each patient has six MHC alleles. The Patient Harmonic-mean Best Rank (PHBR) presentation score is the harmonic mean of the best rank score of a residue across a patient’s six alleles.
(B) An experimental schematic of the MS data collection used in the score validation.
(C) A ROC curve showing the accuracy of the PHBR for classifying the extracellular presentation of a residue by a patient’s six MHC alleles for 5 different cell lines (colors) and for peptides from all cell lines combined (black). The aggregated PHBR presentation scores for 5 cell lines expressing 6 MHC alleles was compared to a random set of residues for the same MHC alleles.
See also Figure S2 and Table S2.
We identified a set of 1,018 likely driver mutations based on the criteria that these mutations occur in known oncogenes and tumor suppressors (Davoli et al., 2013) and are observed in at least 3 tumors in TCGA (STAR Methods; Tables S3A–S3E). We then constructed a matrix of PHBR scores for patients (Figure 3; rows) versus the 1,018 recurrent oncogenic mutations (Figure 3, columns). This matrix provides a high-level view of individual differences in presentation of functional mutations causally implicated in tumorigenesis.
Figure 3. Pan-cancer Overview of Patient-Mutation Presentation.
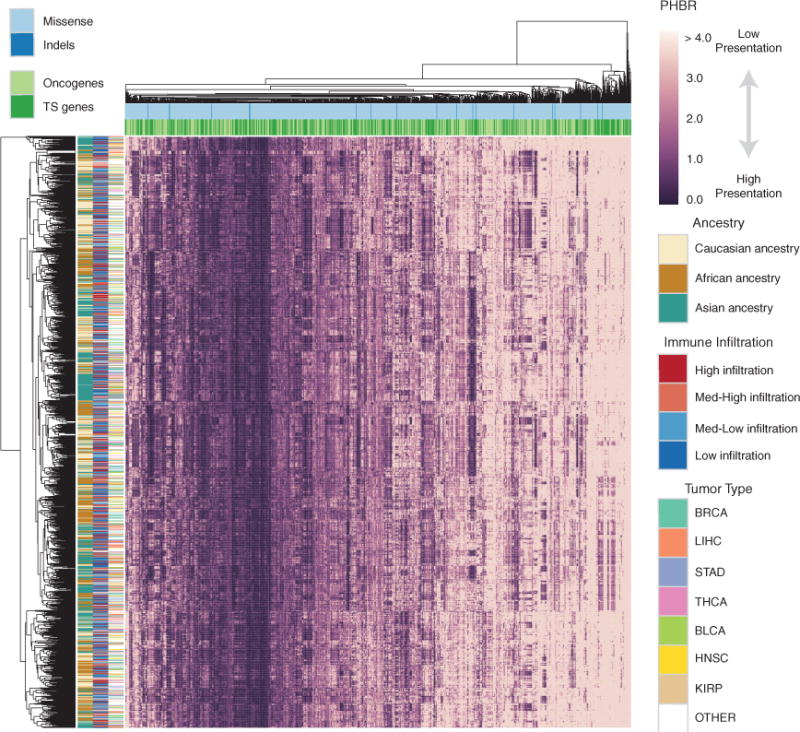
A clustered heatmap of 1,500 patients in TCGA with the 1,018 frequent cancer mutations. The patients are selected to achieve equivalent number of each ethnicity. The heatmap is colored by PHBR score. Column and row coloring highlight groupings of patients and mutations into different categories. See also Figure S3 and Table S3.
Inspection of the PHBR score matrix highlights that some recurrent oncogenic mutations are universally poorly presented by the MHC-I, while others appear to have a high likelihood of being presented in general (Tables S3F and S3G). Over 95 mutations were predicted to have PHBR scores <4 for all patients, but no mutations had PHBR scores <1 across the entire population (Figures S3A and S3B). There was no obvious clustering of mutations according to functional consequence (missense versus indel or loss of function versus gain of function; Figure 3; columns), although distinct amino acid substitutions affecting the same residue tended to be grouped. We also compared patients based on the fraction of the 1,018 recurrent oncogenic mutations that their MHC-I genotype could potentially present. Patients’ mutation coverage ranged from as high as >86% of mutations with PHBR <4 (>39% at PHBR <1) to <54% of mutations receiving a PHBR <4 (<18% at PHBR <1) (Figures S3C and S3D).
Patient MHC-I Genotypes Are Predictive of the Oncogenic Mutations that Emerge in Their Tumor
If MHC-I genotype restricts the oncogenic peptidome exposed to immune surveillance, exposed mutations should be less frequently observed than masked mutations in individual tumors (Figure 4A). As an initial approach, we mapped patient mutation status onto the PHBR score matrix (Figure 3) and divided PHBR scores into two groups: those that corresponded to observed mutations and those that corresponded to unobserved mutations. Comparing PHBR scores between these groups uncovered a bias for observed mutations to have higher PHBR scores (Figure 4B), with the largest differences apparent for PHBR scores <0.5 (Figure 4C). We took two approaches to quantifying the effect of MHC-I genotype on the probability of acquiring mutations, comparing the relationship between PHBR and mutation probability within patients (rows of Figure 3) and across patients (columns of Figure 3). As the logscale PHBR score was approximately linearly related to the logit probability of a mutation (Figures S4A and S4B), we modeled their relationship with an additive logistic regression model with non-linear effects to control for variation in mutation rates among mutations and patients.
Figure 4. PHBR Predictive Power for Mutation Probability.
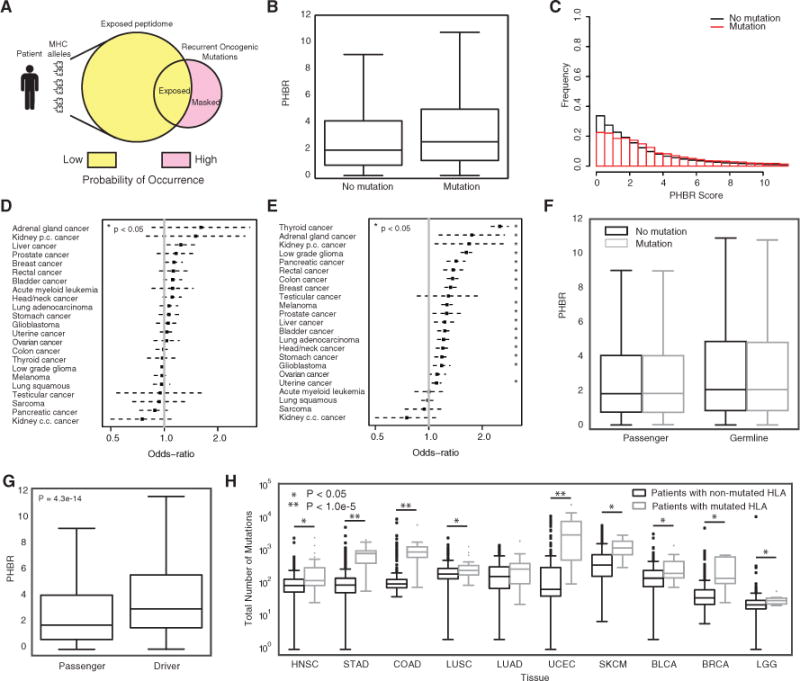
(A) A schematic showing the fundamental hypothesis by which an individual’s MHC allele-specific coverage of the oncogenic mutational space influences the probability of occurrence of oncogenic mutations.
(B) A boxplot denoting the difference in PHBR scores for the 1,018 oncogenic mutations and 9,176 patients split by mutation occurrence. Error bars denote the 1.5 IQR range.
(C) Histograms of PHBR scores associated with the presence or absence of mutations.
(D and E) The ORs (black boxes) and 95% CIs associated with a 1-unit increase in PHBR score for different cancer types using (D) the within-mutation model and (E) the within-patient model.
(F) Boxplots for the PHBR scores grouped according to presence or absence for passenger mutations and germline variants. Error bars denote the 1.5 IQR range.
(G) A boxplot denoting the difference in patient-specific presentation scores for acquired mutations when divided into driver mutations and passenger mutations. Error bars denote the 1.5 IQR range.
(H) Boxplots showing the total number of mutations acquired for patients who acquired a mutation in one of their HLA genes versus those that did not. Patients are divided by tumor type and only the tumor types with at least five HLA-mutated patients are shown. Error bars denote the 1.5 IQR range.
See also Figure S4, Table S5, and Table S6.
When we analyzed the relationship between log-PHBR and the logit mutation probability within patients, we found that the log-PHBR was positively associated with a significant increase in the odds of a patient acquiring a mutation, supporting that patients have a higher probability of acquiring mutations less effectively presented by their MHC-I (within-patient model; mutation frequency ≥5; odds ratio [OR] = 1.28; 95% confidence interval [CI] [1.25, 1.31]; p < 2e-16) (Table 1). For each unit increase in log-PHBR, the odds of a mutation increases by 28%. The influence of PHBR tended to be stronger for mutations that were observed more frequently, for example, for mutations observed at least 20 times each unit increase in log-PHBR resulted in an odds increase of 54.5% (Table S4). These results demonstrate that the PHBR score is predictive of which recurrent oncogenic mutations are likely to drive an individual’s tumor during the early stages of tumor development pan-cancer.
Table 1.
Quantitative Estimate of the Association between PHBR Score and Mutation Occurrence
| Within Residue
|
Within Patient
|
|||||
|---|---|---|---|---|---|---|
| OR | 95% CI | p Value | OR | 95% CI | p Value | |
| ≥5 mutations | 1.03 | 0.997,1.06 | 0.17 | 1.28 | 1.25, 1.31 | <2 × 10⁻¹⁶ |
|
| ||||||
| Passenger mutations | 1 | 0.97,1.03 | 0.95 | 1 | 0.96, 1.03 | 0.97 |
|
| ||||||
| Germline variants | 0.997 | 0.994,0.999 | 0.15 | 0.995 | 0.993, 0.996 | 5.8 × 10⁻¹⁰ |
ORs, 95% CIs, and p values are shown for within-mutation and within-patient models relating PHBR score to mutations observed ≥5 times across tumors. Models relating PHBR score to a set of 1,000 passenger mutations and 1,000 germline variants serve as controls. See also Table S4.
The second approach analyzes the relationship between the log-PHBR and logit mutation probability across patients with the same mutation. This formulation evaluates whether the log-PHBR of a mutation has predictive power to determine which patients are at higher risk when the probability of the mutation occurring among patients is already known. This analysis revealed that PHBR was not a significant predictor of which patients would obtain a specific mutation (within-mutation model; mutation frequency ≥5; OR = 1.03; 95% CI [0.99, 1.06]; p < 0.17). The negligible effect of log-PHBR in this setting suggests that its influence is generally already captured by the random effect that models variation in mutation frequency and that incorporates the PHBR influence demonstrated by the within patients analysis.
To determine whether PHBR score predictive power is distributed equally among different cancer types, we repeated the analysis within groups of at least 100 patients with a common tumor type (Figures 4D and 4E; all tumor types shown in Figures S4C and S4D). Once again, the within-mutation analysis mostly returned ORs with 95% CIs that included 1, indicating a lack of predictive power (Figure 4D, Table S5A). In clear contrast, the within-patient analysis returned multiple tumor types for which the OR was significantly greater than 1 (Figure 4E; Table S5B). While PHBR was predictive of mutation occurrence within-patient in more than 50% of the tumor types evaluated, there were clear differences in the magnitudes of the ORs, suggesting that PHBR could be more predictive in some tumor types than others. The strongest effects were observed in thyroid cancer (OR = 2.51; 95% CI [2.25, 2.8]), while no association was observed in acute myeloid leukemia, lung squamous cell carcinoma, sarcoma, or clear cell renal carcinoma. Notably, effect sizes were even larger when we considered only mutations observed >20 times across tumors (Figures S4E and S4F; Tables S5C and S5D). We observed that tumor types with fewer samples or harboring fewer recurrent mutations had larger 95% CIs, and tumors with larger ORs tended to have high-frequency mutations associated with them. For example, 58% of thyroid cancers had a BRAF V600E mutation and 70% of low-grade gliomas had an IDH1 R132H mutation (Tables S5E–BB). Interestingly, PHBR was associated with the probability of mutation in both low-grade glioma and glioblastoma, suggesting that immune surveillance during tumor development in the brain is not impeded by immune privilege.
Importantly, when we repeated our analysis with a subset of common germline variants in the same patients, we found no relationship between PHBR score and variant carrier status (Figure 4F; Table 1). We also controlled for other factors that could potentially confound our results, including different thresholds on mutation frequency, the specific method used to assign patient genotypes, and inclusion of HLA-C, which is typically expressed at much lower levels that HLA-A and HLA-B (Zemmour and Parham, 1992). The association between PHBR score and mutation status was robust to all of these factors (Table S4). Finally, we compared the results obtained by the PHBR score to a simpler Patient Best Rank (PBR) score that assigns the minimum rank across all 6 HLA alleles. Interestingly, although the PBR performed identically on the multi-allelic cell line-based MS benchmark (Figure S4G), when we analyzed the relationship of PBR and mutation probability, we found that PBR had less predictive power than the PHBR (Table S6). These results indicate that, while the highest-affinity peptide may be more likely to be detected on the cell surface, presentation by multiple MHC-I alleles appears to have a positive impact on the likelihood of T cell activation and therefore on whether a tumor will acquire a particular recurrent mutation.
MHC-I-based restriction of oncogenic mutations is likely to be active predominantly during the early stages of tumorigenesis when tumors have not yet evolved widespread immunosuppressive strategies. This suggests a model whereby mutation-related phenotypes could differ according to the effectiveness of immune surveillance throughout tumorigenesis. According to this model, mutations should accumulate more quickly when tumor cell populations are expanding rapidly in under conditions of tumor driven immune suppression, and the majority of these mutations should be passenger mutations that provide no fitness advantage to tumor cells. Indeed, consistent with this concept and previous reports, passenger mutations tended to have much lower PHBR scores than driver mutations (Figure 4G), and PHBR scores were not predictive of passenger-like mutations observed in cancer patients (Table 1) indicating that presentation of passenger mutations does not subject them to selective pressure. We also noted that patients with HLA mutations had significantly higher numbers of mutations (p < 0.05) for 9 out of 10 tumor types that include more than 5 HLA-mutated patients (Figure 4H). Shukla et al. previously demonstrated that the majority of somatic HLA mutations in TCGA impair MHC-I peptide binding, suggesting that the positive correlation between HLA mutation status and mutation burden is unlikely to be explained by elevated mutation rates (Shukla et al., 2015). This evidence further supports the concept that, upon immune evasion, MHC-I-based immune surveillance weakens or is eliminated altogether, paving the way for increased mutation rates and emergence of antigenic mutations.
Our results support MHC-I as the gatekeeper of early immunoediting and MHC-I genotype-specific binding affinity as a determinant of the oncogenic mutations that are subject to immune surveillance by T cells. Most importantly, these results imply that MHC-I genotype provides predictive information about the oncogenic mutations that are likely to occur should a tumor arise in a particular person.
MHC-I Presentation Influences Oncogenic Mutational Frequencies in Human Cancer
We next re-examined the TCGA population as a whole to evaluate the consequences of MHC-I genotype-based restriction for the frequencies of somatic mutations among tumors. There was a significant correlation between population ability to present a mutation and that mutation’s frequency among tumors (Spearman rho = 0.61, p = 1.6 × 10⁻⁶) (Figure 5). This correlation was robust when the analysis was restricted to HLA-A and -B alleles (Spearman rho = 0.52, p = 8.2 × 10⁻⁵) (Figure S5A) and when accounting for tumor type (Spearman rho = 0.49, p = 6.9 × 10⁻⁴) (Figure S5B). The relationship between mutation frequency and patient MHC-I binding affinity suggests that the frequency of an oncogenic mutation among tumors is not determined by the magnitude of the fitness advantage provided by the mutation alone. Mutation frequency also depends on the visibility of that mutation to the immune system across patients. Thus, patient-level MHC-I genotype-based restriction of the landscape of oncogenic mutations contributes to shaping the mutation frequencies observable in cancer populations.
Figure 5. Population Median Presentation of Recurrent Oncogenic Mutations Determines Their Frequency among Tumors.
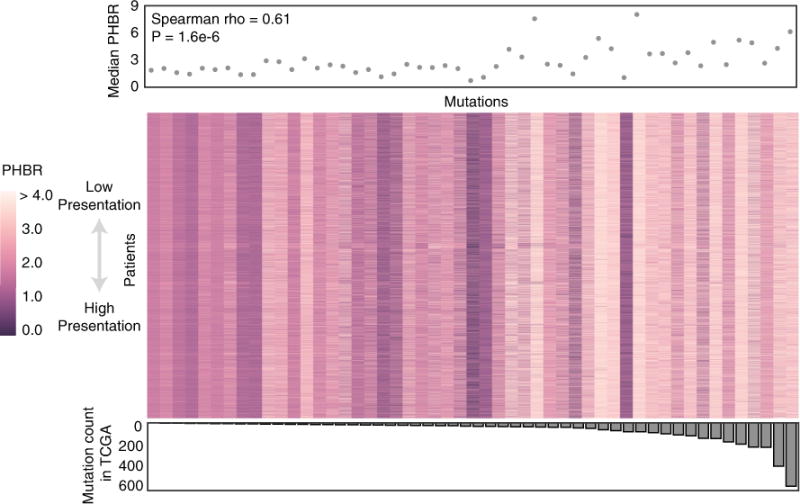
Heatmap showing PHBR presentation scores for all 9,176 patients of the 1,018 recurrent cancer mutations (observed in at least three patients) grouped by their mutation count in TCGA and displayed as a median. The median PHBR score across the population for each mutation group is plotted above the heatmap. The number of times the mutation group is observed in TCGA is plotted below the heatmap. The correlation between the mutation count in TCGA and the median PHBR score is calculated with a Spearman test. See also Figure S5.
The general low presentation of highly recurrent oncogenic mutations across cancer patients led us to question whether poor presentation of such mutations was a general feature of human MHC-I. In order to gain a complete perspective, we compared MHC-I-based presentation of recurrent oncogenic mutations to other classes of variation that would not be expected to show evidence of purifying selection by MHC-I-based immune surveillance, including 3,000 random mutations, 1,000 common polymorphisms, and 1,000 viral and 1,000 bacterial residues (Table S7A; STAR Methods). In total, we calculated presentation scores for 1,000 recurrent cancer missense mutations and 6,000 variant sequences against 2,915 MHC-I alleles in immune epitope database (IEDB) (Figures S6A and S6B). Comparing overall best rank score distributions, we observed a bias toward higher presentation scores (worse presentation) among highly recurrent mutations (≥10) affecting oncogenes but not tumor suppressors relative to the other classes of variation (Figure 6A). However, a significantly smaller fraction of mutations in both oncogenes and tumor suppressors were presented at both best rank <2 and rank <0.5 binding thresholds (Figure 6B). In contrast, viral and bacterial residues generally had smaller presentation scores and higher binding fractions than common germline polymorphisms and random mutations, consistent with the MHC evolving to present foreign sequences more effectively than endogenous sequences. We determined that the difference in presentation between highly recurrent oncogenic and random mutations could not have resulted from a biased sample of random mutations (p = 0.008; 1,000 sub-sampled random mutation sets) (Figure S6C).
Figure 6. Recurrent Oncogenic Mutations Are Universally Poorly Presented by the Human MHC-I.
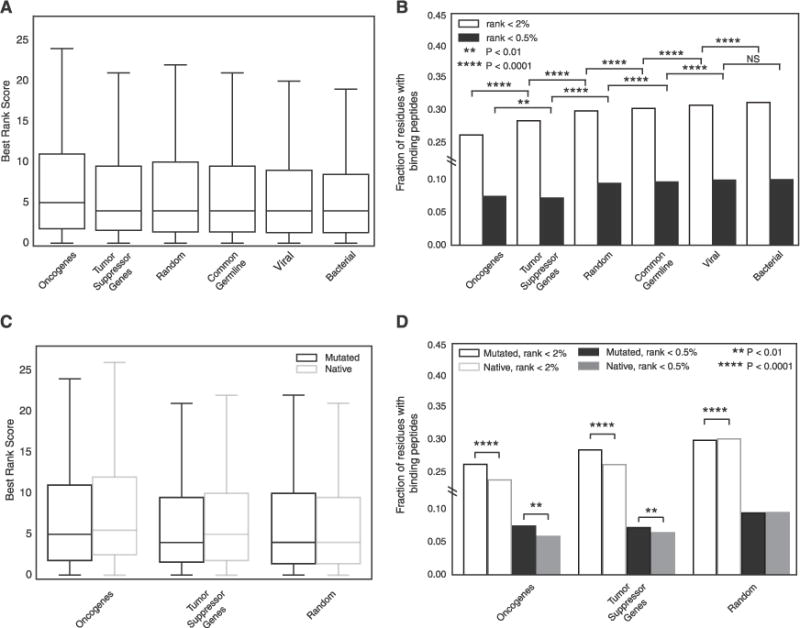
(A) Boxplots denoting the distribution of residue presentation scores for 6 different classes of residue including 2,915 MHC-I alleles. Error bars denote the 1.5 IQR range.
(B) The fraction of residue presentation scores in (A) that fall below the 0.5 threshold of strong binding and the 2 threshold of binding.
(C) Boxplots denoting the distribution of residue presentation scores for mutated residues in oncogenes, tumor suppressor genes, and random genes as compared to the native versions of the same residues with 2,915 MHC-I alleles. Outliers are excluded for visualization purposes. Error bars denote the 1.5 IQR range.
(D) The fraction of residue presentation scores in (C) that fall below the 0.5 threshold of strong affinity and the 2 threshold of any affinity. See also Figure S6.
We next evaluated other factors that might result in a biased profile of MHC binding for recurrent oncogenic mutations. Possible sources of bias include residue location inside versus outside of functional protein domains, higher expression of HLA-A and HLA-B than HLA-C, differences in MHC-I affinity for different peptide lengths, inclusion of lower-frequency recurrent mutations and population-specific allele frequencies (González-Galarza et al., 2015). Even when controlling for each of these factors, oncogenic mutations still showed a significant bias for poorer presentation and lower fractions being presented (Figures S6D–S6I) with one exception. When lower frequency recurrent mutations (≥3) were included, we observed that only oncogenes but not tumor suppressor mutations were significantly different from random mutations.
Finally, we sought to determine whether lower predicted presentation of cancer mutations resulted from impaired MHC-I binding affinity due to the amino acid change. We first compared the presentation scores of the random set of mutations to the scores received by the corresponding native (wild-type) sequences and found that native residues tended to be slightly better presented than mutated residues (Figures 6C and 6D). Next, we determined the presentation scores for the native residues corresponding to the subset of 144 highly recurrent oncogenic mutations (observed ≥10 times; STAR Methods). The presentation scores for the native residues corresponding to oncogenic mutations, like the oncogenic mutations themselves, were significantly poorer than those of the set of randomly generated mutations (Mann-Whitney U test, p < 2e-16). Surprisingly, MHC-I-based presentation of the native residues in cancer genes was even poorer than presentation of the mutated residues (Mann-Whitney U test, p < 2e-16 for both oncogenes and tumor suppressor genes) (Figures 6C and 6D). This trend remained significant when analysis was restricted to HLA-A and HLA-B, extended to all recurrent oncogenic mutations, and specifically applied to 9-mer (Figures S6J–S6L). Thus, we conclude that recurrent oncogenic mutations are biased toward residues residing in peptides that are particularly poorly presented by the majority of human MHC-I alleles.
DISCUSSION
Here, we demonstrate that a person’s MHC-I genotype constitutes a barrier that partially constrains the possible oncogenic mutations that a developing tumor can sample on its way to becoming clinically detectable disease. Using in silico approaches, we systematically assigned MHC-I allele combinations to cancer patients and determined their presentable oncogenic sub-peptidome, converting peptide affinities into personalized mutation-centric presentation scores. These scores were positively associated with the incidence of recurrent cancer mutations, demonstrating their potential to provide predictive information about individual susceptibility to develop tumors harboring particular oncogenic mutations. Used in combination with other known risk factors, this information could enable improved identification of individuals at risk for developing certain types of cancer, potentially enabling MHC-I genotype-guided screening.
Analysis of thousands of TCGA patient genomes and approximately one billion MHC-I binding predictions uncovered a strong link between the MHC-I genotype-derived PHBR score and the probability of acquiring specific mutations by a particular patient, with an estimated 54.5% increase in odds of acquiring specific mutations (>20 observations in TCGA) for every unit increase of log-PHBR. We observed reduced effect sizes at lower mutation frequency thresholds, possibly due to the inclusion of more mutations that are not early events in cancer and thus not subject to immune surveillance-based elimination. When restricting analysis to higher-frequency mutations, fewer mutations were available to fit the model resulting in reduced statistical power. When analyzed by cancer type, we found even stronger associations, with some tumor types approaching a nearly 250% increase in odds of mutation for each unit increase of log-PHBR.
Across the entire cohort of cancer patients, the frequency of oncogenic mutations was correlated with the median PHBR score, suggesting that the individual MHC-I sub-peptidome coverage aggregates to produce population-scale effects. Interestingly, when considering all possible HLA alleles, we observed that oncogenic mutant peptides have poor binding affinity for the human MHC-I in general but an above-average binding affinity for pathogen-derived peptides. This effect is driven by the native underlying sequence, which has even worse binding affinity for MHC-I than the corresponding oncogenic mutant peptide. These observations imply that in order to become highly recurrent, oncogenic mutations not only need to provide a fitness advantage to tumor cells, but also need to occur within a peptide sequence that is universally poorly presented across the human population. Mutations that provide a fitness advantage but are antigenic would either occur post immune evasion, or early in select individuals with MHC-I genotypes incapable of presenting them, and thus never reach high frequency among tumors.
We note that the ROC curve for our PHBR score formulation suggests the inclusion of false positives (Figure 2C), potentially resulting from the assumption that all 38 possible peptides overlapping a mutation have equal opportunity to bind the MHC-I. This assumption could overestimate the presentation of residues and explain in part why we observed a small subset of recurrent oncogenic mutations with very low PHBRs (i.e., well presented) across cancer patients (Figure 3). In general, recurrent mutations that can be presented across many patients (Figure 5; Tables S3F and S3G) could provide an attractive target for design of immunotherapies, although presentation alone is not sufficient to induce T cell activation. The existence of recurrent oncogenic mutations that are easily visible to the immune system could indicate failure of other determinants of immunogenicity required to render these mutations antigenic. Further investigation may reveal whether well-presented oncogenic mutations evade immune detection through alternative biological mechanisms. We also observed some recurrent mutations with very high PHBR scores (i.e., poorly presented) indicating the existence of mutations that are unlikely to ever be detected via MHC-I-based antigen presentation.
In conclusion, this is the first study to provide compelling evidence that common oncogenes and tumor suppressors across human cancers are subject to immunoediting. The observed mutational driver landscape in established tumors thus reflects constraints imposed by individual variation at the HLA locus. The perspective gained from our analysis is based on a score that predicts presentation, but not antigenicity and depends on the existing state of the art for predicting peptide binding affinity. Thus, as computational algorithms continue to improve, we will be able to more accurately estimate the impact of the immune system on the emergence of mutations in tumors. We anticipate that this study will catalyze future efforts to understand the links between HLA genotype and cancer susceptibility.
STAR★METHODS
KEY RESOURCES TABLE
| REAGENT or RESOURCE | SOURCE | IDENTIFIER |
|---|---|---|
| Antibodies | ||
| anti-VLDLr mAb | ATCC | ATCC CRL-2197 |
| Polyclonal Rabbit Anti-Human Beta-2-Microglobulin | Dako | A0072 |
| Experimental Models: Cell Lines | ||
| HeLa | ATCC | ATCC CCL-2 |
| A375 | ATCC | ATCC CRL1619 |
| SKOV3 | ATCC | ATCC HTB-77 |
| A2780 | Sigma-Aldrich | 93112519 Sigma |
| OV90 | ATCC | ATCC CRL11732 |
| Software and Algorithms | ||
| PEAKS Studio | Zhang et al., 2012 | http://www.bioinfor.com/peaks-studio/ |
| PolySolver | Shukla et al., 2015 | http://archive.broadinstitute.org/cancer/cga/polysolver |
| Optitype | Szolek et al., 2014 | https://github.com/FRED-2/OptiType |
| Snp2HLA | Jia et al., 2013 | http://software.broadinstitute.org/mpg/snp2hla/ |
| NetMHCPan-3.0 | Nielsen and Andreatta, 2016 | http://www.cbs.dtu.dk/services/NetMHCpan/ |
| Data analysis was done using Python 2.7 | Python | |
| Seaborn | Python library | https://seaborn.pydata.org/ |
| Pandas | Python library | http://pandas.pydata.org/ |
| Biopython | Python library | http://biopython.org/wiki/Seq |
| Other | ||
| Multi-allelic MS data | Bassani-Sternberg et al., 2015 | |
| MS MHC-I data | Abelin et al., 2017 | |
| MS MHC-I data (HLA alleles: HLA-A*01:01, HLA-A*02:01, HLA-A*24:02, HLA-B*07:02, and HLAB*51:01, eluted from HeLa cell line) | Trolle et al., 2016 | http://www.iedb.org/subID/1000685 accession # 1000685. |
| Ensembl data | Yates et al., 2016 | http://www.ensembl.org/index.html |
| GDC TCGA data | N/A | https://portal.gdc.cancer.gov/ |
| Exome Variant Server | N/A | http://evs.gs.washington.edu/EVS/ |
| UniProt | N/A | http://www.uniprot.org/ |
| HLA frequency net | N/A | http://www.allelefrequencies.net/ |
| National Center for Biotechnology Information (NCBI) Homo sapiens taxonomy | https://www.ncbi.nlm.nih.gov/ | Taxonomy ID: 9606 |
CONTACT FOR REAGENT AND RESOURCE SHARING
Further information and requests for resources and reagents should be directed to and will be fulfilled by the Lead Contact, Joan Font-Burgada (joan.font-burgada@fccc.edu).
EXPERIMENTAL MODEL AND SUBJECT DETAILS
Cell lines
SKOV3 and HeLa cells were purchased from the ATCC and grown in DMEM/F12K medium with 10% FBS. A2780 cells were purchased from Sigma and grown in RPMI with 10% FBS. OV90 cells (ATCC) were received as kind gifts from Dr. Patricia Kruk, University of South Florida (Tampa, FL), and were grown in 1:1 Medium 199/MCDB 105 with 15% FBS(Patterson et al., 2016). A375 cell line (ATCC) was a kind gift from Dr. Beatriz Carreno, Washington University (St. Louis, MO) and was grown in DMEM/F12K medium with 10% FBS (Carreno et al., 2015). All cells were maintained in a humidified CO2 incubator (5% CO2, 37 °C). All cell lines were subjected to high-resolution sequence-based HLA typing (HLA-A, -B, -C, and -DRB1) immediately upon receipt and growth in our laboratory, and then again after stable transfection to ensure authentication prior to use in data collection.
METHOD DETAILS
Production and Isolation of soluble HLA/Peptide Complexes
The soluble HLA-A*02:01 was transfected into different cell lines (HeLa, A375, SKOV3, A2780 and OV90). Transfected cells were single cell sorted (subcloned) to identify a high expressing clone. Soluble HLA constructs are truncated at the 3′end of exon 4, deleting the transmembrane and cytoplasmic domains, and include a C-terminal VLDLr epitope purification tag (SVVSTDDDLA) that is recognized by the anti-VLDLr mAb (ATCC CRL-2197). This antibody was used both for purification of soluble HLA from cells supernatant and for quantification of sHLA production as the capture antibody in a sandwich ELISA, with an antibody directed against β2-microglobulin (Dako A0072) as the detector antibody. After transfection, cells were grown at high density in hollow-fiber bioreactors (AcuSyst-Maximizer, C3 Cell Culture Company) and sHLA/peptide complexes were purified from supernatants by affinity chromatography with the anti-VLDLr antibody. Eluate fractions containing sHLA/peptide complexes were pooled, brought to a final acetic acid concentration of 10%, and heated to 78°C in a water bath to denature HLA. Peptides were purified and isolated from alpha chain and B2m using an Ultracel 3 kDa cutoff cellulose membrane (EMD Millipore, PLBC06210) and lyophilized (Carreno et al., 2015; Patterson et al., 2016).
LC/MS Analysis
Separation and sequencing of peptides purified from each cell line were carried out by two-dimensional liquid chromatography, followed by information dependent acquisition (IDA) generated tandem MS (MS/MS). For the first dimension, the peptide sample was loaded on a reverse-phase C18 column (110 Å pore size; 5 μm particle size, 2 mm [i.d.] × 150 mm long Gemini column; Phenomenex) with a Michrom BioResources Paradigm MG4 HPLC and UV detection at 215 nm wavelength. Elution was at pH 10 using solvent A (10 mM ammonium formate, 2% acetonitrile, 98% water) and solvent B (10 mM ammonium formate, 95% acetonitrile, 5% water). The peptide sample was loaded at a flow rate of ~120 μl/min over an 18 min period. Then a two segment gradient was performed at 160 μl/min; the 1st segment was a 40 min linear gradient (4 – 40% B), followed by an 8 min linear gradient (40 – 80% B). Forty peptide-rich fractions were collected and dried by vacuum centrifugation.
For the second dimension chromatography, each fraction was resuspended in 10% acetic acid and subjected to nano-scale RP-HPLC (Eksigent ekspert nanoLC 415 system, AB Sciex). The second dimension nano-HPLC setup included a C18 trap column (350 μm [i.d.] × 0.5 mm long; ChromXP) with 3 μm particles and 120Å pores and a ChromXP, C18 separation column (75 μm [i.d.] × 150 mm long) packed with the same medium. A two-solvent system was utilized, where solvent A is 0.1% formic acid in water and solvent B contains 0.1% formic acid in 95% acetonitrile/5% water. Samples were loaded at 5 μL/min flow rate on the trap column and at 300 nL/min flow rate on the separation column. The separation was performed by a two linear gradients program: 10 – 40% solvent B for 70 min and then 40 – 80% solvent B for 7 min. The column effluent was ionized using a NanoSpray III ion source (AB Sciex), and MS and MS/MS fragments spectra were obtained in IDA mode using an AB Sciex TripleTOF 5600 System, as described previously (Carreno et al., 2015).
Peptide Identification and Source Protein Information
Peptide sequences were assigned to resulting fragment spectra using PEAKS Studio, Premium License, v.7.0 (Bioinformatics Solutions, Ontario, Canada). UniProt and NCBI non redundant database with Homo sapiens taxonomy were used for database search by PEAKS.
The parameters used for database search were the following: 50 ppm precursor mass error tolerance and a product ion tolerance of 0.05 Da. Post-translational modifications (PTM) consisting of N-terminal acetylation, deamidation of Asn and Gln, oxidation of Met, His, Trp, sodium adducts of Asp, Glu, C terminus, and the pyroglutamate derivative of glutamic acid were set as variable modifications. All peptides identified at 1% False Discovery Rate (FDR) were exported from PEAKS along with their protein identifications. Gene symbols for source proteins were extracted from the online UniProt Knowledgebase (UniProt Consortium, 2015) using the UniProt protein accession numbers provided by PEAKS upon peptide identification. Peptides were additionally screened for their predicted binding to the HLA-A*02:01 allele.
QUANTIFICATION AND STATISTICAL ANALYSIS
Peptide Binding Affinity
Peptide binding affinity predictions for peptides of length 8-11 were obtained for various HLA alleles using the NetMHCPan-3.0 tool, downloaded from the Center for Biological Sequence Analysis on March 21, 2016. (Nielsen and Andreatta, 2016). NetMHCPan-3.0 returns IC50 scores and corresponding allele-based ranks, and peptides with rank < 2 and < 0.5 are considered to be weak and strong binders respectively (Nielsen and Andreatta, 2016). Allele-based ranks were used to represent peptide binding affinity.
Residue Presentation Scoring Schemes
To create a residue-centric presentation score, we evaluated allele-based ranks for the set of kmers of length 8–11 incorporating the residue of interest, resulting in 38 peptides for single amino acid positions (Figure 1A). Insertion and deletion mutations were modeled by the total number of 8–11-mer peptides differing from the native sequence (Figure S1J). We evaluated several approaches to combine the HLA allele-specific ranks for residue/mutation-derived peptides into a single score representing the likelihood of being presented by MHC-I:
Summation (rank < 2): The summation score is the total number out of 38 possible peptides that had rank < 2. This scoring system results in an integer value from 0 to 38, with residues of 0 being very unlikely to be presented and higher numbers being more likely to be presented.
Summation (rank < 0.5): The summation score is the total number out of 38 possible peptides that had rank < 0.5. This scoring system results in an integer value from 0 to 38, with residues of 0 being very unlikely to be presented and higher numbers being more likely to be presented.
Best Rank: The best rank score is the lowest rank of all of the 38 peptides.
Best Rank with cleavage: We modified the best rank score by first filtering the 38 possible peptides to remove those unlikely to be generated by proteasomal cleavage as predicted by the NetChop tool (Keşxmir et al., 2002). Netchop relies on a neural network trained on observed MHC-I ligands cleaved by the human proteasome and returns a cleavage score ranging between 0 and 1 for the C terminus of each amino acid. A threshold of 0.5 is recommended by the NetChop software manual to designate peptides as likely to be generated by proteasomal cleavage. Thus we retained only the peptides receiving a cleavage score greater than 0.5 just prior to the first residue and just after the last residue. The best rank with cleavage score is the lowest rank of the remaining peptides.
MS-based Presentation Score Validation
We acquired MS data from Abelin et al. (Abelin et al., 2017)that catalogs peptides observed in complex with MHC-I on the cell surface across 16 HLA alleles, with between 923 and 3609 peptides observed bound to each. These data were combined with a set of random peptides to construct a benchmark for evaluating the performance of scoring schemes for identifying residues presented on the cell surface as follows:
Converting MS peptide data to residues: The Abelin et al. MS data provides peptide observed in complex with the MHC-I, whereas our presentation score is residue-centric. For each peptide in the MS data, we selected the residue at the center (or one residue before the center in the case of peptides of even length) as the residue for calculating the residue-centric presentation score.
Selection of background peptides: We selected 3000 residues at random from the Ensembl human protein database (Release 89) (Aken et al., 2017) to ensure balanced representation of MS-bound and random residues. Since the majority of residues are expected not be be presented by the MHC (Nielsen and Andreatta, 2016), we expect that the randomly selected residues represent a reasonable approximation of a true negative set of residues that would not be presented on the cell surface.
Scoring benchmark set residues: We calculated presentation scores with each scoring scheme for all of the selected residues from the Abelin et al. data and the 3000 random residues against each of the 16 HLA alleles.
Evaluating scoring scheme performance using the benchmark: For each scoring scheme, scores were pooled across the 16 alleles. The distribution of scores for the MS-observed residues was compared to the distribution of scores for the random residues for each score formulation (Figure S1). For the best rank, residues were grouped at score intervals of 0.25 and for the summation, residues were grouped at integer values between 0 and 38. At each scoring interval, we divided the fraction of MS-observed residues falling into the interval by the fraction of random residues falling into that interval.
Visualizing score performance with Receiver Operating Characteristic (ROC) Curves: We plotted and compared ROC curves (Figures S1J and S1K) for each score formulation by calculating the True Positive Rate (% of observed MS residues predicted to bind at a given threshold) and the False Positive Rate (% of random residues predicted to bind at a given threshold) across a range of thresholds as follows:
Summation (rank < 2): 0 through 38 by increments of 1
Summation (rank < 0.5): 0 through 38 by increments of 1
Best Rank: 0 through 100 by increments of 0.1
Best Rank with Cleavage: 0 through 100 by increments of 0.1
We assessed overall score performance using the area under the curve (AUC) statistic. The best rank presentation score was selected for all subsequent analyses.
MS-based Evaluation of the Presentation of Mutated Residues Present in Cancer Cell Lines
We acquired the list of somatic mutations present in the genomes of five cancer cell lines (SKOV3, A2780, OV90, HeLa and A375) from the Cosmic Cell Lines Project (Forbes et al., 2015). We restricted the mutations to the missense mutations observed in genes present in the Ensembl protein database and removed all known common germline variants reported by the Exome Variant Server. Furthermore, we used the cell line expression data from the Genomics of Drug Sensitivity Center to exclude mutations observed in genes that are expressed in the lowest quantile of the specific cell line. For each of these mutated residues, we calculated the presentation score for HLA-A*02:01, an allele which had previously been studied in these cell lines (Method Details). We then searched the database of MS-derived peptides from each cell line to determine whether the mutation was observed in complex with the MHC-I on the cell surface. Since the database only contains peptides mapping to the consensus human proteome reference, we searched for the native versions of the peptides (Tables S1A–S1E). As long as the mutation does not disrupt the peptide binding motif, the mutated version should still be presented by the MHC allele which can be determined using MHC binding predictions in IEDB (Tables S1F–S1J) (Marsh et al., 1999). For each cell line, we evaluated the fraction of mutations predicted to be strong and weak binders that should be presented based on the corresponding native sequences observed in the MS data (Figure 1D; Tables S1F–S1J).
HLA Typing
HLA genotyping was performed for genes HLA-A, HLA-B and HLA-C, which encode the protein determinants of MHC-I peptide binding specificity. All TCGA samples available as of Dec 6, 2016 were typed with PolySolver, Optitype and snp2HLA (Jia et al., 2013; Shukla et al., 2015; Szolek et al., 2014), using default parameters for all tools (Figure S2A). PolySolver and Optitype require germline (whole blood or tissue matched) whole exome sequenced samples. Snp2HLA requires germline genotype data (SNP-6.0 Affymetrix) and can only accurately predict caucasian patients, thus we performed a PCA on the genotype data to identify the patients that could be evaluated with this tool (Figure S2C). If Optitype and PolySolver disagreed on more than one of the six HLA alleles the sample was excluded from further analyses (Figure S2B). If either Optitype or PolySolver failed to type a particular patient, the typing by the other tool was used. For a minority of samples that could not be typed by Optitype or PolySolver, snp2HLA was used (Figure S2D; Table S2). HLA-A, -B and -C types were predicted for a total of 9176 samples and allele frequencies (Figures S2F and S2H) were compared to representative populations in the HLA Frequency Net Database: USA NMDP African, USA NMDP European Caucasian, and USA NMDP Japanese (Figures S2I–S2K; Tables S7B, S7D, and S7F).
Patient Presentation Scores
We define two patient presentation scores to represent a particular patient’s ability to present a residue given their distinct set of 6 HLA alleles (2 each of HLA-A, HLA-B and HLA-C). First, the Patient Best Rank (PBR) score was assigned as the best residue presentation score (corresponding to the lowest rank) across all 6 HLA alleles. Second, the Patient Harmonic-mean Best Rank (PHBR) score was assigned as the harmonic mean of the best residue presentation scores for each of the 6 HLA alleles. For both scores, a lower patient presentation score indicates that the patient’s HLA-alleles are more likely to present a residue on the cell surface. In order to test the performance of the two scores in predicting actual presentation, we used published MS data for 5 cell lines expressing 6 HLA alleles typed to the fourth digit (Bassani-Sternberg et al., 2015).
Selection of Recurrent Oncogenic Mutations and Passenger-like Mutations
Somatic mutations were considered to be recurrent and oncogenic if they occurred in one of the 100 most highly ranked oncogenes or tumor suppressors described by Davoli et al. (Davoli et al., 2013) and were observed in at least 3 TCGA samples. Among these, we retained only mutations that would result in predictable protein sequence changes that could generate neoantigens, including missense mutations and inframe indels. A total 1018 mutations (512 missense mutations from oncogenes, 488 missense mutations from tumor suppressors, 11 indels from oncogenes and 7 indels from tumor suppressors) were obtained (Tables S3A and S3B). All mutations observed in TCGA patients that did not fall into the 200 highly ranked cancer genes were designated passenger-like mutations.
Selection of Other Classes of Residues
Peptides from pathogens, common germline human variants and randomly mutated human peptides were assembled for comparison with recurrent oncogenic mutations (Tables S3C and S3D). The proteomes of 10 virus species and 10 bacterial species (Table S7A) were downloaded from UniProt. One thousand residues were selected at random from both the viral and the bacterial set. A random set of mutations was generated by sampling 3,000 possible amino acid substitutions across human proteins from Ensembl (release 89; GRCh37) (Aken et al., 2017). A set of 1,000 common germline variants was sampled from the Exome Variant Server.
Generating Mutant Peptide Sequences
To allow determination of peptide sequences incorporating missense mutations, protein sequences were obtained from Ensembl (release 89; GRCh37) (Aken et al., 2017) and updated with the new amino acid. For indels, we modified the corresponding mature messenger RNA transcript sequences (CDS) by inserting or deleting nucleotides then translated the modified mRNA to protein sequence.
Patient Presentation Score-based Clustering
A matrix of PBR scores was constructed with 9176 TCGA samples as rows, 1018 recurrent oncogenic mutations as columns, and PBR in each cell. The matrix was clustered using hierarchical agglomerative clustering on rows and columns. For convenience of visualization, a partial matrix is displayed in Figure 2. In order to use the dynamic range in heatmap color to display variation in patient presentation scores relevant to MHC-I based presentation, PBR > 2 (non-binding) were set to 2. Colorbars provide additional information about patients and mutations, including ancestry, tumor type and T cell infiltration levels (patients) and mutation type and gene category (mutations). T cell infiltration was determined using EPIC (Racle et al., 2017)), an mRNA-based immune infiltration prediction algorithm. Patients were mapped to high, medium-high, medium-low and low T cell infiltration categories if their EPC scores fell into upper to lower quartiles respectively. Furthermore, we plotted histograms of the fraction of mutations each patient could present at baseline (PBR < 2) and strong (PBR < 0.5) thresholds (Figures S3A and S3B) and the fraction of the patients that could present each mutation (Figures S3C and S3D).
HLA-mutated Patient Analysis
We labeled patients according to HLA mutation status based on whether they were reported to harbor a somatic mutation in HLA-A, HLA-B or HLA-C by Shukla et al. Patients were excluded from this analysis if an HLA mutation was reported in the TCGA MAF file, but not in Shukla et al. The remaining patients were then grouped according to HLA mutation status. Within each tumor type, the number of total observed mutations was compared between patients with and without HLA mutations using a Mann Whitney U test (Figure 4H).
Predictive power of PBR/PHBR score for mutation probability
We built a 9176 × 1018 binary mutation matrix yij ∈ {0; 1} indicating whether patient i has a specific mutation j. We evaluated the relationship between this binary matrix and our matched 9176 × 1018 matrix with PBR/PHBR scores xij of patient i and for mutation j. To determine the functional form of the relationship between xij and yij, (e.g., linear, log or stepwise), we fitted an additive logistic regression model with non-linear effects for the PBR/PHBR using the GAM function in the mgcv R package (Wood, 2010). This revealed a linear association between log-PBR and the logit mutation probabilities (Figure S4A). Finally, to estimate the effect of xij on yij we considered the following random effects models:
- A within-mutation model relating xij to yij for a given mutation
where β ~ N(0; θβ) are random effects capturing mutation specific effects (e.g., different occurrence frequencies among mutations).(1) - A within-patient model relating xij to yij for a given patient
where ηi ~ N(0; θη) are random effects capturing different mutation propensities among patients.(2)
In these models, γ measures the effect of the log-PBR/PHBR on the probability of a mutation being observed. We fitted these model using the glmer function from the lme4 R package (Bates et al., 2015) and tested the null hypothesis that γ = 0.
We repeated the within-mutation analysis (1) with oncogenic mutations present at different frequency thresholds and evaluated similar models for a set of common 1000 germline variants (limited to 3,657 patients with germline variant calls) and for 1000 passenger mutations. We also repeated the within-patient analysis (2) with oncogenic mutations present at different frequency thresholds and for high-confidence HLA-typed patients (> = 5 allele agreement among Polysolver and Optitype)). To analyze the PHBR-mutation relationship in different tumor types, we fit separate models for each tumor type that had at least 100 patients.
PHBR score visualization
To visualize differences in PHBR score distributions for mutations observed versus absent from tumors, PHBR scores in the 1,018 mutation × 9,176 patient matrix were grouped according to mutation status and plotted in side-by-side boxplots (Figure 4B). We repeated this for using germline variants and passenger mutations across the 9,176 patients (Figure 4F).
Comparing Presentation Scores for Driver and Passenger Mutations
The PHBR scores for driver and passenger mutations were calculated for all patients whose tumor harbored the mutation. Recurrent oncogenic mutations were further designated drivers if they were observed in at least ten TCGA patients. This resulted in a total of 5,191 patient-specific presentation scores for 144 highly recurrent oncogenic mutations and 1,584,367 presentation scores for 1,454,396 passenger mutations. Patient presentation score distributions for drivers and passengers were compared using a Mann-Whitney U test (Figure 4G).
Analysis of Presentation versus Mutation Frequency Among Tumors
Recurrent oncogenic mutations were grouped according to the number of TCGA patients in which they were observed. For each patient, the median PHBR score was determined for each mutation group (Figure 5 heatmap). The correlation between the median PHBR score of each group across all patients (median of Figure 5 heatmap columns) and the number of patients harboring the mutation was tested using Spearman correlation. The analysis was repeated considering only HLA-A and HLA-B alleles (Figure S5A). The analysis was also repeated after removing mutations that were predominantly associated with a single tumor type (i.e., > 50% of the mutation occurred in the same tumor type; Figure S5B).
Comparison of Presentation Scores for Different Classes of Residue
Presentation scores across all 2,915 HLA-A, HLA-B and HLA-C alleles in IEDB were calculated for different classes of residue including 1000 recurrent oncogenic missense mutations, 3000 random amino acid substitution, 1000 germline variants, 1000 viral residues and 1000 bacterial residues (see Selection of Other Classes of Residues). Across categories, this resulted in 20,405,000 million residue scores (oncogenes: 1,492,480, tumor suppressor genes: 1,422,520, random: 8,745,000, common: 2,915,000, viral: 2,915,000, bacterial: 2,915,000). Residue presentation scores were pooled across HLAs, and fractions of weak and strong binders for all recurrent oncogenic (≥3; Figures S6G and S6J) and highly recurrent oncogenic mutations (≥10; Figure 6B) were compared with other categories. To determine whether observed differences in fractional presentation were significant, we compared fractions with a t test. Random mutations were down-sampled 1000 times at random to match the number of highly recurrent oncogenic mutations, and the fraction of binders across samples was used to construct an empirical distribution for assessing the likelihood that the observed fraction of binders among oncogenic mutations could occur under the random model (Figure S6C). We repeated the calculation of presentation scores for the native residues corresponding to recurrent oncogenic and random mutations (Figures 6C and 6D) and compared fractional binding of native versus mutant residues using the same approach. We revisited our analysis using population-specific HLA alleles from the Allele Frequency Net Database (Tables S7B–S7H; Figure S6E), excluding HLA-C alleles (Figures S6F and S6G), evaluating all recurrent cancer mutations (≥3; Figures S6H and S6I), and only using NetMHCPan3.0 affinity estimates for 9mers (Figures S6J and S6K).
Comparison of Presentation Scores Inside and Outside of Functional Protein Domains
All functional domain annotations for each of the 200 cancer genes were obtained from UniProt. Patient presentation scores for all TCGA patients were calculated for every residue position across the length of the proteins. The residues were then divided into those falling in functional domains and those falling outside of functional domains and the distribution of patient presentation scores in each category was evaluated with a Mann Whitney U test (Figure S6D).
Additional Statistical Considerations
For all individual tests, a p value of less than 0.05 was considered significant. When multiple comparisons were made, p values were adjusted using the Bonferroni method unless otherwise specified. For all boxplots, whiskers indicate the 1.5 IQR range and outliers are not displayed to allow for better visualization of the majority of the data which falls within the 1.5 IQRs.
DATA AND SOFTWARE AVAILABILITY
Data were obtained from publicly available sources including The Cancer Genome Atlas (TCGA) Research Network (https://cancergenome.nih.gov/), The Allele Frequency Net Database (González-Galarza et al., 2015), Ensembl, Exome Variant Server, UniProt (UniProt Consortium, 2015), IEDB (accession 1000685; (Trolle et al., 2016) or cited literature (Abelin et al., 2017). TCGA normal genotype calls were obtained from the data matrix on May 20th, 2014. Specifically TCGA level 2 genotype calls generated from Affymetrix SNP6.0 array intensities using the BirdSuite software were downloaded (Korn et al., 2008). TCGA normal exome sequences and TCGA clinical data were also downloaded from the GDC on April 25–30th, 2017 and April 25th, 2017 respectively. Furthermore, TCGA somatic mutations were accessed from the NCI Genomic Data Commons (https://portal.gdc.cancer.gov/) on May 14th, 2017. Population level HLA frequencies were obtained from the Allele Frequency Net Database on October 9th, 2015 (Tables S7B–S7H). Common germline variants were downloaded from the Exome Variant Server NHLBI GO Exome Sequencing Project (ESP), Seattle, WA on August 13, 2015. Finally, viral and bacterial peptides were obtained from UniProt on October 13th, 2015.
Supplementary Material
Figure S1. Scoring Residue Presentation Based on Predicted Binding Affinity, Related to Figure 1
(A) The number of 8–11-mer peptides that differed from the native sequence for recurrent in-frame indels pan-cancer.
(B–E) The distribution of residue-centric presentation scores for MS-observed peptides and randomly selected residues for (B) best rank, (C) summation (rank < 2), (D) summation (rank <0.5), and (E) best rank with cleavage.
(F–I) The log of the ratio between the fraction of MS-observed residues and the fraction of random residues detected over regular score intervals for (F) best rank, (G) summation (rank < 2), (H) summation (rank <0.5), and (I) best rank with cleavage.
(J) A ROC curve revealing the accuracy of classification for several different presentation scoring schemes.
(K) A heatmap showing the AUCs for the 16 alleles for each presentation scoring scheme.
Figure S2. HLA Typing of TCGA Patients, Related to Figure 2
(A) The number of patients in TCGA that were successfully HLA-typed with Optitype, Polysolver and Snp2HLA respectively.
(B) Bar plot depicting the number of patients with varying agreement of HLA-typing across all six alleles for patients that were successfully typed with Optitype and Polysolver.
(C) Principal Components Analysis of TCGA European ancestry samples with HapMap III to evaluate population substructure. The first two principal components explained 87% of the variation in genotype among samples. Only samples in the black box were HLA-typed with Snp2HLA.
(D) The combination of HLA-typing methods used for the 9,176 patients included in the analysis.
(E–G) Top 15 alleles by frequency for (E) HLA-A, (F) HLA-B and (G) HLA-C across the TCGA patients used in the analysis.
(H–J) Comparisons of HLA allele frequencies between different populations: (H) TCGA-Caucasian (I) TCGA-African (J) TCGA-Japanese.
Figure S3. PHBR Scores across Mutations and Patients, Related to Figure 3
(A) A histogram showing the number of mutations presented (PHBR < 4) by different fractions of the patient population.
(B) A histogram showing the number of mutations strongly presented (PHBR < 1) by different fractions of the patient population.
(C) A histogram showing the distributions of patients that can present (PHBR < 4) different fractions of the 1018 recurrent oncogenic mutations from Table S5.
(D) A histogram showing the distributions of patients that can strongly present (PHBR < 1) different fractions of the 1018 recurrent oncogenic mutations from Table S3.
Figure S4. Evaluating the Association between PBR Score and Probability of Mutation, Related to Figure 4
(A and B) Non-parametric estimate of the logit-mutation probability as a function of log-PHBR scores considering mutations ≥ 5 (A) Scatterplot of logit-mutation probability versus log-PHBR. (B) GAM-estimated logit-mutation probability versus log-PHBR score.
(C–F) ORs (black squares) and their 95% CIs (discontinuous lines) for acquiring a mutation displayed for all cancer types for (C) the within-residue model for mutations occurring ≥ 5 times in TCGA and for (D) the within-patient model for mutations occurring ≥ 5 times in TCGA (E) within-residue model for mutations occurring ≥ 20 times in TCGA and (F) within-patient model for mutations occurring ≥ 20 times in TCGA.
(G) A ROC curve showing the accuracy of the PHBR and the PBR for classifying the extracellular presentation of a residue by a patient’s six MHC alleles. The aggregated PHBR/PBR presentation scores for 5 cell lines expressing 6 MHC alleles was compared to the PHBR/PBR scores for a random set of residues based on the same MHC alleles.
(D) Error bars denote the 1.5 IQR range.
Figure S5. Robustness of the Relationship between PHBR Score and Mutation Frequency among Tumors, Related to Figure 5
(A) Heatmap showing the PHBR scores considering only HLA-A and HLA-B in all 9,176 patients for the 1018 recurrent cancer mutations grouped by their mutation count in TCGA and displayed as a median. The median PHBR score across the patient population for each mutation group is plotted above the heatmap. The number of times the mutation group is observed in TCGA is plotted below the heatmap. The correlation between the mutation count in TCGA and the median patient presentation score is calculated with a Spearman Test.
(B) A plot showing the relationship between tumor type and mutations used to test correlation between median PHBR score and mutation frequency. Colored points indicate mutations for which the majority (> 50%) of tumors with that mutation belonged to a specific tumor type.
Figure S6. Universally Poor Presentation of Recurrent Oncogenic Mutations by HLA Alleles Revisited, Related to Figure 6
(A) Bar graph of the number of alleles per HLA gene for which affinity prediction is supported by NetMHCPan3.0.
(B) Bar graph showing the number of residues for each of the 6 peptide classes for which pan-HLA presentation rates were compared.
(C) Distribution of the expected fraction of residues generating a strong binding peptide (best rank < 0.5) determined by down-sampling the random set to match the number of recurrent oncogenic mutations 1000 times. The vertical black line represents the observed fraction of recurrent oncogenic residues that generated strong binding peptides, corresponding to an empirical p value of 0.006.
(D) Boxplot showing the average PHBR score for residues in functional domains and those outside of functional domains. The analysis was performed across all residues in 100 randomly selected proteins from the human proteome.
(E) Bar plot shows the fraction of residues in functional domains and out of functional domains.
(F–L) Bar graphs denoting the percentage of residue-MHC pairs with strong binding peptides (best rank < 0.5) for each residue class. (F) Only HLA alleles observed in different populations (G,J) only HLA-A and -B (H,K) including all mutations at lower frequencies (≥3 in TCGA), (I,L) 9-mer peptides only.
Highlights.
Development of a residue-centric patient MHC-I presentation score validated by MS
MHC-I genotype is associated with the appearance of specific oncogenic mutations
Oncogenic mutation frequency negatively correlates with population MHC-I presentation
Recurrent oncogenic mutations are biased toward peptides that are poorly presented
In Brief.
HLA genotype-restricted immunoediting during tumor formation shapes the landscape of oncogenic mutations observed in clinically diagnosed tumors.
Acknowledgments
We would like to thank Brian Tsui, Anne-Ruxandra Carvunis, Philipp Jaeger, J.P. Shen, Justin Huang, Olivier Harismendy, and the members of the Ideker and Carter lab, as well as the members of the FCCC Cancer Biology program, for scientific discussion. We would like to thank Alfonso Bellacosa, Glenn Rall, and Maurizio Zanetti for critical reading of the manuscript. Furthermore, we would like to acknowledge Andrea M. Patterson for her work on the ovarian cell lines and the TCGA research network for providing the data used in the analyses. Finally, we would like to thank the reviewers for their excellent suggestions, which significantly strengthened the manuscript. This work was supported by a NSF graduate fellowship #2015205295 to R.M., Ramón y Cajal Fellowship RYC-2015-18544 to D.R., and NIH grants DP5-OD017937 to H.C., K99/R00CA191152 to J.F-B., and U24 CA184427 to T.I., as well as the Cancer Cell Map Initiative U54CA209891 supported by the Fred Luddy Family Foundation. W.H.H. is Chief Scientist at, and has equity in, Pure Protein, Pure Transplant Solutions, and Pure MHC. W.H.H. has a consulting agreement with Pure MHC, and S.K. is an employee at Pure MHC.
Footnotes
SUPPLEMENTAL INFORMATION
Supplemental Information includes six figures and seven tables and can be found with this article online at https://doi.org/10.1016/j.cell.2017.09.050.
AUTHOR CONTRIBUTIONS
Original Concept, J.F.-B.; Project Supervision, H.C. and J.F.-B.; Project Planning and Experimental Design, J.F.-B., H.C., R.M., J.v.d.H., and T.I.; Computational Resources, T.I.; Data Acquisition, Processing, and Analysis, R.M., D.R., M.J.S., N.d.P., and H.C.; Statistical Advising, D.R.; Protein Domain Advising, H.B.E.; Experimental Validation, S.K. and W.H.H.; Figures, R.M., J.F.-B., D.R., and H.C.; Manuscript, R.M., J.F.-B., J.v.d.H., and H.C. All data are available through The Cancer Genome Atlas and IEDB.
References
- Abelin JG, Keskin DB, Sarkizova S, Hartigan CR, Zhang W, Sidney J, Stevens J, Lane W, Zhang GL, Eisenhaure TM, et al. Mass spectrometry profiling of HLA-associated peptidomes in mono-allelic cells enables more accurate epitope prediction. Immunity. 2017;46:315–326. doi: 10.1016/j.immuni.2017.02.007. [DOI] [PMC free article] [PubMed] [Google Scholar]
- Aken BL, Achuthan P, Akanni W, Amode MR, Bernsdorff F, Bhai J, Billis K, Carvalho-Silva D, Cummins C, Clapham P, et al. Ensembl 2017. Nucleic Acids Res. 2017;45(D1):D635–D642. doi: 10.1093/nar/gkw1104. [DOI] [PMC free article] [PubMed] [Google Scholar]
- Bassani-Sternberg M, Pletscher-Frankild S, Jensen LJ, Mann M. Mass spectrometry of human leukocyte antigen class I peptidomes reveals strong effects of protein abundance and turnover on antigen presentation. Mol Cell Proteomics. 2015;14:658–673. doi: 10.1074/mcp.M114.042812. [DOI] [PMC free article] [PubMed] [Google Scholar]
- Bates D, Maechler M, Bolker B, Walker S. Fitting linear mixed-effects models using lme4. J Stat Softw. 2015;67:1–48. [Google Scholar]
- Bozic I, Antal T, Ohtsuki H, Carter H, Kim D, Chen S, Karchin R, Kinzler KW, Vogelstein B, Nowak MA. Accumulation of driver and passenger mutations during tumor progression. Proc Natl Acad Sci USA. 2010;107:18545–18550. doi: 10.1073/pnas.1010978107. [DOI] [PMC free article] [PubMed] [Google Scholar]
- Brahmer JR, Tykodi SS, Chow LQM, Hwu WJ, Topalian SL, Hwu P, Drake CG, Camacho LH, Kauh J, Odunsi K, et al. Safety and activity of anti-PD-L1 antibody in patients with advanced cancer. N Engl J Med. 2012;366:2455–2465. doi: 10.1056/NEJMoa1200694. [DOI] [PMC free article] [PubMed] [Google Scholar]
- Carreno BM, Magrini V, Becker-Hapak M, Kaabinejadian S, Hundal J, Petti AA, Ly A, Lie WR, Hildebrand WH, Mardis ER, Linette GP. Cancer immunotherapy. A dendritic cell vaccine increases the breadth and diversity of melanoma neoantigen-specific T cells. Science. 2015;348:803–808. doi: 10.1126/science.aaa3828. [DOI] [PMC free article] [PubMed] [Google Scholar]
- Davoli T, Xu AW, Mengwasser KE, Sack LM, Yoon JC, Park PJ, Elledge SJ. Cumulative haploinsufficiency and triplosensitivity drive aneuploidy patterns and shape the cancer genome. Cell. 2013;155:948–962. doi: 10.1016/j.cell.2013.10.011. [DOI] [PMC free article] [PubMed] [Google Scholar]
- DuPage M, Mazumdar C, Schmidt LM, Cheung AF, Jacks T. Expression of tumour-specific antigens underlies cancer immunoediting. Nature. 2012;482:405–409. doi: 10.1038/nature10803. [DOI] [PMC free article] [PubMed] [Google Scholar]
- Forbes SA, Beare D, Gunasekaran P, Leung K, Bindal N, Boutselakis H, Ding M, Bamford S, Cole C, Ward S, et al. COSMIC: Exploring the world’s knowledge of somatic mutations in human cancer. Nucleic Acids Res. 2015;43:D805–D811. doi: 10.1093/nar/gku1075. [DOI] [PMC free article] [PubMed] [Google Scholar]
- González-Galarza FF, Takeshita LYC, Santos EJM, Kempson F, Maia MHT, da Silva ALS, Teles e Silva AL, Ghattaoraya GS, Alfirevic A, Jones AR, Middleton D. Allele frequency net 2015 update: New features for HLA epitopes, KIR and disease and HLA adverse drug reaction associations. Nucleic Acids Res. 2015;43:D784–D788. doi: 10.1093/nar/gku1166. [DOI] [PMC free article] [PubMed] [Google Scholar]
- Hanahan D, Weinberg RA. Hallmarks of cancer: The next generation. Cell. 2011;144:646–674. doi: 10.1016/j.cell.2011.02.013. [DOI] [PubMed] [Google Scholar]
- Hodi FS, O’Day SJ, McDermott DF, Weber RW, Sosman JA, Haanen JB, Gonzalez R, Robert C, Schadendorf D, Hassel JC, et al. Improved survival with ipilimumab in patients with metastatic melanoma. N Engl J Med. 2010;363:711–723. doi: 10.1056/NEJMoa1003466. [DOI] [PMC free article] [PubMed] [Google Scholar]
- Jia X, Han B, Onengut-Gumuscu S, Chen WM, Concannon PJ, Rich SS, Raychaudhuri S, de Bakker PIW. Imputing amino acid polymorphisms in human leukocyte antigens. PLoS ONE. 2013;8:e64683. doi: 10.1371/journal.pone.0064683. [DOI] [PMC free article] [PubMed] [Google Scholar]
- Kaplan DH, Shankaran V, Dighe AS, Stockert E, Aguet M, Old LJ, Schreiber RD. Demonstration of an interferon gamma-dependent tumor surveillance system in immunocompetent mice. Proc Natl Acad Sci USA. 1998;95:7556–7561. doi: 10.1073/pnas.95.13.7556. [DOI] [PMC free article] [PubMed] [Google Scholar]
- Keşxmir C, Nussbaum AK, Schild H, Detours V, Brunak S. Prediction of proteasome cleavage motifs by neural networks. Protein Eng. 2002;15:287–296. doi: 10.1093/protein/15.4.287. [DOI] [PubMed] [Google Scholar]
- Koebel CM, Vermi W, Swann JB, Zerafa N, Rodig SJ, Old LJ, Smyth MJ, Schreiber RD. Adaptive immunity maintains occult cancer in an equilibrium state. Nature. 2007;450:903–907. doi: 10.1038/nature06309. [DOI] [PubMed] [Google Scholar]
- Korn JM, Kuruvilla FG, McCarroll SA, Wysoker A, Nemesh J, Cawley S, Hubbell E, Veitch J, Collins PJ, Darvishi K, et al. Integrated genotype calling and association analysis of SNPs, common copy number polymorphisms and rare CNVs. Nat Genet. 2008;40:1253–1260. doi: 10.1038/ng.237. [DOI] [PMC free article] [PubMed] [Google Scholar]
- Lu YC, Robbins PF. Targeting neoantigens for cancer immunotherapy. Int Immunol. 2016;28:365–370. doi: 10.1093/intimm/dxw026. [DOI] [PMC free article] [PubMed] [Google Scholar]
- Marsh SGE, Parham P, Barber LD. The HLA FactsBook. Academic Press; 1999. [Google Scholar]
- Matsushita H, Vesely MD, Koboldt DC, Rickert CG, Uppaluri R, Magrini VJ, Arthur CD, White JM, Chen YS, Shea LK, et al. Cancer exome analysis reveals a T-cell-dependent mechanism of cancer immunoediting. Nature. 2012;482:400–404. doi: 10.1038/nature10755. [DOI] [PMC free article] [PubMed] [Google Scholar]
- McGranahan N, Favero F, de Bruin EC, Birkbak NJ, Szallasi Z, Swanton C. Clonal status of actionable driver events and the timing of mutational processes in cancer evolution. Sci Transl Med. 2015;7:283ra54. doi: 10.1126/scitranslmed.aaa1408. [DOI] [PMC free article] [PubMed] [Google Scholar]
- Nielsen M, Andreatta M. NetMHCpan-3.0; improved prediction of binding to MHC class I molecules integrating information from multiple receptor and peptide length datasets. Genome Med. 2016;8:33. doi: 10.1186/s13073-016-0288-x. [DOI] [PMC free article] [PubMed] [Google Scholar]
- Patterson AM, Kaabinejadian S, McMurtrey CP, Bardet W, Jackson KW, Zuna RE, Husain S, Adams GP, MacDonald G, Dillon RL, et al. Human leukocyte antigen-presented macrophage migration inhibitory factor is a surface biomarker and potential therapeutic target for ovarian cancer. Mol Cancer Ther. 2016;15:313–322. doi: 10.1158/1535-7163.MCT-15-0658. [DOI] [PMC free article] [PubMed] [Google Scholar]
- Racle J, de Jonge K, Baumgaertner P, Speiser DE, Gfeller D. Simultaneous enumeration of cancer and immune cell types from bulk tumor gene expression data. bioRxiv. 2017 doi: 10.7554/eLife.26476. https://doi.org/10.1101/117788. [DOI] [PMC free article] [PubMed]
- Rizvi NA, Hellmann MD, Snyder A, Kvistborg P, Makarov V, Havel JJ, Lee W, Yuan J, Wong P, Ho TS, et al. Cancer immunology. Mutational landscape determines sensitivity to PD-1 blockade in non-small cell lung cancer. Science. 2015;348:124–128. doi: 10.1126/science.aaa1348. [DOI] [PMC free article] [PubMed] [Google Scholar]
- Robinson J, Halliwell JA, Hayhurst JD, Flicek P, Parham P, Marsh SGE. The IPD and IMGT/HLA database: Allele variant databases. Nucleic Acids Res. 2015;43:D423–D431. doi: 10.1093/nar/gku1161. [DOI] [PMC free article] [PubMed] [Google Scholar]
- Rooney MS, Shukla SA, Wu CJ, Getz G, Hacohen N. Molecular and genetic properties of tumors associated with local immune cytolytic activity. Cell. 2015;160:48–61. doi: 10.1016/j.cell.2014.12.033. [DOI] [PMC free article] [PubMed] [Google Scholar]
- Shankaran V, Ikeda H, Bruce AT, White JM, Swanson PE, Old LJ, Schreiber RD. IFNgamma and lymphocytes prevent primary tumour development and shape tumour immunogenicity. Nature. 2001;410:1107–1111. doi: 10.1038/35074122. [DOI] [PubMed] [Google Scholar]
- Shukla SA, Rooney MS, Rajasagi M, Tiao G, Dixon PM, Lawrence MS, Stevens J, Lane WJ, Dellagatta JL, Steelman S, et al. Comprehensive analysis of cancer-associated somatic mutations in class I HLA genes. Nat Biotechnol. 2015;33:1152–1158. doi: 10.1038/nbt.3344. [DOI] [PMC free article] [PubMed] [Google Scholar]
- Sidney J, Peters B, Frahm N, Brander C, Sette A. HLA class I supertypes: A revised and updated classification. BMC Immunol. 2008;9:1. doi: 10.1186/1471-2172-9-1. [DOI] [PMC free article] [PubMed] [Google Scholar]
- Szolek A, Schubert B, Mohr C, Sturm M, Feldhahn M, Kohlbacher O. OptiType: Precision HLA typing from next-generation sequencing data. Bioinformatics. 2014;30:3310–3316. doi: 10.1093/bioinformatics/btu548. [DOI] [PMC free article] [PubMed] [Google Scholar]
- Topalian SL, Hodi FS, Brahmer JR, Gettinger SN, Smith DC, McDermott DF, Powderly JD, Carvajal RD, Sosman JA, Atkins MB, et al. Safety, activity, and immune correlates of anti-PD-1 antibody in cancer. N Engl J Med. 2012;366:2443–2454. doi: 10.1056/NEJMoa1200690. [DOI] [PMC free article] [PubMed] [Google Scholar]
- Trolle T, McMurtrey CP, Sidney J, Bardet W, Osborn SC, Kaever T, Sette A, Hildebrand WH, Nielsen M, Peters B. The length distribution of class I-restricted T cell epitopes is determined by both peptide supply and MHC allele-specific binding preference. J Immunol. 2016;196:1480–1487. doi: 10.4049/jimmunol.1501721. [DOI] [PMC free article] [PubMed] [Google Scholar]
- UniProt Consortium. UniProt: A hub for protein information. Nucleic Acids Res. 2015;43:D204–D212. doi: 10.1093/nar/gku989. [DOI] [PMC free article] [PubMed] [Google Scholar]
- Vita R, Overton JA, Greenbaum JA, Ponomarenko J, Clark JD, Cantrell JR, Wheeler DK, Gabbard JL, Hix D, Sette A, Peters B. The Immune Epitope Database (IEDB) 3.0. Nucleic Acids Res. 2015;43:D405–D412. doi: 10.1093/nar/gku938. [DOI] [PMC free article] [PubMed] [Google Scholar]
- Wood SN. Fast stable restricted maximum likelihood and marginal likelihood estimation of semiparametric generalized linear models. J R Stat Soc Series B Stat Methodol. 2010;73:3–36. [Google Scholar]
- Yates A, Akanni W, Amode MR, Barrell D, Billis K, Carvalho-Silva D, Cummins C, Clapham P, Fitzgerald S, Gil L, et al. Ensembl 2016. Nucleic Acids Res. 2016;44:D710–D716. doi: 10.1093/nar/gkv1157. [DOI] [PMC free article] [PubMed] [Google Scholar]
- Zhang J, Xin L, Shan B, Chen W, Xie M, Yuen D, Zhang W, Zhang Z, Lajoie GA, Ma B. PEAKS DB: de novo sequencing assisted database search for sensitive and accurate peptide identification. Mol Cell Proteomics. 2012;11 doi: 10.1074/mcp.M111.010587. M111.010587. [DOI] [PMC free article] [PubMed] [Google Scholar]
- Zemmour J, Parham P. Distinctive polymorphism at the HLA-C locus: Implications for the expression of HLA-C. J Exp Med. 1992;176:937–950. doi: 10.1084/jem.176.4.937. [DOI] [PMC free article] [PubMed] [Google Scholar]
Associated Data
This section collects any data citations, data availability statements, or supplementary materials included in this article.
Supplementary Materials
Figure S1. Scoring Residue Presentation Based on Predicted Binding Affinity, Related to Figure 1
(A) The number of 8–11-mer peptides that differed from the native sequence for recurrent in-frame indels pan-cancer.
(B–E) The distribution of residue-centric presentation scores for MS-observed peptides and randomly selected residues for (B) best rank, (C) summation (rank < 2), (D) summation (rank <0.5), and (E) best rank with cleavage.
(F–I) The log of the ratio between the fraction of MS-observed residues and the fraction of random residues detected over regular score intervals for (F) best rank, (G) summation (rank < 2), (H) summation (rank <0.5), and (I) best rank with cleavage.
(J) A ROC curve revealing the accuracy of classification for several different presentation scoring schemes.
(K) A heatmap showing the AUCs for the 16 alleles for each presentation scoring scheme.
Figure S2. HLA Typing of TCGA Patients, Related to Figure 2
(A) The number of patients in TCGA that were successfully HLA-typed with Optitype, Polysolver and Snp2HLA respectively.
(B) Bar plot depicting the number of patients with varying agreement of HLA-typing across all six alleles for patients that were successfully typed with Optitype and Polysolver.
(C) Principal Components Analysis of TCGA European ancestry samples with HapMap III to evaluate population substructure. The first two principal components explained 87% of the variation in genotype among samples. Only samples in the black box were HLA-typed with Snp2HLA.
(D) The combination of HLA-typing methods used for the 9,176 patients included in the analysis.
(E–G) Top 15 alleles by frequency for (E) HLA-A, (F) HLA-B and (G) HLA-C across the TCGA patients used in the analysis.
(H–J) Comparisons of HLA allele frequencies between different populations: (H) TCGA-Caucasian (I) TCGA-African (J) TCGA-Japanese.
Figure S3. PHBR Scores across Mutations and Patients, Related to Figure 3
(A) A histogram showing the number of mutations presented (PHBR < 4) by different fractions of the patient population.
(B) A histogram showing the number of mutations strongly presented (PHBR < 1) by different fractions of the patient population.
(C) A histogram showing the distributions of patients that can present (PHBR < 4) different fractions of the 1018 recurrent oncogenic mutations from Table S5.
(D) A histogram showing the distributions of patients that can strongly present (PHBR < 1) different fractions of the 1018 recurrent oncogenic mutations from Table S3.
Figure S4. Evaluating the Association between PBR Score and Probability of Mutation, Related to Figure 4
(A and B) Non-parametric estimate of the logit-mutation probability as a function of log-PHBR scores considering mutations ≥ 5 (A) Scatterplot of logit-mutation probability versus log-PHBR. (B) GAM-estimated logit-mutation probability versus log-PHBR score.
(C–F) ORs (black squares) and their 95% CIs (discontinuous lines) for acquiring a mutation displayed for all cancer types for (C) the within-residue model for mutations occurring ≥ 5 times in TCGA and for (D) the within-patient model for mutations occurring ≥ 5 times in TCGA (E) within-residue model for mutations occurring ≥ 20 times in TCGA and (F) within-patient model for mutations occurring ≥ 20 times in TCGA.
(G) A ROC curve showing the accuracy of the PHBR and the PBR for classifying the extracellular presentation of a residue by a patient’s six MHC alleles. The aggregated PHBR/PBR presentation scores for 5 cell lines expressing 6 MHC alleles was compared to the PHBR/PBR scores for a random set of residues based on the same MHC alleles.
(D) Error bars denote the 1.5 IQR range.
Figure S5. Robustness of the Relationship between PHBR Score and Mutation Frequency among Tumors, Related to Figure 5
(A) Heatmap showing the PHBR scores considering only HLA-A and HLA-B in all 9,176 patients for the 1018 recurrent cancer mutations grouped by their mutation count in TCGA and displayed as a median. The median PHBR score across the patient population for each mutation group is plotted above the heatmap. The number of times the mutation group is observed in TCGA is plotted below the heatmap. The correlation between the mutation count in TCGA and the median patient presentation score is calculated with a Spearman Test.
(B) A plot showing the relationship between tumor type and mutations used to test correlation between median PHBR score and mutation frequency. Colored points indicate mutations for which the majority (> 50%) of tumors with that mutation belonged to a specific tumor type.
Figure S6. Universally Poor Presentation of Recurrent Oncogenic Mutations by HLA Alleles Revisited, Related to Figure 6
(A) Bar graph of the number of alleles per HLA gene for which affinity prediction is supported by NetMHCPan3.0.
(B) Bar graph showing the number of residues for each of the 6 peptide classes for which pan-HLA presentation rates were compared.
(C) Distribution of the expected fraction of residues generating a strong binding peptide (best rank < 0.5) determined by down-sampling the random set to match the number of recurrent oncogenic mutations 1000 times. The vertical black line represents the observed fraction of recurrent oncogenic residues that generated strong binding peptides, corresponding to an empirical p value of 0.006.
(D) Boxplot showing the average PHBR score for residues in functional domains and those outside of functional domains. The analysis was performed across all residues in 100 randomly selected proteins from the human proteome.
(E) Bar plot shows the fraction of residues in functional domains and out of functional domains.
(F–L) Bar graphs denoting the percentage of residue-MHC pairs with strong binding peptides (best rank < 0.5) for each residue class. (F) Only HLA alleles observed in different populations (G,J) only HLA-A and -B (H,K) including all mutations at lower frequencies (≥3 in TCGA), (I,L) 9-mer peptides only.