Abstract
Background
The incidence of sudden arrhythmic death is markedly increased in diabetics.
Objective
Develop a mouse model for Post MI VT in the diabetic heart and determine the mechanism of an antiarrhythmic effect of statins.
Methods
EKG transmitters were implanted in wild type (WT), placebo and pravastatin treated Type I diabetic Akita mice, MIs induced by coronary ligation, Ca2+ transients studied by optical mapping, Ca2+ transients and sparks in left VM (VM) by the Ionoptix system and confocal microscopy.
Results
Burst pacing of Akita mouse hearts resulted in rate related QRS/T-Wave alternans, which was attenuated in pravastatin treated mice. Post MI Akita mice developed QRS/T-wave alternans and VT, 2,820 ± 879 beats/mouse which decreased to 343 ± 115 in pravastatin treated mice, (n=13, P<0.05). Optical mapping demonstrated pacing induced VT originating in the peri-infarction zone and Ca2+ alternans, both attenuated in hearts of statin treated mice. Akita VM displayed: Ca2+ alternans, triggered activity, increased; Ca2+ transient decay time (Tau), incidence of Ca2+ sparks and cytosolic Ca2+ and decreased SR Ca2+ stores which were in part reversed in cells from statin treated mice. Homogenates of Akita ventricles demonstrated decreased SERCA2a/PLB ratio and increased ratio of protein phosphatase (PP-1) to the PP-1 inhibitor PPI-1 reversed in homogenates of pravastatin treated Akita mice.
Conclusions
Pravastatin decreased the incidence of post MI VT and Ca2+ alternans in Akita mouse hearts in part via the reversal of abnormalities of Ca2+ handling via the PP-1/PPI-1 pathway.
Keywords: QRS/T-Wave alternans, Ca2+ alternans, ventricular tachycardia, diabetes, myocardial infarction, statins, Ca2+ handling proteins, Akita mouse
Introduction
QRS/T-wave alternans, a rate dependent beat to beat fluctuation in the surface electrocardiogram, has been associated with life threatening ventricular arrhythmias1 and sudden death in the setting of MI, long QT syndrome, and heart failure2. T-wave alternans on the surface EKG is felt to reflect events occurring at the single myocyte level and has been attributed to either a temporal or spatial dispersion of myocyte repolarization or abnormalities of Ca2+ cycling3,4. Ca2+ alternans, defined as alternating oscillations in the amplitude of Ca2+ transients, which may be manifested as variations in contractility, has been closely linked to the pathogenesis of VT and sudden death in heart failure5. Alternans due to dysfunctional Ca2+ cycling may reflect the inability of the myocyte to cycle Ca2+ beat to beat in response to increasing heart rate and has been attributed to abnormalities in the function of Ca2+ handling proteins6–8. Studies in the diabetic heart carried out mainly in streptozotocin (STZ) and/or alloxan induced diabetic rats or dogs have suggested that diabetes is associated with abnormalities of Ca2+ handling9. No direct correlation to the development of ventricular arrhythmia and sudden death in diabetes has been demonstrated.
Although statins may have an antiarrhythmic benefit in the setting of MI via a reduction in ischemic burden, a reduction in arrhythmic death and a decrease in appropriate implantable cardiac defibrillator firing have been reported in patients with both ischemic and non-ischemic cardiomyopathy10 consistent with the hypothesis that statins might have a direct antiarrhythmic effect. Here we use the Akita Type I diabetic mouse, characterized by a point mutation in the pro-insulin gene which interferes with insulin processing, as an animal model for the study of the mechanism of post MI arrhythmias in the diabetic heart and the mechanism of the antiarrhythmic effect of statins in these mice11,12. We demonstrated that these mice develop QRS/T-Wave alternans and VT in response to burst pacing, which was attenuated by pravastatin treatment12. We further determined that these mice develop VT in the setting of acute MI, the role of Ca2+ -dyshomeostasis in the pathogenesis of VT and the therapeutic effect of pravastatin.
Methods
Animals
Akita type I diabetic mice (C57BL/6J-Ins2Akita were obtained from Jackson Laboratories (See Supplemental data). For pravastatin treatment, Akita mice were treated for 7 days with either pravastatin 20mg.kg−1day−1 IP or an equal volume of normal saline, placebo. The dose of pravastatin was based on observations comparing dose and blood levels in mice and patients13, 14. All vertebrate animal-related procedures described here were approved by the Tufts Medical Center Institutional Animal Care Committee.
Coronary Artery ligation
EKG transmitters (DSI) were implanted. Telemetry data were recorded for a 1-hour baseline prior to coronary artery ligation and continuously for 30 hours post MI. Recordings were analyzed using a ventricular arrhythmia detector and classifier implemented by custom built software. The beginning and end of each occurrence of PVCs, doublets and triplets, non-sustained and sustained (≥3 seconds duration) VT, as well as the number of arrhythmic beats involved for each event was documented and visually verified. Results were derived from the incidence of runs of 3 or more consecutive beats during non-sustained and sustained VT. “VT beats” refers to the number of such beats observed.
Echocardiography
Echocardiographic studies were performed using a VisualSonics Vivo 2100 as described15.
Optical imaging of Calcium transients
Ca2+ transients optical mapping was carried as described12. Rhod-2 AM (0.4–0.6mL of 1mg/mL solution in DMSO, Invitrogen, Carlsbad, CA) was used as a Ca2+ indicator.
Cell isolation and electrophysiologic measurements
Dissociated VM from mouse left ventricles were prepared as described16. L-type Ca2+ currents, Ca2+ transients and Ca2+ spark recordings were carried out as indicted (supplemental data)17,18.
Immunoblotting
Protein extracts were prepared, and immunoblotting was performed as described16. Primary antibodies (Supplemental data).
Statistical analysis
Average values are expressed as means ± SEM. Statistical differences between mean values calculated by Student’s t-test or Mann-Whitney U-test as appropriate (two sided). The significance of differences between the incidence and frequency of events was calculated by the Pearson Chi-Square test or Likelihood Ratio. For cellular alternans, a mixed-effects logistic regression model was fitted to assess the association between the binary outcome of stimulation response alternans and categorical covariates: stimulation frequency, type of mouse (WT vs. Akita), and treatment (placebo vs. pravastatin). The model included a random intercept to account for the correlation between multiple tissue samples from the same mouse.
Results
QRS/T-Wave alternans in response to burst pacing in the Akita mouse heart
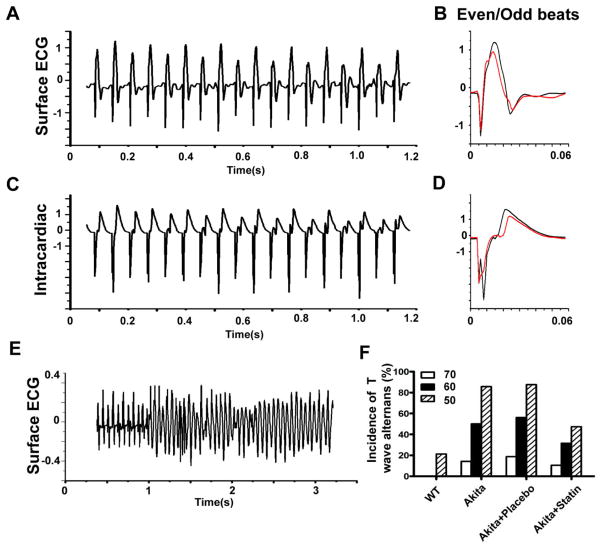
We previously demonstrated that the Akita Type I diabetic mouse is markedly inducible for VT in response to programmed ventricular stimulation, and that inducibility was significantly attenuated in Akita mice pretreated with pravastatin12. Further analysis of the surface EKG in these mice demonstrated a rate related beat to beat alteration in the surface and intracardiac ECG (Fig. 1A, C) consistent with QRS/T-Wave alternans (Fig. 1B, D), preceded the development of runs of VT, non-sustained VT (NSVT) and ventricular flutter (Fig. 1E). At a pacing rate of 1000bpm alternans was observed in 7/14 Akitas, 9/16 placebo treated Akitas and 0/14 WT mice (p<0.006 and 0.001, respectively vs WT by Fischer’s-exact test). At 1250bpm, 12/14 Akitas, 14/16 placebo treated Akitas and 3/14 WT (p<0.001 and 0.001, respectively vs WT, χ2) and only 9/19 statin treated Akitas developed alternans (p=0.013 vs placebo, χ2). Given that mice were subjected to successively increasing pacing rates, one limitation of these data is the potential carry over effect from the prior pacing rate.
Figure 1.
The development of QRS/T-Wave alternans in response to burst pacing in the Akita mouse. Response to bust pacing at 1000 bpm on A. Surface ECG, C. Intracardiac electrogram; B and D: Averaged and superimposed even and odd beats from A and C. E. Surface EKG at pacing rate of 1000 bpm followed by a run of VF. F. Percent of WT, Akita, Statin and placebo treated Akita mice developing QRS/T-wave alternans at pacing intervals of 70, 60 and 50ms.
The Akita mouse as a model for post MI VT in Type I diabetes
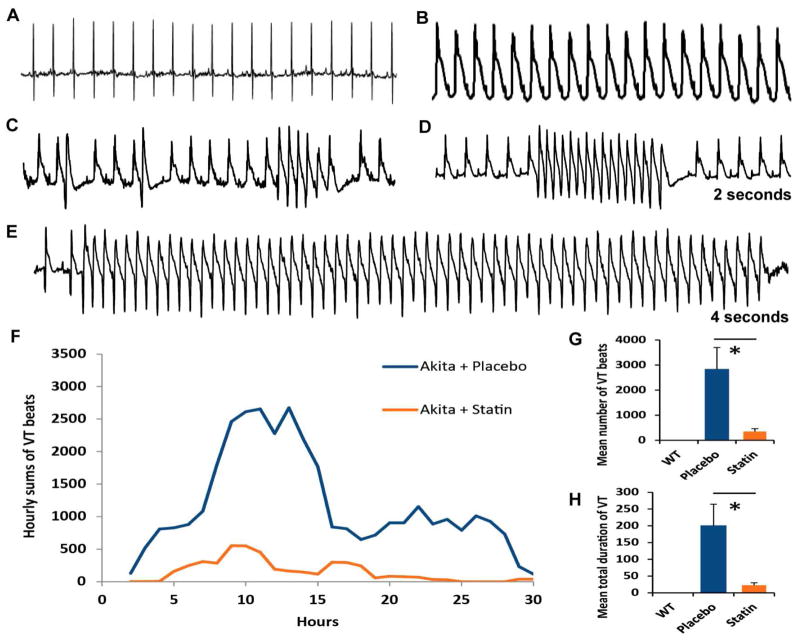
Given the relationship between QRS/T-Wave alternans and the predisposition to ventricular arrhythmia1 in the setting of MI, we determined whether Akita mice developed VT following acute MI. All mice demonstrated ST elevation (Fig. 2A, B). 10/14Akita mice developed QRS/T-wave alternans following coronary artery ligation (Fig. 2B). Subsequently, these mice developed increasing ventricular irritability progressing from PVCs. couplets, to longer runs of NSVT, and sporadic runs of VT (See Fig. 2C, D, E). Interestingly, heart rates following MI were not significantly different from those observed prior to MI. A plot of hourly sums of VT beats (i.e. runs of three or more beats) for all placebo treated Akita mice demonstrates an initial phase peaking at 10 to 14h post MI and a second phase from 18–28 hours; the latter demonstrating longer runs of both NSVT and VT (Fig. 2F). The mean number of VT beats/mouse was 2,820 ± 879 in placebo treated mice and the average total duration of VT beats was 200 ± 65 sec (n= 12). WT mice demonstrated only occasional PVCs (n=4, Fig. 2G, H).
Figure 2.
The effect of pravastatin on post MI VT. Typical EKG A. prior to and B. immediately following coronary artery ligation. Note: QRS/T-wave alternans. Development of C. PVCs, doublets and triplets. D. NSVT and E. VT. F. Time course of the development of post-MI VT plotted as the 3-hour moving average of the hourly sums of VT beats in placebo vs statin treated Akita. Comparison of G: the mean number of VT beats; H. the mean total duration of VT events in WT, placebo and pravastatin treated Akita mice. *P<0.05.
Pravastatin attenuates the incidence of Post MI VT in the Akita mouse
Compared with placebo, the mean number of VT beats in pravastatin treated mice decreased to 343 ± 115 (n=13, P<0.05, Fig. 2G) and average total duration of VT to 22.1±7.7s (P<0.05) Fig. 2H. Interestingly, the late phase VT was absent in pravastatin treated mice, Fig. 2F.
Comparison of infarct size and area at risk
Echocardiographic analysis demonstrated no significant differences in infarct size, ejection fraction, chamber size and fractional shortening (Supplemental Table SI). Infarct size and area at risk by Evans blue injection and TCC staining respectively were also not significantly different (P≤0.05, Supplemental Fig. S1 A–C).
Ca2+ alternans and MI in Akita mice
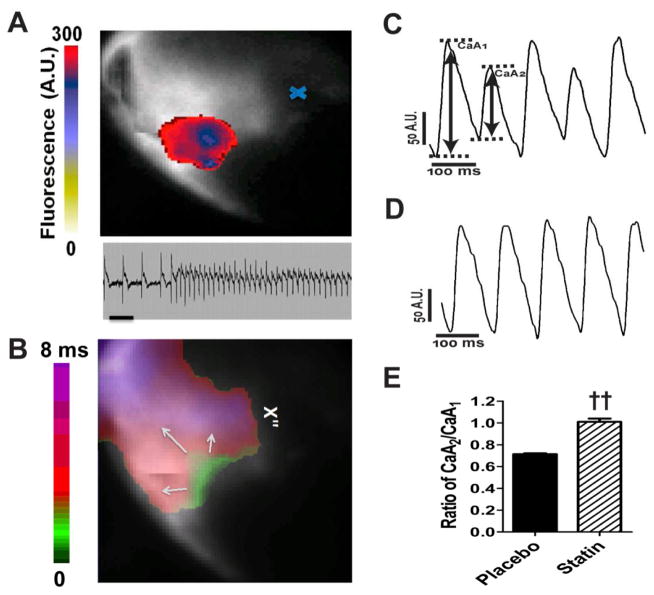
Optical mapping demonstrated that infarcted hearts from placebo treated Akita mice, harvested at the peak of spontaneous VT, developed runs of VT originating in the peri-infarct zone in response to burst pacing, while WT hearts did not (Fig. 3A, lower panel, Fig. 3B). Hearts from placebo treated mice developed Ca2+ alternans in both the peri-infarction zone Fig. 3C and remote myocardium (data not shown), with an alternans ratio of 0.713±.009 (n=3) and threshold between 9–12Hz (Fig. 3E). Hearts from WT mice did not develop alternans at these pacing rates. Hearts from pravastatin treated mice displayed neither pacing induced VT nor Ca2+ alternans in either the peri-infarction zone or remote myocardium, alternans ratio of 1.010±0.030 (n=3, P<0.01) Fig. 3D, E. Interestingly, neither action potential (AP) alternans nor repolarization alternans could be demonstrated and there was no evidence of spatially discordant alternans in Akita hearts at these pacing rates.
Figure 3.
Optical mapping of Ca2+ transient alternans in infarcted hearts from Akita mice. A. VT is focal, originating in the peri-infarct zone. The colored voltage fluorescence snapshot of the first tachyarrhythmic beat is superimposed on the fluorescence image of the heart. The scale indicates the fluorescence in arbitrary units, and the blue x indicates the location of the ligation site. Lower panel. The ECG is of the tachycardic episode mapped above. Scale bar: 200ms. B. Activation map demonstrating the initiation of VT in the peri-infarction zone. C. Ca2+ transients recorded from the peri-infarct zone 12 hours following coronary artery ligation in epicardially paced hearts at 12Hz from B. placebo treated and D. pravastatin treated Akita mice. E. Alternans ratio of Ca2+ transients in hearts from placebo and pravastatin treated mice defined as A2/A1. ††P<0.01 vs placebo.
Pravastatin increases the threshold for calcium alternans in VM from Akita mice
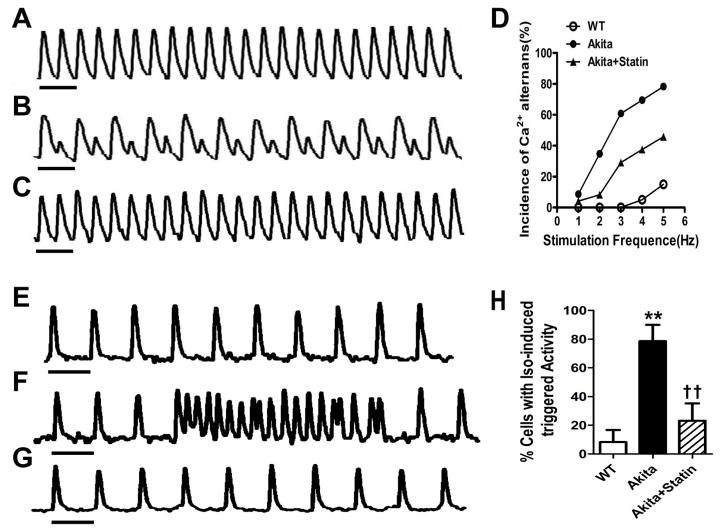
Five-percent of VM (n=20) from WT mice demonstrated an alternans threshold averaging 4 Hz and a maximum response at 5Hz (Fig. 4A, D), 14/23, (60.9 %) of VM from placebo treated Akita mice exhibited Ca2+ alternans with a threshold of 1Hz and a maximal response >4 Hz, Fig. 4B, D and 29.2% (7/24) VM from statin treated mice developed alternans at 3Hz compared with 60.9% (14/23, P<0.05) of cells from placebo treated mice (Fig. 4D). The estimated odds ratios (OR) and their 95% confidence intervals (CI) from the mixed-effects logistic regression model are shown in Table S2. All three categorical covariates (stimulation frequency, type of mouse, and treatment) were highly significant predictors of response to stimulation with alternans (p-value < 0.0001). These cells also demonstrated mechanical alternans in response to increased rates of field stimulation measured using video motion detector software (supplemental Fig. S2).
Figure 4.
Ca2+ alternans in VM from Akita mice is associated with triggered activity and is attenuated in pravastatin treated group. Representative Ca2+ transient trace paced at 3Hz from A: WT, B Akita and C Akita mice treated with pravastatin. D. Incidence of Ca2+ alternans in VM paced at 1–5 Hz. Isoproterenol stimulated triggered activity in VM from E. WT, F. Akita and G. pravastatin treated Akita mice. H.% of cells demonstrating ISO stimulated triggered activity. 0.05, **P<0.01 vs WT; †P<0.05, ††P<0.01 vs Akita. Horizontal bar:1 second.
Triggered activity in is attenuated in VM from pravastatin treated Akita mice
Perfusion of VM paced at 1Hz with 100 nmol/L ISO, had no effect on triggered activity in cells from WT mice (n=14), compared with 79% (11 of 14) cells from Akita (P<0.01) and 23.1% (3 of 13) in cells from pravastatin treated Akita mice (P<0.01 compared to Akita, Fig. 4E–H).
Ca2+ alternans in Akita VM is associated with decreased SR Ca2+
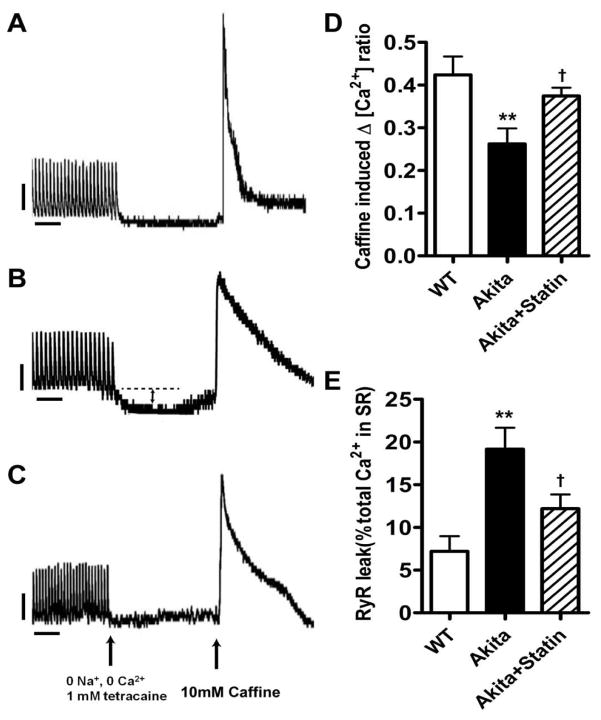
Fluctuations and/or depletion of sarcoplasmic reticulum (SR) Ca2+ have been reported to play an important role in the development of Ca2+ alternans19. SR Ca2+ content was significantly decreased in cells from Akita mice (0.26 ± 0.04, n=16) compared with WT (0.42 ± 0.04, n=14, P<0.01), but was increased (0.37±0.02, n=12, P<0.05, compared with Akita) in cells from statin treated Akita mice, Fig. 5A–D.
Figure 5.
Decreased SR Ca2+ content and increased SRCa2+ leak in VM from Akita mice are partially reversed in pravastatin treated Akitas. Cytosolic Ca2+ was determined in cells paced at 1 Hz for 20 sec followed by switching for 20 secs to 0 Na+ and 0 Ca2+ and 1mMol/L tetracaine to inhibit Na+ flux followed by 10mM caffeine. Ca2+ content was measured as the ratio of fluorescence at 340/380. Cells from A. WT. B. placebo treated Akita C. pravastatin treated mice, D. SR Ca2+ content, E. SR Ca2+ leak. Double headed arrow in B represents SR Ca2+ leak, Arrows in C represent time of switching of perfusion medium and addition of Caffeine. **P<0.01 vs WT, †P<0.05 vs Akita. Vertical bar: 0.1, Horizontal bar: 5 seconds.
SR Ca2+ depletion in VM from Akita mice and increased RyR2 leak
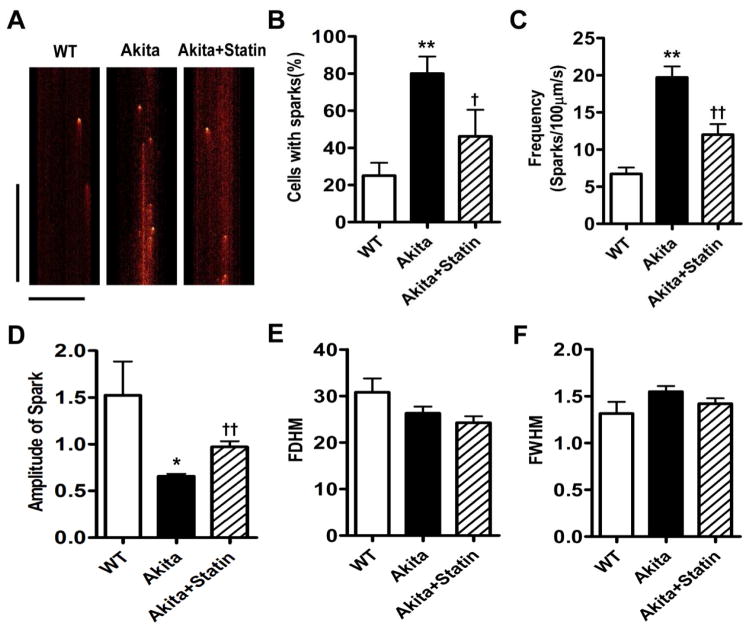
We determined whether the decrease in SR Ca2+ content reflected increased SR Ca2+ leak. The frequency of spontaneous Ca2+ sparks was significantly different in myocytes from WT, Akita and pravastatin treated Akita mice: 6.72 ± 0.85 (n=23), 19.7 ± 1.48 (n=36) and 12.0±1.41 (n=33) sparks/100μm/s, respectively (Fig. 6A, C). The mean amplitude of Ca2+ sparks was 1.52 ± 0.36 (n=27) in WT vs 0.66 ± 0.03 (n=36) in Akita myocytes (P<0.01) and increased to 0.97±0.06 in the statin treated group (n=33, P<0.01 compared to Akita, Fig. 5D) consistent with the decreased levels of SR Ca2+ in these cells. These findings are further supported by measurements of SR RYR2 leak: 7.2±1.8% (n=14) in WT vs. 19.2±2.5% in Akita myocytes (n=15, P<0.001), and 12.2±1.7% in myocytes from pravastatin treated Akita mice (n=10) P<0.05 compared to cells from placebo treated mice, Fig. 5A–C, E. SR Ca2+ depletion correlated with RyR2 leak, R2=0.5065, p<0.0001.
Figure 6.
Increased Ca2+ sparks in VM from Akita mice are attenuated in pravastatin treated mice. A. Line scan images. B. Percent of cells with sparks, C. Frequency of sparks, D. Amplitude of sparks, E. Full duration at half maximum amplitude (FDHM) and F. Full width at half maximum amplitude (FWHM). *P<0.05, **P<0.01 vs WT; †P<0.05, ††P<0.01 vs Akita. Vertical bar: 500 milliseconds, Horizontal bar: 20 μm.
Ca2+ reuptake was decreased in VM from Akita mice
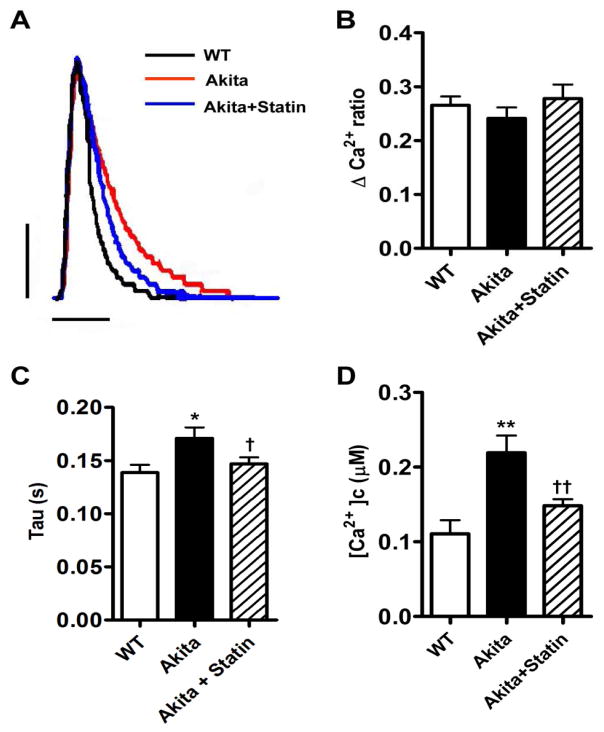
Comparison of representative traces of Ca2+ transients demonstrated a similar upstroke and peak height for all 3 groups (Fig. 7A). However, the mean value for tau, the slope of the recovery phase, was increased in cells from Akita compared with WT mice 0.17 ± 0.01 (n=23) vs. 0.14 ± 0.01, n=20 (P< 0.05), but decreased to 0.15 ±0.01, n=28, in myocytes from pravastatin treated mice (P<0.05 compared with Akitas, Fig. 7A, B, C). Sarcomere shortening was not significantly different in all 3 groups, data not shown.
Figure 7.
Effect of pravastatin on SR Ca2+ reuptake and cytosolic free Ca2+ in VM from Akita mice. A. Representative superimposed Ca2+ transients VM from WT, Akita and pravastatin treated Akitas. B. Absolute peak height of Ca2+ transients, Δ Ca2+ ratio. C. Tau, time constant for Ca2+ reuptake, D. Cytosolic free Ca2+ concentration. *P<0.05, **P<0.01 vs WT, †P<0.05, ††P<0.01 vs Akita. Vertical bar: 0.1, Horizontal bar: 0.2 millisecond.
Cytosolic Ca2+ is increased in VM from Akita mice, while L-Type Ca2+ currents are unchanged
Cytosolic Ca2+ in VMs from replicate measurements of Ca2+ transients were significantly elevated in Akita mice vs. WT; 0.22±0.02μM vs. 0.11±0.02μM (n=15, P<0.01) and decreased to 0.18±0.01μM (n=15) in cells from pravastatin mice (P<0.01 compared to Akita, Fig. 7D). Increased cytosolic Ca2+ in VM from Akita mice might reflect an increase in L-Type Ca2+ currents. Peak Ca2+ current densities and current voltage relationships were similar in both VM WT and Akita mice (Supplemental Fig. S3). Furthermore, there was no significant difference in expression of the Cav1.2, Na+/Ca2+ exchanger, NCX, RyR2 and p2808RyR2 in ventricular extracts from these mice (Supplementary Fig. S4 A–C).
The changes in Ca2+ handling proteins in the Akita ventricles are partially reversed by pravastatin
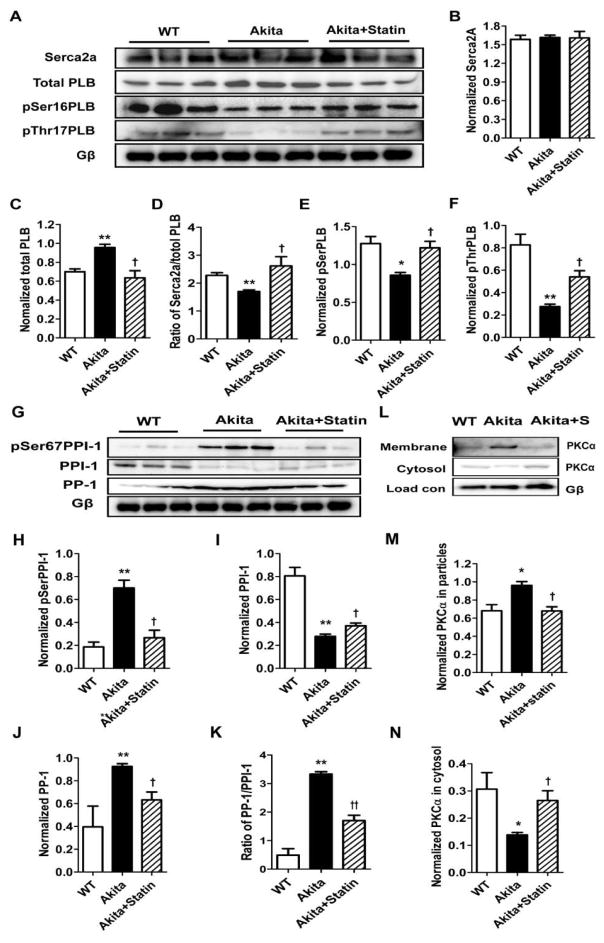
To determine the mechanism of decreased SR Ca2+ reuptake, we measured levels of Ca2+ handling proteins. While SERCA2a levels were unchanged, t-PLB was increased 1.37±0.05 fold (n=3, P<0.01) vs WT and decreased to 0.91±0.10 (n=3, P<0.05) fold compared to WT in extracts of placebo and pravastatin treated Akitas respectively, Fig. 8A–C. Hence the ratio of SERCA2a/t-PLB was 2.28±0.09 in WT extracts vs 1.70±0.06 (n=3, P<0.01) in Akita and 2.61±0.33(n=3) in pravastatin treated Akitas (P<0.05, compared with Akita, Fig. 8A–D). Given that unphosphorlyated PLB inhibits SERCA-2A activity, we compared the levels of pSer16-PLB and pThr17-PLB. pSer16-PLB and pThr17-PLB were decreased 0.67±0.03 fold (n=3, P<0.05) and 0.33±0.03 fold respectively (n=3, P<0.05) in Akita mice compared with WT, but was decreased only 0.96±0.07fold (n=3, P<0.05) and 0.66±0.07fold (n=3, P<0.05) compared to WT in ventricles of pravastatin treated mice (Fig. 8A, E, F).
Figure 8.
Comparison of expression of major Ca2+ handling and PKCα proteins in ventricular extracts from WT, Akita and pravastatin treated Akitas. Western blotting demonstrates changes in protein levels among the 3 groups, A, G and L. Bar graphs represent data normalized to Gβ levels. *P<0.05, ** P< 0.01 compared with WT; † P<0.05, ††P< 0.01 compared with Akita.
Given the role of PP-1 in the dephosphorylation of PLB, we determined the levels of PP-1 and it inhibitor PPI-1. PP-1 was increased 2.34±0.06 fold (n=3, P<0.01) in Akita ventricles compared with WT and 1.60±0.18fold (n=3) in homogenates of pravastatin treated Akitas (P<0.05, Fig. 8G, J) with a reciprocal change in PP-1, (Fig. 8G, I). Hence the ratio of PP-1/PPI-1 in Akita was 6.79±0.17 fold higher (n=3, P<0.05) compared with WT, and decreased to 0.51±0.06 fold (n=3, P<0.01) in pravastatin treated Akita mice compared with Akita, (Fig. 8K). Given that PPI-1 activity has also been shown to be negatively regulated by PKCα mediated phosphorylation at Ser67, we next determined the level of pSerPPI-120. pSer67PPI-1 was increased 3.76±0.36 fold (n=3, P<0.01) in Akita ventricles compared with WT and 1.43±0.35 fold (n=3) above WT in ventricles of pravastatin treated Akitas, P<0.05 (Fig. 8G, H). Finally, we determined whether increased pSer67PPI-1 might reflect increased PCKα activity in the Akita heart. PKCα activity, measured as translocation from the cytosol to the membrane demonstrated a 0.42±0.03 fold (n=4, P<0.05) decrease in the cytosolic form in extracts of Akita ventricles compared with WT, and a reciprocal 1.41±0.04fold increase (n=3, P<0.05) in the membrane associated form which was in part reversed in extracts of statin treated mice consistent with a role of increased PKCα activity in the inactivation of PP-1 by increased phosphorylation at Ser67, Fig. 8L, M, N.
Discussion
Here we develop the Akita mouse as a new animal model for the study of the mechanism and treatment of post MI VT in the Type I diabetic heart. This mouse demonstrates QRS/T-wave alternans in response to burst pacing and coronary artery ligation, which was attenuated in pravastatin treated mice. Significant data support the conclusion that T-wave alternans reflects action potential duration(APD) alternans occurring at the single myocyte level, which when combined with QRS alternans reflecting conduction velocity alternans at the tissue level, produces temporal and spatial dispersion of repolarization resulting in a high probability of reentrant arrhythmias1,8. T-Wave alternans may be related to APD alternans caused by steep restitution (the relationship between the action potential duration of one beat and the diastolic interval of the proceeding beat)3 or secondary to Ca2+ alternans8. Ca2+ recycling abnormalities promoting Ca2+ alternans are commonly associated with ischemia, MI and heart failure4,5. These data are consistent with our finding that following coronary artery ligation, Akita mice demonstrate QRS/T wave alternans without a significant change in heart rate consistent with an increased propensity of the heart to develop alternans in the setting of MI21. These same abnormalities can concurrently predispose cardiac myocytes to spontaneous diastolic SR Ca2+ release resulting in delayed afterdepolarization-related triggered activity22.
Furthermore, hearts from Akita mice developed rate related Ca2+ transient alternans and increased susceptibility of cardiomyocytes to isoproterenol-induced triggered activity, both of which were attenuated in pravastatin pretreated mice. These factors are known to predispose to arrhythmia and sudden death in the settings of heart failure and ischemia23, but had not been previously demonstrated in the diabetic heart.
Although we noted that increased susceptibility to rapid pacing induced QRS/T-Wave alternans in the surface ECG and in the intracardiac electrogram of the Akita mouse, consistent with underlying arhythmogenic spatially discordant repolarization alternans, we did not observe spatially discordant APD alternans during optical mapping of action potentials recorded from multiple epicardial sites1. This could indicate that the QRS/T-Wave alternans arose primarily from the endocardial or midmyocardial layers and were not detected on the epicardial surface. Alternatively, the cause of ventricular arrhythmias in the Akita mice during the post infarction period may be more related to triggered activity than spatially discordant alternans, consistent with the observation of the focal origin of VT revealed by optical mapping. In either case the data support that Ca2+ cycling is abnormal in Akita mice and resembles changes seen in heart failure, with down regulation of SERCA and increased RyR2 leakiness that are known to promote both Ca2+ alternans and spontaneous SR Ca2+ release underlying triggered activity22.
Specifically, studies demonstrated depletion of SR Ca2+ and increased cytosolic Ca2+ associated decreased Ca2+ reuptake by the SR during diastole and increased SR Ca2+ leak which were reversed in part in cells from pravastatin treated mice. Studies of the mechanism of decreased Ca2+ reuptake demonstrated a decrease in the ratio of SERCA-2a/PLB and p-PLB, which were at least in part reversed in ventricular extracts of pravastatin treated Akita mice. Furthermore, dephosphorylation of PLB was associated with increased PP-1 and decreased in both PPI-1 expression and activation which were reversed by statins. Although changes in PP-1/PPI-1 have been suggested in failing hearts24, our data are the first to demonstrate a reciprocal relationship between PP1 and PPI-1 in the diabetic heart. These data offer strong support for a unique mechanism by which pravastatin attenuates the development of Ca2+ alternans and the predisposition to Post MI VT in the Akita mouse heart in part by reversing the hyperactivity of the PKCα/PPI-1 pathway thus attenuating the depletion of SR Ca2+ and the increase in cytosolic Ca2+ and restoring Ca2+ homeostasis.
It should be noted that the interpretation of these data are limited by differences in resting heart rate and mechanisms of repolarization in the mouse compared with large mammals.
Conclusions
The finding that the anti-arrhythmic effect of pravastatin is associated with the attenuation of QRS and T-Wave alternans, Ca2+ transient alternans, an increase in SR Ca2+ reuptake, and a reversal of the PP-1/PPI-1 ratio, offers further insight into the PKCα/PP-1/PPI-1 pathway as a therapeutic target in the treatment and prevention of post MI VT in Type I diabetes.
Supplementary Material
Acknowledgments
Work was supported by NIH grants R01HL074876 and R01HL087827 to JBG and R21DK079622 to HP and the NIH CTSA award UL1TR001064 and the AHA grant 13SDG17050021 to HJ. We would like to acknowledge Dr. James Weiss for his reading and discussion of the manuscript and invaluable and insightful comments.
Footnotes
None of the authors has a conflict of interest.
Publisher's Disclaimer: This is a PDF file of an unedited manuscript that has been accepted for publication. As a service to our customers we are providing this early version of the manuscript. The manuscript will undergo copyediting, typesetting, and review of the resulting proof before it is published in its final citable form. Please note that during the production process errors may be discovered which could affect the content, and all legal disclaimers that apply to the journal pertain.
References
- 1.Pastore JM, Girouard SD, Laurita KR, Akar FG, Rosenbaum DS. Mechanism linking T-wave alternans to the genesis of cardiac fibrillation. Circulation. 1999;99:1385–94. doi: 10.1161/01.cir.99.10.1385. [DOI] [PubMed] [Google Scholar]
- 2.Cutler MJ, Rosenbaum DS. Explaining the clinical manifestations of T wave alternans in patients at risk for sudden cardiac death. Heart Rhythm. 2009;6:S22–8. doi: 10.1016/j.hrthm.2008.10.007. [DOI] [PMC free article] [PubMed] [Google Scholar]
- 3.Narayan SM. T-wave alternans and the susceptibility to ventricular arrhythmias. J Am Coll Cardiol. 2006;47:269–81. doi: 10.1016/j.jacc.2005.08.066. [DOI] [PubMed] [Google Scholar]
- 4.Verrier RL, Malik M. Electrophysiology of T-wave alternans: mechanisms and pharmacologic influences. J Electrocardiol. 2013;46:580–4. doi: 10.1016/j.jelectrocard.2013.07.003. [DOI] [PubMed] [Google Scholar]
- 5.Laurita KR, Rosenbaum DS. Cellular mechanisms of arrhythmogenic cardiac alternans. Prog Biophys Mol Biol. 2008;97:332–347. doi: 10.1016/j.pbiomolbio.2008.02.014. [DOI] [PMC free article] [PubMed] [Google Scholar]
- 6.Diaz ME, O’Neill SC, Eisner DA. Sarcoplasmic reticulum calcium content fluctuation is the key to cardiac alternans. Circ Res. 2004;94:650–6. doi: 10.1161/01.RES.0000119923.64774.72. [DOI] [PubMed] [Google Scholar]
- 7.Picht E, DeSantiago J, Blatter LA, Bers DM. Cardiac alternans do not rely on diastolic sarcoplasmic reticulum calcium content fluctuations. Circ Res. 2006;99:740–8. doi: 10.1161/01.RES.0000244002.88813.91. [DOI] [PubMed] [Google Scholar]
- 8.Qu Z, Nivala M, Weiss JN. Calcium alternans in cardiac myocytes: order from disorder. J Mol Cell Cardiol. 2013;58:100–9. doi: 10.1016/j.yjmcc.2012.10.007. [DOI] [PMC free article] [PubMed] [Google Scholar]
- 9.Choi KM, Zhong Y, Hoit BD, Grupp IL, Hahn H, Dilly KW, Guatimosim S, Lederer WJ, Matlib MA. Defective intracellular Ca(2+) signaling contributes to cardiomyopathy in Type 1 diabetic rats. Am J Physiol Heart Circ Physiol. 2002;283:H1398–408. doi: 10.1152/ajpheart.00313.2002. [DOI] [PubMed] [Google Scholar]
- 10.Das MK, Zipes DP. Antiarrhythmic and nonantiarrhythmic drugs for sudden cardiac death prevention. J Cardiovasc Pharmacol. 2010;55:438–449. [PubMed] [Google Scholar]
- 11.Kayo T, Koizumi A. Mapping of murine diabetogenic gene Mody on chromosome 7 at D7Mit258 and its involvement in pancreatic islet and β cell development during the perinatal period. J Clin Invest. 1998;101:2112–2118. doi: 10.1172/JCI1842. [DOI] [PMC free article] [PubMed] [Google Scholar]
- 12.Rajab M, Jin H, Welzig CM, Albano A, Aronovitz M, Zhang Y, Park HJ, Link MS, Noujaim SF, Galper JB. Increased inducibility of ventricular tachycardia and decreased heart rate variability in a mouse model for type 1 diabetes: Effect of pravastatin. American Journal of Physiology - Heart and Circulatory Physiology. 2013;305:H1807–H1816. doi: 10.1152/ajpheart.00979.2012. [DOI] [PMC free article] [PubMed] [Google Scholar]
- 13.Johnson J, Carson K, Williams H, Karanam S, Newby A, Angelini G, George S, Jackson C. Plaque rupture after short periods of fat feeding in the apolipoprotein E-knockout mouse: model characterization and effects of pravastatin treatment. Circulation. 2005;111:1422–30. doi: 10.1161/01.CIR.0000158435.98035.8D. [DOI] [PubMed] [Google Scholar]
- 14.Yao HW, Mao LG, Zhu JP. Protective effects of pravastatin in murine lipopolysaccharide-induced acute lung injury. Clinical and experimental pharmacology & physiology. 2006;33:793–7. doi: 10.1111/j.1440-1681.2006.04440.x. [DOI] [PubMed] [Google Scholar]
- 15.Zhang Y, Welzig CM, Picard KL, et al. Glycogen synthase kinase-3β inhibition ameliorates cardiac parasympathetic dysfunction in type 1 diabetic akita mice. Diabetes. 2014;63:2097–2113. doi: 10.2337/db12-1459. [DOI] [PMC free article] [PubMed] [Google Scholar]
- 16.Park HJ, Zhang Y, Du C, et al. Role of SREBP-1 in the development of parasympathetic dysfunction in the hearts of type 1 diabetic akita mice. Circ Res. 2009;105:287–294. doi: 10.1161/CIRCRESAHA.109.193995. [DOI] [PMC free article] [PubMed] [Google Scholar]
- 17.Shannon TR, Ginsburg KS, Bers DM. Quantitative assessment of the SR Ca2+ leak-load relationship. Circ Res. 2002;91:594–600. doi: 10.1161/01.res.0000036914.12686.28. [DOI] [PubMed] [Google Scholar]
- 18.Cheng H, Lederer WJ, Cannell MB. Calcium sparks: elementary events underlying excitation-contraction coupling in heart muscle. Science. 1993;262:740–744. doi: 10.1126/science.8235594. [DOI] [PubMed] [Google Scholar]
- 19.Díaz ME, O’Neill SC, Eisner DA. Sarcoplasmic Reticulum Calcium Content Fluctuation Is the Key to Cardiac Alternans. Circ Res. 2004;94:650–656. doi: 10.1161/01.RES.0000119923.64774.72. [DOI] [PubMed] [Google Scholar]
- 20.Wittköpper K, Dobrev D, Eschenhagen T, El-Armouche A. Phosphatase-1 inhibitor-1 in physiological and pathological β-adrenoceptor signalling. Cardiovasc Res. 2011;91:392–401. doi: 10.1093/cvr/cvr058. [DOI] [PubMed] [Google Scholar]
- 21.Chou CC, Zhou S, Hayashi H, et al. Remodelling of action potential and intracellular calcium cycling dynamics during subacute myocardial infarction promotes ventricular arrhythmias in Langendorff-perfused rabbit hearts. The Journal of physiology. 2007;580:895–906. doi: 10.1113/jphysiol.2006.120659. [DOI] [PMC free article] [PubMed] [Google Scholar]
- 22.Weiss JN, Garfinkel A, Karagueuzian HS, Nguyen TP, Olcese R, Chen PS, Qu Z. Perspective: a dynamics-based classification of ventricular arrhythmias. J Mol Cell Cardiol. 2015;82:136–52. doi: 10.1016/j.yjmcc.2015.02.017. [DOI] [PMC free article] [PubMed] [Google Scholar]
- 23.Hsueh CH, Chen NX, Lin SF, Chen PS, Gattone VH, Allen MR, Fishbein MC, Moe SM. Pathogenesis of arrhythmias in a model of CKD. J Am Soc Nephrol. 2014;25:2812–2821. doi: 10.1681/ASN.2013121343. [DOI] [PMC free article] [PubMed] [Google Scholar]
- 24.Neumann J, Eschenhagen T, Jones LR, Linck B, Schmitz W, Scholz H, Zimmermann N. Increased expression of cardiac phosphatases in patients with end-stage heart failure. J Mol Cell Cardiol. 1997;29:265–272. doi: 10.1006/jmcc.1996.0271. [DOI] [PubMed] [Google Scholar]
Associated Data
This section collects any data citations, data availability statements, or supplementary materials included in this article.


