

Summary
Autophagy failure associates with metabolic insufficiency. Although caloric restriction (CR) extends healthspan, its adherence in humans is poor. We established an isocaloric twice-a-day (ITAD) feeding model wherein ITAD-fed mice consume the same food amount as Ad libitum controls but at two short windows early and late in the diurnal cycle. We hypothesized that ITAD feeding will provide two intervals of intermeal fasting per circadian period and induce autophagy. We show that ITAD feeding modifies circadian autophagy and glucose/lipid metabolism that correlate with feeding-driven changes in circulating insulin. ITAD feeding decreases adiposity, and unlike CR, enhances muscle mass. ITAD feeding drives energy expenditure, lowers lipid levels, suppresses gluconeogenesis, and prevents age/obesity-associated metabolic defects. Using liver-, adipose-, myogenic-, and proopiomelanocortin neuron-specific autophagy-null mice, we mapped the contribution of tissue-specific autophagy to system-wide benefits of ITAD feeding. Our studies suggest that consuming two meals a day without CR could prevent the metabolic syndrome.
eTOC blurb
Our studies suggest that consuming two meals a day with complete food restriction in between the meals is sufficient to lower blood glucose and lipid levels. This simple dietary approach activates a cell “cleansing system” called autophagy in liver, fat, brain, and muscle that helps prevent obesity and diabetes.
Introduction
Decreased quality control and accumulation of damaged organelles are factors contributing to chronic diseases including the metabolic syndrome. Autophagy, a lysosomal quality control pathway critical for cellular cleanliness, is compromised with age – setting the basis for chronic diseases (Rubinsztein et al., 2011). In fact, mice knocked-out (KO) for the autophagy gene Atg7 or lacking Beclin function display early lethality (Karsli-Uzunbas et al., 2014) and metabolic defects including fat accumulation (Singh et al., 2009a), muscle loss (Martinez-Lopez et al., 2013; Masiero et al., 2009), and glucose intolerance (He et al., 2012; Karsli-Uzunbas et al., 2014).
Caloric restriction (CR) extends healthspan and lifespan in multiple organisms (Colman et al., 2009; Mattison et al., 2012). Despite its remarkable benefits, humans adhere poorly to CR (Moreira et al., 2011), which has motivated the search for sustainable approaches to extend healthspan. Alternate feeding strategies, including intermittent fasting (Anson et al., 2003; Heilbronn et al., 2005; Varady et al., 2009), fasting-mimicking intervention (Brandhorst et al., 2015), and time-restricted feeding (Chaix et al., 2014) each mimic the effects of CR. Since fasting activates autophagy, it is conceivable that dietary interventions mediate their benefits, in part, through autophagy. The integrative physiology of autophagy and its ability to promote metabolic correction in a dietary intervention model remains unexplored.
Because fasting activates autophagy, we established an isocaloric twice-a-day (ITAD) feeding model wherein test mice eat the same amount of food as ad libitum (Ad-lib) controls (Con) albeit they eat their food at two 2 hr windows early and late in the diurnal cycle. We hypothesized that adopting the ITAD feeding strategy will eliminate scattered feeding, and provide two windows of intermeal fasting in each circadian period, which in principle will sustain autophagy without the need to restrict calories or alter the type of food consumed. Here we show that ITAD feeding promotes system-wide benefits including reduction of body fat and increased lean mass that accompany significant tissue remodeling. ITAD feeding sustains autophagy levels in aged mice, and prevents age-associated energy imbalance, dyslipidemia, and glucose intolerance. Using liver-, adipose-, myogenic-, and hypothalamic proopiomelanocortin (POMC) neuron-specific Atg7 KO mice, we identified the contribution of cell-specific autophagy to system-wide benefits of ITAD feeding.
Results
Isocaloric twice-a-day (ITAD) feeding in mice
To develop a feeding strategy that incorporates periods of fasting between feeding windows, we randomized 4-month (mo) old C57BL/6J male mice into Ad-lib Con and ITAD groups. ITAD mice were fed between 8–10am (feeding window 1) and 5–7pm (feeding window 2) such that food consumed at these two diurnal windows equals the food consumed by Ad-lib mice in 24 hr (Fig. 1A). Analyses of food consumed per cage revealed that test mice (5 mice per cage) acclimatized to ITAD feeding by day 6 indicated by progressive increases in cumulative chow intake in the two windows (Fig. S1A, lower panel). Thereafter, we noted that each cage of 5 mice consumed the same amount of food per day (Ad-lib vs. ITAD; 15.1±0.7 vs. 14.9±0.8 g/cage/day) (Fig. S1A, S1B). After 16mo, both groups had consumed similar amounts of regular chow diet (RD) (Ad-lib cage vs. ITAD cage; 7109 vs. 6975 g) (Fig. S1C). Similarly, test mice (5 mice per cage) fed high fat diet (HFD; 60% calories in fat) acclimatized to ITAD feeding by day 3 (Ad-lib vs. ITAD; 8.95±0.6 vs. 8.77±0.6 g/cage/day) (Fig. S1D, S1E). After 8mo, Con and ITAD groups had consumed similar amounts of HFD (Ad-lib cage vs. ITAD cage; 2077 vs. 2035 g) (Fig. S1F). Our goal was to establish diurnal ITAD feeding and nocturnal isocaloric twice-a-night (ITAN) feeding strategies and compare their abilities to induce autophagy and prevent metabolic syndrome. Since ITAD and ITAN feeding led to similar effects on body weight in RD-fed mice, we pursued our long-term feeding studies in ITAD-fed mice.
Fig. 1. ITAD feeding influences body composition and energy expenditure.

(A) The isocaloric twice-a-day feeding (ITAD) strategy wherein test mice feed between 8–10am and between 5–7pm the same amount of food that ad libitum (Ad-lib)-fed controls (Con) eat in 24 hr. (B–C) Body weight (wt), (D–E) body composition, and (F) tissue wt at indicated intervals in regular chow diet (RD)-fed male mice subjected to Ad-lib or ITAD feeding for indicated duration (n=5). (G) Body wt of young, and (H) aged male mice fed Ad-lib or ITAD on high fat diet (HFD) for indicated durations (n=5). (I) CT for total fat or fat distributed in epididymal (eWAT) or subcutaneous (sWAT) pads, and (J) CT for lean mass in scapular (Sca) and abdominal (Abd) planes in Ad-lib or ITAD-fed male mice on RD for 12 months (mo) (n=5). (K) Gastrocnemius (GA) and soleus muscle wt in RD-fed male mice on Ad-lib or ITAD for 12mo (n=5). (L) VO2, VCO2, and EE rates in male mice fed Ad-lib or ITAD on RD or (M) HFD for indicated duration (n=5). Bars are mean ± SEM. (*P<0.05, **P<0.01), Student’s t test or Two-Factor ANOVA and Bonferroni correction. See also Figure S1.
ITAD feeding influences body composition and energy expenditure
Monthly body weight (wt) analyses for 12mo, and at 16mo of ITAD feeding, revealed no differences between RD-fed Ad-lib and ITAD mice supporting similar caloric intake by both groups (Fig. 1B and 1C). However, qNMR analyses revealed progressive loss of body fat and proportionate increase in lean mass as early as 3mo of ITAD feeding (Fig. 1D, 1E) indicating that partitioning calories into two meals is sufficient to alter body composition. In fact, analysis of tissue wt from RD-fed mice subjected to ITAD feeding for 4mo showed significantly decreased liver and epididymal white adipose tissue (eWAT) wt (Fig. 1F) in absence of changes in body wt (Fig. 1B, 1C). However, after 16mo of ITAD feeding, decreases in liver and eWAT weight did not acquire statistical significance (Fig. 1F). By contrast, 3mo (Fig. 1G) and 18mo (Fig. 1H) mice subjected to ITAD feeding on HFD for 8mo and 6mo, respectively, resisted wt gain when compared to Con mice.
To determine whether ITAD feeding increased muscle mass, we subjected mice to X-ray computed tomography (CT). CT reconstructions confirmed that ITAD feeding on RD for 12mo reduced total fat mass, and decreased subcutaneous WAT (sWAT) mass in abdominal (Abd) and scapular (Sca) planes (Fig. 1I). Further, CT revealed a trend of reduced eWAT mass in Abd plane (Fig. 1I). CT also showed a significant increase in lean mass in Sca plane and a trend for the same in Abd plane of ITAD-fed mice when compared to Con (Fig. 1J). Consistent with increased lean mass, gastrocnemius/soleus (GA-sol) muscles from 12mo ITAD mice weighed modestly more than those in Con (Fig. 1K). Reduction of fat mass in ITAD mice associated with increased oxygen consumption (VO2), carbon dioxide production (VCO2), and energy expenditure (EE) (Fig. 1L, 1M and S1G, S1H) that did not result from increased locomotion (Fig. S1I, S1J). Thus, ITAD feeding normalizes age and diet-associated energy imbalance.
ITAD feeding impacts circadian autophagy
Because ITAD feeding provides two periods of intermeal fasting, which activates autophagy, we tested if, and when, ITAD feeding stimulates autophagy. Our initial qPCR analyses at 6 time-points across 24 hr (7am, 11am, 3pm, 7pm, 11pm, and 3am) revealed modest increases in expression of autophagy-related genes Lc3 (light chain 3) and Beclin1 during the 1st feeding window in ITAD-fed mice (not shown). Consequently, we comprehensively tested the effect of ITAD feeding on autophagy activity across 24 hr via LC3-II flux analyses in livers exposed or not to lysosomal inhibitors at each of the 6 time-points. LC3-II flux analyses from distinct pools of mice subjected to ITAD feeding for 8–10mo revealed progressive increases in autophagy from 7–11am and maintenance of flux until 2pm, following which, autophagy flux steadily declined until 7pm to levels lower than those in Ad-lib mice (Fig. 2A, S2A). After 7pm, LC3-II flux gradually increased to reach its zenith at 3am in ITAD-fed mice (Fig. 2A). Upon comparing the oscillations of LC3-II flux in both groups (Fig. 2A), we noted a clear shift in phase of autophagy flux in ITAD-fed mice characterized by 8–10am feeding-associated induction of autophagy – a clear departure from the typical increase in autophagy during starvation. Consistent with maximal autophagy flux at 11am, Atg gene expression was increased in GA (Fig. 2B), iWAT (Fig. 2C), and mediobasal hypothalamus (MBH) (Fig. S2B) at 11am after as early as 4mo of ITAD feeding. Beclin1 protein levels were also increased to varying degrees at 11am in several tissues from 4mo ITAD-fed mice (Fig. 2D). Tissue-wide autophagy flux analyses revealed ~2.5-fold increase in flux of autophagy cargo p62 in MBH, ~3-fold increase in LC3-II flux in brown adipose tissue (BAT), and ~2-fold increase in LC3-II flux in GA at 11am from mice subjected to ITAD feeding for 8mo (Fig. 2E–2G).
Fig. 2. ITAD feeding impacts autophagy flux.

(A) Net LC3-II flux across 24 hr in liver explants from male mice in presence or absence of lysosomal inhibitors (Lys Inh) from RD-fed mice on Ad-lib or ITAD feeding for 8–10mo. Representative blots shown in Fig. S2A (n=6). (B–C) qPCR for indicated autophagy and lysosomal genes in gastrocnemius (GA) and iWAT (n=8), and (D) immunoblots (IB) for Beclin1 and ATG12-ATG5 conjugate in indicated tissues harvested at 11am from RD-fed male (n=4) and female mice (n=4) on Ad-lib or ITAD feeding for 4mo (total n=8). Densitometry values (D, right) are shown. (E–G) IB for p62 or LC3 depicting autophagy flux in explants from MBH (mediobasal hypothalamus), BAT and GA treated (+) or not (−) with Lys Inh from RD-fed male (n=4) and female mice (n=4) on Ad-lib or ITAD for 8mo (total n=8). Quantifications for net p62 or LC3-II flux are shown. (H) Oxygen consumption rates (OCR) in livers at 11am, (I) IB for LC3 in livers at 7pm and treated (+) or not (−) with Lys Inh for 2 hr, and (J) OCR in livers at 7pm from RD-fed male mice on Ad-lib or ITAD for 10mo, n=3. Quantification for net LC3-II flux and steady-state LC3-II are shown. Bars are mean ± SEM. (*P<0.05, **P<0.01, ***P<0.001). Student’s t test or Two-Factor ANOVA and Bonferroni correction. See also Figure S2.
Since mTOR and AMPK (Egan et al., 2011) regulate autophagy, we examined how their activities correlated with changes in LC3-II flux across 24 hr. Immunoblotting of liver lysates revealed that increases in LC3-II flux at 11am from ITAD mice associated with significantly increased phosphorylated (P)-AMPK levels (Fig. S2C, S2D). AMPK is induced by starvation, yet surprisingly, we noted increased P-AMPK levels in the 8–10am feeding window in ITAD mice suggesting that autophagy induction is perhaps AMPK-driven. ITAD feeding also increased P-S6 levels in both feeding windows reflecting nutrient-driven mTORC1 activity (Fig. S2E, S2F). Indeed, recent work has shown that availability of nutrients concurrently activates AMPK and mTOR (Dalle Pezze et al., 2016). Since mTOR suppresses autophagy, and because autophagy is active between 7–11am in ITAD mice (Fig. 2A), mTOR signaling at 11am is likely uncoupled from autophagy as demonstrated in secretory cells (Narita et al., 2011).
Because lipophagy (Singh et al., 2009a) drives fat utilization and oxygen consumption rates (OCR) (Martinez-Lopez et al., 2016), autophagy activation at 11am in ITAD-fed mice associated with ~2-fold increase in hepatic OCR (Fig. 2H), while suppression of LC3-II flux at 7pm (Fig. 2I, 2A) associated with normalization of OCR to basal rates (Fig. 2J). Our studies do not reveal the mechanism for time-dependent modulation of autophagy in ITAD-fed mice; however, it is likely that complex interplay between AMPK, a regulator of the circadian clock (Lamia et al., 2009) and autophagy (Egan et al., 2011), mTOR, and possibly a subset of core circadian proteins differentially regulate autophagy at distinct time-points during ITAD feeding.
ITAD feeding promotes iWAT browning
Since ITAD feeding decreases fat mass, we characterized the effect of ITAD feeding on WAT. Consistent with reduced fat mass, ITAD-fed mice displayed reduced serum leptin levels with values displaying statistical significance at 7am and 11pm indicating improved leptin sensitivity (Fig. S3A). Hematoxylin/Eosin (H/E) stains of WAT revealed decreased adipocyte size in ITAD-fed mice (Fig. 3A), which in conjunction with increased EE (Fig. 1L, 1M) suggested increased fat utilization. Indeed, iWAT from ITAD mice displayed pockets of uncoupling protein (UCP)-1-positive brown adipocytes displaying multiloculated lipid droplets (LD) (Fig. 3A–3C, Fig. S3B). Increased expression of brown genes, Zic1, Eva1, and Fbxo31 in iWAT, and no changes in expression of beige genes, Tmem26, Klhl13, and Tbx1 (Wu et al., 2012) supported iWAT browning in ITAD-fed mice (Fig. 3D). We also noted ~3-fold increase in expression of adipogenic precursor Ebf2 (Rajakumari et al., 2013) and Pdgfrα (Berry and Rodeheffer, 2013) in iWAT from ITAD mice (Fig. 3E). Since Ebf2 determines brown adipocyte identity, we suspect that Ebf2 orchestrates iWAT browning in ITAD mice. Although we detected a statistically insignificant increase in expression of myogenic factor Myf5 in eWAT from ITAD mice (Fig. 3E), the significance of this increase is unclear. In keeping with increased mitochondrial mass in brown adipocytes, we noted significant increases in expression of mitochondrial markers Cpt1b and Cox4 and of Pgc1α, a driver of mitochondrial biogenesis, in iWAT, and ~1.5–2-fold increase in expression of adipogenic factor Pparγ in iWAT and eWAT (Fig. 3F). Consistent with these data, respirometry revealed ~2-fold increase in OCR in iWAT (P=0.07) (Fig. 3G), but not in eWAT (Fig. 3H). Further, ITAD feeding improved the ability to respond to cold (4°C for 1 hr) indicated by increased expression of brown fat genes, but not beige genes, in iWAT (Fig. 3I).
Fig. 3. ITAD feeding remodels adipose tissue and skeletal muscle.

(A–B) Hematoxylin and eosin (H/E)-stained fat tissues (arrows show multiloculated adipocytes), and (C) UCP1 positivity in iWAT from RD-fed male mice on Ad-lib or ITAD feeding for 4mo (n=3). (D) qPCR for brown and beige genes, (E) adipocyte/myogenic progenitor genes in stromal vascular fractions (SVF), and (F) mitochondrial genes from male (n=4) and female (n=4) mice (total n=8), (G–H) OCR and AUC (area under curve) in iWAT and/or eWAT (n=3) from RD-fed male mice on Ad-lib or ITAD for 12mo. (I) Experimental plan, and qPCR of brown and beige genes in iWAT from RD-fed male mice on Ad-lib or ITAD for 12mo and then exposed to 4°C for 1 hr (n=3). (J) Immune markers in iWAT and eWAT from RD-fed male (n=4) and female mice (n=4) on Ad-lib or ITAD for 12mo (total n=8). (K) H/E stains and quantification for myocyte area, and (L) distribution of myocytes by area (pixel2), and (M) percentage of myofibers with centralized nuclei in GA from RD-fed male mice on Ad-lib or ITAD for 10mo (n=4). Arrows in 3K indicate centralized nuclei. (N) Myogenic genes (n=10), and (O) cell cycle genes in GA from RD-fed male mice on Ad-lib or ITAD for 6mo (n=8). (P, Q) Immunofluorescence (IF) of type IIB, and type I fibers in GA from RD-fed male mice on Ad-lib or ITAD for 10mo (n=4). Bars are mean ± SEM. (*P<0.05, **P<0.01, ***P<0.001), Student’s t test or Two-Factor ANOVA and Bonferroni correction. Scale: 50μm. See also Figure S3.
ITAD feeding increases M2 macrophage markers in eWAT
Surprisingly, ITAD feeding increased F4/80-positivity in WAT indicating macrophage infiltration (Fig. S3C). Because alternatively activated M2 macrophages are anti-inflammatory in nature (Bouhlel et al., 2007), we tested whether increased F4/80 positivity reflected an increase in M2 macrophage content. Indeed, qPCR analyses in eWAT, a fat depot prone to inflammation, revealed remarkably increased anti-inflammatory M2 macrophage markers Arg1 (~4-fold), Ym1 (~2-fold), and IL-10 (~2-fold) in ITAD-fed mice while only a modest increase in pro-inflammatory IL-6 expression was observed (Fig. 3J). By contrast, expression of anti- or pro-inflammatory cytokine genes remained unremarkable in iWAT (Fig. 3J).
ITAD feeding increases type IIB fibers in skeletal muscle
To understand how ITAD feeding increases muscle mass (Fig. 1K, S3D), we examined the effect of ITAD feeding on myocyte proliferation and fiber-type changes. H/E-stained GA from ITAD-fed mice for 10mo revealed myocytes that were ~25% smaller in size than Con mice (Fig. 3K, S3E). In fact, we noted an abundance of myocytes with cross-sectional area 5,000–15,000 pixel2 on a scale from 0–40,000 pixel2 (Fig. 3L). ITAD feeding also increased the number of cells with centralized nuclei (Fig. 3K, 3M). Small myocytes with centralized nuclei reflect proliferating and regenerating muscle (Charge and Rudnicki, 2004). Accordingly, we noted ~30–40% increase in expression of myogenic factors Myf5, Myf6, and Myog without changes in Myod1 and Ckm expression (Fig. 3N), and ~1.6-fold increase in expression of proliferation marker Cyclin D1 (Fig. 3O) indicating active myogenesis in ITAD-fed mice.
Since aging associates with preferential loss of type IIB glycolytic fibers (Marzetti et al., 2009), we investigated the effect of ITAD feeding on type IIB fiber content. Staining for myosin heavy chain (MyHC) glycolytic type IIB and oxidative type I fibers in GA from 10mo ITAD-fed mice (analyzed at 14mo age) revealed a remarkable increase in type IIB fibers without changes in type I fiber content indicating glycolytic fiber expansion (Fig. 3P, 3Q). Since increased glycolytic fiber number associates with reduced endurance, we tested the effect of ITAD feeding on exercise capacity. During 3 days of acclimatization on a treadmill-based exercise regime (Fig. S3F, S3G) (He et al., 2012), we failed to observe significant differences in exercise capacities by both groups. During the test (Fig. 3SH), when treadmill speed was increased by 1 meter/min every min, consistent with increased type IIB fiber content, ITAD-fed mice fatigued earlier at 28 meters/min speed indicated by increased shocks required to stay on the treadmill. Nevertheless, ITAD feeding leads to retention of key attributes of skeletal muscle that are typically lost with age – mass and type IIB fiber content.
ITAD feeding suppresses hepatic gluconeogenesis
To explore the effect of ITAD feeding on glucose/lipid metabolism, we characterized circulating insulin/glucose levels, liver/serum triglycerides (TG), and expression of glucose/lipid metabolism genes in livers from Ad-lib and ITAD-fed mice across 24 hr. Surprisingly, ITAD-fed mice displayed a surge in serum insulin levels that correlated with 5–7pm feeding (Fig. 4A), after which insulin levels dropped to levels lower than those in Ad-lib mice. Increased serum insulin at 7pm in ITAD-fed mice associated with reduced blood glucose levels from 7pm–3am (Fig. 4B), suggesting that 7pm insulin release possibly increased tissue glucose uptake and/or suppressed gluconeogenesis. Supporting the latter, livers from ITAD-fed mice displayed varying degrees of reduction in expression of gluconeogenic genes G6pc, Pck1 and Fbp1 at 7pm when compared to Con (Fig. 4C, S4A, S4B). Pyruvate tolerance tests (PTT) initiated at 6pm in mice food-deprived from 10am onward and fed for 10min at 5pm (Fig. 4D) displayed reduced blood glucose levels in ITAD mice (Fig. 4E), confirming decreased gluconeogenesis. Although we cannot explain the reason for increased serum insulin at 7pm (and not after the 1st feeding window), it is likely that insulin’s ability to suppress autophagy inhibited autophagy flux at 7pm in ITAD mice (Fig. 2A, 2I).
Fig. 4. ITAD feeding and glucose and fat metabolism in liver.

(A) Serum insulin (n=8), (B) blood glucose levels (n=14), (C) gluconeogenic gene Pck1 in liver at indicated time-points (n=8), (D–E) pyruvate tolerance test (PTT) at 6pm in Ad-lib and ITAD mice fed for 10min at 5pm (n=4), (F, G) liver and serum TG (n=8), (H, I) qPCR for Pparα and Fgf21 genes in liver (n=8), (J) serum FGF21 levels (n=3), and (K–O) qPCR for indicated lipogenic genes at indicated time-points in RD-fed male mice on Ad-lib or ITAD for 10mo (n=8). (P) Summary of effects of ITAD feeding on hepatic lipid metabolism across 24 hr. Bars are mean ± SEM. (*P<0.05, **P<0.01, ***P<0.001). Student’s t test or Two-Factor ANOVA and Bonferroni correction. See also Figure S4.
Active lipophagy and reduced lipogenesis in livers from ITAD mice
Liver TG analyses revealed significantly decreased lipid levels in ITAD-fed mice (Fig. 4F), while serum TGs were only modestly lower in ITAD-fed mice on RD (Fig. 4G). Increases in autophagy flux and OCR in liver at 11am (Fig. 2A, 2H) correlated with ~3-fold increase in Pparα expression at 11am (Fig. 4H), a key driver of autophagy (Lee et al., 2014), suggesting a role for lipophagy in ITAD feeding-driven liver TG depletion (Fig. 4F). At 11am, we also noted increased expression of Pparα target Fgf21, and a trend towards increased FGF21 secretion (Fig. 4I, 4J) (Badman et al., 2007; Inagaki et al., 2007), which may have contributed to liver fat loss. Quite surprisingly, qPCR analyses for Srebp1c, the master regulator of lipogenesis, and its targets Fas, Elovl6, Acsl5, and Gpat1 indicated maximal suppression of lipogenesis in ITAD mice at 7pm (Fig. 4K–4O). Since autophagy flux and OCR were suppressed from 3pm–11pm (Fig. 2A, 2I, 2J), decreased liver TG after 7pm in ITAD-fed mice (Fig. 4F) may have resulted from suppressed lipogenesis despite the surge in serum insulin, a key driver of TG synthesis. These results suggest that induction of lipophagy (11am) and suppression of lipogenesis (7pm) act in concert to limit hepatic TG accumulation in ITAD-fed mice (Fig. 4P).
ITAD or ITAN (nocturnal) feeding have distinct benefits in young chow-fed mice
Restricted feeding uncouples peripheral clocks from light-entrained central clock (Damiola et al., 2000) suggesting that changes in peripheral clocks may contribute to the phenotype of ITAD-fed mice. In fact, analyses of oscillations of core clock genes in livers from ITAD-fed mice revealed a modest, albeit statistically insignificant, increase in expression of circadian driver Bmal1 (Fig. S4C). We also noted changes in oscillations of clock repressors Per1, Per2, and Per3 with shifts in phase in expression of Per1 and Per3 (Fig. S4C–S4H). Given the role of circadian proteins in metabolic regulation (Bass and Takahashi, 2010), it is likely that diurnal ITAD feeding and resulting changes in expression of clock genes shape the phenotype of ITAD-fed mice. To explore this possibility, we compared changes in body wt, eWAT wt, iWAT browning, and iWAT OCR in mice fed ITAD or ITAN (fed at 8–10pm and 5–7am) on RD (Fig. S5A). After 4mo, we noted no difference in body wt between both groups (Fig. S5B), although ITAN-fed mice displayed significantly increased eWAT wt (Ad-lib vs. ITAN eWAT wt/body wt; 14.0±0.9 vs. 19.2±0.8; p<0.05, T-test) while ITAD-fed mice showed reduced eWAT wt when compared to Con (Ad-lib vs. ITAD eWAT wt/body wt; 16.1±1.1 vs. 14.1±0.4; p<0.05, T-test). ITAD-fed mice also showed an increase in expression of brown fat marker Eva1 in iWAT (Fig. S5C) that associated with increased OCR (Fig. S5D). ITAN-fed mice displayed similar trends for Eva1 expression and iWAT OCR although these values did not acquire statistical significance (Fig. S5C, S5D). Strikingly, improvement in glucose clearance occurred earlier in ITAN-fed mice than ITAD-fed mice after 4mo on RD (Fig. S5E) suggesting that ITAD or ITAN feeding of young (8mo old) RD-fed mice each leads to distinct metabolic benefits.
ITAD feeding prevents age-associated metabolic defects
To determine whether ITAD feeding prevents age/obesity-associated metabolic compromise, we subjected 4mo and 18mo old mice to Ad-lib or ITAD feeding on HFD for 6mo (Fig. 5A). ITAD feeding significantly reduced body wt in 10mo (not shown) and 24mo old mice (Fig. 1H), and reduced fat mass and increased lean mass in 10mo old mice (Fig. 5B), while similar statistically insignificant trends were observed in 24mo old mice (Fig. 5B). ITAD feeding significantly decreased liver wt in young and aged mice (Fig. 5C), and reduced liver and serum TG in 10mo mice (Fig. 5D, 5E), while a trend for decreased liver TG was noted in 24mo old mice (Fig. 5D). Consistent with qNMR data (Fig. 5B), ITAD feeding significantly increased GA-sol wt in 10mo mice, while modestly increasing GA-Sol wt in 24mo old mice (Fig. 5F). ITAD feeding also reversed hypertriglyceridemia by ~50% when mice fed HFD Ad-lib for 8mo were switched to ITAD feeding for 4mo (Fig. 5G) indicating that ITAD feeding can reduce hyperlipidemia and potentially lower cardiovascular disease risk.
Fig. 5. ITAD feeding prevents age-associated metabolic defects.

(A) ITAD feeding in young and aged male mice fed HFD for 6mo. (B, C) Body composition and liver wt normalized to body wt, (D, E) liver/serum TG, and (F) GA-Soleus (Sol) wt normalized to body wt in 10mo and 24mo male mice as in (A) (n=3–4). (G) Young mice fed HFD Ad-lib for 8mo and then ITAD-fed or not for 4mo, and serum TG after 4mo of ITAD feeding (n=5). (H–K) VO2, VCO2, EE rates, and Z-axis movements in young/aged male mice fed Ad-lib on HFD or ITAD-fed on HFD for 6mo, n=3–4. (L) Liver OCR and AUC for OCR (n=3–4), (M, N) liver qPCR analyses for mitochondrial and autophagy-related genes (n=8), and (O) net LC3-II flux in liver explants cultured in presence (+) or absence (−) of Lys Inh in aged male mice (n=8). (P, Q) Glucose tolerance tests (GTT) and AUC in HFD-fed aged and young male mice on Ad-lib or ITAD feeding for 6mo (n=6). Bars are mean ± SEM. (*P<0.05, **P<0.01, ***P<0.001). Student’s t test. See also Figure S4.
Since ITAD feeding increases EE, we tested its ability to restore EE in aged mice. Indeed, ITAD feeding prevented age-associated loss of VO2, VCO2, and EE rates (Fig. 5H–5J), without changing locomotor activity (Fig. 5K). Seahorse respirometry (Fig. 5L) revealed patterns of increased liver OCR in ITAD-fed aged mice, which were supported by increases in VO2 (Fig. 5H). Prevention of age-associated loss of OCR associated with increased expression of mitochondrial genes, Cox4, Cpt2, and induction of Pgc1α in ITAD-fed aged mice (Fig. 5M). ITAD feeding also prevented age-associated reduction in expression of Atg genes and lysosomal Lamp1 (Fig. 5N), and increased LC3-II flux in aged livers at 11am (Fig. 5O). Finally, ITAD feeding improved glucose clearance in aged or obese mice subjected to GTT (Fig. 5P, 5Q), validating its effectiveness in preventing age/obesity-associated metabolic compromise.
POMCergic autophagy controls lipohomeostasis in ITAD-fed mice
Since ITAD feeding activates autophagy in liver, MBH, WAT, and muscle at 11am, we sought to map the contribution of autophagy in each tissue system to metabolic benefits of ITAD feeding. POMCergic autophagy plays crucial roles in regulation of body wt (Coupe et al., 2012; Kaushik et al., 2012; Quan et al., 2012) and fat utilization in peripheral tissues (Martinez-Lopez et al., 2016). Consequently, we asked to what extent is POMCergic autophagy required for benefits of ITAD feeding. To that end, body wt analyses revealed that while Con mice lost ~20% of their body wt after 4mo of ITAD feeding on HFD, ITAD-fed mice lacking Atg7 in POMC neurons (Atg7KOPOMC) resisted losing their body wt (Fig. 6A). Further, while ITAD-fed Con mice on HFD decreased their eWAT wt by ~40%, ITAD-fed KO mice maintained their eWAT mass (Fig. 6B). In fact, ITAD-fed KO mice failed to induce their iWAT OCR to levels observed in ITAD-fed Con (Fig. 6C) possibly due to the reported loss of WAT sympathetic tone in Atg7KOPOMC mice (Kaushik et al., 2012). ITAD-fed Atg7KOPOMC mice also resisted lowering their liver and serum TG levels when compared to ITAD-fed Con mice (Fig. 6D, 6E). To exclude that loss of Atg7 in POMC neurons from birth led to developmental defects in the hypothalamus, which in turn, reduced the benefits of ITAD feeding, we generated Atg7KOPOMC-ERT2Cre mice wherein Atg7 was deleted during adulthood via tamoxifen (Tmx)-driven expression of Cre in POMC neurons (Berglund et al., 2013). As anticipated, 6 weeks of ITAD feeding on HFD significantly decreased serum TG levels in Con and Atg7KOPOMC-ERT2Cre mice prior to administration of Tmx (i.e., Day 0) (Fig. 6F). Con and Atg7KOPOMC-ERT2Cre mice were then subjected to Tmx injections (Day 1) and serum TG levels were analyzed on Day 15. While Tmx-injected control mice maintained reduced serum TG levels, Tmx-injected Atg7KOPOMC-ERT2Cre mice lost their ability to lower their serum TG levels in response to ITAD feeding (Fig. 6F). Despite these defects in lipid metabolism in Atg7KOPOMC mice, ITAD-fed Con and Atg7KOPOMC mice each reduced their glucose production to similar levels in an i.p. PTT (Fig. S6A), and accordingly, each displayed equivalent improvements in glucose clearance when subjected to an i.p. GTT (Fig. S6B). These data show that POMCergic autophagy is required to mediate the effects of ITAD feeding on lipohomeostasis in liver and iWAT, but not glucose homeostasis.
Fig. 6. Tissue-specific autophagy contributes to distinct benefits of ITAD feeding.

(A) Body wt of HFD-fed Ad-lib and ITAD-fed Con and Atg7KOPOMC male mice for 4mo (n=5). (B) eWAT wt normalized to body wt in males (n=6), (C) iWAT OCR and AUC for OCR in male (n=3) and female (n=3) mice (total n=6), (D) liver TG in males (n=7) and females (n=5) (total n=12), and (E) serum TG in HFD-fed Con and Atg7KOPOMC male (n=3) and female mice (n=3) fed Ad-lib or ITAD for 4mo (total n=6). (F) Serum TG on day 0 and day 15 (as indicated) in control and Atg7KOPOMC-ERT2-Cre male mice fed Ad-lib or ITAD on HFD for 6 weeks and subjected to tamoxifen injections for 5 days (n=6). (G) Liver OCR and AUC from Con and Atg7KOAlb mice fed Ad-lib or ITAD on RD for 6mo, and in male mice subjected to vagotomy (Vgx) and ITAD feeding on RD for 6mo (n=3–5). (H) Liver qPCR analyses for indicated genes from RD-fed Ad-lib, and ITAD-fed Con and Atg7KOAlb male mice for 6mo (n=3). (I) IB for indicated proteins in GA, (J) TA, and (K) GTT in RD-fed Con and Atg7KOMyf5 male (n=3) and female mice (n=3) fed Ad-lib and ITAD for 6mo (total n=6). Ponceau is loading control. Bars are mean ± SEM. (*P<0.05, **P<0.01, ***P<0.001). Student’s t test or Two-Factor ANOVA and Bonferroni correction. See also Figure S6.
Roles of autophagy in hepatic lipohomeostasis in ITAD-fed mice
Because POMCergic autophagy drives hepatic lipophagy in a cell-nonautonomous manner (Martinez-Lopez et al., 2016), we investigated the role of POMCergic autophagy in hepatic lysosomal degradation of LD in ITAD mice at 11am. Consistent with increased autophagy flux and OCR at 11am (Fig. 2A, 2H), lysosomal inhibition with leupeptin i.p. (plan in Fig. S6C, left) for 2 hr in ITAD-fed Con mice led to ~3-fold increase in liver TG indicating lysosomal turnover of TG at 11am (Fig. S6C, right). By contrast, livers from ITAD-fed Atg7KOPOMC mice displayed higher basal TG levels that failed to accumulate upon lysosomal inhibition (Fig. S6C), indicating that POMCergic autophagy is required for lipophagy of liver TG in ITAD-fed mice at 11am. In fact, acutely depleting liver Atg7 by injecting Cre-expressing adenoviruses in Atg7flox/flox mice or denervating the liver via vagotomy (Vgx) to uncouple the liver from CNS each blocked ITAD feeding-driven increases in liver OCR at 11am (Fig. 6G) demonstrating that POMCergic and liver autophagy act in concert to mobilize lipid in ITAD mice.
Surprisingly, depleting Atg7 in liver suggests multiple roles of autophagy in decreasing liver TG in ITAD-fed mice. As noted earlier, ITAD feeding suppressed the expression of lipogenic genes, e.g., Fas (Fig. 4L), and increased expression of Pgc1α, Pparα, and Pparα target Fgf21 (Fig. 6H, 4I) that drive fat oxidation. Intriguingly, depleting Atg7 in liver reversed ITAD feeding-driven suppression of Fas expression, suggesting that autophagy is required to suppress de novo lipogenesis in ITAD-fed mice (Fig. 6H). Further, ATG7-depleted livers failed to induce Pgc1α and Fgf21 expression in ITAD-fed mice (Fig. 6H), supporting the notion that autophagy coordinates lipohomeostatic responses during ITAD feeding via time-restricted changes in lipophagy and lipogenesis (Fig. 4P).
Autophagy in Myf5+ progenitors is required for glycolytic IIB fiber expansion
Because Myf5+ progenitors give rise to muscle, and since ITAD feeding induced Myf5 expression and autophagy in muscle (Fig. 3N, 2G), we explored whether Myf5 progenitor cell-specific autophagy is required for muscle-specific benefits of ITAD feeding. Consistent with immunofluorescence in Fig. 3P, GA from 6mo ITAD-fed Con mice displayed an increase in type IIB MyHC protein levels, while TA revealed an increase in embryonic (e)MyHC protein levels without affecting those of MyHC IIA and MyHC I (Fig. 6I, 6J). ITAD-fed Con mice also increased their expression of glycolytic genes in GA, hexokinase 2 (Hk2), phosphofructokinase (Pfk) and pyruvate kinase (Pk) (Fig. S6D). By contrast, ITAD-fed mice lacking Atg7 in Myf5+ progenitors (Atg7KOMyf5) failed to induce MyHC type IIB and eMyHC protein levels (Fig. 6I, 6J) or induce glycolytic gene expression to levels observed in Con (Fig. S6D), demonstrating the requirement of autophagy in Myf5+ progenitors for glycolytic type IIB fiber expansion in the context of ITAD feeding. Consistent with these changes, RD-fed Atg7KOMyf5 mice remained modestly glucose intolerant despite ITAD feeding (Fig. 6K). Impaired glucose intolerance in KO mice likely occurred from muscle-intrinsic defects, and not from increased glucose production in liver, since Atg7KOMyf5 mice displayed reduced basal gluconeogenesis compared to Con in a PTT (Fig. S6E). In sum, autophagy failure in myogenic progenitors may explain for age-associated loss of type IIB fibers that is reversible in part by ITAD feeding.
Autophagy determines iWAT mass in ITAD-fed mice
Since ITAD feeding reduced fat mass, we next tested whether autophagy is required for the fat-intrinsic benefits of ITAD feeding. Loss of Atg7 in adipose tissue using the aP2-Cre line revealed eWAT browning and reduced adiposity (Singh et al., 2009b; Zhang et al., 2009); however, aP2 is expressed in several non-adipogenic tissues (Urs et al., 2006). Consequently, we used the adiponectin-Cre line (Eguchi et al., 2011) to delete Atg7 in WAT to identify the benefits of ITAD feeding that are lost in adipose-specific Atg7KO mice (Atg7KOAdipoq). Immunoblots revealed loss of ATG7 and accumulation of LC3-I in eWAT and iWAT validating loss of autophagy (Fig. S7A). Loss of Atg7 did not affect adipocyte differentiation indicated by equivalent expression of markers of differentiated fat - Pparγ, aP2, C/EBPα, C/EBPβ, FAS and PLIN1 (Fig. S7B). Under basal Ad-lib-fed condition, 5–6mo old RD-fed Atg7KOAdipoq mice showed no differences in body wt when compared to Con (25.6±0.9 vs. 28.3±0.8, P=0.09, n=6), and no differences in fat pad wt (not shown). After 4mo of ITAD feeding on HFD, while ITAD-fed Con mice reduced their body wt by ~20%, ITAD-fed Atg7KOAdipoq mice lost only ~7% of their wt (Fig. 7A). These data suggest that autophagy is required in adipose tissue (Fig. 7A) and POMC neurons (Fig. 6A) for the body wt reducing effect of ITAD feeding. Accordingly, qNMR analyses revealed that Atg7KOAdipoq mice failed to significantly lower their body fat content when subjected to 4mo of ITAD feeding (Fig. 7B). Intriguingly, while eWAT from ITAD-fed Con and Atg7KOAdipoq mice each lost ~50% of their mass (Fig. 7C), iWAT from Atg7KOAdipoq mice completely resisted losing its mass following ITAD feeding (Fig. 7D) demonstrating that autophagy is required for reduction of iWAT mass, but not eWAT mass, in response to ITAD feeding. Since ITAD feeding increases OCR in iWAT (Fig. 3G), and not eWAT (Fig. 3H), ITAD feeding-driven increase in OCR/energy expenditure is likely coupled to loss of iWAT mass.
Fig. 7. Autophagy is required for iWAT browning in ITAD-fed mice.

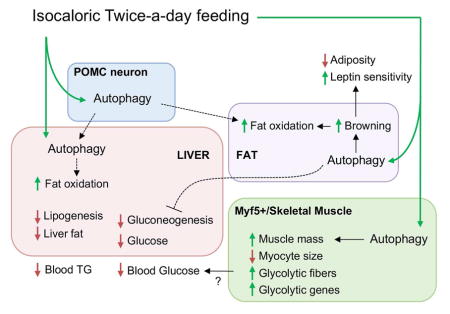
(A) Body wt, (B–D) fat mass, eWAT wt, and iWAT wt normalized to body wt in Con and Atg7KOAdipoq male (n=3) and female mice (n=3) subjected to Ad-lib or ITAD feeding on HFD for 4mo (total n=6). (E, F) qPCR for Beige genes Eva1 and Zic1 in iWAT from Con and Atg7KOAdipoq male and female mice subjected to Ad-lib or ITAD feeding on HFD for 4mo (n=6). (G–J) VO2, VCO2, EE rates, and locomotor activity in Con and Atg7KOAdipoq male and female mice subjected to Ad-lib or ITAD feeding on HFD for 4mo (n=6). (K) Serum leptin and insulin levels in Con and Atg7KOAdipoq male and female mice subjected to Ad-lib or ITAD feeding on HFD for 4mo (n=6). (L) PTT and AUC for PTT at 6pm in Ad-lib and ITAD-fed Con and Atg7KOAdipoq male and female mice fed for 10min at 5pm (n=6). (M) Proposed model for contribution of tissue-specific autophagy to metabolic benefits of ITAD feeding. Bars are mean ± SEM. (*P<0.05, **P<0.01). Two-Factor ANOVA and Bonferroni correction. See also Figure S7.
Autophagy regulates iWAT browning and glucose homeostasis in ITAD-fed mice
Given the effect of ITAD feeding on WAT browning, we investigated the role of autophagy in ITAD feeding-induced iWAT browning. Our studies revealed that ITAD feeding led to induction of UCP1 (Fig. 3C), and Eva1, Zic1, and Fbxo31 in iWAT indicating adipose browning (Fig. 3D). Notably, loss of Atg7 blocked ITAD-driven WAT browning indicated by reduced expression of Eva1 and Zic1 (Fig. 7E, 7F). Consistent with these changes, Atg7KOAdipoq mice failed to decrease their adipocyte size (Fig. S7C) or increase their VO2, VCO2, and EE rates in response to ITAD feeding (Fig. 7G–7I). Failure to increase their EE was not due to reduced locomotion since all groups displayed equivalent activity (Fig. 7J). Although ITAD feeding reduced eWAT mass (Fig. 7C) and lowered serum leptin levels to varying degrees in Con and Atg7KOAdipoq mice (Fig. 7K, left), ITAD-fed KO mice remained modestly glucose intolerant (Fig. S7D) and insulin insensitive indicated by elevated serum insulin levels (Fig. 7K, right) when compared to Con. Most surprisingly, impaired glucose clearance in ITAD-fed Atg7KOAdipoq mice occurred in part from failure to suppress gluconeogenesis when subjected to PTT (Fig. 7L) suggesting that adipose autophagy contributes to ITAD feeding-driven lipid/glucose homeostasis by modulating iWAT browning and hepatic glucose production.
Discussion
Here we show that ITAD feeding/intermeal fasting in absence of CR promotes metabolic flexibility and prevents age/obesity-associated metabolic defects. Consolidating the system-wide metabolic benefits of ITAD feeding (Fig. 7M), we have found that ITAD feeding/intermeal fasting activates autophagy in liver, adipose tissue, muscle, and MBH at 11am. LC3-II flux analyses in liver at each of the 6 time-points revealed that autophagy is modified in a time-dependent manner in ITAD-fed mice. This time-restricted change in autophagy is characterized by: (i) maximal activation at 11am is response to feeding between 8–10am and its suppression at 7pm immediately after the 2nd feeding window, and (ii) a complete shift in phase of LC3-II flux when compared to Con. Induction of autophagy at 11am led to expression of key drivers of fat utilization, Pparα, Fgf21, and Pgc1α, since acutely depleting Atg7 in liver blocked ITAD feeding-driven expression of these genes. Since PPARα signaling induces autophagy (Lee et al., 2014), it is possible that feed-forward autophagy-PPARα-lipophagy regulatory loops help maximize fat utilization during ITAD feeding. Interestingly, although autophagy flux decreased at 7pm in ITAD mice, KO of Atg7 via Cre injections reversed the suppression of lipogenesis between 3pm–11pm, indicating a role of autophagy in suppression of lipogenesis in ITAD-fed mice. However, how autophagy activity is modified in ITAD-fed mice, and how this impacts de novo lipogenesis are unknown and will remain subjects of future studies. Our data allow us to speculate that AMPK and mTOR and their opposing influences on autophagy activator protein ULK1/ATG1 could potentially reorganize autophagy in response to changes in nutrient availability; however, validation of this notion will require future studies. In sum, activation of autophagy and increased fat utilization during the 1st feeding window, and suppression of lipogenesis at 7pm act in concert to decrease liver TG in ITAD-fed mice (Fig. 4P). In accordance with findings that cold-induced lipophagy in liver is governed by functional autophagy in POMC neurons (Martinez-Lopez et al., 2016), we propose that POMCergic autophagy is required for ITAD feeding-driven fat utilization in liver and iWAT, solidifying the integrative physiology of CNS to peripheral autophagy in energy balance.
ITAD feeding led to significant brown fat-like remodeling of iWAT and an abundance of markers of anti-inflammatory M2 macrophage in eWAT. Brown fat-like remodeling of iWAT was autophagy-dependent, since iWAT from Atg7KOAdipoq mice displayed reduced browning and decreased energy expenditure rates. However, we were most surprised to find that while ITAD feeding reduced eWAT mass in both Con and Atg7KOAdipoq, Atg7KOAdipoq mice failed to decrease their iWAT mass in response to ITAD feeding. While we are unable to explain these results, it is possible that different origins or innervation patterns of distinct fat depots is the reason why autophagy is required in iWAT, and not eWAT, for the benefits of ITAD feeding.
A major benefit of ITAD feeding is improved glucose tolerance. ITAD-fed Atg7KOPOMC and Con mice each displayed similar improvements in glucose clearance, which excluded the requirement of POMCergic autophagy for glucose homeostasis in context of ITAD feeding. By contrast, ITAD-fed Atg7KOAdipoq and Atg7KOMyf5 mice each failed to completely improve glucose clearance rates indicating that autophagy is required in these tissue systems for ITAD feeding-driven control of glucose homeostasis (Fig. 7M). Since improved glucose clearance in ITAD mice associated with increased glycolytic type IIB fiber number and increased expression of glycolytic genes in GA, it is possible that ITAD feeding enhances the efficiency of skeletal muscles to take up glucose in an autophagy-dependent manner. Supporting this contention, ITAD-fed Atg7KOMyf5 mice failed to increase their glycolytic type IIB fibers or increase expression of glycolytic genes when compared to Con. ITAD feeding suppressed gluconeogenesis to similar levels in Atg7KOMyf5 and Con mice, excluding the role of hepatic gluconeogenesis in altered glucose homeostasis in Atg7KOMyf5 mice. Surprisingly, ITAD-fed Atg7KOAdipoq mice remained pyruvate intolerant indicating that adipose autophagy is required to suppress hepatic gluconeogenesis in ITAD-fed mice, although the inter-organ crosstalk linking adipose autophagy to hepatic gluconeogenesis remains unknown.
In sum, CR robustly extends healthspan; however, CR associates with muscle loss, and there may be circumstances when CR is counterproductive such as during advanced aging or sarcopenia. Furthermore, twice-a-day feeding has been shown to improve glycemia in human diabetics when compared to those fed six meals a day (Kahleova et al., 2014). Based on our diurnal feeding strategy in nocturnally active mice, we do not imply that humans should have two meals at night; rather our results suggest that distributing calories into two meals per circadian period could prevent metabolic defects. In addition, comparisons between twice-a-day feeding with three or more feeding intervals per day were not performed in this study, and future studies are necessary to determine the impact of the various meal partitioning strategies on healthspan outcome. We present a compliable feeding strategy that through time-dependent induction of autophagy may prevent age/obesity-induced metabolic decline without the need for CR or changing the type of food consumed.
STAR METHODS
Detailed methods are provided in the online version of this paper and include the following:
KEY RESOURCES TABLE
| REAGENT or RESOURCE | SOURCE | IDENTIFIER |
|---|---|---|
| Antibodies | ||
| Rabbit polyclonal anti-ATG7 | Cell Signaling Technology | CS2631; RRID: AB_2227783 |
| Rabbit polyclonal anti-LC3B | Cell Signaling Technology | CS2775; RRID: AB_915950 |
| Rabbit polyclonal anti-ATG12-ATG5 | Novus Biologicals | NB110-53818; RRID: AB_828587 |
| Mouse monoclonal anti-Beclin1 | BD Biosciences | 612112; RRID: AB_399483 |
| Mouse monoclonal anti-Myosin heavy chain (MyHC) Type IIB fiber | Developmental Studies Hybridoma Bank | BF-F3; RRID: AB_2266724 |
| Mouse monoclonal anti-Embryonic Myosin heavy chain (eMyHC) fiber | Developmental Studies Hybridoma Bank | BF-G6; RRID: AB_10571455 |
| Mouse monoclonal anti-Myosin heavy chain (MyHC) Type IIA fiber | Developmental Studies Hybridoma Bank | SC-71; RRID: AB_2147165 |
| Mouse monoclonal anti-Myosin heavy chain (MyHC) Type I fiber | Developmental Studies Hybridoma Bank | BA-D5; RRID: AB_2235587 |
| Rabbit polyclonal anti-p62 | Enzo Life Technology | BML-PW9860 RRID: AB_2196009 |
| Rabbit polyclonal anti-F4/80 | Invitrogen | PA5-32399 RRID: AB_2549869 |
| Rabbit polyclonal anti-β-actin | Abcam | ab8227 RRID: AB_2305186 |
| Mouse monoclonal anti-GAPDH | Abcam | ab8245; RRID: AB_2107448 |
| Rabbit polyclonal anti-UCP1 | Abcam | ab10983 RRID: AB_2241462 |
| Secondary HRP Antibody Rabbit anti-Mouse IgG | Invitrogen | 61-6520 RRID: AB_2533933 |
| Secondary HRP Antibody Goat anti-Rabbit IgG | KPL | 074-1506 |
| Secondary Antibody Donkey anti-Mouse Alexa-Fluo488 | Invitrogen | A21202 RRID: AB_141607 |
| Bacterial and Virus Strains | ||
| Control Adenovirus | Vector Biolabs | 1060 |
| Cre-expressing Adenovirus | Vector Biolabs | 1700 |
| Biological Samples | ||
| Chemicals, Peptides, and Recombinant Proteins | ||
| High Fat Diet (HFD- 60% of calories in fat) | Research Diet | D12492 |
| PicoLab Rodent Diet | Lab Diet | 5058 |
| Isoflurane | Henry Schein | 029405 |
| Leupeptin hemisulfate | Fisher Scientific | BP2662100 |
| Ammonium Chloride | American Bioanalytical | AB00161 |
| Trizol Reagent | Invitrogen | 15596018 |
| Superscript II Reverse Transcriptase | Invitrogen | 18064014 |
| Hematoxylin | Poly-scientific | S212 |
| Eosin | StatLab | SL98-1 |
| Digitonin | Sigma-Aldrich | D5628 |
| Carnitine | Sigma-Aldrich | C0283 |
| ATP | Sigma-Aldrich | A2383 |
| NAD | Sigma-Aldrich | N0632 |
| Co-enzyme A | Sigma-Aldrich | C3144 |
| Sodium Pyruvate | Sigma-Aldrich | P2256 |
| D-Glucose | Fisher Scientific | D16-500 |
| SODIUM PHOSPHATE, DIBASIC, ANHYDROUS | American Bioanalytical | AB02050 |
| Sodium Chloride | American Bioanalytical | AB01915 |
| Collagenase Type I | Worthington Biochemical Corporation | LS004196 |
| Penicillin/Streptomycin | Invitrogen | 15070063 |
| DMEM high glucose | Invitrogen | 11965118 |
| Fetal Calf Serum | Invitrogen | 12103C |
| Power SYBR Green PCR Master Mix | Invitrogen | 4368708 |
| RNeasy Plus Mini kit | Qiagen | 74136 |
| Pepsin | BioCare Medical | PEP959H |
| Trypsin | Gibco | 15090 |
| Bovine Serum Albumin | American Bioanalytical | AB00440 |
| Donkey Serum | Sigma-Aldrich | S30 |
| Super Picture DAB Kit | Invitrogen | 879263 |
| VECTASTAIN Elite ABC HRP Kit | Vector | PK-6100 |
| Triton X-100 | Sigma-Aldrich | X100-500ml |
| 30% Acrylamide/Bis Solution 37-5-1 | BioRad | 161-0158 |
| Sodium Pyrophosphate | Sigma-Aldrich | AB02014 |
| Pepstatin A | Sigma-Aldrich | P4265 |
| β-Glycerophosphate | Sigma-Aldrich | G9891 |
| Sodium Orthovanadate | Sigma-Aldrich | S6508 |
| PMSF | Sigma-Aldrich | 10837091001 |
| AEBSF | Fisher Scientific | BP2644500 |
| Ethylenediaminetetraacetic acid (EDTA) | American Bioanalytical | AB00500 |
| Ethylene glycol-bis(2-aminoethyl)-tetraacetic acid (EGTA) | American Bioanalytical | AB00505 |
| Super Signal West Femto Maximum Sensitivity Substrate, ECL | Pierce | 34096 |
| Critical Commercial Assays | ||
| ELISA Insulin Kit | ALPCO | 80-INSHU-E01.1 |
| ELISA FGF21 mouse/rat | R&D System | MF2100 |
| ELISA Leptin Kit | SPI Bio | A05176 |
| TG assay kit | Sigma-Aldrich | TR0100 |
| Deposited Data | ||
| N/A | ||
| Experimental Models: Cell Lines | ||
| N/A | ||
| Experimental Models: Organisms/Strains | ||
| Mouse: C57BL/6 wildtype | The Jackson Laboratory | JAX: 000664 |
| Mouse POMC-Cre: (B6.FVB-Tg(Pomc-cre)1Lowl/J | The Jackson Laboratory | JAX: 010714 |
| Mouse POMC-ERT2-Cre | Berglund et al., (2013), J Clin Invest 123, 5061–5070. | N/A |
| Mouse Myf5-Cre: B6.129S4-Myf5tm3(cre)Sor/J | The Jackson Laboratory | JAX: 007893 |
| Mouse Adiponectin-Cre: B6;FVB-Tg(Adipoq- cre)1Evdr/J | The Jackson Laboratory | JAX: 010803 |
| Mouse Atg7flox/flox | Komatsu et al., (2006), Nature 441, 880–884. | N/A |
| Mouse: C57BL/6 Young/Old | NIH NIA | N/A |
| Oligonucleotides | ||
| RT-PCR primers Please see Table S1 | Sigma-Aldrich | N/A |
| Recombinant DNA | ||
| N/A | ||
| Software and Algorithms | ||
| ImageJ | NIH | https://imagej.nih.gov/ij/index.html; RRID: SCR_003070 |
| Prism | Graph Pad | https://www.graphpad.com/scientificsoftware/prism/; RRID: SCR_002798 |
| Other | ||
| Nikon Light Microscope | Nikon | N/A |
| Axiovert 200 Fluorescence microscope | Carl Zeiss | N/A |
| Seahorse Bioscience XF24-3 Extracellular Flux Analyzer | Seahorse Bioscience (Agilent technologies) | N/A |
| XF24-3 Flux Pak | Seahorse Bioscience (Agilent technologies) | 102070-001 |
| XF24 Islet Capture Microplates | Seahorse Bioscience (Agilent technologies) | 101122-100 |
| StepOne Plus Real-Time PCR System | Thermo Fisher Scientific | 4376600 |
| Cryostat | Leica Biosystems | CM3050S |
| ECHO magnetic resonance spectroscopy | Echo Medical Systems | N/A |
| CLAMS open-circuit indirect calorimetry | Columbus Instruments | N/A |
| Ascensia Contour Glucometer | Bayer | 7151H |
| Ascensia Contour strips | Bayer | 7080G |
| Chemoluminescence Imaging System | Syngene | GeneGnome 5 |
| Cautery Unit | Geiger Medical | N/A |
CONTACT FOR REAGENT AND RESOURCE SHARING
Further information and requests for resources and reagents should be directed to the Lead Contact, Rajat Singh (rajat.singh@einstein.yu.edu)
EXPERIMENTAL MODEL AND SUBJECT DETAILS
Animals
Tissue-specific Atg7 KO mice were generated by crossing Atg7flox/flox mice (Komatsu et al., 2006) (Drs. M. Komatsu and K. Tanaka, Tokyo Metropolitan Institute of Medical Science, Japan) with POMC-Cre mice (B6.FVB-Tg(Pomc-cre)1Lowl/J; Stock No: 010714; The Jackson Laboratory, Bar Harbor, ME, USA), Myf5-Cre (B6.129S4-Myf5tm3(cre)Sor/J; Stock No: 007893; The Jackson Laboratory), Adiponectin-Cre (B6;FVB-Tg(Adipoq-cre)1Evdr/J; stock number 010803; The Jackson Laboratory) or POMC-ERT2-Cre mouse (Berglund et al., 2013) (Dr. Joel Elmquist, UT Southwestern Medical Center, Dallas, USA) respectively. Studies were performed in male and female littermates on the C57BL/6J background using a protocol approved by the Institutional Animal Care and Use Committee. All experiments were carried out in group-housed mice. Mice aged between 3mo and 24mo were utilized for the studies. Since no sex-specific differences were observed with regard to the benefits of ITAD feeding on body weight and body fat content, male and female mice were pooled together in a subset of experiments. The distribution of male and female mice in each of these experiments is indicated in the Figure legends. Due to the longitudinal nature of the studies in diverse tissue-specific knockout mice, in-depth analyses of the sex-specific differences on the effects of ITAD feeding were not carried out. Tissues were collected at specific time-points as indicated in Figure legends. The duration of ITAD feeding for each experiment are indicated in Figure legends. Mice were fed a regular chow (5058; Lab Diet, St Louis, MO, USA) or high fat diet (60% kcal in fat; D12492; Research Diets, New Brunswick, NJ, USA). The following inclusion/exclusion criteria were used for the studies. Rodents were excluded and euthanized: (i) if core body temperature dropped below 25°C during the cold exposure studies, and (ii) if they failed to return to normal activity within 12 hr of surgery. Conventional genotyping was carried out to exclude mice heterozygous for Atg7 deficiency.
Housing
Mice were maintained at 22–23°C on 12 hr light/dark cycles in the institutional barrier facility along with sentinel cages and are specific pathogen-free. Mice in sentinel cages are routinely tested for specific pathogens, and health reports are evaluated at regular intervals to determine whether rodents are pathogen-free or whether a specific treatment is required.
Isocaloric twice-a-day feeding (ITAD)/intermeal fasting
ITAD mice were fed the same amount of food as ad libitum (Ad-lib) mice but only in two 2 hr windows each day (8–10am and 5–7pm). The amount of food consumed in the two 2 hr windows by ITAD mice was identical to the food consumed by the Ad-lib group in the preceding 24 hr. Both cohorts were group housed. The ITAD test group and its Ad-lib control (Con) contained the same number of age and sex-matched littermate male or female mice. Food pellets were weighed each day in the barrier facility and broken into smaller pieces and distributed across each cage. Residual food pellets, if present, were carefully collected and weighed at the end of the 2 hr feeding period. The cages of both Ad-lib and ITAD groups were changed each day to exclude the accumulation of food particles from the preceding day. In studies involving Ad-lib fed control (Con) and tissue-specific Atg7KO mice, both Ad-lib fed groups (Con and KO Ad-lib groups) were pair-fed the same amount of food.
METHOD DETAILS
Autophagy flux assay
Autophagy/LC3-II flux was performed in freshly isolated tissues at the time-points indicated in Figure legends. Freshly collected tissue explants were incubated in dishes with high-glucose DMEM in presence or absence of lysosomal inhibitors (Lys Inh), leupeptin (200 μM) and ammonium chloride (20 mM) at 37°C, 5% CO2 for 2 hr. For muscle flux assays, tissue explants were incubated in oxygenated CO2-independent DMEM in presence or absence of Lys Inh, leupeptin (100 μM) and ammonium chloride (40 mM) at 37°C for 1 hr. Tissue explants were homogenized in a buffer containing protease and phosphatase inhibitors and immunoblotted for LC3 or p62. Autophagy flux was calculated by subtracting the densitometry values of LC3-II or p62 in Lys Inh-untreated from Lys Inh-treated samples (Martinez-Lopez et al., 2016).
RNA isolation and qPCR analyses
Total RNA was isolated using the Trizol Reagent (Invitrogen). The aqueous phase containing the RNA was loaded onto a gDNA Eliminator Spin Column (Qiagen, USA) for elimination of genomic DNA, and RNA was isolated using the RNeasy Plus kit (Qiagen) according to manufacturer’s instructions. Total RNA (1 μg) was reverse transcribed into cDNA using Superscript II (Invitrogen), and quantitative RT-PCR analyses was performed using the Power SYBR® Green PCR Master Mix (Applied Biosystems, UK) on a StepOne Plus Real-Time PCR System (Applied Biosystems, UK). For each gene, values were normalized to the expression of the housekeeping gene TATA-binding protein (TBP). The mRNA expression in control samples was considered as 1 and mRNA expression in experimental samples was represented as fold-change compared to expression in controls. Comparisons were only made for expression levels between the same gene in control or KO samples. All reactions were performed in triplicate. Values were expressed in arbitrary units (a.u).
Histological analyses
The Histology and Comparative Pathology Core at the Albert Einstein College of Medicine performed the histological analyses. Paraffin-embedded sections (5 μm thick) of formalin-fixed adipose tissues and frozen sections from gastrocnemius (GA) muscle were subjected to Hematoxylin and Eosin (H/E). Sections were analyzed under a Nikon light microscope at the indicated magnification and quantified with ImageJ software (NIH, USA). Adipocyte and myocyte areas in H&E-stained sections were measured using Image J software (NIH, USA). All histological analyses were performed by individuals blinded to the treatments.
Immunohistochemistry
Adipose tissue paraffin sections were dewaxed, rehydrated, and heated in an antigen retrieval buffer (Pepsin for F4/80 staining, and Trypsin for UCP1 staining) and incubated with 0.3% H2O2. Nonspecific binding sites were blocked with 2% BSA + 5% Donkey serum. For immunodetection, sections were incubated for 1 hr at room temperature with either F4/80 or UCP1 antibody, and the specific staining was detected using either SuperPicture™ DAB Kit (Invitrogen) for UCP1 or VECTASTAIN Elite ABC HRP Kit (Vector) for F4/80. Sections were counterstained and visualized with Nikon light microscope as described above. Frozen gastrocnemius sections (10 μm thick) were blocked in M.O.M. for 1 hour and stained with the following monoclonal antibodies: BA-D5 that recognizes type 1 MyHC isoform and BF-F3 for type 2B MyHC isoform (Hybridoma Bank) and a specific Alexa-Fluo488 secondary antibody. Images were acquired with an Axiovert 200 fluorescence microscope (Carl Zeiss, Germany).
Metabolic profiling
An ECHO (Echo Medical Systems) magnetic resonance spectroscopy instrument was used for body composition determination. Energy expenditure assessments were determined as described previously (Martinez-Lopez et al., 2013). Both Ad-lib and ITAD-fed groups were maintained on Ad-lib feeding for 3 days of acclimatization at 22–23°C followed by 5–7 days of assessments of VO2 (oxygen consumption), VCO2 (carbon dioxide production), EE (energy expenditure), and locomotor activity in CLAMS/metabolic cages (Columbus Instruments, USA) open-circuit indirect calorimetry.
Tissue Respirometry
Tissue bioenergetics was determined using a Seahorse respirometer (Martinez-Lopez et al., 2016). Briefly, BAT and liver were collected rapidly after sacrifice, and rinsed with Krebs-Henseleit buffer (KHB) (111 mM NaCl, 4.7 mM KCl, 2 mM MgSO4, 1.2 mM Na2HPO4, 0.5 mM carnitine, 2.5 mM glucose and 10 mM sodium pyruvate). Tissues were cut into small pieces (6–10mg) and quickly transferred to individual wells of a XF24 plate. Individual pieces were stabilized from excessive movement by islet capture screens (Seahorse Bioscience), and 450 μL KHB was added to each well. Digitonin was added to enhance plasma membrane permeability. Basal oxygen consumption rates (OCR) were determined at 37°C according to the following plan: Basal readings recorded every 2min for 10 readings, followed by exposure to digitonin. Subsequent readings were recorded after 2min mixing and 2min rest. Basal OCR values were normalized to individual tissue weights.
Vagotomy
Hepatic vagotomy (Vgx) was performed as described (Iqbal et al., 2010). Briefly, mice were anesthetized and laparotomy was performed. The stomach was exposed and the hepatic vagus nerve was identified after carefully displacing the liver. Using a cautery unit (Geiger Medical, Iowa, USA), the hepatic vagus nerve was selectively cauterized, and the abdominal cavities of the mice were then closed. Mice that were subjected to sham surgery served as controls (Con).
Adenoviral Cre expression
Deletion of Atg7 in liver was accomplished by tail vein injections of 109 PFU of adenoviruses expressing Cre recombinase (Vector Biolabs, Malvern, PA, USA) and mice were humanely killed 7 days after injections. Knockdown of Atg7 in liver was determined by immunoblotting for ATG7 and LC3.
Stromal vascular fraction isolation
Minced adipose tissue samples were treated with 1 mg/mL Collagenase Type I (Worthington Biochemical Corporation) in Krebs-Ringer Buffer + 10% FCS + 1% Penicillin/Streptomycin + 2% BSA, and incubated at 37°C for 60 min. Dispersed cells w ere centrifuged at 500 g for 5 min. The precipitated cells from stromal vascular fractions were centrifuged at 500 g for 5 min and resuspended in DMEM supplemented with 10% FCS and 1% Penicillin/Streptomycin twice. Total mRNA was extracted from pelleted fractions as described above.
Glucose tolerance test (GTT)
Overnight fasted mice were administered 2 g/Kg D-glucose by intraperitoneal (i.p.) injection and blood glucose levels were measured before the injection and at indicated time-points post-injection using an Ascensia Contour glucometer (Bayer).
Pyruvate tolerance test (PTT)
PTT was performed as displayed in plan in Fig. 4D. Mice fasted after 10am were refed for 10min at 5pm. At 6pm, 1.5 g/kg body wt of pyruvate was administrated by i.p. injection. Blood glucose levels were measured immediately prior to injection and at indicated time-points post-injection using an Ascensia Contour glucometer.
Biochemical analyses
Serum Insulin (ALPCO, NH, USA), leptin (SPI Bio Montigny le Bretonneux, France), and FGF21 (R&D Systems, MN, USA) levels, and serum and liver triglyceride content (Sigma Aldrich, USA) were assessed using commercial kits according to manufacturer’s instructions.
Western Blotting
Total protein from tissues was isolated in buffer containing 20 mM Tris, pH 7.5, 1% Triton X-100, 1 mM EDTA, 1 mM EGTA, and protease/phosphatase inhibitors. Total protein from adipose tissue was isolated by homogenization in RIPA buffer containing 50 mM Tris, 150 mM NaCl, 1% NP-40, 0.5% sodium deoxycholate, 0.1% SDS, 0.1 mM EDTA, 0.1 mM EGTA, and protease/phosphatase inhibitors. Lysates were centrifuged and supernatants were subjected to immunoblotting by denaturing 20–50 μg of protein at 100°C for 5 min in Laemmli sample b uffer containing 62.5 mM Tris, 2% SDS, 25% glycerol, 0.01% bromophenol blue, and 5% β-mercaptoethanol. Samples were resolved on SDS-PAGE and transferred to nitrocellulose membranes (GE Healthcare, USA) in transfer buffer containing 25 mM Tris, 192 mM glycine, 0.01% SDS, and 15% methanol using a Bio-Rad semidry transfer cell at 150 mA for 90 minutes. Membranes were blocked in 5% nonfat dry milk, 20 mM Tris, 500 mM sodium chloride, and 0.5% Tween-20 for 1 hr and probed with primary antibodies.
QUANTIFICATION AND STATISTICAL ANALYSIS
NIH ImageJ software (Bethesda, MD, USA) was used to quantify myocyte and adipocyte size in tissues from Ad-lib and ITAD-fed mice in a blinded manner. Statistical analyses were carried out by GraphPad Prism 6 Software (GraphPad Software; La Jolla, CA, USA). Statistical details for each experiment including n value and the number of male and female mice per experiment are provided in the Figure legend. We performed the Shapiro-Wilk test to determine the normal distribution of the variables being tested. All data are mean ± s.e.m., and from a minimum of three independent experiments unless otherwise stated. Statistical significance was compared by two-tailed unpaired Student’s t-test when two groups were compared, or One or Two-Factor ANOVA followed by Bonferroni multiple comparison test when multiple comparisons were made. *P<0.05, **P<0.01, ***P<0.001.
Supplementary Material
Highlights.
Isocaloric twice-a-day (ITAD) feeding impacts autophagy in multiple tissues
ITAD feeding promotes diverse metabolic benefits in multiple tissue systems
ITAD feeding prevents age- and obesity-associated metabolic defects
Tissue-specific autophagy contributes to distinct benefits of ITAD feeding
Acknowledgments
We thank Drs. M. Komatsu and K. Tanaka (Tokyo Metropolitan Institute of Medical Science, Japan) for Atg7flox/flox mice, Dr. J. Elmquist (UT Southwestern Medical Center, USA) for POMC-ERT2-Cre mice, and Dr. F. Villarroya (University of Barcelona) for helpful suggestions. This work was supported by R01 AG043517 (RS), P30 DK020541 (Einstein Diabetes Research Center), and P01 AG031782 (RS). AB-G is supported by T32 AG023475. MT is supported by American Diabetes Association Grant 1-17-PMF-011.
Footnotes
Author information NML and ET performed the experiments and analyzed data. SS, MT, MGM, and AB-G assisted with in vivo experiments. GJS, NB, JEP, and SK provided intellectual input. RS conceived the idea, designed the experiments, interpreted data, and wrote the manuscript. All authors commented on the manuscript.
Financial Disclosure: None of the authors in this manuscript have a financial interest related to this work.
Publisher's Disclaimer: This is a PDF file of an unedited manuscript that has been accepted for publication. As a service to our customers we are providing this early version of the manuscript. The manuscript will undergo copyediting, typesetting, and review of the resulting proof before it is published in its final citable form. Please note that during the production process errors may be discovered which could affect the content, and all legal disclaimers that apply to the journal pertain.
References
- Anson RM, Guo Z, de Cabo R, Iyun T, Rios M, Hagepanos A, Ingram DK, Lane MA, Mattson MP. Intermittent fasting dissociates beneficial effects of dietary restriction on glucose metabolism and neuronal resistance to injury from calorie intake. Proceedings of the National Academy of Sciences of the United States of America. 2003;100:6216–6220. doi: 10.1073/pnas.1035720100. [DOI] [PMC free article] [PubMed] [Google Scholar]
- Badman MK, Pissios P, Kennedy AR, Koukos G, Flier JS, Maratos-Flier E. Hepatic fibroblast growth factor 21 is regulated by PPARalpha and is a key mediator of hepatic lipid metabolism in ketotic states. Cell metabolism. 2007;5:426–437. doi: 10.1016/j.cmet.2007.05.002. [DOI] [PubMed] [Google Scholar]
- Bass J, Takahashi JS. Circadian integration of metabolism and energetics. Science. 2010;330:1349–1354. doi: 10.1126/science.1195027. [DOI] [PMC free article] [PubMed] [Google Scholar]
- Berglund ED, Liu C, Sohn JW, Liu T, Kim MH, Lee CE, Vianna CR, Williams KW, Xu Y, Elmquist JK. Serotonin 2C receptors in pro-opiomelanocortin neurons regulate energy and glucose homeostasis. J Clin Invest. 2013;123:5061–5070. doi: 10.1172/JCI70338. [DOI] [PMC free article] [PubMed] [Google Scholar]
- Berry R, Rodeheffer MS. Characterization of the adipocyte cellular lineage in vivo. Nature cell biology. 2013;15:302–308. doi: 10.1038/ncb2696. [DOI] [PMC free article] [PubMed] [Google Scholar]
- Bouhlel MA, Derudas B, Rigamonti E, Dievart R, Brozek J, Haulon S, Zawadzki C, Jude B, Torpier G, Marx N, et al. PPARgamma activation primes human monocytes into alternative M2 macrophages with anti-inflammatory properties. Cell Metab. 2007;6:137–143. doi: 10.1016/j.cmet.2007.06.010. [DOI] [PubMed] [Google Scholar]
- Brandhorst S, Choi IY, Wei M, Cheng CW, Sedrakyan S, Navarrete G, Dubeau L, Yap LP, Park R, Vinciguerra M, et al. A Periodic Diet that Mimics Fasting Promotes Multi-System Regeneration, Enhanced Cognitive Performance, and Healthspan. Cell metabolism. 2015;22:86–99. doi: 10.1016/j.cmet.2015.05.012. [DOI] [PMC free article] [PubMed] [Google Scholar]
- Chaix A, Zarrinpar A, Miu P, Panda S. Time-restricted feeding is a preventative and therapeutic intervention against diverse nutritional challenges. Cell metabolism. 2014;20:991–1005. doi: 10.1016/j.cmet.2014.11.001. [DOI] [PMC free article] [PubMed] [Google Scholar]
- Charge SB, Rudnicki MA. Cellular and molecular regulation of muscle regeneration. Physiological reviews. 2004;84:209–238. doi: 10.1152/physrev.00019.2003. [DOI] [PubMed] [Google Scholar]
- Colman RJ, Anderson RM, Johnson SC, Kastman EK, Kosmatka KJ, Beasley TM, Allison DB, Cruzen C, Simmons HA, Kemnitz JW, et al. Caloric restriction delays disease onset and mortality in rhesus monkeys. Science. 2009;325:201–204. doi: 10.1126/science.1173635. [DOI] [PMC free article] [PubMed] [Google Scholar]
- Coupe B, Ishii Y, Dietrich MO, Komatsu M, Horvath TL, Bouret SG. Loss of autophagy in pro-opiomelanocortin neurons perturbs axon growth and causes metabolic dysregulation. Cell metabolism. 2012;15:247–255. doi: 10.1016/j.cmet.2011.12.016. [DOI] [PMC free article] [PubMed] [Google Scholar]
- Dalle Pezze P, Ruf S, Sonntag AG, Langelaar-Makkinje M, Hall P, Heberle AM, Razquin Navas P, van Eunen K, Tolle RC, Schwarz JJ, et al. A systems study reveals concurrent activation of AMPK and mTOR by amino acids. Nat Commun. 2016;7:13254. doi: 10.1038/ncomms13254. [DOI] [PMC free article] [PubMed] [Google Scholar]
- Damiola F, Le Minh N, Preitner N, Kornmann B, Fleury-Olela F, Schibler U. Restricted feeding uncouples circadian oscillators in peripheral tissues from the central pacemaker in the suprachiasmatic nucleus. Genes & development. 2000;14:2950–2961. doi: 10.1101/gad.183500. [DOI] [PMC free article] [PubMed] [Google Scholar]
- Egan DF, Shackelford DB, Mihaylova MM, Gelino S, Kohnz RA, Mair W, Vasquez DS, Joshi A, Gwinn DM, Taylor R, et al. Phosphorylation of ULK1 (hATG1) by AMP-activated protein kinase connects energy sensing to mitophagy. Science. 2011;331:456–461. doi: 10.1126/science.1196371. [DOI] [PMC free article] [PubMed] [Google Scholar]
- Eguchi J, Wang X, Yu S, Kershaw EE, Chiu PC, Dushay J, Estall JL, Klein U, Maratos-Flier E, Rosen ED. Transcriptional control of adipose lipid handling by IRF4. Cell metabolism. 2011;13:249–259. doi: 10.1016/j.cmet.2011.02.005. [DOI] [PMC free article] [PubMed] [Google Scholar]
- He C, Bassik MC, Moresi V, Sun K, Wei Y, Zou Z, An Z, Loh J, Fisher J, Sun Q, et al. Exercise-induced BCL2-regulated autophagy is required for muscle glucose homeostasis. Nature. 2012;481:511–515. doi: 10.1038/nature10758. [DOI] [PMC free article] [PubMed] [Google Scholar]
- Heilbronn LK, Smith SR, Martin CK, Anton SD, Ravussin E. Alternate-day fasting in nonobese subjects: effects on body weight, body composition, and energy metabolism. The American journal of clinical nutrition. 2005;81:69–73. doi: 10.1093/ajcn/81.1.69. [DOI] [PubMed] [Google Scholar]
- Inagaki T, Dutchak P, Zhao G, Ding X, Gautron L, Parameswara V, Li Y, Goetz R, Mohammadi M, Esser V, et al. Endocrine regulation of the fasting response by PPARalpha-mediated induction of fibroblast growth factor 21. Cell metabolism. 2007;5:415–425. doi: 10.1016/j.cmet.2007.05.003. [DOI] [PubMed] [Google Scholar]
- Iqbal J, Li X, Chang BH, Chan L, Schwartz GJ, Chua SC, Jr, Hussain MM. An intrinsic gut leptin-melanocortin pathway modulates intestinal microsomal triglyceride transfer protein and lipid absorption. J Lipid Res. 2010;51:1929–1942. doi: 10.1194/jlr.M005744. [DOI] [PMC free article] [PubMed] [Google Scholar]
- Kahleova H, Belinova L, Malinska H, Oliyarnyk O, Trnovska J, Skop V, Kazdova L, Dezortova M, Hajek M, Tura A, et al. Eating two larger meals a day (breakfast and lunch) is more effective than six smaller meals in a reduced-energy regimen for patients with type 2 diabetes: a randomised crossover study. Diabetologia. 2014;57:1552–1560. doi: 10.1007/s00125-014-3253-5. [DOI] [PMC free article] [PubMed] [Google Scholar]
- Karsli-Uzunbas G, Guo JY, Price S, Teng X, Laddha SV, Khor S, Kalaany NY, Jacks T, Chan CS, Rabinowitz JD, et al. Autophagy is required for glucose homeostasis and lung tumor maintenance. Cancer Discov. 2014;4:914–927. doi: 10.1158/2159-8290.CD-14-0363. [DOI] [PMC free article] [PubMed] [Google Scholar]
- Kaushik S, Arias E, Kwon H, Lopez NM, Athonvarangkul D, Sahu S, Schwartz GJ, Pessin JE, Singh R. Loss of autophagy in hypothalamic POMC neurons impairs lipolysis. EMBO Rep. 2012;13:258–265. doi: 10.1038/embor.2011.260. [DOI] [PMC free article] [PubMed] [Google Scholar]
- Komatsu M, Waguri S, Chiba T, Murata S, Iwata J, Tanida I, Ueno T, Koike M, Uchiyama Y, Kominami E, et al. Loss of autophagy in the central nervous system causes neurodegeneration in mice. Nature. 2006;441:880–884. doi: 10.1038/nature04723. [DOI] [PubMed] [Google Scholar]
- Lamia KA, Sachdeva UM, DiTacchio L, Williams EC, Alvarez JG, Egan DF, Vasquez DS, Juguilon H, Panda S, Shaw RJ, et al. AMPK regulates the circadian clock by cryptochrome phosphorylation and degradation. Science. 2009;326:437–440. doi: 10.1126/science.1172156. [DOI] [PMC free article] [PubMed] [Google Scholar]
- Lee JM, Wagner M, Xiao R, Kim KH, Feng D, Lazar MA, Moore DD. Nutrient-sensing nuclear receptors coordinate autophagy. Nature. 2014;516:112–115. doi: 10.1038/nature13961. [DOI] [PMC free article] [PubMed] [Google Scholar]
- Martinez-Lopez N, Athonvarangkul D, Sahu S, Coletto L, Zong H, Bastie CC, Pessin JE, Schwartz GJ, Singh R. Autophagy in Myf5+ progenitors regulates energy and glucose homeostasis through control of brown fat and skeletal muscle development. EMBO Rep. 2013;14:795–803. doi: 10.1038/embor.2013.111. [DOI] [PMC free article] [PubMed] [Google Scholar]
- Martinez-Lopez N, Garcia-Macia M, Sahu S, Athonvarangkul D, Liebling E, Merlo P, Cecconi F, Schwartz GJ, Singh R. Autophagy in the CNS and Periphery Coordinate Lipophagy and Lipolysis in the Brown Adipose Tissue and Liver. Cell Metab. 2016;23:113–127. doi: 10.1016/j.cmet.2015.10.008. [DOI] [PMC free article] [PubMed] [Google Scholar]
- Marzetti E, Lees HA, Wohlgemuth SE, Leeuwenburgh C. Sarcopenia of aging: underlying cellular mechanisms and protection by calorie restriction. BioFactors. 2009;35:28–35. doi: 10.1002/biof.5. [DOI] [PMC free article] [PubMed] [Google Scholar]
- Masiero E, Agatea L, Mammucari C, Blaauw B, Loro E, Komatsu M, Metzger D, Reggiani C, Schiaffino S, Sandri M. Autophagy is required to maintain muscle mass. Cell metabolism. 2009;10:507–515. doi: 10.1016/j.cmet.2009.10.008. [DOI] [PubMed] [Google Scholar]
- Mattison JA, Roth GS, Beasley TM, Tilmont EM, Handy AM, Herbert RL, Longo DL, Allison DB, Young JE, Bryant M, et al. Impact of caloric restriction on health and survival in rhesus monkeys from the NIA study. Nature. 2012;489:318–321. doi: 10.1038/nature11432. [DOI] [PMC free article] [PubMed] [Google Scholar]
- Moreira EA, Most M, Howard J, Ravussin E. Dietary adherence to long-term controlled feeding in a calorie-restriction study in overweight men and women. Nutrition in clinical practice: official publication of the American Society for Parenteral and Enteral Nutrition. 2011;26:309–315. doi: 10.1177/0884533611405992. [DOI] [PMC free article] [PubMed] [Google Scholar]
- Narita M, Young AR, Arakawa S, Samarajiwa SA, Nakashima T, Yoshida S, Hong S, Berry LS, Reichelt S, Ferreira M, et al. Spatial coupling of mTOR and autophagy augments secretory phenotypes. Science. 2011;332:966–970. doi: 10.1126/science.1205407. [DOI] [PMC free article] [PubMed] [Google Scholar]
- Quan W, Kim HK, Moon EY, Kim SS, Choi CS, Komatsu M, Jeong YT, Lee MK, Kim KW, Kim MS, et al. Role of hypothalamic proopiomelanocortin neuron autophagy in the control of appetite and leptin response. Endocrinology. 2012;153:1817–1826. doi: 10.1210/en.2011-1882. [DOI] [PubMed] [Google Scholar]
- Rajakumari S, Wu J, Ishibashi J, Lim HW, Giang AH, Won KJ, Reed RR, Seale P. EBF2 determines and maintains brown adipocyte identity. Cell metabolism. 2013;17:562–574. doi: 10.1016/j.cmet.2013.01.015. [DOI] [PMC free article] [PubMed] [Google Scholar]
- Rubinsztein DC, Marino G, Kroemer G. Autophagy and aging. Cell. 2011;146:682–695. doi: 10.1016/j.cell.2011.07.030. [DOI] [PubMed] [Google Scholar]
- Singh R, Kaushik S, Wang Y, Xiang Y, Novak I, Komatsu M, Tanaka K, Cuervo AM, Czaja MJ. Autophagy regulates lipid metabolism. Nature. 2009a;458:1131–1135. doi: 10.1038/nature07976. [DOI] [PMC free article] [PubMed] [Google Scholar]
- Singh R, Xiang Y, Wang Y, Baikati K, Cuervo AM, Luu YK, Tang Y, Pessin JE, Schwartz GJ, Czaja MJ. Autophagy regulates adipose mass and differentiation in mice. J Clin Invest. 2009b;119:3329–3339. doi: 10.1172/JCI39228. [DOI] [PMC free article] [PubMed] [Google Scholar]
- Urs S, Harrington A, Liaw L, Small D. Selective expression of an aP2/Fatty Acid Binding Protein 4-Cre transgene in non-adipogenic tissues during embryonic development. Transgenic research. 2006;15:647–653. doi: 10.1007/s11248-006-9000-z. [DOI] [PubMed] [Google Scholar]
- Varady KA, Bhutani S, Church EC, Klempel MC. Short-term modified alternate-day fasting: a novel dietary strategy for weight loss and cardioprotection in obese adults. The American journal of clinical nutrition. 2009;90:1138–1143. doi: 10.3945/ajcn.2009.28380. [DOI] [PubMed] [Google Scholar]
- Wu J, Bostrom P, Sparks LM, Ye L, Choi JH, Giang AH, Khandekar M, Virtanen KA, Nuutila P, Schaart G, et al. Beige adipocytes are a distinct type of thermogenic fat cell in mouse and human. Cell. 2012;150:366–376. doi: 10.1016/j.cell.2012.05.016. [DOI] [PMC free article] [PubMed] [Google Scholar]
- Zhang Y, Goldman S, Baerga R, Zhao Y, Komatsu M, Jin S. Adipose-specific deletion of autophagy-related gene 7 (atg7) in mice reveals a role in adipogenesis. Proceedings of the National Academy of Sciences of the United States of America. 2009;106:19860–19865. doi: 10.1073/pnas.0906048106. [DOI] [PMC free article] [PubMed] [Google Scholar]
Associated Data
This section collects any data citations, data availability statements, or supplementary materials included in this article.