

Abstract
Areas around Light Rail Transit (LRT) stations offer ideal conditions for Transit-Oriented Development (TOD). Relatively dense, mixed-use neighborhoods can have positive impacts on mobility, health, and perceptions of neighborhood safety among nearby residents, primarily through walking activity for both transit and other purposes. To examine how station areas may attract new activity, this study analyzed changes in walking around station areas among people living close to an LRT station before and after the opening of a new transit system.
This study examined walking behavior among the subset of 214 participants living within one mile of one of 13 LRT stations from among a sample of residents living close or further away from a new LRT line in Seattle. They completed a survey and a travel log and wore an accelerometer and a GPS for 7 days both before (2008) and after the opening of the Seattle area LRT (2010). Walking bouts were derived using a previously developed algorithm. The main outcome was the individual-level change in the proportion of daily walking within one quarter Euclidean mile of an LRT station.
Overall walking decreased from before to after the LRT opening while station area walking did not change significantly, indicating a shift in walking activity to the station areas after the introduction of LRT. Increases in the proportion of station area walking were negatively related to participants’ distance between home and the nearest LRT station, peaking at <0.25 mile and decaying beyond >0.75 mile. Male gender, college education, normal weight status, less access to cars, and frequent LRT use were also significantly associated with greater positive changes in the proportion of station area walking.
The shift in walking to station areas after the completion of light rail provides evidence that the local proximate population is attracted to station areas, which may potentially benefit both transit use and TOD area economic activity. The residential catchment area for the shift in LRT area walking was < 0.75 mile of the LRT stations.
Keywords: Transit Oriented Development (TOD), behavior change, Global Positioning Systems, geographic information systems
1. INTRODUCTION
Fixed LRT lines have the potential to create urban corridors where each station area becomes one in a series of activity nodes where walking and transit are the most convenient modes of travel. Planners have long proposed clustering residents and workplaces around these nodes in Transit-Oriented Developments (TODs), which are characterized by relatively dense, mixed-use, and pedestrian friendly neighborhoods served by transit (1; 2). TODs along LRT corridors can have a considerable impact on ridership and mobility through enhanced pedestrian accessibility to stations. TOD stations are known to generate more transit and walk trips than stations in lower-density, automobile-oriented areas. A California study found that at TOD rail stations, the share of walking as the transit access mode from home was as high as 87.8%; from workplace to rail station, the share of walking was 74.2%. Furthermore, every additional 100 employees per acre working near a station increased rail ridership by 2.2% (3). With more transit trips and more of those transit trips beginning and ending with a walk trip rather than a car trip, TODs are characterized by a high level of pedestrian activity. TOD walking has several economic, health, and social benefits. A longitudinal study of residents in an existing neighborhood before and after a LRT station was installed found that the 26% of participants who started using transit after the station opened experienced a reduction in car trips (4). Cross-sectional studies found that transit-related walking alone is responsible for higher levels of walking among transit users compared to those who do not use transit (5) and that LRT ridership is associated with greater bouts of moderate physical activity (6). Longitudinally, increased LRT ridership was related to increased bouts of moderate physical activity (7). Even station area residents who do not use transit can benefit from the mix of nearby land uses and walk to local stores and other daily destinations near the station. Station area residents had higher neighborhood satisfaction after a light rail station was opened; they experienced greater perception of safety while walking, and felt that their children were safer (7). Finally, studies showed that retail, office, and residential rents, as well as housing prices are higher in more walkable places (8–10), suggesting that light rail’s contribution to making a place more walkable can result in increased economic activity and property tax revenue.
The present longitudinal study details the extent to which LRT catalyzes pedestrian activity in station areas. It examines the impact of the introduction of the first line within Seattle’s Sound Transit Link light rail system on walking activity among residents living within one mile of a station. Based on objective measures of changes in walking activity around LRT station areas, the study is among the first to provide planners with evidence regarding the “gravitational pull” of LRT stations following the completion of LRT. It also probes the effect of residential distance to stations on changes in walking activity, yielding estimates of actual measures of the size of TOD pedestrian catchment areas. Past research has identified a distance decay in the use of walking as an access mode to transit (2), but little is known about walking activity of station area residents relative to how far they live from a station, which represents the “push factor” away from station locations.
2. METHODS
2.1 Participants
The Travel Assessment and Community (TRAC) project used a longitudinal cohort study design to examine the impact of new Sound Transit Link light rail on physical activity and active travel. The first 13 Link light rail stations opened in fall 2009. The stations comprise a 14-mile corridor that connects downtown Seattle to SeaTac International Airport (Figure 1). In July 2008, households proximal (<1 mile) or distal (>1 mile) from planned link light rail stations were sampled and one adult from each household was recruited for the TRAC study if they were aged 18 or older, able to complete a travel diary and survey in English, and able to walk unassisted for ≥10 minutes. For the present analysis, only those who did not change home address from baseline to post 1 were included.
FIGURE 1.
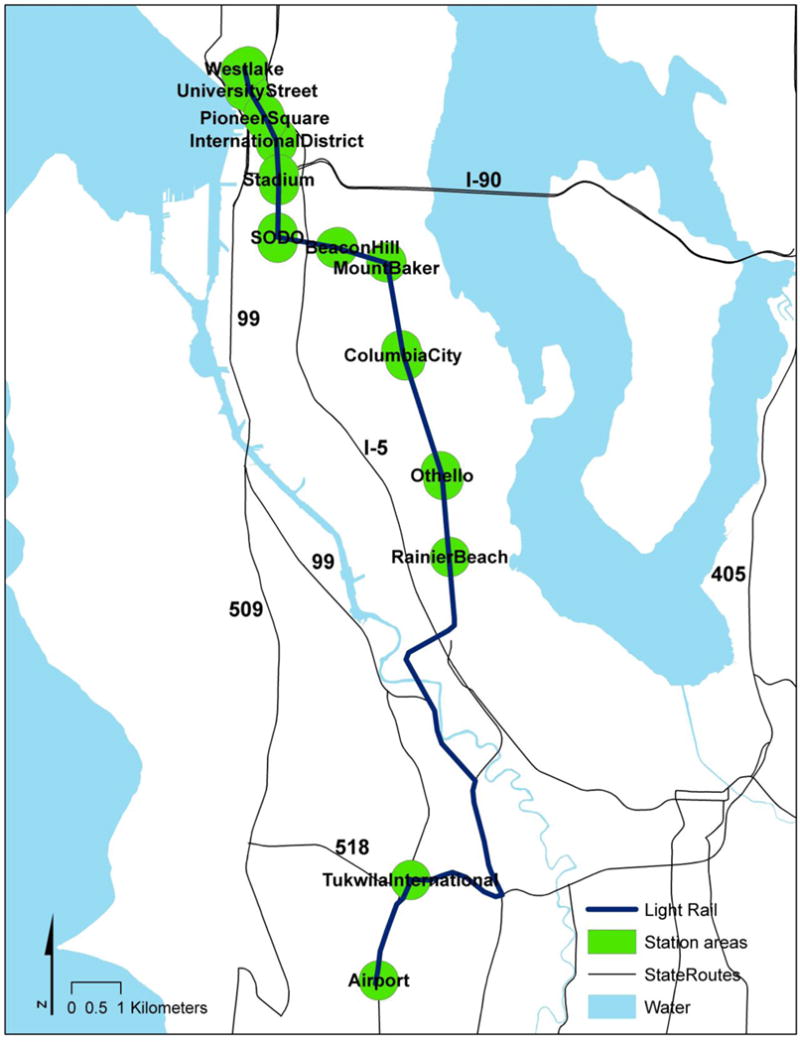
Quarter Mile LRT Station Areas
Under the assumption that the 1-mile distance was the longest distance that people would be willing to walk to LRT (11–16), the present analysis included all participants who could potentially walk from home to a LRT station. A total of 214 participants living <1 mile of one of the LRT stations were selected from the baseline (2008–2009) and post 1 (2010–2011) sample. Preliminary analyses compared the sample of 214 to 62 participants who lived within <1 mile of one of the 13 LRT stations at baseline, but were excluded from the analysis because they did not participate in post 1 (n=46) or moved their residential locations (n=16). The two groups did not significantly differ on gender or race/ethnicity, based on a 2-sample test for equality of proportions with continuity correction. However, compared at baseline to those excluded, the analytic sample contained a smaller proportion aged <40 (12% vs 35%, p<0.001), with income <50K (35% vs 53%, p=0.016) and with overweight or obese weight status (50% vs. 70%, p<0.001).
2.2 Data Collection
At each time point, participants were mailed an accelerometer (Actigraph GT1M), portable GPS device (GlobalSat DG-100), and a 7-day paper travel log. Participants were also provided a written or on-line (based on their preference) attitudinal and demographic survey to complete. Soon after receiving these materials, participants were contacted by study staff to review procedures (e.g., how to wear the devices; how to charge the GPS device nightly) and asked to wear the accelerometer and GPS for 7 days during waking hours and to complete the travel log for those days. Accelerometer count data were aggregated to 30-second epochs and GPS devices were set to collect location data at 30-second intervals. Participants mailed back the devices and travel log (and survey if in written form) in a pre-paid envelope (5). The data collection process was the same for baseline and post 1, with attempts made to obtain data on a given participant in the same month at each time point. Participants consented to the study, which was approved by the Seattle Children’s Institutional Review Board.
2.3 Measures
The process by which accelerometer data were integrated with GPS and travel log information to identify walking and non-walking physical activity bouts is described elsewhere in detail (17). In summary, bouts of ≥5 minutes of accelerometer counts >500 per 30-second epoch, allowing for up to 2 minutes of counts below the 500-count threshold, were considered to be physical activity (PA) bouts. These bouts were then considered to be walking based on GPS speeds and/or on temporal overlap or proximity to walking trips or trips by other modes (e.g., transit) recorded in the travel log. The definition served to isolate “walking as travel in space” from other types of PA. Only walk bouts with the ≥2 GPS points necessary to form a line were included in this analysis. Average daily overall walking was calculated as the total duration (minutes) of walk bouts on valid assessment days divided by the number of valid assessment days. Valid assessment days were defined as days with at least one place record in the travel diary, any GPS data, and an accelerometer wear time of ≥8 hours. Accelerometer periods of ≥20 minutes with continuous zeros were considered as non-wearing times. Sixteen of the 214 participants were dropped from analysis because they had no valid observation days at baseline or post 1.
Average daily LRT walking was calculated as the total duration (minutes) of walk bouts with GPS lines intersecting a quarter-mile airline buffer around the 13 LRT stations (FIGURE 1) divided by the number of valid assessment days. This quarter-mile threshold corresponds to a 5- to 7-minute walk and has been previously used to define the geographical boundary of TOD (18; 19). For stations that had more than one entrance, a quarter mile buffer was generated for each entrance and multiple buffers for the station were merged as one station area. The same areas were used at baseline and post 1 to classify walking in a LRT station area versus outside of a station area.
The proportion of walking within the LRT station area for each participant was calculated as average daily LRT station walking divided by the average daily overall walking. This measure represented the spatial concentration of walking around LRT stations for each participant at baseline and post 1. At baseline, walking bouts that occurred in LRT station areas could not have been for the purpose of accessing LRT, while at post 1 walking bouts that occurred in LRT station areas could or could not have been for the purpose of accessing LRT. The difference in LRT station area walking between baseline and post 1 would be the effect of LRT on the residents’ walking behavior not only for transit access, but other purposes as well.
Socio-demographic characteristics from the survey included age, gender, race, ethnicity, and education at baseline, as well as income at baseline and post 1. Height and weight at baseline and post 1 were used to calculate Body Mass Index (BMI) at both time periods. Frequent light rail users were defined as those using LRT 4–5 times a week based on responses to a survey question at post 1 that asked, “During the average month, how often do you use the light rail?” with choices as “(1) <once a month, (2)1–2 times/month, (3) 3–4 times/month, (4) once a week, (5) 2–3 times/week (6) 4–5 times/week.” Drivable motor vehicles per adult 1 were calculated separately at baseline and post as the total number of drivable motor vehicles divided by the number of adults >18 years old in the household.
Distance from participants’ homes to the nearest LRT station was defined as the shortest network route accessible by walking. The street entrances of LRT stations and residential locations were geocoded. Station maps from the Sound Transit website (http://www.soundtransit.org/Schedules/Central-Link-light-rail?tab=Stations) were used for geocoding station entrances. When entrances were not indicated on the maps, online satellite images and street view services (Google maps and Bing maps) were used to find entrance locations. ESRI StreetMap Premium NAVTEQ Street Data 2009 Release 1 for Washington State was used for routing and measuring network distances.
2.4 Data Analysis
Descriptive statistics of the longitudinal sample at baseline and post 1 were calculated for socio-demographic characteristics, weight status, frequent LRT use, and number of drivable vehicles per adult.
Average daily overall walking minutes, average daily LRT station area walking minutes, and LRT station area walking proportion were compared at baseline and post 1. To explore whether residential location influenced LRT station area walking minutes and LRT station walking proportion, participants were divided into four groups based on the distance from the closest LRT station entrance to their home: 0–0.25 mile, 0.25–0.5 mile, 0.5–0.75 mile and 0.75–1 mile. Average daily walking was then presented by distance strata. Statistically significant (p<0.05) changes in walking from baseline to post 1 were tested among the full sample and by distance stratum using paired sample t-tests.
A negative binomial regression model was used to test the association between distance from home to the nearest LRT station entrance and average daily LRT station area walking proportion at post 1, controlling for LRT station area walking proportion at baseline. The model also controlled for the socio-demographic characteristics of age, gender, race/ethnicity, income, education and overweight/obese status, as well as the travel behaviors/options of frequent light rail use and household car-to-adult ratio. All covariates included in the model used baseline measures, with the exception of frequent light rail use. Negative binomial regression was chosen to account for the overdispersion in the distribution of the dependent variable due to the large number of participants with no LRT station area walking. Negative binomial regression model coefficients were expressed as incident rate ratios (IRRs), which represent the multiplicative change in the dependent variable per unit change in the independent variable.
3. RESULTS
Descriptive statistics showed that at baseline the longitudinal panel sample was 63% female, 65% aged 40–65, 72% non-Hispanic White, and 71% with a college degree. Income and BMI increased slightly from baseline to post 1, with about half of the sample being overweight and obese (TABLE 1). About 7% of the participants were frequent light rail users (4-5 times per week) at post 1. The mean number of drivable vehicles per adult from baseline to post 1 was stable at 0.75.
TABLE 1.
Descriptive statistics for longitudinal sample (n=198)
| Baseline | Post 1 | ||||
|---|---|---|---|---|---|
|
|
|||||
| n | % / Mean (SD) | n | % / Mean (SD) | ||
| Gender | Male | 73 | 0.37 | - | - |
| Female | 12 | 0.63 | - | - | |
| 5 | |||||
| 18–39 | 30 | 0.16 | 22 | 0.12 | |
| Age | 40–65 | 12 | 0.65 | 123 | 0.65 |
| 2 | |||||
| >65 | 36 | 0.19 | 43 | 0.23 | |
| Race | Hispanic or non-White | 55 | 0.28 | - | - |
| Non-Hispanic White | 14 | 0.72 | - | - | |
| 0 | |||||
| Education | Less than college graduate | 56 | 0.29 | - | - |
| College graduate | 13 | 0.71 | - | - | |
| 7 | |||||
| Income | <50k | 70 | 0.37 | 65 | 0.36 |
| 50–100k | 75 | 0.39 | 70 | 0.38 | |
| >100k | 45 | 0.24 | 48 | 0.26 | |
| BMI | BMI < 25 | 96 | 0.51 | 90 | 0.51 |
| BMI 25–30 | 53 | 0.28 | 47 | 0.27 | |
| BMI >30 | 40 | 0.21 | 40 | 0.23 | |
| LRT user | < frequent LRT user | - | - | 175 | 0.93 |
| frequent LRT user | - | - | 13 | 0.07 | |
| Drivable vehicle | Vehicle/adult | 18 3 |
0.75 (0.54) | 198 | 0.75 (0.54) |
For the full sample, average daily minutes of overall walking significantly decreased from 36.2 minutes at baseline to 25.1 minutes at post 1, while average daily minutes of walking near LRT stations did not significantly change during the same period (TABLE 2). This led to a significant 6 percentage point increase in the proportion of overall walking that was in an LRT station area from baseline to post 1.
TABLE 2.
Sensitivity of Distance from Home to LRT Stations (n=198)
| Distance | Daily average walking | Baseline Mean (SD) |
Post 1 Mean (SD) |
Change Mean (SD) |
p value* |
|---|---|---|---|---|---|
| < 1 mile (n=198) | Overall walking (minutes) | 36.2 (44.7) | 25.1 (23.6) | −11.1 (39.9) | <0.001 |
| Station area walking (minutes) | 7.7 (12.6) | 8.4 (13.8) | 0.7 (12.3) | 0.413 | |
| Percent station area walking (%) | 0.20 (0.27) | 0.26 (0.31) | 0.06 (0.31) | 0.008 | |
| <¼ mile (n=19) | Overall walking (minutes) | 47.9 (76.4) | 27.7 (29.1) | −20.2 (71) | 0.232 |
| Station area walking (minutes) | 10.9 (13.9) | 14.9 (18.6) | 4.0 (17.1) | 0.321 | |
| Percent station area walking (%) | 0.35 (0.38) | 0.46 (0.34) | 0.12 (0.44) | 0.259 | |
| ¼ – ½ mile (n=54) | Overall walking (minutes) | 43.6 (49.2) | 30.4 (24.4) | −13.2 (43.7) | 0.030 |
| Station area walking (minutes) | 11.1 (14.7) | 12.9 (16.5) | 1.8 (15.7) | 0.404 | |
| Percent station area walking (%) | 0.28 (0.29) | 0.36 (0.32) | 0.08 (0.30) | 0.057 | |
| ½ – ¾ mile (n=62) | Overall walking (minutes) | 28.6 (30.9) | 19.6 (18.8) | −9.0 (23.3) | 0.004 |
| Station area walking (minutes) | 4.1 (7.4) | 4.4 (7.4) | 0.4 (8.7) | 0.728 | |
| Percent station area walking (%) | 0.12 (0.19) | 0.20 (0.29) | 0.08 (0.34) | 0.066 | |
| ¾ – 1 mile (n=63) | Overall walking (minutes) | 33.7 (38.6) | 25.2 (24.8) | −8.5 (37.2) | 0.075 |
| Station area walking (minutes) | 7.4 (13.5) | 6.5 (13.0) | −0.9 (10.3) | 0.507 | |
| Percent station area walking (%) | 0.17 (0.24) | 0.17 (0.25) | 0.00 (0.24) | 0.891 |
paired sample t-test comparing baseline and post 1
Trends by distance to LRT station was explored by stratifying participants by distance between home and LRT stations. Average daily overall walking minutes decreased for all groups, but only statistical significant changes were observed for participants between ¼ – ¾ mile (TABLE 2, FIGURE 2). On the other hand, non-significant increases in daily average LRT station walking were observed for all groups, except for participants living ¾ – 1 mile of a station. The mean change in average daily station area walking minutes from baseline to post 1 decreased with distance from LRT stations. Non-significant increases in daily average LRT station area walking proportion (proportion of overall walking minutes that were in the station area) were observed for all groups, except for participants living ¾ – 1 mile of a station.
FIGURE 2.
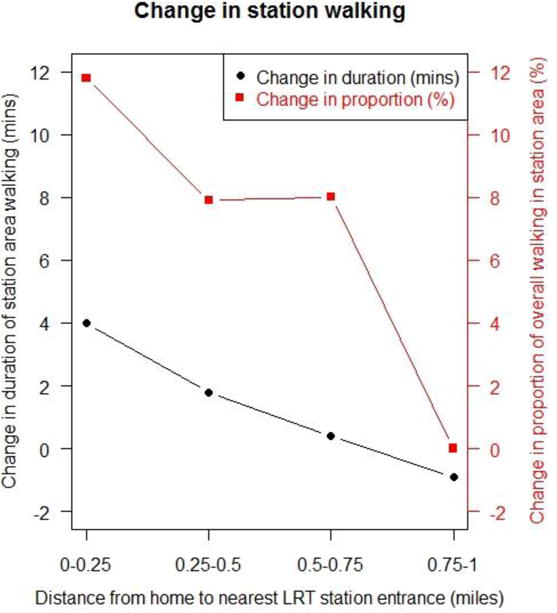
Change in Station Walking vs. Distance from Homes to Stations
The negative binomial regression model (TABLE 4) shows that LRT station area walking proportion at baseline was positively related to LRT station area walking proportion at post 1. Including this baseline station walking variable in the model allowed the remaining model coefficients to be interpreted as changes in rates of station area walking proportion from baseline to post 1. Thus living ≤0.25 miles from the nearest LRT station was associated with changes in LRT station area walking proportions 2.26 times greater than living in the reference category of 0.75–1 mile from the nearest station entrance, controlling for sociodemographics, weight status, and travel behaviors/options. Living 0.25–0.5 or 0.5–0.75 miles from the nearest LRT station was associated with changes in LRT station area walking proportions respectively 1.44 and 1.26 times greater than living in the reference category of 0.75–1 mile (p-value for distance trend = 0.006). Holding a college degree at baseline and being a frequent light rail user at post 1 were positively associated with LRT station area walking proportion, whereas greater household car-to-adult ratios at baseline had a negative association.
TABLE 4.
Negative binomial regression model results of average daily LRT station walking proportion at Post 1
| Average daily LRT station walking proportion at post 1
|
||
|---|---|---|
| IRR (95% CI) | p-value | |
| Average daily LRT walking proportion at baseline | 2.98 (1.83, 4.88) | <0.001 |
| Distance to LRT station, 0.75–1 mile | Reference | 0.006* |
| 0.5–0.75 miles | 1.26 (0.77, 2.05) | |
| 0.25 – 0.5 miles | 1.44 (0.99, 2.09) | |
| 0 – 0.25 miles | 2.26 (1.43, 3.57) | |
| Male | 1.17 (0.87, 1.56) | 0.297 |
| Age, 18–45 | Reference | 0.341 * |
| 45–65 | 1.13 (0.75, 1.69) | |
| >65 | 0.81 (0.45, 1.45) | |
| Non-Hispanic White | 1.02 (0.75, 1.4) | 0.884 |
| College degree | 2.05 (1.31, 3.2) | 0.002 |
| Household income, <$50k | Reference | 0.226* |
| $50–100K | 1.14 (0.73, 1.79) | |
| >$100K | 0.84 (0.53, 1.33) | |
| Overweight or obese | 0.91 (0.68, 1.22) | 0.544 |
| Frequent LRT user at post 1 | 2.1 (1.51, 2.93) | <0.001 |
| Car: adult ratio | 0.65 (0.47, 0.89) | 0.008 |
p-value for test of trend
4. DISCUSSION
Among the sample of individuals living within 1 mile of newly opened LRT stations, average daily minutes of walking in LRT station areas did not change significantly from before to after the opening of the LRT. Yet as overall walking activity decreased over time, the proportion of walking that took place around LRT stations increased, suggesting a shift in the location of walking from outside to inside the station areas after the introduction of light rail. This locational shift in walking behavior supports previous evidence that living in close proximity to transit – and specifically rail transit – promotes walking near transit stations (19, 20).
Distance between home and the nearest light rail station appeared to play an important role in changing walking location after LRT implementation. Controlling for sociodemographics, weight status, and travel behaviors/options, those who lived 0.5 – 0.75 miles and 0.25 – 0.5 miles of a station entrance increased the proportion of their station area walking by 26% and 44%, respectively, compared to those who lived between 0.75 and 1 mile from a station entrance. Residents who lived <0.25 miles from a station entrance had a change in proportion of their station area walking that was 126% greater than those who lived 0.75 – 1 mile from a station entrance. These results suggest that TOD housing should be located within <0.75 miles from LRT station entrances to support the highest increases in pedestrian activity near transit stations.
Results also suggested that the impact of TOD development on LRT station area pedestrian activity might depend on the neighborhood sociodemographic characteristics. Higher education attainment and fewer cars per adult in the household were associated with positive changes in proportion of average daily walking minutes in LRT station areas. These characteristics may call for targeting specific TOD populations. Less educated and more car-dependent populations may require physical improvements to the pedestrian environment or campaigns or other incentives or removal of other barriers to encourage walking to LRT stations to increase their walking activity.
The increased proportion of walking that occurred in LRT station areas among frequent light rail users indicated that walking to, from, or around stations might substitute for some walking outside of the station areas. Furthermore, frequent rail users might have better knowledge of various destinations along their walking paths and hence access these destinations more frequently by walking than those who use light rail less frequently.
The results of the present study benefit from the natural experiment study design and from the use of objective measures of walking. GPS measures allowed for precisely locating walking activity in and out of the LRT station areas. The prospective cohort design examining the same individuals’ walking behavior before and after introduction of light rail helped minimize the effect of self-selection (i.e. residents selecting neighborhoods having environments consistent with their activity preferences), which is considered as a key issue in determining the direction of causal pathways between the built environment and travel behavior. The study also provides a rare pre- and post-test of a new LRT line intervention, and a relatively large sample population, offering evidence for new planning, research, and policy directions in transportation planning.
Like many studies using wearable devices in quasi-experimental intervention design, the study has limitations. First, the 7-day assessment period may be too short to represent the location of free-living daily activity. Second, the sample was drawn from one U.S. metropolitan region, restricting the generalizability of the findings. This study is part of a large project investigating the impact of light rail on travel behavior and physical activity, and participants had more transit access than the general U.S. population (5). The present analysis did not examine whether walking activity in the LRT station areas was specifically related to using transit (e.g., walking to and from transit) or for other purposes (e.g., accessing station area stores). The study did also not distinguish between walking in different station areas (e.g., in the station area nearest to home or not). Average daily walking may also be underestimated because only walk bouts with GPS data contributed to the measure. Omission of walk bouts with no GPS data should not, however, bias the results of this analysis unless there are systematic differences in their omission by distance to transit station or from baseline to post 1. Changes in built environment and destinations around the LRT were not explored, and could have influenced walking activity. However, the built environment was unlikely to change significantly in the two years separating the two assessment periods. Also the two years fell during a recession when businesses tended to close, not open, thus potentially reducing reasons for walking near the stations. Finally, attitudes toward active travel and neighborhood perceptions may have had an effect on the walking behavior around the home neighborhood and to/from transit access areas and need to be considered in the future studies.
5. CONCLUSION
This longitudinal study provides evidence of a causal relation between building an LRT system and change in walking behavior. The documented increase in the proportion of overall walking that occurred around station areas on the part of people who reside near a station supports the notion that station areas attract pedestrian traffic. The “gravitational pull” of station areas may in turn generate economic and social activity given an appropriate mix of uses near stations. Overall, the increase in the proportion of walking around stations point to the great potential of TOD to accommodate people-friendly neighborhoods. The study also highlighted the importance of distance between homes and station entrances in shifting walking from outside to within station areas after the introduction of light rail service. It indicated that TODs should be contained within <0.75 mile of stations as beyond this distance, residents no longer were actively “pulled” into the areas.
Highlights.
This longitudinal study details how LightRail Transit (LRT) catalyzes walking in station areas.
The study provides evidence of “gravitational pull” effect of LRT stations.
We probe the effect of residential distance to stations on walking activity.
The residential catchment area for the shift in walking was < 0.75 mile of the stations.
Acknowledgments
This study was funded by NIH/NHLBI R01HL091881 and by the Washington Transportation Center TransNow Research Project Agreement No. 61-7318.
Footnotes
Publisher's Disclaimer: This is a PDF file of an unedited manuscript that has been accepted for publication. As a service to our customers we are providing this early version of the manuscript. The manuscript will undergo copyediting, typesetting, and review of the resulting proof before it is published in its final citable form. Please note that during the production process errors may be discovered which could affect the content, and all legal disclaimers that apply to the journal pertain.
References
- 1.Calthorpe P. The next American metropolis : ecology, community, and the American dream. Princeton Architectural Press; New York: 1993. [Google Scholar]
- 2.Cervero R. Walk-and-Ride: Factors Influencing Pedestrian Access to Transit. Journal of Public Transportation. 2001;3:1–23. [Google Scholar]
- 3.Cervero R. Transit-based housing in California: evidence on ridership impacts. Transport Policy. 1994;1(3):174–183. [Google Scholar]
- 4.Brown BB, Werner CM. Before and After a New Light Rail Stop: Resident Attitudes, Travel Behavior, and Obesity. 2008;(75):5–12. [Google Scholar]
- 5.Saelens BE, Vernez Moudon A, Kang B, Hurvitz PM, Zhou C. Relation between higher physical activity and public transit use. Am J Public Health. 2014;104(5):854–859. doi: 10.2105/AJPH.2013.301696. [DOI] [PMC free article] [PubMed] [Google Scholar]
- 6.Brown BB, Werner CM. A new rail stop: tracking moderate physical activity bouts and ridership. American journal of preventive medicine. 2007;33:306–309. doi: 10.1016/j.amepre.2007.06.002. [DOI] [PubMed] [Google Scholar]
- 7.Brown Barbara B, Werner Carol M. The Residents’ Benefits and Concerns Before and After a New Rail Stop: Do Residents Get What They Expect? 2011;(43):789–806. [Google Scholar]
- 8.Cortright J. Walking the Walk: How Walkability Raises Home Values in U.S. Cities. CEOs for Cities; Chicago: 2009. [Google Scholar]
- 9.Leinberger CB, Alfonzo M. Walk this Way: The Economic Promise of Walkable Places in Metropolitan Washington, DC. The Metropolitan Policy Program at Brookings; Washington, D.C.: 2012. [Google Scholar]
- 10.Pivo G, Fisher J. The Walkability Premium in Commercial Real Estate Investments. Real Estate Economics. 2011;39(2):185–219. [Google Scholar]
- 11.Beimborn E, Greenwald M, Jin X. Accessibility, Connectivity, and Captivity: Impacts on Transit Choice. 2003;(1835):1–9. [Google Scholar]
- 12.Dill J. Transit Use at Transit-Oriented Developments in Portland, Oregon, Area. 2008;(2063):159–167. [Google Scholar]
- 13.Kim S, Ulfarsson GF, Hennessy J Todd. Analysis of light rail rider travel behavior: Impacts of individual, built environment, and crime characteristics on transit access. Transportation Research Part A. 2007;41:511–522. [Google Scholar]
- 14.Stringham MGP. Travel Behavior Associated with Land Uses Adjacent to Rapid Transit Stations. ITE Journal. 1982;52(4):3–3. [Google Scholar]
- 15.Weinstein Agrawal A, Schlossberg M, Irvin K. How Far, by Which Route and Why? A Spatial Analysis of Pedestrian Preference. 2008;(13):81–98. [Google Scholar]
- 16.Wibowo SKOP. Modeling Walking Accessibility to Public Transport Terminals: Case Study of Singapore Mass Rapid Transit. Journal of the Eastern Asia Society for Transportation Studies. 2005;6:147–156. [Google Scholar]
- 17.Kang B, Moudon AV, Hurvitz PM, Reichley L, Saelens BE. Walking Objectively Measured: Classifying Accelerometer Data with GPS and Travel Diaries. Medicine and science in sports and exercise. 2013;45(7):1419–1428. doi: 10.1249/MSS.0b013e318285f202. [DOI] [PMC free article] [PubMed] [Google Scholar]
- 18.Cervero R. Travel demand and the 3Ds: Density, diversity, and design. Transportation Research Part D: Transport and Environment Transportation Research Part D: Transport and Environment. 1997;2:199–219. [Google Scholar]
- 19.National League of, C. Transit- Oriented Development (TOD) 2013. [Google Scholar]