

Abstract
Objectives
The rate of falling among older citizens appears to vary across different countries, but the underlying aspects causing this variation are unexplained. We aim to describe between-country variation in falling and explore whether intrinsic fall risk factors can explain possible variation.
Design
Prospective study on data from the cross-national Survey of Health, Ageing and Retirement in Europe (SHARE).
Setting
Twelve European countries (Austria, Belgium, Czech Republic, Denmark, Estonia, France, Germany, Italy, The Netherlands, Spain, Sweden, Switzerland).
Participants
Community-dwelling persons aged ≥65 years (n=18 596).
Measurements
Socio-demographic factors (age, gender, education level and living situation) and intrinsic fall risk factors (less than good self-rated health (SRH), mobility limitations, limitations with activities of daily living (ADL), dizziness, impaired vision, depression and impaired cognition) were assessed in a baseline interview. Falling was assessed 2 years later by asking whether the participant had fallen within the 6 months prior to the follow-up interview.
Results
There was significant between-country variation in the rate of falling (varying from 7.9% in Switzerland to 16.2% in the Czech Republic). The prevalence of intrinsic fall risk factors varied twofold to fourfold between countries. Associations between factors age ≥80 years, less than good SRH, mobility limitations, ADL limitations, dizziness and depression, and falling were different between countries (p<0.05). Between-country differences in falling largely persisted after adjusting for socio-demographic differences but strongly attenuated after adjusting for differences in intrinsic fall risk factors.
Conclusion
There is considerable variation in the rate of falling between European countries, which can largely be explained by between-country variation in the prevalence of intrinsic fall risk factors. There are also country-specific variations in the association between these intrinsic risk factors and falling. These findings emphasise the importance of addressing intrinsic fall risk in (inter)national fall-prevention strategies, while highlighting country-specific priorities.
Keywords: epidemiology, geriatric medicine, preventive medicine
Strengths and limitations of this study.
This was the first study to compare falling and fall risk among European countries.
This study has the advantage of using standardised methods for data collection and data from nationally representative samples of those aged 65 years and over from 12 European countries.
Falling was assessed retrospectively, by asking whether a person was bothered by the fall, this might have caused recall bias in our study and a tendency towards only reporting more serious falls.
We did not have information on the number of falls or place of fall.
Introduction
Every year around 30% of community-dwelling older citizens over age 65 fall.1–3 Falling places a high burden on the health of older people and on public health resources.4 Around 5–10% of all falls result in serious injury such as a head injury or fracture.5 6 Around 90% of fractures of the hip, one of the most debilitating injuries among older people, are the result of a fall. In 2000, the combined costs in Europe for hip fractures were estimated at €24.4 billion7, these costs are expected to double in 2050 due to the ageing population. Falling can also have negative psychosocial effects such as fear of falling, activity avoidance and social isolation.8 9 Due to the burden caused by falling and positive results from fall prevention interventions, prevention of falling is a priority of health policy.3 10–12
The rate of falling among older citizens appears to vary across countries and cultures.2 13 14 However, few studies have investigated falling cross-nationally using uniform methodology to measure falling. A three-country study in community-dwelling men aged 65 years or above found that the proportion of fallers was highest in the US, intermediate in Sweden and lowest in Hong Kong.15 Another study among persons aged 50–79 years in 36 European centres showed that the age-standardised incidence ranged between 1.7 and 75.1 falls/100 person years among men and between 3.0 and 52.5 falls/100 person years among women.13 Differences in the incidence of falls explained 24%, 14% and 6% of the between-centre variation in incidence of distal forearm and upper and lower limb fractures, respectively. The study provides little explanation on why they found such a wide variation in fall rates and speculated it is likely a complex pattern of varying intrinsic (patient-related) and external (environment-related) factors.
What causes an individual person to fall is indeed a difficult question to answer as fall risk factors are multifold.1 10 16–19 At the same time, risk factors have been well described in the literature and studies have shown that intrinsic factors, in particular mobility and balance problems, are the strongest predictors of falling.1 19 20 Between-country variation in the prevalence of intrinsic fall risk factors is therefore likely to contribute to between-country variation in falling, but this has not been documented so far. Furthermore, insight into regional differences of falls and fall risk factors can help (inter)national policy makers to prioritise the right fall prevention strategies or continue successful efforts. Exercise programmes, multifactorial fall prevention strategies and home safety interventions reduce falls,3 11 21 the latter being more effective in persons with a higher intrinsic fall risk.3 Therefore, the aim of this study is to describe the variation in falling across 12 European countries and to determine whether this variation can be explained by intrinsic fall risk factors. We sought to answer three questions:
How does the rate of falling vary for older citizens across 12 European countries?
Does the prevalence of intrinsic fall risk factors as well as the strength of the association with falling vary between the European countries?
To what extent does variation in prevalence of socio-demographic and intrinsic fall risk factors among European countries explain between-country variation in falling?
Methods
Study design and population
This was a prospective study with a 2-year follow-up period. For this study we used data from the Survey of Health, Ageing and Retirement in Europe (SHARE). SHARE is a harmonised longitudinal survey of ageing processes in people aged 50 years and older across Europe that started in 2004. The study has been described in detail elsewhere.22 Samples from different countries are based on probability household samples and respondents are interviewed using standardised computer assisted personal interviews (CAPIs). SHARE has obtained ethical approval by the institutional review board at University of Mannheim, Germany.
We analysed data from community-dwelling persons aged ≥65 years at wave 4 (2010/2011) who also participated in wave 5 (2013).23 Data from 12 European countries (Sweden, Denmark, Austria, Germany, the Netherlands, Belgium, Switzerland, France, Italy, Spain, Czech Republic and Estonia) were included in this study. There were 28 344 persons aged 65 years and older from the 12 European countries in wave 4, of which 18 596 persons (74.3%) participated in wave five and were included in the study.
Measures
Falling
The outcome measure used in this study is the rate of falling, defined as the presence of one or more self-reported falls in the 6 months prior to wave 5. This was assessed by asking participants ‘For the past 6 months at least, have you been bothered by any of the health conditions on this card?'. A showcard was presented to the participant with five health conditions among which was ‘falling down’.
Socio-demographic factors
The following socio-demographic factors assessed at wave 4 were used: age, gender, education level and living situation. Year and month of birth of the respondent was assessed in the questionnaire, age was calculated and categorised in 5-year groups (65–69 years; 70–74 years; 75–79 years and ≥80 years) for stratification of rate of falling and categorised into <80 years and ≥80 years for logistic regressions. Living situation was assessed by asking whether the respondent lived together with their spouse and whether anyone else was living in the household; the number of persons in the household was calculated and categorised into ‘not alone’ (>1 person) and ‘alone’ (one person). For international comparisons of education, SHARE uses the 1997 International Standard Classification of Education (ISCED-97). Education level was assessed by asking the highest level of education completed and categorised the level of education into ‘low’ (0–10 years) and ‘high’ (11–25 years).
Intrinsic fall risk factors
We used three systematic reviews to determine which risk factors were consistently and strongly associated with falling1 20 24 and then used the risk factors which were present in the wave 4 data: self-rated health (SRH), mobility limitations, limitations with activities of daily living (ADL), dizziness, impaired vision, depression and impaired cognition. SRH is a common measure used in comparing population health and was assessed with the US global version of SRH,25 by asking: ‘Would you say your health is …’; options were poor, fair, good, very good, excellent. Less than good SRH was defined as ‘poor’ or ‘fair'.26 Mobility limitations were assessed with three items from the extensively used and validated SF-36 instrument,27 by asking participants whether they had problems with one or more of the following activities: walking 100 metres, walking one set of stairs and walking several sets of stairs. Mobility limitations were defined as having problems with one or more of these activities. Six basic ADL limitations as developed by Katz et al 28 were assessed by asking participants whether they had difficulties with one or more of six ADLs (dressing, walking across a room, bathing, eating, getting in or out of bed, using toilet). ADL limitations were defined as having problems with one or more of these activities. Dizziness was assessed by asking: ‘For the past 6 months at least, have you been bothered by any of the health conditions on this card?'. A showcard was presented to the participant with five conditions among which were ‘dizziness, faints or blackouts’. Vision was assessed by asking: 'How good is your eyesight for seeing things at a distance, like recognising a friend across the street (using glasses or contact lenses as usual)? Would you say it is …’; options were poor, fair, good, very good, excellent. Impaired (diminished) vision was defined as ‘poor’ or ‘fair’. Depression was assessed by the Euro-D scale, with 12 items: depression, pessimism, death wishes, guilt, sleep, interest, irritability, appetite, fatigue, concentration, enjoyment, and tearfulness. Each item is scored 0 (symptom not present) or 1 (symptom present). Scores ≥4 indicated depression. Euro-D was developed to compare symptoms of depression across Europe and validated in a European sample.29 30 Cognitive function was assessed by five tests that assessed verbal fluency, immediate and delayed recall, orientation and numeracy.31 32 A summary cognitive function score of averaged z-scores of the five tests was built for individuals who had valid values for at least three of the tests. Respondents were classified as being cognitively impaired if their score was in the lowest decile of the summary indicator. Cognition impairment according to this definition is likely to reflect the lower range of statistically ‘normal’ cognitive function, not necessarily clinically diagnosable disorders.33
Statistical analysis
The statistical significance of differences in socio-demographic characteristics and intrinsic fall risk factors among persons from different countries were calculated using χ2 tests and independent samples t test. Rate of falling was stratified by sex and different age categories to study differences between countries. To examine the association of socio-demographic and intrinsic risk factors with falling, multivariable logistic regression analyses were performed for each country separately. The multivariable models were conducted on the 17 575 persons (94.5%) with complete data. We tested for the significance of between-country differences in the strength of the association between predictors (socio-demographic and intrinsic risk factors) and falling by including data from all countries in one logistic regression model and adding an interaction term for country*predictor, for each predictor separately.
To examine whether differences in intrinsic fall risk could explain differences in rate of falling, we also performed logistic regression analyses with the dataset that contained all countries. Association between country of residence and falling was adjusted for socio-demographic and intrinsic fall risk factors. Country was entered as a dummy variable with Switzerland as the reference category as it had the lowest rate of falling. Each logistic regression model was built up in several steps: we first tested the association between country of residence and falling (model 1), we subsequently added socio-demographic factors (model 2), mental health factors (model 3) and physical health factors (model 4). In the final model we added all socio-demographic and intrinsic fall risk factors together (model 5). All models were corrected for falling at baseline. We calculated change in ORs of models with predictors compared with model 1 with the formula: (OR model 1−OR model with predictors)/(OR model 1−1)*100%. Falling was assessed in the same way in wave 4 and entered as covariate in all multivariable models. In a sensitivity analysis we added interaction terms between predictors and country separately to the final model (model 5). We considered a p-value of 0.05 or lower to be statistically significant. All analyses were performed using SPSS version 21.0 (IBM SPSS Statistics for Windows, IBM Corp., Armonk, New York).
Non-response analysis and weights
SHARE has high contact rates (>95%) and a moderate cooperation rate (70–80%) between waves. Exact reasons for refusal to participate are unknown; for 2.6% of the sample death was reported as the reason. The mortality data are however not always reliable; SHARE aims to uncover this in the future.23 A comparison of the persons included in this study (n=18 596) with the persons who were excluded due to non-participation at follow-up (n=9748) indicated that these persons were older, had a higher intrinsic fall risk and more often reported a fall at baseline. Attrition was highest in Germany, France and the Czech Republic. To calculate descriptive statistics (table 1 and figure 1), we used calibrated sampling weights to account for the sampling design, non-response and attrition. We report unweighted descriptive statistics in a supplementary table (see online supplementary Table S1). Weights were calibrated against the national populations by age group and sex, as well as for mortality between waves. We did not apply weights in regression models because weighting is unnecessary for consistency and potentially harmful for precision.34 35
Table 1.
Weighted baseline socio-demographic and intrinsic fall risk characteristics, and self-reported falling at the 2-year follow-up interview, of persons from 12 countries in the Survey of Health, Ageing and Retirement in Europe, 2010–2013.
| Switzerland | Denmark | Sweden | Austria | Italy | Netherlands | Germany | Belgium | Estonia | France | Spain | Czech Republic | |
| n=1386 | n=873 | n=1009 | n=1983 | n=1423 | n=1092 | n=591 | n=1805 | n=2917 | n=1893 | n=1559 | n=2065 | |
| Age, mean±SD* | 73.9±6.8 | 73.3±6.9 | 73.9±7.3 | 74.2±6.9 | 74.4±6.6 | 73.8±6.9 | 74.6±6.5 | 74.7±6.9 | 74.0±6.4 | 75.1±7.1 | 74.7±7.0 | 73.0±6.6 |
| Women, %† | 55.8 | 54.2 | 53.6 | 57.5 | 57.3 | 55.3 | 55.2 | 58.3 | 67.9 | 58.3 | 58.0 | 59.0 |
| Low education, %†‡ | 28.2 | 23.8 | 51.2 | 29.9 | 81.4 | 56.7 | 17.9 | 51.3 | 41.8 | 57.3 | 90.1 | 46.6 |
| Living alone, %† | 36.6 | 38.8 | 42.7 | 38.0 | 27.4 | 41.0 | 38.4 | 34.1 | 43.0 | 38.6 | 26.0 | 32.3 |
| Less than good SRH, %†‡ | 19.8 | 24.4 | 33.6 | 35.1 | 53.5 | 32.1 | 45.5 | 33.7 | 78.6 | 44.7 | 56.4 | 48.8 |
| Mobility limitation(s), %†‡ | 18.3 | 24.7 | 26.3 | 42.5 | 52.8 | 26.2 | 37.2 | 37.5 | 43.6 | 40.3 | 49.6 | 47.6 |
| ADL limitation(s), %†‡ | 8.2 | 9.6 | 12.2 | 14.5 | 16.0 | 8.0 | 18.8 | 20.0 | 19.9 | 15.6 | 17.9 | 12.4 |
| Dizziness, %†‡ | 6.9 | 11.3 | 10.6 | 11.2 | 14.5 | 10.7 | 11.0 | 11.1 | 22.2 | 10.4 | 15.3 | 10.8 |
| Impaired vision, %†‡ | 10.6 | 9.5 | 8.3 | 9.6 | 27.7 | 10.6 | 10.2 | 14.2 | 32.0 | 16.4 | 34.4 | 14.8 |
| Depression, %†‡ | 17.9 | 13.7 | 19.4 | 21.6 | 37.7 | 18.3 | 24.1 | 29.9 | 43.6 | 34.0 | 41.0 | 25.9 |
| Impaired cognition, %†‡ | 4.4 | 7.0 | 6.7 | 9.2 | 28.1 | 9.9 | 9.4 | 13.0 | 10.2 | 13.6 | 38.7 | 8.0 |
| Baseline falling, %†‡§ | 3.1 | 4.5 | 5.6 | 7.0 | 5.1 | 4.5 | 4.9 | 6.5 | 7.3 | 7.7 | 9.8 | 6.6 |
| Falling at follow-up, %†‡§ | 7.9 | 9.1 | 9.4 | 9.5 | 11.0 | 11.5 | 11.8 | 12.8 | 13.9 | 14.9 | 16.2 | 16.2 |
| 95% CI | 6.6 to 9.4 | 7.3 to 11.1 | 7.8 to 11.4 | 8.3 to 10.9 | 9.5 to 12.8 | 9.8 to 13.6 | 9.5 to 14.7 | 11.3 to 14.4 | 12.7 to 15.2 | 13.4 to 16.6 | 14.5 to 18.1 | 14.7 to 17.9 |
p-value<0.001, based on *t test and †χ2 test.
‡Missing N for variables: education=340; SRH=35; mobility=30; ADL=34; dizziness=37; vision=50; depression=480; cognition=397; falling=55.
§Reporting one or more falls within the 6 months prior to the interview.
ADL, activities of daily living; SRH, self-rated health.
Figure 1.
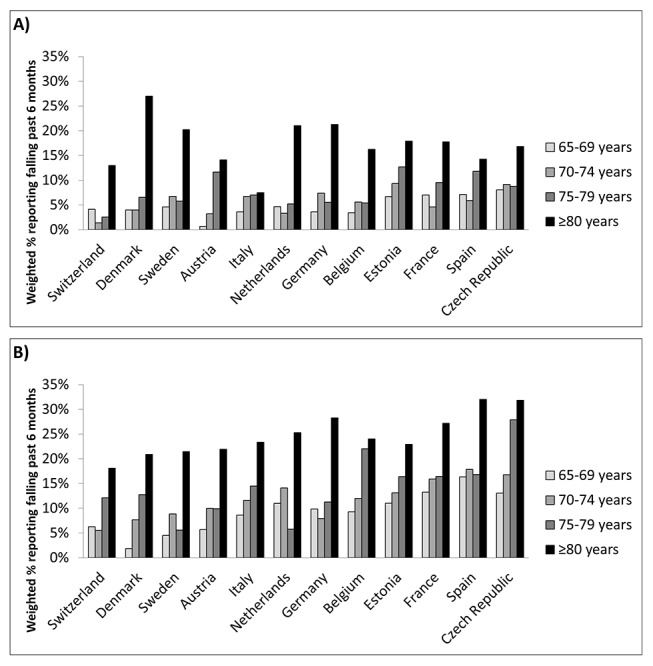
Rate of falling, by country and age group for (A) men and (B) women from 12 countries in the Survey of Health, Ageing and Retirement in Europe, 2010–2013.
bmjopen-2017-015827supp001.pdf (221.8KB, pdf)
Results
Socio-demographic and fall risk characteristics
Mean age at baseline for the overall weighted sample was 74.1 years (SD 6.8 years) and 55.8% were women. Participants in Spain and Italy had lower education levels compared with those from other countries and were less often living alone (p<0.001; table 1).
The prevalence of all intrinsic fall risk factors varied between countries (p<0.001; table 1). The prevalence of most intrinsic risk factors was on the lower end of the spectrum in Switzerland, Denmark, Sweden and The Netherlands and on the higher end of the spectrum in Italy, Estonia, Spain and Czech Republic. In France and Belgium the prevalence of ADL limitations, impaired vision and depression was on the higher end of the spectrum. Impaired cognition was highest in Spain (39.5%) and Italy (24.3%) and ranged from 4.0% to 13.5% in the other countries.
Falling
There was significant between-country variation in the proportion of persons reporting falling (p<0.001; table 1). In Switzerland, Denmark, Sweden and Austria between 7.9% (95% CI 6.6% to 9.4%) and 9.5% (95% CI 8.3% to 10.9%) reported falling within the past 6 months. In Italy, The Netherlands, Germany and Belgium this varied between 11.0% (95% CI 9.5% to 12.8%) and 12.8% (95% CI 11.3% to 14.4%). In Estonia, France, Spain and the Czech Republic this varied between 13.9% (95% CI 12.7% to 15.2%) and 16.2% (95% CI 14.7% to 17.9%).
The between-country variation in falling showed similar patterns for both men and women aged <80 years as well as among women aged ≥80 years (figure 1A and B). Among men aged ≥80 years, the between-country variation was smaller and distributed differently. Especially few men in Italy reported falling (figure 1A).
Factors associated with falling in each country
When controlling for all factors in the model, older age (≥80 years) was associated with falling in almost all countries (ORs varying from 1.42 in the Czech Republic to 3.06 in Denmark). Female gender was associated with falling in six countries. Lower education level and living alone were not associated with falling in most countries (table 2).
Table 2.
Multivariable binary logistic regression per country with associations (odds ratios and 95% CIs) of socio-demographic and intrinsic fall risk factors with self-reported falling among persons from 12 countries in The Survey of Health, Ageing and Retirement in Europe, 2010–2013.
| Switzerland | Denmark | Sweden | Austria | Italy | Netherlands | Germany | Belgium | Estonia | France | Spain | Czech Republic | p† | |
| n=1345 | n=840 | n=946 | n=1864 | n=1364 | n=1027 | n=570 | n=1747 | n=2749 | n=1771 | n=1396 | n=1956 | n= 17 575 |
|
| Age≥80 years | 2.18**(1.33 to 3.57) | 3.06*** (1.69 to 5.55) |
2.08** (1.20 to 3.59) |
2.12*** (1.44 to 3.11) |
1.14 (0.70 to 1.87) |
2.43*** (1.49 to 3.97) |
2.95** (1.47 to 5.92) |
1.62** (1.16 to 2.61) |
1.53** (1.17 to 2.00) |
1.35 (0.98 to 1.87) |
1.44* (1.01 to 2.04) |
1.42* (1.02 to 1.99) |
0.004 |
| Female gender | 1.60 (0.96 to 2.66) |
0.72 (0.39 to 1.33) |
0.91 (0.55 to 1.53) |
1.83** (1.21 to 2.77) |
1.73* (1.13 to 2.65) |
1.33 (0.81 to 2.19) |
1.75 (0.92 to 3.35) |
1.79*** (1.27 to 2.54) |
1.07 (0.82 to 1.40) |
1.75*** (1.27 to 2.43) |
1.66** (1.17 to 2.36) |
1.43* (1.07 to 1.91) |
0.086 |
| Low education | 1.23 (0.75 to 2.00) |
1.06 (0.56 to 2.03) |
0.70 (0.43 to 1.15) |
0.74 (0.50 to 1.10) |
0.69 (0.40 to 1.17) |
1.37 (0.84 to 2.22) |
0.92 (0.40 to 2.08) |
1.00 (0.73 to 1.37) |
0.82 (0.64 to 1.05) |
1.32 (0.97 to 1.81) |
0.85 (0.48 to 1.49) |
1.18 (0.91 to 1.54) |
0.275 |
| Living alone | 1.24 (0.76 to 2.01) |
1.46 (0.81 to 2.64) |
0.90 (0.52 to 1.55) |
1.49* (1.04 to 2.16) |
0.99 (0.61 to 1.60) |
1.53 (0.94 to 2.48) |
1.30 (0.66 to 2.58) |
1.40* (1.02 to 1.93) |
1.27 (0.98 to 1.63) |
1.21 (0.90 to 1.63) |
1.39 (0.95 to 2.02) |
1.35* (1.03 to 1.79) |
0.530 |
| Less than good SRH | 1.22 (0.70 to 2.11) |
1.67 (0.89 to 3.13) |
1.57 (0.92 to 2.68) |
1.77** (1.19 to 2.65) |
1.15 (0.71 to 1.85) |
2.09** (1.27 to 3.43) |
1.80 (0.89 to 3.63) |
1.64** (1.17 to 2.32) |
1.05 (0.73 to 1.51) |
1.10 (0.80 to 1.50) |
1.13 (0.77 to 1.64) |
1.69*** (1.26 to 2.27) |
0.001 |
| Mobility limitation(s) | 1.13 (0.63 to 2.03) |
2.06* (1.06 to 3.99) |
1.99* (1.13 to 3.51) |
1.16 (0.76 to 1.75) |
1.42 (0.87 to 2.31) |
1.72* (1.05 to 2.83) |
0.44* (0.19 to 0.98) |
1.77*** (1.25 to 2.50) |
1.67*** (1.27 to 2.21) |
1.47* (1.06 to 2.03) |
1.42 (0.97 to 2.07) |
1.19 (0.90 to 1.59) |
0.002 |
| ADL limitation(s) | 1.36 (0.68 to 2.73) |
1.98 (0.93 to 4.19) |
1.45 (0.76 to 2.77) |
2.02** (1.29 to 3.15) |
1.41 (0.85 to 2.35) |
1.59 (0.82 to 3.10) |
2.43* (1.06 to 5.53) |
1.33 (0.92 to 1.91) |
1.51** (1.14 to 2.00) |
1.60* (1.10 to 2.32) |
1.17 (0.77 to 1.78) |
1.20 (0.83 to 1.75) |
0.022 |
| Dizziness | 1.84 (0.95 to 3.57) |
5.19*** (2.76 to 9.77) |
1.62 (0.85 to 3.08) |
1.05 (0.66 to 1.69) |
1.78* (1.10 to 2.87) |
1.16 (0.61 to 2.19) |
1.21 (0.52 to 2.78) |
1.32 (0.87 to 1.99) |
1.45** (1.11 to 1.89) |
1.16 (0.77 to 1.77) |
0.92 (0.61 to 1.39) |
1.97*** (1.38 to 2.81) |
<0.001 |
| Impaired vision | 1.77 (1.00 to 3.13) |
1.07 (0.50 to 2.30) |
1.61 (0.78 to 3.33) |
1.25 (0.77 to 2.03) |
1.03 (0.67 to 1.59) |
1.12 (0.59 to 2.13) |
1.05 (0.42 to 2.68) |
0.88 (0.59 to 1.32) |
1.50*** (1.18 to 1.92) |
0.97 (0.67 to 1.40) |
1.27 (0.91 to 1.76) |
1.10 (0.79 to 1.54) |
0.375 |
| Depression | 1.39 (0.82 to 2.36) |
1.96* (1.02 to 3.79) |
1.48 (0.86 to 2.56) |
1.39 (0.93 to 2.07) |
1.77* (1.13 to 2.76) |
1.07 (0.63 to 1.82) |
1.29 (0.64 to 2.58) |
1.78*** (1.29 to 2.45) |
1.18 (0.92 to 1.52) |
1.06 (0.78 to 1.44) |
1.25 (0.87 to 1.79) |
1.14 (0.85 to 1.54) |
0.025 |
| Impaired cognition | 1.76 (0.77 to 4.06) |
1.28 (0.57 to 2.86) |
2.24* (1.04 to 4.83) |
1.38 (0.80 to 2.38) |
2.02** (1.30 to 3.14) |
2.24** (1.21 to 4.14) |
1.13 (0.41 to 3.16) |
1.33 (0.89 to 2.00) |
1.47* (1.04 to 2.08) |
1.11 (0.75 to 1.63) |
1.42* (1.02 to 1.99) |
1.54*** (1.04 to 2.30) |
0.334 |
All Odds ratios are adjusted for other factors in the table and self-reported falling at baseline. *p<0.05; **p<0.01; ***p<0.001
†We tested for the significance of between-country differences in the strength of the association between predictors (socio-demographic and intrinsic risk factors) and falling by including data from all countries in one logistic regression model and adding an interaction term for country(dummy)*predictor, for each predictor separately.
ADL, Activities of daily living; SRH, self-rated health.
Associations between the seven intrinsic factors and falling were in a positive direction in almost all countries. The only exception was having at least one mobility limitation in Germany (OR=0.44; 95% CI 0.19 to 0.98), although this was in a positive direction (non-significant) in univariable analysis. Having at least one mobility limitation and impaired cognition were most often significantly associated with falling (ORs varying from 0.44 to 2.06 and from 1.42 to 2.24, respectively).
In countries where intrinsic fall risk factors were more prevalent (Estonia, Czech Republic, Spain, Italy, France and Belgium) the contribution of a specific fall risk factor was lower (ORs varying from 1.42 to 1.97) than in the other countries where fall risk factors were less prevalent (ORs varying from 1.72 to 5.19). These differences were significant for factors age ≥80 years, less than good SRH, mobility limitations, ADL limitations, dizziness and depression (p<0.05; table 2, last column).
Country differences in falling
In the unadjusted model, differences in falling between Switzerland and six countries (The Netherlands, Belgium, France, Spain, Czech Republic and Estonia) were significant (table 3, model 1). After adjusting for socio-demographic factors, ORs changed −44.4% to 22.4% (model 2). In all countries attenuation of ORs was strongest when additionally adjusting for fall risk factors related to physical health (mobility limitations, ADL limitations, dizziness, SRH and vision) (model 4). In the final model (model 5), differences in falling between Switzerland and four countries (The Netherlands, Belgium, France and Czech Republic) remained significant. All ORs were strongly attenuated (varying from 21.9% for The Netherlands to 149.0% for Italy).
Table 3.
Associations (ORs and 95% CIs) between countries and self-reported falling adjusted for socio-demographic factors and intrinsic fall risk factors among persons from 12 countries in the Survey of Health, Ageing and Retirement in Europe, 2010–2013; n=17 575.
| Model 1: univariate† |
Model 2: socio-demographic‡ adjusted |
Model 3: mental health§ adjusted |
Model 4: physical health¶ adjusted |
Model 5: adjusted for all†† variables |
|
| Switzerland | 1 | 1 | 1 | 1 | 1 |
| Denmark | 1.28 (0.94 to 1.74) | 1.24 (0.90 to 1.70) | 1.25 (0.90 to 1.72) | 1.09 (0.79 to 1.51) | 1.12 (0.80 to 1.55) |
| Sweden | 1.23 (0.91 to 1.66) | 1.22 (0.90 to 1.67) | 1.23 (0.90 to 1.69) | 1.11 (0.81 to 1.51) | 1.14 (0.83 to 1.57) |
| Austria | 1.18 (0.91 to 1.52) | 1.15 (0.88 to 1.50) | 1.10 (0.84 to 1.44) | 0.93 (0.71 to 1.21) | 0.92 (0.70 to 1.22) |
| Italy | 1.30 (0.99 to 1.71) | 1.31 (0.99 to 1.74) | 1.06 (0.79 to 1.42) | 0.93 (0.69 to 1.24) | 0.85 (0.63 to 1.15) |
| Netherlands | 1.48**(1.11 to 1.97) | 1.39**(1.04 to 1.88) | 1.44*(1.07 to 1.95) | 1.33 (0.98 to 1.79) | 1.38*(1.02 to 1.86) |
| Germany | 1.36 (0.96 to 1.91) | 1.52*(1.07 to 2.17) | 1.41 (0.98 to 2.02) | 1.13 (0.79 to 1.62) | 1.13 (0.78 to 1.63) |
| Belgium | 1.78***(1.39 to 2.29) | 1.65***(1.27 to 2.13) | 1.47**(1.13 to 1.91) | 1.34*(1.03 to 1.74) | 1.31*(1.00 to 1.71) |
| Estonia | 1.83***(1.45 to 2.32) | 1.80***(1.42 to 2.29) | 1.53***(1.19 to 1.95) | 1.09 (0.85 to 1.40) | 1.06 (0.82 to 1.37) |
| France | 2.07***(1.62 to 2.63) | 1.83***(1.42 to 2.36) | 1.60***(1.23 to 2.07) | 1.51**(1.17 to 1.95) | 1.42**(1.09 to 1.84) |
| Spain | 2.10***(1.64 to 2.70) | 1.96***(1.50 to 2.55) | 1.45**(1.10 to 1.91) | 1.39*(1.06 to 1.83) | 1.22 (0.92 to 1.62) |
| Czech Republic | 2.30***(1.81 to 2.92) | 2.35***(1.84 to 3.01) | 2.23***(1.73 to 2.86) | 1.78***(1.39 to 2.30) | 1.79***(1.38 to 2.31) |
*p<0.05; **p<0.01; ***p<0.001.
†Adjusted for self-reported falling at baseline.
‡Adjusted for model 1 and socio-demographic factors (sex, age, education level and living situation).
§Adjusted for model 2, depression and impaired cognition.
¶Adjusted for model 2, mobility limitations, activities of daily living (ADL) limitations, dizziness, less than good self-rated health (SRH) and impaired vision.
††Adjusted for model 2, mobility limitations, ADL limitations, dizziness, less than good SRH, impaired vision, depression and impaired cognition.
Discussion
Main study findings
The results of this study show considerable variation in the rate of falling and prevalence of intrinsic fall risk factors between European countries. Between-country differences in falling largely persisted after adjusting for socio-demographic differences, but were strongly attenuated after adjusting for differences in intrinsic fall risk factors.
Comparison with other findings
The rate of falling observed in the different countries (between 7.9% and 16.2% within 6 months) was on the low end of the rate reported in the literature, which is between 20% and 40% within 12 months.2 14 36–38 In our study, falling was assessed retrospectively by asking whether a person was bothered by falling in the past 6 months. Preferably falls are measured prospectively on a weekly basis, as specificity of retrospective self-report is high but the sensitivity is lower (80–89%),39 so there might have been a recall bias. Measuring falls prospectively is however a time-intensive procedure and not feasible for larger surveys. However, we believe the reason for the lower rate is predominantly due to the specific formulation of the question, as it assessed whether the person was bothered by the fall, this might have resulted in a tendency towards only reporting more serious falls.
Differences in wealth and expenditure on elderly care between countries play a role in the between-country variations in falling and intrinsic fall risk we found.40 Older citizens in the original EU-15 countries are in better health compared with those in eastern European countries and within the EU-15 countries a north–south gradient for several health indicators at older age has been shown.40–43 In our study, rate of falling and prevalence of fall risk was higher in Spain, Estonia and the Czech Republic and also Belgium and France, compared with the other countries. The Organisation for Economic Co-operation and Development (OECD) reports a lower proportion of institutionalised long-term care recipients aged >65 years in southern and eastern European countries, but also in Belgium and France.44 As our study only includes community-dwelling older citizens, this could partly explain a higher rate of falling and prevalence of intrinsic fall risk in these countries, where more persons in poor health are living independently.
Intrinsic risk factors, and mobility and balance problems in particular, have been shown to be most important in the aetiology of falling.1 19 20 In our study, limitations in physical health factors explained the largest part of between-country differences, having one or more mobility limitations was significantly associated with falling in many countries and highly prevalent among most countries. The strength of the association of several intrinsic risk factors and older age with falling differed between countries. In countries where intrinsic fall risk factors were more prevalent, the impact of these intrinsic risk factors and older age on falling was smaller compared with the other countries. In these countries, we found a relatively high risk for falling in the group <80 years and the group who did not have these intrinsic risk factors, which could explain this finding. This could suggest that in these countries other conditions, such as frailty, contribute more to falling and occur at an earlier age.42
Persons in Italy and especially men had a relatively low rate of falling and a high prevalence of intrinsic fall risk compared with other countries. Interestingly, an Australian study found a lower fall rate among Italian-born immigrant men, which they also could not explain by established fall risk factors.45 This contrasts our other findings, where we found a high intrinsic fall risk in countries with a high rate of falling. As we did not include environmental fall risk factors, it is possible that differences in extrinsic hazards such as floor coverings and home maintenance contribute to this finding. Additionally, it is possible that outdoor and indoor activity patterns associated with increased fall risk differ by culture (such as cycling, fast walking, housekeeping and taking stairs). Older persons in northern countries have been found to be more physically active compared with older persons living in southern countries.35 46 In The Netherlands cycling is a common form of transportation and largely contributes to outdoor falls,47 this could clarify our finding that the prevalence of intrinsic fall risk could to a smaller extent explain falling in The Netherlands. Future studies should investigate the impact of cultural differences in activity patterns and extrinsic risk factors on between-country differences in falling.
Strengths and weaknesses
To our knowledge, this is the first study comparing falling and fall risk among European countries. Previous studies have compared few countries or used centre-based data.13 15 This study has the advantage of using standardised methods for data collection and data from nationally representative samples of those aged 65 years and over from 12 European countries. By the use of survey data, we were able to capture many intrinsic fall risk factors. The longitudinal design ensured that the intrinsic fall risk factors preceded fall outcomes.
This study has some limitations. Between baseline and follow-up interviews, 25.7% of persons were lost to follow-up. These persons were older, had a higher intrinsic fall risk and more often reported a fall at baseline. Attrition was highest in Germany, France and the Czech Republic, which might have resulted in an underestimation of the rate of falling, especially in these countries. This, however, does not affect the overall trend seen between countries as the rate of falling in these countries was on the high end of the spectrum. Furthermore, we corrected for attrition and mortality using sampling weights calibrated against the national populations. Second, we did not have information on the number of falls (recurrent or first time fall) or place of fall. Studies suggest that indoor falls are more often due to intrinsic fall risk and outdoor falls due to environmental risk factors.48 49 Recurrent falls have been found to occur among persons with poorer health and higher intrinsic fall risk.50 51 In an additional analysis we compared persons who reported falling in both wave 4 and 5, with persons who only reported falling in wave 5 and indeed found stronger associations between intrinsic risk factors and falling for the first group (Table S2). Third, to minimise cross-cultural differences in translation of questions, SHARE uses the TRAPD method (translation, review, adjudication, pretesting, and documentation) developed for translation of cross-cultural surveys.52 53 However, it remains possible that cultural differences in the interpretation of a survey question might have caused some variation between countries. Finally, in the full model with all countries, we did not take into account the country–predictor interactions as all associations were consistent in the direction of the effect, pointing toward an increase in fall risk. In a sensitivity analysis we added interaction terms between predictors and country separately; the changes to our findings were marginal (data not shown).
Conclusion
In conclusion, there is considerable variation in rate of falling among citizens aged ≥65 years between European countries, which can largely be explained by between-country variation in the prevalence of intrinsic fall risk factors. There are also country-specific variations in the association between these intrinsic risk factors and falling. These findings emphasise the importance of addressing intrinsic fall risk in (inter)national fall-prevention strategies, while highlighting country-specific priorities.
Supplementary Material
Acknowledgments
This paper uses data from SHARE release 4.1.1, as of 28 March 2013, and SHARE release 5.1.0, as of 31 March 2015. The SHARE data collection has been primarily funded by the European Commission through the fifth framework programme (project QLK6-CT-2001–00 360 in the thematic programme Quality of Life), through the sixth framework programme (projects SHARE-I3, RII-CT- 2006–0 62 193; COMPARE, CIT5-CT-2005–0 28 857; and SHARELIFE, CIT4-CT-2006–0 28 812) and through the seventh framework programme (SHARE-PREP, 2 11 909 and SHARE- LEAP, 227822). Additional funding from the US National Institute on Ageing (U01 AG09740-13S2, P01 AG005842, P01 AG08291, P30 AG12815, Y1-AG-4553–01 and OGHA 04–064, IAG BSR06-11, R21 AG025169) as well as from various national sources is gratefully acknowledged (see http://www.share-project.org/contact-organisation/funding.html for a full list of funding institutions).
Footnotes
Contributors: CF designed the study, did the main quantitative analyses, and wrote the first draft and final draft of the manuscript. HR designed the study, advised on quantitative analysis, contributed to the interpretation of findings, made critical revisions and approved the final version. JR designed the study, contributed to the interpretation of findings, made critical revisions and approved the final version. EB contributed to the interpretation of findings, made critical revisions, and approved the final version. AB contributed to the interpretation of findings, made critical revisions, and approved the final version. FMR contributed to the interpretation of findings, made critical revisions, and approved the final version. AvdH contributed to the interpretation of findings, made critical revisions, and approved the final version. AvG contributed to the interpretation of findings, made critical revisions, and approved the final version. IK contributed to the interpretation of findings, made critical revisions, and approved the final version.
Competing interests: None declared.
Patient consent: This article uses anonymised data.
Ethics approval: Institutional review board at University of Mannheim.
Provenance and peer review: Not commissioned; externally peer reviewed.
Data sharing statement: Data are available upon request from the SHARE website (see http://www.share-project.org/data-access/user-registration.html).
References
- 1. Deandrea S, Lucenteforte E, Bravi F, et al. Risk factors for falls in community-dwelling older people: a systematic review and meta-analysis. Epidemiology 2010;21:658–68. 10.1097/EDE.0b013e3181e89905 [DOI] [PubMed] [Google Scholar]
- 2. Morrison A, Fan T, Sen SS, et al. Epidemiology of falls and osteoporotic fractures: a systematic review. Clinicoecon Outcomes Res 2013;5:9–18. 10.2147/CEOR.S38721 [DOI] [PMC free article] [PubMed] [Google Scholar]
- 3. Gillespie LD, Robertson MC, Gillespie WJ, et al. Interventions for preventing falls in older people living in the community. Cochrane Database Syst Rev 2012;9:CD007146 10.1002/14651858.CD007146.pub3 [DOI] [PMC free article] [PubMed] [Google Scholar]
- 4. Hartholt KA, van Beeck EF, Polinder S, et al. Societal consequences of falls in the older population: injuries, healthcare costs, and long-term reduced quality of life. J Trauma 2011;71:748–53. 10.1097/TA.0b013e3181f6f5e5 [DOI] [PubMed] [Google Scholar]
- 5. Tinetti ME, Williams CS. The effect of falls and fall injuries on functioning in community-dwelling older persons. J Gerontol A Biol Sci Med Sci 1998;53:M112–M119. 10.1093/gerona/53A.2.M112 [DOI] [PubMed] [Google Scholar]
- 6. Peeters G, van Schoor NM, Lips P. Fall risk: the clinical relevance of falls and how to integrate fall risk with fracture risk. Best Pract Res Clin Rheumatol 2009;23:797–804. 10.1016/j.berh.2009.09.004 [DOI] [PubMed] [Google Scholar]
- 7. De Laet CE, van Hout BA, Burger H, et al. Incremental cost of medical care after hip fracture and first vertebral fracture: the Rotterdam study. Osteoporos Int 1999;10:66–72. 10.1007/s001980050196 [DOI] [PubMed] [Google Scholar]
- 8. Tinetti ME, Mendes de Leon CF, Doucette JT, et al. Fear of falling and fall-related efficacy in relationship to functioning among community-living elders. J Gerontol 1994;49:M140–M147. 10.1093/geronj/49.3.M140 [DOI] [PubMed] [Google Scholar]
- 9. Jørstad EC, Hauer K, Becker C, et al. Measuring the psychological outcomes of falling: a systematic review. J Am Geriatr Soc 2005;53:501–10. 10.1111/j.1532-5415.2005.53172.x [DOI] [PubMed] [Google Scholar]
- 10. Tinetti ME, Kumar C. The patient who falls: "It's always a trade-off". JAMA 2010;303:258–-66. 10.1001/jama.2009.2024 [DOI] [PMC free article] [PubMed] [Google Scholar]
- 11. Gillespie LD, Robertson MC, Gillespie WJ, et al. Interventions for preventing falls in older people living in the community. Cochrane Database Syst Rev 2009:CD007146 (published Online First: 2009/04/17). 10.1002/14651858.CD007146.pub2 [DOI] [PubMed] [Google Scholar]
- 12. European Innovation Partnership on active and healthy ageing. Specific Action on innovation in support of ‘Personalized health management, starting with a Falls Prevention Initiative’ Brussels European Commision. 2013. https://ec.europa.eu/eip/ageing/sites/eipaha/files/library/51a44f911f647_a2_action_plan.pdf.
- 13. Roy DK, Pye SR, Lunt M, et al. Falls explain between-center differences in the incidence of limb fracture across Europe. Bone 2002;31:712–7. 10.1016/S8756-3282(02)00909-2 [DOI] [PubMed] [Google Scholar]
- 14. Peel NM. Epidemiology of falls in older age. Can J Aging 2011;30:7–19. 10.1017/S071498081000070X [DOI] [PubMed] [Google Scholar]
- 15. Karlsson MK, Ribom EL, Nilsson JA, et al. International and ethnic variability of falls in older men. Scand J Public Health 2014;42::194–200. [DOI] [PubMed] [Google Scholar]
- 16. Ganz DA, Bao Y, Shekelle PG, et al. Will my patient fall? JAMA 2007;297:77–86. 10.1001/jama.297.1.77 [DOI] [PubMed] [Google Scholar]
- 17. Leipzig RM, Cumming RG, Tinetti ME. Drugs and falls in older people: a systematic review and meta-analysis: II. cardiac and analgesic drugs. J Am Geriatr Soc 1999;47:40–50. 10.1111/j.1532-5415.1999.tb01899.x [DOI] [PubMed] [Google Scholar]
- 18. Leipzig RM, Cumming RG, Tinetti ME. Drugs and falls in older people: a systematic review and meta-analysis: I. Psychotropic drugs. J Am Geriatr Soc 1999;47:30–9. 10.1111/j.1532-5415.1999.tb01898.x [DOI] [PubMed] [Google Scholar]
- 19. Tinetti ME, Speechley M, Ginter SF. Risk factors for falls among elderly persons living in the community. N Engl J Med 1988;319:1701–7. 10.1056/NEJM198812293192604 [DOI] [PubMed] [Google Scholar]
- 20. National Institute for Clinical E. Clinical practice guideline for the assessment and prevention of falls in Older people: guidelines commissioned by the National Institute for Clinical excellence (NICE). London: Royal College of Nursing, 2004. [PubMed] [Google Scholar]
- 21. Costello E, Edelstein JE. Update on falls prevention for community-dwelling older adults: review of single and multifactorial intervention programs. J Rehabil Res Dev 2008;45:1135–52. 10.1682/JRRD.2007.10.0169 [DOI] [PubMed] [Google Scholar]
- 22. Börsch-Supan A, Brandt M, Hunkler C, et al. SHARE Central Coordination Team. Data Resource Profile: the Survey of Health, Ageing and Retirement in Europe (SHARE). Int J Epidemiol 2013;42:992–1001. 10.1093/ije/dyt088 [DOI] [PMC free article] [PubMed] [Google Scholar]
- 23. Malter F, Börsch-Supan A. Munich Center for the Economics of A. SHARE Wave 5 Innovations & Methodology 2015. [Google Scholar]
- 24. Perell KL, Nelson A, Goldman RL, et al. Fall risk assessment measures: an analytic review. J Gerontol A Biol Sci Med Sci 2001;56:M761–M766. 10.1093/gerona/56.12.M761 [DOI] [PubMed] [Google Scholar]
- 25. Ware JE, Stewart AL. Measuring functioning and well-being: the medical outcomes study approach. Durham: Duke University Press, 1993. [Google Scholar]
- 26. Hiel L, Beenackers MA, Renders CM, et al. Providing personal informal care to older European adults: should we care about the caregivers' health? Prev Med 2015;70:64–8. 10.1016/j.ypmed.2014.10.028 [DOI] [PubMed] [Google Scholar]
- 27. Ware JE, Sherbourne CD. The MOS 36-item short-form health survey (SF-36). I. Conceptual framework and item selection. Med Care 1992;30:473–83. [PubMed] [Google Scholar]
- 28. Katz S, Ford AB, Moskowitz RW, et al. Studies of illness in the aged. The index of ADL: a standardized measure of biological and psychosocial function. JAMA 1963;185:914–9. [DOI] [PubMed] [Google Scholar]
- 29. Prince MJ, Reischies F, Beekman AT, et al. Development of the EURO-D scale--a European, Union initiative to compare symptoms of depression in 14 European centres. Br J Psychiatry 1999;174:330–8. 10.1192/bjp.174.4.330 [DOI] [PubMed] [Google Scholar]
- 30. Castro-Costa E, Dewey M, Stewart R, et al. Ascertaining late-life depressive symptoms in Europe: an evaluation of the survey version of the EURO-D scale in 10 nations. the SHARE project. Int J Methods Psychiatr Res 2008;17:12–29. 10.1002/mpr.236 [DOI] [PMC free article] [PubMed] [Google Scholar]
- 31. Börsch-Supan A. First results from the survey of health. Ageing and retirement in Europe (2004-2007): starting the longitudinal dimension. Mannheim: Mannheim Research Institute for the Economicss of Aging (MEA), 2008. [Google Scholar]
- 32. Lee S, Kawachi I, Berkman LF, et al. Education, other socioeconomic indicators, and cognitive function. Am J Epidemiol 2003;157:712–20. 10.1093/aje/kwg042 [DOI] [PubMed] [Google Scholar]
- 33. Leist AK, Glymour MM, Mackenbach JP, et al. Time away from work predicts later cognitive function: differences by activity during leave. Ann Epidemiol 2013;23:455–62. 10.1016/j.annepidem.2013.05.014 [DOI] [PMC free article] [PubMed] [Google Scholar]
- 34. Solon G, Haider S, Wooldridge JM, et al. What are we weighting for? Cambridge, Mass.: national Bureau of Economic Research, 2013. [Google Scholar]
- 35. Croezen S, Avendano M, Burdorf A, et al. Social participation and depression in old age: a fixed-effects analysis in 10 European countries. Am J Epidemiol 2015;182:168–76. 10.1093/aje/kwv015 [DOI] [PMC free article] [PubMed] [Google Scholar]
- 36. de Rekeneire N, Visser M, Peila R, et al. Is a fall just a fall: correlates of falling in healthy older persons. the Health, Aging and Body Composition Study. J Am Geriatr Soc 2003;51:841–6. 10.1046/j.1365-2389.2003.51267.x [DOI] [PubMed] [Google Scholar]
- 37. Bath PA, Morgan K. Differential risk factor profiles for indoor and outdoor falls in older people living at home in Nottingham, UK. Eur J Epidemiol 1999;15:65–73. 10.1023/A:1007531101765 [DOI] [PubMed] [Google Scholar]
- 38. Tromp AM, Smit JH, Deeg DJ, et al. Predictors for falls and fractures in the Longitudinal Aging Study Amsterdam. J Bone Miner Res 1998;13:1932–9. 10.1359/jbmr.1998.13.12.1932 [DOI] [PubMed] [Google Scholar]
- 39. Ganz DA, Higashi T, Rubenstein LZ. Monitoring falls in cohort studies of community-dwelling older people: effect of the recall interval. J Am Geriatr Soc 2005;53:2190–4. 10.1111/j.1532-5415.2005.00509.x [DOI] [PubMed] [Google Scholar]
- 40. Jagger C, Gillies C, Moscone F, et al. Inequalities in healthy life years in the 25 countries of the European Union in 2005: a cross-national meta-regression analysis. The Lancet 2008;372:2124–31. 10.1016/S0140-6736(08)61594-9 [DOI] [PubMed] [Google Scholar]
- 41. Castro-Costa E, Dewey M, Stewart R, et al. Prevalence of depressive symptoms and syndromes in later life in ten European countries: the SHARE study. Br J Psychiatry 2007;191:393–401. 10.1192/bjp.bp.107.036772 [DOI] [PubMed] [Google Scholar]
- 42. Etman A, Burdorf A, Van der Cammen TJ, et al. Socio-demographic determinants of worsening in frailty among community-dwelling older people in 11 European countries. J Epidemiol Community Health 2012;66:1116–21. 10.1136/jech-2011-200027 [DOI] [PubMed] [Google Scholar]
- 43. Santos-Eggimann B, Cuenoud P, Spagnoli J, et al. Prevalence of frailty in middle-aged and older community-dwelling europeans living in 10 countries. J Gerontol A Biol Sci Med Sci 2009;64:675-–81. [DOI] [PMC free article] [PubMed] [Google Scholar]
- 44. Organisation for Economic Co-operation and Development. OECD Health Statistics 2015 2015 [01/10/2015]. http://www.oecd.org/els/health-systems/health-data.htm.
- 45. Stanaway FF, Cumming RG, Naganathan V, et al. Ethnicity and falls in older men: low rate of falls in Italian-born men in Australia. Age Ageing 2011;40:595–601. 10.1093/ageing/afr067 [DOI] [PubMed] [Google Scholar]
- 46. Schaap MM, van Agt HM, Kunst AE. Identification of socioeconomic groups at increased risk for smoking in European countries: looking beyond educational level. Nicotine Tob Res 2008;10:359–69. 10.1080/14622200701825098 [DOI] [PubMed] [Google Scholar]
- 47. Boyé ND, Mattace-Raso FU, Van der Velde N, et al. Circumstances leading to injurious falls in older men and women in the Netherlands. Injury 2014;45:1224–30. 10.1016/j.injury.2014.03.021 [DOI] [PubMed] [Google Scholar]
- 48. Speechley M, Tinetti M. Falls and injuries in frail and vigorous community elderly persons. J Am Geriatr Soc 1991;39:46–52. 10.1111/j.1532-5415.1991.tb05905.x [DOI] [PubMed] [Google Scholar]
- 49. Kelsey JL, Procter-Gray E, Hannan MT, et al. Heterogeneity of falls among older adults: implications for public health prevention. Am J Public Health 2012;102:2149–56. 10.2105/AJPH.2012.300677 [DOI] [PMC free article] [PubMed] [Google Scholar]
- 50. Boyé ND, Mattace-Raso FU, Van Lieshout EM, et al. Physical performance and quality of life in single and recurrent fallers: data from the Improving Medication Prescribing to Reduce Risk of Falls study. Geriatr Gerontol Int 2015;15:350–5. 10.1111/ggi.12287 [DOI] [PubMed] [Google Scholar]
- 51. Pluijm SM, Smit JH, Tromp EA, et al. A risk profile for identifying community-dwelling elderly with a high risk of recurrent falling: results of a 3-year prospective study. Osteoporos Int 2006;17:417–25. 10.1007/s00198-005-0002-0 [DOI] [PubMed] [Google Scholar]
- 52. Börsch-Supan A, Alcser KH. Mannheim Research Institute for the Economics of A. the survey of health, aging [ageing], and retirement in Europe methodology. Mannheim: MEA, 2005. SHARE, survey of health, ageing and retirement in Europe. [Google Scholar]
- 53. Harkness JA, FJRvd V, Mohler PP. Cross-cultural survey methods. Hoboken: J. Wiley, 2003. [Google Scholar]
Associated Data
This section collects any data citations, data availability statements, or supplementary materials included in this article.
Supplementary Materials
bmjopen-2017-015827supp001.pdf (221.8KB, pdf)