

Abstract
Background
Approximately 30% of people over 65 years of age living in the community fall each year. This is an update of a Cochrane review first published in 2009.
Objectives
To assess the effects of interventions designed to reduce the incidence of falls in older people living in the community.
Search methods
We searched the Cochrane Bone, Joint and Muscle Trauma Group Specialised Register (February 2012), CENTRAL (The Cochrane Library 2012, Issue 3), MEDLINE (1946 to March 2012), EMBASE (1947 to March 2012), CINAHL (1982 to February 2012), and online trial registers.
Selection criteria
Randomised trials of interventions to reduce falls in community‐dwelling older people.
Data collection and analysis
Two review authors independently assessed risk of bias and extracted data. We used a rate ratio (RaR) and 95% confidence interval (CI) to compare the rate of falls (e.g. falls per person year) between intervention and control groups. For risk of falling, we used a risk ratio (RR) and 95% CI based on the number of people falling (fallers) in each group. We pooled data where appropriate.
Main results
We included 159 trials with 79,193 participants. Most trials compared a fall prevention intervention with no intervention or an intervention not expected to reduce falls. The most common interventions tested were exercise as a single intervention (59 trials) and multifactorial programmes (40 trials). Sixty‐two per cent (99/159) of trials were at low risk of bias for sequence generation, 60% for attrition bias for falls (66/110), 73% for attrition bias for fallers (96/131), and only 38% (60/159) for allocation concealment.
Multiple‐component group exercise significantly reduced rate of falls (RaR 0.71, 95% CI 0.63 to 0.82; 16 trials; 3622 participants) and risk of falling (RR 0.85, 95% CI 0.76 to 0.96; 22 trials; 5333 participants), as did multiple‐component home‐based exercise (RaR 0.68, 95% CI 0.58 to 0.80; 7 trials; 951 participants and RR 0.78, 95% CI 0.64 to 0.94; 6 trials; 714 participants). For Tai Chi, the reduction in rate of falls bordered on statistical significance (RaR 0.72, 95% CI 0.52 to 1.00; 5 trials; 1563 participants) but Tai Chi did significantly reduce risk of falling (RR 0.71, 95% CI 0.57 to 0.87; 6 trials; 1625 participants). Overall, exercise interventions significantly reduced the risk of sustaining a fall‐related fracture (RR 0.34, 95% CI 0.18 to 0.63; 6 trials; 810 participants).
Multifactorial interventions, which include individual risk assessment, reduced rate of falls (RaR 0.76, 95% CI 0.67 to 0.86; 19 trials; 9503 participants), but not risk of falling (RR 0.93, 95% CI 0.86 to 1.02; 34 trials; 13,617 participants).
Overall, vitamin D did not reduce rate of falls (RaR 1.00, 95% CI 0.90 to 1.11; 7 trials; 9324 participants) or risk of falling (RR 0.96, 95% CI 0.89 to 1.03; 13 trials; 26,747 participants), but may do so in people with lower vitamin D levels before treatment.
Home safety assessment and modification interventions were effective in reducing rate of falls (RaR 0.81, 95% CI 0.68 to 0.97; 6 trials; 4208 participants) and risk of falling (RR 0.88, 95% CI 0.80 to 0.96; 7 trials; 4051 participants). These interventions were more effective in people at higher risk of falling, including those with severe visual impairment. Home safety interventions appear to be more effective when delivered by an occupational therapist.
An intervention to treat vision problems (616 participants) resulted in a significant increase in the rate of falls (RaR 1.57, 95% CI 1.19 to 2.06) and risk of falling (RR 1.54, 95% CI 1.24 to 1.91). When regular wearers of multifocal glasses (597 participants) were given single lens glasses, all falls and outside falls were significantly reduced in the subgroup that regularly took part in outside activities. Conversely, there was a significant increase in outside falls in intervention group participants who took part in little outside activity.
Pacemakers reduced rate of falls in people with carotid sinus hypersensitivity (RaR 0.73, 95% CI 0.57 to 0.93; 3 trials; 349 participants) but not risk of falling. First eye cataract surgery in women reduced rate of falls (RaR 0.66, 95% CI 0.45 to 0.95; 1 trial; 306 participants), but second eye cataract surgery did not.
Gradual withdrawal of psychotropic medication reduced rate of falls (RaR 0.34, 95% CI 0.16 to 0.73; 1 trial; 93 participants), but not risk of falling. A prescribing modification programme for primary care physicians significantly reduced risk of falling (RR 0.61, 95% CI 0.41 to 0.91; 1 trial; 659 participants).
An anti‐slip shoe device reduced rate of falls in icy conditions (RaR 0.42, 95% CI 0.22 to 0.78; 1 trial; 109 participants). One trial (305 participants) comparing multifaceted podiatry including foot and ankle exercises with standard podiatry in people with disabling foot pain significantly reduced the rate of falls (RaR 0.64, 95% CI 0.45 to 0.91) but not the risk of falling.
There is no evidence of effect for cognitive behavioural interventions on rate of falls (RaR 1.00, 95% CI 0.37 to 2.72; 1 trial; 120 participants) or risk of falling (RR 1.11, 95% CI 0.80 to 1.54; 2 trials; 350 participants).
Trials testing interventions to increase knowledge/educate about fall prevention alone did not significantly reduce the rate of falls (RaR 0.33, 95% CI 0.09 to 1.20; 1 trial; 45 participants) or risk of falling (RR 0.88, 95% CI 0.75 to 1.03; 4 trials; 2555 participants).
Thirteen trials provided a comprehensive economic evaluation. Three of these indicated cost savings for their interventions during the trial period: home‐based exercise in over 80‐year‐olds, home safety assessment and modification in those with a previous fall, and one multifactorial programme targeting eight specific risk factors.
Authors' conclusions
Group and home‐based exercise programmes, and home safety interventions reduce rate of falls and risk of falling.
Multifactorial assessment and intervention programmes reduce rate of falls but not risk of falling; Tai Chi reduces risk of falling.
Overall, vitamin D supplementation does not appear to reduce falls but may be effective in people who have lower vitamin D levels before treatment.
Keywords: Aged; Female; Humans; Male; Accidental Falls; Accidental Falls/prevention & control; Accidents, Home; Accidents, Home/prevention & control; Bone Density Conservation Agents; Bone Density Conservation Agents/administration & dosage; Environment Design; Exercise; Independent Living; Independent Living/injuries; Patient Education as Topic; Randomized Controlled Trials as Topic; Tai Ji; Vitamin D; Vitamin D/administration & dosage
Plain language summary
Interventions for preventing falls in older people living in the community
As people get older, they may fall more often for a variety of reasons including problems with balance, poor vision, and dementia. Up to 30% may fall in a year. Although one in five falls may require medical attention, less than one in 10 results in a fracture.
This review looked at the healthcare literature to establish which fall prevention interventions are effective for older people living in the community, and included 159 randomised controlled trials with 79,193 participants.
Group and home‐based exercise programmes, usually containing some balance and strength training exercises, effectively reduced falls, as did Tai Chi. Overall, exercise programmes aimed at reducing falls appear to reduce fractures.
Multifactorial interventions assess an individual's risk of falling, and then carry out treatment or arrange referrals to reduce the identified risks. Overall, current evidence shows that this type of intervention reduces the number of falls in older people living in the community but not the number of people falling during follow‐up. These are complex interventions, and their effectiveness may be dependent on factors yet to be determined.
Interventions to improve home safety appear to be effective, especially in people at higher risk of falling and when carried out by occupational therapists. An anti‐slip shoe device worn in icy conditions can also reduce falls.
Taking vitamin D supplements does not appear to reduce falls in most community‐dwelling older people, but may do so in those who have lower vitamin D levels in the blood before treatment.
Some medications increase the risk of falling. Three trials in this review failed to reduce the number of falls by reviewing and adjusting medications. A fourth trial involving family physicians and their patients in medication review was effective in reducing falls. Gradual withdrawal of a particular type of drug for improving sleep, reducing anxiety, and treating depression (psychotropic medication) has been shown to reduce falls.
Cataract surgery reduces falls in women having the operation on the first affected eye. Insertion of a pacemaker can reduce falls in people with frequent falls associated with carotid sinus hypersensitivity, a condition which causes sudden changes in heart rate and blood pressure.
In people with disabling foot pain, the addition of footwear assessment, customised insoles, and foot and ankle exercises to regular podiatry reduced the number of falls but not the number of people falling.
The evidence relating to the provision of educational materials alone for preventing falls is inconclusive.
Background
Description of the condition
About a third of community‐dwelling people over 65 years old fall each year (Campbell 1990; Tinetti 1988), and the rate of fall‐related injuries increases with age (Peel 2002). Falls can have serious consequences, e.g. fractures and head injuries (Peel 2002). Around 10% of falls result in a fracture (Campbell 1990; Tinetti 1988); fall‐associated fractures in older people are a significant source of morbidity and mortality (Keene 1993). Most fall‐related injuries are minor: bruising, abrasions, lacerations, strains, and sprains.
Despite early attempts to achieve a consensus definition of "a fall" (Kellogg 1987) many definitions still exist in the literature. It is particularly important to have a clear, simple definition for studies in which older people record their own falls; their concept of a fall may differ from that of researchers or healthcare professionals (Zecevic 2006). A recent consensus statement defines a fall as "an unexpected event in which the participant comes to rest on the ground, floor, or lower level" (Lamb 2005). The wording recommended when asking participants is "In the past month, have you had any fall including a slip or trip in which you lost your balance and landed on the floor or ground or lower level?" (Lamb 2005).
Risk factors for falling have been identified by epidemiological studies of varying quality. These have been synthesised in a recent systematic review (Deandrea 2010). About 15% of falls result from an external event that would cause most people to fall, a similar proportion have a single identifiable cause such as syncope, and the remainder result from multiple interacting factors (Campbell 2006).
Since many risk factors appear to interact in those who suffer fall‐related fractures (Cummings 1995), it is not clear to what extent interventions designed to prevent falls will also prevent hip or other fall‐associated fractures. Falls can also have psychological consequences: fear of falling and loss of confidence that can result in self restricted activity levels leading to a reduction in physical function and social interactions (Yardley 2002). Falling puts a strain on the family and is an independent predictor of admission to a nursing home (Tinetti 1997).
Description of the intervention
Many preventive intervention programmes based on reported risk factors for falls have been established and evaluated. Some of these specifically target people with a high risk of falling, for example history of a fall or specific fall risk factors. Interventions have included exercise programmes, education programmes, medication optimisation, and environmental modification. In some studies single interventions have been evaluated; in others, interventions with more than one component have been used. Delivery of multiple‐component interventions may be based on individual assessment of risk (a multifactorial intervention) or the same components are provided to all participants (a multiple intervention).
Why it is important to do this review
The best evidence for the efficacy of interventions to prevent falling should emerge from large, well‐conducted randomised controlled trials, or from meta‐analysis of smaller trials. A systematic review is required to identify the large number of trials in this area and summarise the evidence for healthcare professionals, researchers, policy makers, and others with an interest in this topic. This review is an update of a Cochrane review first published in 2009 when the Cochrane review 'Interventions for preventing falls in elderly people' was split into two separate reviews covering interventions for preventing falls in older people living in the community (Gillespie 2009), and interventions for preventing falls in nursing care facilities and hospitals (Cameron 2010).
Objectives
To assess the effects of interventions designed to reduce the incidence of falls in older people living in the community.
Methods
Criteria for considering studies for this review
Types of studies
We included randomised controlled trials and quasi‐randomised trials (e.g. allocation by alternation or date of birth).
Types of participants
We included trials of interventions to prevent falls if they specified an inclusion criterion of 60 years or over. Trials that included younger participants have been included if the mean age minus one standard deviation was more than 60 years. We included trials where the majority of participants were living in the community, either at home or in places of residence that, on the whole, do not provide residential health‐related care or rehabilitative services, for example hostels, retirement villages, or sheltered housing. Trials with mixed populations (community and higher dependency places of residence) were eligible for inclusion in both this review and the Cochrane review on fall prevention in nursing care facilities or hospitals (Cameron 2010) if data were provided for subgroups based on setting. Inclusion in either review was based on the proportion of participants from the relevant setting. We included trials recruiting participants in hospital if the majority were discharged to the community (where falls were recorded).
Trials testing interventions for preventing falls in people post stroke and with Parkinson's disease have been excluded from this version of the review (seeDifferences between protocol and review).
Types of interventions
This review focuses on any intervention designed to reduce falls in older people (i.e. designed to minimise exposure to, or the effect of, any risk factor for falling). We included trials where the intervention was compared with 'usual care' (i.e. no change in usual activities) or a 'placebo' control intervention (i.e. an intervention that is not thought to reduce falls, for example general health education or social visits) or another fall‐prevention intervention.
Types of outcome measures
We included only trials that reported data relating to rate or number of falls, or number of participants sustaining at least one fall during follow‐up (fallers). Prospective daily calendars returned monthly for at least one year from randomisation are the preferred method for recording falls (Lamb 2005). However, we have also included trials where falls were recorded retrospectively, or not monitored continuously throughout the trial. The following are the outcomes for the review.
Primary outcomes
Rate of falls
Number of fallers
Secondary outcomes
Number of participants sustaining fall‐related fractures
Adverse effects of the interventions
Economic outcomes
Search methods for identification of studies
Electronic searches
We searched the Cochrane Bone, Joint and Muscle Trauma Group Specialised Register (February 2012), the Cochrane Central Register of Controlled Trials (The Cochrane Library 2012, Issue 3), MEDLINE (1946 to March 2012), EMBASE (1947 to March 2012), CINAHL (Cumulative Index to Nursing and Allied Health Literature) (1982 to February 2012), and online trial registers. We did not apply any language restrictions.
In MEDLINE (OvidSP) subject‐specific search terms were combined with the sensitivity‐maximising version of the MEDLINE trial search strategy (Lefebvre 2011), but without the drug therapy floating subheading which produced too many spurious references for this review. The strategy was modified for use in The Cochrane Library, EMBASE, and CINAHL (seeAppendix 1).
Searching other resources
We checked reference lists of articles. We also identified ongoing and unpublished trials by contacting researchers in the field.
Data collection and analysis
Selection of studies
One review author (LDG) screened the title, abstract, and descriptors of identified studies for possible inclusion. From the full text, two authors independently assessed potentially eligible trials for inclusion and resolved any disagreement through discussion. We contacted authors for additional information if necessary.
Data extraction and management
Pairs of review authors independently extracted data using a pre‐tested data extraction form. Disagreement was resolved by consensus or third party adjudication.
Assessment of risk of bias in included studies
Two review authors independently assessed risk of bias using the recommendations in the Cochrane Handbook for Systematic Reviews of Interventions (Higgins 2011a). Review authors were not blinded to author and source institution. They did not assess their own trials. Disagreement was resolved by consensus or third party adjudication.
We assessed the following domains: random sequence generation (selection bias); allocation concealment (selection bias); blinding of participants and personnel (performance bias); blinding of outcome assessment (detection bias) for falls and fallers, and for fractures separately; incomplete outcome data (attrition bias) for falls and fallers separately. We also assessed bias in the recall of falls due to unreliable methods of ascertainment (Hannan 2010). We developed criteria for judging risk of bias in fall prevention trials (seeAppendix 2).
We found that many of the descriptive judgements proposed for assessment of attrition bias described in Table 8.5.d of the Cochrane Handbook (Higgins 2011a) were difficult to make and thus to achieve agreement upon. Missing data in falls prevention trials can result from incomplete monitoring of fall events, withdrawals, and deaths. Reasons for a participant withdrawing from a trial can be as diverse as unwillingness to exercise in an exercise group, refusal to maintain the control group activity (e.g. abstain from exercise), an adverse event related to the intervention, or an illness unrelated to falls. Participants who are frailer may be more likely to fall and also more likely to be lost to follow‐up. The fact that fall events are self reported can result in under or over reporting in a particular group. Assessing the level of risk of bias by deciding the extent to which a combination of all potential factors might impact on the true rate of falls and risk of falling in each group was not possible.
Therefore we developed specific criteria for assessing attrition bias using the principles laid out in Section 8.13.2.1 of Higgins 2011a. We classified studies as low, high, or unclear risk of attrition bias using an Excel spreadsheet (seeAppendix 3 for detailed methods).
To explore the possibility of publication bias we constructed funnel plots for all analyses that contained more than 10 data points.
Measures of treatment effect
We have reported the treatment effect for rate of falls as a rate ratio (RaR) and 95% confidence interval. For number of fallers and number of participants sustaining fall‐related fractures, we have reported a risk ratio (RR) and 95% confidence interval. We used results reported at one year if these were available for trials that monitored falls for longer than one year.
Rate of falls
The rate of falls is the total number of falls per unit of person time that falls were monitored (e.g. falls per person year). The rate ratio compares the rate of falls in any two groups during each trial.
We used a rate ratio (for example, incidence rate ratio or hazard ratio for all falls) and 95% confidence interval if these were reported in the paper. If both adjusted and unadjusted rate ratios were reported, we have used the unadjusted estimate unless the adjustment was for clustering. If a rate ratio was not reported but appropriate raw data were available, we used Excel to calculate a rate ratio and 95% confidence interval. We used the reported rate of falls (falls per person year) in each group and the total number of falls for participants contributing data, or we calculated the rate of falls in each group from the total number of falls and the actual total length of time falls were monitored (person years) for participants contributing data. In cases where data were only available for people who had completed the study, or where the trial authors had stated there were no losses to follow‐up, we assumed that these participants had been followed up for the maximum possible period.
Risk of falling
For number of fallers, a dichotomous outcome, we used a risk ratio as the treatment effect. The risk ratio compares the number of people who fell once or more (fallers).
We used a reported estimate of risk (hazard ratio for first fall, risk ratio (relative risk), or odds ratio) and 95% confidence interval if available. If both adjusted and unadjusted estimates were reported we used the unadjusted estimate, unless the adjustment was for clustering. If an odds ratio was reported, or an effect estimate and 95% confidence interval was not, and appropriate data were available, we calculated a risk ratio and 95% confidence interval using the csi command in Stata. For the calculations we used the number of participants contributing data in each group if this was known; if not reported we used the number randomised to each group.
Secondary outcomes
For the number of participants sustaining one or more fall‐related fractures and the number with an adverse event, we used a risk ratio as described in ‘Risk of falling’ above.
Unit of analysis issues
For trials which were cluster‐randomised, for example by medical practice, we performed adjustments for clustering (Higgins 2011b) if this was not done in the published report. We used an intra‐class correlation coefficient (ICC) of 0.01 reported in Smeeth 2002. We ignored the possibility of a clustering effect in trials randomising by household.
For trials with multiple arms, we included only one pair‐wise comparison (intervention versus control) in any analysis in order to avoid the same group of participants being included twice.
Assessment of heterogeneity
We assessed heterogeneity within a pooled group of trials using a combination of visual inspection of the graphs along with consideration of the Chi² test (with statistical significance set at P < 0.10), and the I² statistic (Higgins 2003).
Data synthesis
We grouped interventions using the fall prevention classification system (taxonomy) developed by the Prevention of Falls Network Europe (ProFaNE) (Lamb 2011). Interventions have been grouped by combination (single, multiple, or multifactorial) and then by the type of intervention (descriptors). The possible intervention descriptors are: exercises, medication (drug target, i.e. withdrawal, dose reduction or increase, substitution, provision), surgery, management of urinary incontinence, fluid or nutrition therapy, psychological interventions, environment/assistive technology, social environment, interventions to increase knowledge, other interventions. Full details are available in the ProFaNE Taxonomy Manual.
Within these categories, we grouped the results of trials with comparable interventions and participant characteristics and compiled forest plots using the generic inverse variance method in Review Manager (RevMan 5.1). This method enabled pooling of the adjusted and unadjusted treatment effect estimates (rate ratios or risk ratios) that were reported in the paper or we had calculated from data presented in the paper (seeMeasures of treatment effect). The generic inverse variance option in Review Manager requires entering the natural logarithm of the rate ratio or risk ratio and its standard error for each trial; we calculated these in Excel.
We calculated pooled rate ratios for falls and pooled risk ratios for fallers, fractures, and adverse events with 95% confidence intervals using the fixed‐effect model. Where there was substantial statistical or clinical heterogeneity we pooled the data using the random‐effects model.
Subgroup analysis and investigation of heterogeneity
We minimised heterogeneity as much as possible by grouping trials as described previously. We explored heterogeneity by carrying out the following subgroup analyses.
Higher versus lower falls risk at enrolment (i.e. comparing trials with participants selected for inclusion based on history of falling or other specific risk factors for falling, versus unselected) (a priori).
For vitamin D interventions, trials that recruited participants with lower baseline vitamin D levels versus those that did not (a priori).
For the multifactorial interventions, trials that actively provided treatment to address identified risk factors versus those where the intervention consisted mainly of referral to other services or the provision of information to increase knowledge (a priori).
For home safety interventions we carried out a subgroup analysis based on delivery personnel (i.e. comparing trials with interventions carried out by occupational therapists versus those that were not) (post hoc).
We used the random‐effects model to pool data in all subgroup analyses testing for subgroup differences due to the high risk of false‐positive results when comparing subgroups in a fixed‐effect model (Higgins 2011c). We used the test for subgroup differences available in RevMan 5.1 to determine whether there was evidence for a difference in treatment effect between subgroups.
Economics issues
We have noted the results from any comprehensive economic evaluations incorporated in the included studies, and report the incremental cost per fall prevented and per quality of life year (QALY) gained by the intervention compared with the comparator, as stated by the authors. We also extracted from each trial reporting a cost analysis or cost description, the type of resource use (e.g. delivering the intervention, hospital admissions, outpatient visits) and the cost of the item for each group.
Sensitivity analysis
We carried out post hoc sensitivity analyses to explore the possible impact of risk of bias on statistically significant pooled estimates of treatment effect. We removed trials from pooled analyses if they were assessed as high risk of bias in one or more key domains: random sequence generation (selection bias), allocation concealment (selection bias), blinding of outcome assessors (detection bias), and incomplete outcome data (attrition bias) (seeHiggins 2011a: Table 8.7.a).
Results
Description of studies
Results of the search
The search strategies identified a total of 9690 references (seeAppendix 1). Removal of duplicates and spurious records resulted in 4967 references. We obtained copies of 830 papers for consideration.
Included studies
Fifty‐one additional trials have been included in this update (seeAppendix 4). This review now contains 159 trials with 79,193 participants. Details are provided in the Characteristics of included studies, and are briefly summarised below. Due to the size of the review, not all links to references have been inserted in the text but can be viewed in Appendix 4.
Design
The majority of included studies were individually randomised. Fourteen were cluster‐randomised by place of residence (Assantachai 2002; Huang 2010; Lord 2003; Vetter 1992; Wolf 2003), physician practice (Coleman 1999; Pit 2007; Rubenstein 2007; Spice 2009; Tinetti 1994), health centre (Dangour 2011; Weber 2008), or senior centre (Reinsch 1992; Steinberg 2000).
Nine studies individually randomised participants but also allocated people residing in the same house to the same intervention arm (Brown 2002; Carpenter 1990; Cerny 1998; Dapp 2011; Fox 2010; Harari 2008; Hornbrook 1994; Stevens 2001; Van Rossum 1993). The study by Faes 2011 cluster‐randomised pairs of participants and their caregivers.
One trial used a cross‐over design (Parry 2009).
Sample sizes
Included trials ranged in sample size from 10 (Lannin 2007) to 9940 (Smith 2007). The median sample size was 230 participants.
Setting
The included trials were carried out in 21 countries. Two international multifactorial trials did not specify all the countries that were included: Ryan 2010 (five countries including United Kingdom, and four other countries in Europe and North America), and Ralston 2011 (24 countries including United Kingdom, Belgium, France, USA).
Participants
Overall, 70% of included participants were women. All participants were women in 37 trials (seeAppendix 4), and men in two trials (Gill 2008; Rubenstein 2000).
The inclusion/exclusion criteria and other participant details are listed for each study in the Characteristics of included studies.
Eighty‐three included studies specified a history of falling or evidence of one or more risk factors for falling (other than age or frailty) in their inclusion criteria (seeAppendix 4). Lower serum vitamin D (i.e. vitamin D insufficiency or deficiency) was an inclusion criterion in four trials of vitamin D supplementation (Dhesi 2004; Pfeifer 2000; Pfeifer 2009; Prince 2008) (seeAppendix 5 for baseline vitamin D levels).
Seven trials recruited older people who had recently sustained a hip fracture (Bischoff‐Ferrari 2010; Di Monaco 2008; Harwood 2004; Huang 2005; Sherrington 2004; Shyu 2010) or fall‐related fracture (Grant 2005). Fourteen other trials recruited on the basis of a specific condition: severe visual impairment (Campbell 2005), operable cataract (Foss 2006; Harwood 2005), carotid sinus hypersensitivity (Kenny 2001; Parry 2009; Ryan 2010), osteoporosis or osteopenia (Grahn Kronhed 2009; Liu‐Ambrose 2004; Madureira 2010; Ralston 2011; Smulders 2010; Swanenburg 2007), Alzheimer's disease (Sato 2005a (Retracted)), and chronic foot pain (Spink 2011).
Eighty‐nine trials excluded participants with cognitive impairment, either defined as an exclusion criterion or implied by the stated requirement to be able to give informed consent and/or to follow instructions (seeAppendix 4).
Interventions
Interventions have been grouped by combination (single, multiple, or multifactorial) and then by the type of intervention (descriptors) as described in Data synthesis.
Twenty‐three trials tested more than one intervention, therefore some trials may appear in more than one category of intervention (and more than one comparison in the analyses).
Single interventions
A single intervention consists of only one major category of intervention which is delivered to all participants in the intervention group; these have been grouped by type of intervention.
Exercises
Fifty‐nine trials (13,264 randomised participants) tested the effect of exercise on falls (seeAppendix 4); only a small proportion of these (six trials) reported the number of people sustaining a fracture.
In most trials the exercise intervention was delivered in a group setting, but in 12 trials it was delivered at home (seeAppendix 4).
The trials were grouped by exercise modality into six categories using the ProFaNE taxonomy (seeAppendix 6). Most trials with exercise alone as an intervention included more than one category of exercise. In some trials the interventions were within one category only:
gait, balance, and functional training (Cornillon 2002; Liu‐Ambrose 2004; McMurdo 1997; Wolf 1996);
strength/resistance training (Davis 2011a; Fiatarone 1997; Latham 2003; Liu‐Ambrose 2004; Woo 2007);
3D training (constant repetitive movement through all three spatial planes): Tai Chi (Huang 2010; Li 2005; Logghe 2009; Voukelatos 2007; Wolf 1996; Wolf 2003; Woo 2007) and square stepping (Shigematsu 2008);
general physical activity (walking groups Pereira 1998; Resnick 2002; Shigematsu 2008);
no trials reported results for flexibility training or endurance training alone.
Eight trials compared different exercise programmes (Davis 2011a; Helbostad 2004; Kemmler 2010; Nitz 2004; Shigematsu 2008; Steadman 2003; Yamada 2010) or methods of delivery (Wu 2010).
Medication (drug target)
Sixteen trials (29,002 randomised participants) evaluated the efficacy of supplementation with vitamin D or an analogue, either alone or with calcium co‐supplementation (seeAppendix 4). Three trials tested more than one dose of vitamin D or different methods of delivery (Bischoff‐Ferrari 2010; Grant 2005; Harwood 2004).
Six other trials tested the effect of administering medication to prevent falls. The women randomised to receive hormone replacement therapy (HRT) in Gallagher 2001 were non‐osteoporotic, and in Greenspan 2005 they were calcium and vitamin D replete. Another intervention group in Gallagher 2001 received HRT plus calcitriol (a vitamin D analogue). Ralston 2011 studied the effect of alendronate plus vitamin D3 in women who were osteoporotic, vitamin D deficient, and at increased risk of falls. Falls were a secondary outcome in Reid 2006 where the intervention was calcium citrate. The effect of menatetranone (vitamin K2), vitamin D2, and calcium was reported as being tested in people with probable Alzheimer's disease in Sato 2005a (Retracted), and Vellas 1991 administered a vaso‐active medication (raubasine‐dihydroergocristine) to older people with a history of a recent fall.
Five other trials investigated the effect of medication withdrawal. Campbell 1999, in a 2 x 2 factorial design, reported the results of an exercise programme and a placebo‐controlled psychotropic medication withdrawal programme. Two studies tested pharmacist‐led medication improvement programmes to reduce side effects including falls (Blalock 2010; Meredith 2002). Medication review was carried out by a pharmacist or geriatrician in Weber 2008. In Pit 2007, the intervention involved physicians (an educational intervention to improve prescribing practices) and their patients (self completed risk assessment tool relating to medication), and subsequent medication review.
Surgery
Three trials reported the effectiveness of cardiac pacing in fallers with cardioinhibitory carotid sinus hypersensitivity (Kenny 2001; Parry 2009; Ryan 2010). Two other trials investigated the effect of expedited cataract surgery for the first eye (Harwood 2005) and second affected eye (Foss 2006).
Fluid or nutrition therapy
Three trials tested the effect of nutritional therapy (Dangour 2011; Gray‐Donald 1995; McMurdo 2009).
Psychological interventions
In two trials (Huang 2011; Reinsch 1992), one intervention group received a cognitive behavioural therapy intervention.
Environment/assistive technology
This category includes the following environmental interventions (or assessment and recommendations for intervention): adaptations to homes and the provision of aids for personal care and protection and personal mobility (e.g. walking aids), and aids for communication, information, and signalling (e.g. eyeglasses, hearing aids, personal alarm systems).
Thirteen trials evaluated the efficacy of environmental interventions alone:
home safety (Campbell 2005 (severely visually impaired); Cumming 1999; Day 2002; Lannin 2007; Lin 2007; Nikolaus 2003; Pardessus 2002; Pighills 2011; Stevens 2001);
interventions to improve vision (Cumming 2007; Day 2002; Haran 2010);
footwear modifications in the form of the Yaktrax® walker, a device worn over usual footwear to increase grip in winter outdoor conditions (McKiernan 2005), and balance‐enhancing insoles (Perry 2008).
Knowledge/education interventions
Five trials evaluated educational interventions designed to increase knowledge relating to fall prevention (Dapp 2011; Harari 2008; Huang 2010; Robson 2003; Ryan 1996).
Multiple interventions
Multiple interventions consist of a fixed combination of two or more major categories of intervention delivered to all participants in the intervention group.
This category includes 18 trials (seeAppendix 4), with numerous combinations of interventions. All but two (Assantachai 2002; Carter 1997) contained an exercise intervention.
Multifactorial interventions
Multifactorial interventions consist of more than one main category of intervention, but participants receive different combinations of interventions based on an individual assessment to identify potential risk factors for falling.
This category includes 40 trials (seeAppendix 4), some with more than one intervention arm. These were complex interventions which differed in the details of the assessment, treatment protocols, and referral processes.
The initial assessment was usually carried out by one or more health professionals; an intervention was then provided or recommendations given or referrals made for further action. In Carpenter 1990 and Jitapunkul 1998 the assessment and health surveillance was carried out by non‐professional personnel who referred participants to a health professional if a change in health status warranted it.
In 16 trials participants received an assessment and an active intervention rather than a referral (Close 1999; Conroy 2010; Coleman 1999; Davison 2005; De Vries 2010; Hornbrook 1994; Huang 2005; Logan 2010; Lord 2005 (extensive intervention group); Markle‐Reid 2010; Salminen 2009; Shyu 2010; Spice 2009 (secondary care intervention group); Tinetti 1994; Vind 2009; Wyman 2005). The remaining trials plus Lord 2005 (minimal intervention group) and Spice 2009 (primary care intervention group) contained an intervention that consisted predominantly of assessment, and referral or the provision of information.
Outcomes
The source of data used for calculating outcomes for each trial for generic inverse variance analysis is shown in Appendix 7. Rate of falls were reported in 54 trials, and could be calculated from a further 41 trials. Data on risk of falling (number of fallers) were available in 48 trials and could be calculated for a further 79. Raw data for rate of falls and number of fallers when available are shown in Appendix 8. Some trials met our inclusion criteria but did not include any data that could be included in these analyses. Reported results from these trials are presented in the text. Forty‐eight trials reported a fracture outcome. Where possible, we only included fall‐related fractures (hip, wrist, humerus, etc), and not vertebral fractures, in the analyses (38 trials).
Excluded studies
Sixty‐five studies initially appeared to meet the inclusion criteria but were excluded (seeAppendix 9 for links to references, and the Characteristics of excluded studies for details). Nine studies reporting falls outcomes were excluded because they were not RCTs. Of the identified trials, nine reported falls outcomes but did not meet the review's inclusion criterion for age (i.e. participants were too young and results were not presented by age group). Seven trials with falls outcomes were excluded because the majority of participants were not community‐dwelling. Three trials that recruited people post stroke (Ashburn 2007) or with Parkinson's disease (Green 2002; Sato 2006) are listed because they were included in the previous version of this review. Eight studies were excluded because they did not report falls outcomes. A further 18 studies were excluded because the intervention was not aimed at preventing falls and they reported falls as adverse events. Eleven other RCTs were excluded for a variety of reasons.
Ongoing studies
We identified 28 trials that are either ongoing, or completed but unpublished, in which falls appear to be an outcome (seeCharacteristics of ongoing studies for details).
Studies awaiting classification
Eight studies are awaiting classification (seeCharacteristics of studies awaiting classification). We identified three abstracts for Bighea 2011 which appear to report interim analyses. The remaining trials (Adunsky 2011; Clemson 2012; Freiberger 2012; Glendenning 2012; Neelemaat 2012; Pérula 2012; Taylor 2012) were identified via weekly bulletins from SafetyLit after 1 March 2012 (our cut‐off date for inclusion) or personal communication. Sach 2012 reports the economic evaluation alongside an included trial (Logan 2010) but was identified too late to add to the review.
Risk of bias in included studies
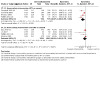
Details of 'Risk of bias' assessment for each trial are shown in the Characteristics of included studies. Summary results are shown in Figure 1. The assessment of risk of bias relied heavily on the reporting of trials and was unclear in many cases. Potential bias varied within comparison groups and it is difficult to judge whether any bias would result in an over or under‐estimation of treatment effect.
1.
'Risk of bias' summary: review authors’ judgments about each methodological quality item for each included study
Allocation
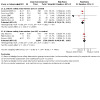
We assessed risk of bias in sequence generation as low in 62% (99/159), high in 2% (3/159), and unclear in the remaining 36% (57/159) of included trials. We judged methods for concealment of allocation prior to group assignment to carry low risk of bias in 38% (60/159), high in 6% (9/159), and to be unclear in the remaining 57% of trials (90/159) (seeFigure 2).
2.
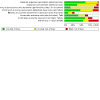
'Risk of bias' graph: review authors’ judgments about each methodological quality item presented as percentages across all included studies.
Blinding
As only a small proportion of included studies were placebo‐controlled, allocation status would have been known to participants and personnel delivering interventions in most included studies, and falls were self reported. We judged the impact of this on risk of performance bias to be low in 18% (29/159) of trials (mostly placebo‐controlled) and high in 13% (21/159). In the remaining 69% of trials (109/159), it was unclear whether awareness of group allocation would be likely to introduce performance bias (seeFigure 2).
The likelihood of detection bias in relation to the ascertainment of self reported falls by outcome assessors was low in 47% of trials (75/159), high in 16% (26/159), and unclear in the remaining 36% (58/159). In trials with fracture outcomes, the risk of detection bias was low in 38% of trials (18/48), high in 25% (12/48), and unclear in the remaining 38% (18/48) (seeFigure 2).
Incomplete outcome data
In trials reporting outcomes based on number of falls, we judged risk of attrition bias to be low in 60% (66/110) of trials, high in 13% (14/110), and unclear in the remaining 27% (30/110). For outcomes based on number of people falling we assessed the risk to be low in 73% of trials (96/131), high in 16% (21/131), and unclear in the remaining 11% (14/131) (seeFigure 2).
Other potential sources of bias
Bias in recall of falls
Fifty‐five per cent of included studies (87/159) were assessed as being at low risk of bias in the recall of falls, i.e. falls were recorded concurrently using methods such as postcards or diaries. In 29% of trials (46/159) there was potential for a high risk of bias in that ascertainment of falling episodes was by participant recall, at intervals during the study or at its conclusion. In 16% of trials (26/159) the risk of bias was unclear as retrospective recall was for a short period only, or details of ascertainment were not described (seeFigure 2).
Effects of interventions
Single interventions
Single interventions consist of one major category of intervention only and are delivered to all participants in the group; we have grouped these by type of intervention and pooled data within types.
Exercises
We grouped the trials by exercise modality into six categories using the ProFaNE taxonomy (seeAppendix 6).
Exercise versus control
We used the random‐effects model to pool data in the following analyses due to substantial statistical and clinical heterogeneity in some of the interventions being combined.
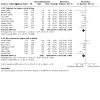
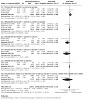
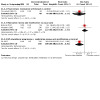
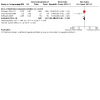
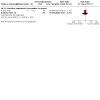
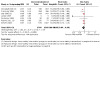
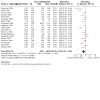
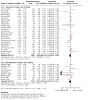
Group exercise: multiple categories of exercise versus control
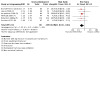
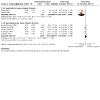
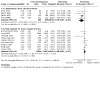
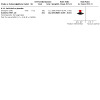
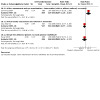
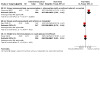
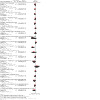
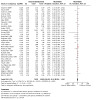
Overall, exercise classes containing multiple components (i.e. a combination of two or more categories of exercise) achieved a statistically significant reduction in rate of falls (pooled rate ratio (RaR) 0.71, 95% confidence interval (CI) 0.63 to 0.82; 3622 participants, 16 trials, Analysis 1.1.1) and risk of falling (pooled risk ratio (RR) 0.85, 95% CI 0.76 to 0.96; 5333 participants, 22 trials, Analysis 1.2.1). Grahn Kronhed 2009contained no poolable data but reported that the "Mean number of falls for the 1‐year study period was 0.6 in the E‐group [exercise group] and 0.8 in the C‐group [control group]".
1.1. Analysis.
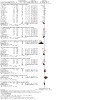
Comparison 1: Exercise vs control, Outcome 1: Rate of falls
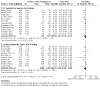
1.2. Analysis.
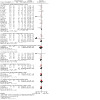
Comparison 1: Exercise vs control, Outcome 2: Number of fallers
We carried out an a priori subgroup analysis of these group exercise trials with multiple components based on falls risk at enrolment, and found there was no difference in pooled estimates between trials with participants at higher risk of falling (history of falling or one or more risk factors for falls at enrolment) versus lower risk (not selected on falls risk at enrolment). The intervention was effective in both subgroups for rate of falls (P = 0.86, I² = 0%, Analysis 2.1). For risk of falling, there was also no evidence of a difference in treatment effect between the subgroups (P = 0.81, I² = 0%, Analysis 2.2).
2.1. Analysis.
Comparison 2: Group exercise: multiple categories of exercise vs control: subgroup analysis by falls risk at baseline, Outcome 1: Rate of falls
2.2. Analysis.
Comparison 2: Group exercise: multiple categories of exercise vs control: subgroup analysis by falls risk at baseline, Outcome 2: Number of fallers
Individual exercise at home: multiple categories of exercise versus control
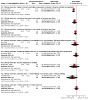
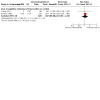
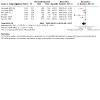
Home‐based exercises containing multiple components also achieved a statistically significant reduction in rate of falls (RaR 0.68, 95% CI 0.58 to 0.80; 951 participants, 7 trials, Analysis 1.1.2) and risk of falling (RR 0.78, 95% CI 0.64 to 0.94; 714 participants, 6 trials, Analysis 1.2.2). Clemson 2010, in a small pilot study testing balance and strength training embedded in daily life activities, achieved a statistically significant reduction in rate of falls (RaR 0.21, 95% CI 0.06 to 0.71; 34 participants, Analysis 1.1.3) but not risk of falling (RR 0.73, 95% CI 0.39 to 1.37; 31 participants, Analysis 1.2.3)
Group exercise: Tai Chi versus control
Overall, in trials testing Tai Chi there was a reduction in rate of falls (RaR 0.72, 95% CI 0.52 to 1.00; 1563 participants, 5 trials, Analysis 1.1.4) but substantial statistical heterogeneity (P = 0.006; I² = 72%). Tai Chi significantly reduced the risk of falling (RR 0.71, 95% CI 0.57 to 0.87; 1625 participants, 6 trials, Analysis 1.2.4).
To explore the heterogeneity in these results, we carried out a subgroup analysis of Tai Chi trials based on falls risk at enrolment. For rate of falls, the treatment effect was greater in the subgroup not selected for higher risk of falling (P = 0.06, I² = 70.9%, Analysis 3.1). In the subgroup analysis for risk of falling this difference was statistically significant (P = 0.02, I² = 83%, Analysis 3.2). Tai Chi appears to be more effective in people who are not at high risk of falling.
3.1. Analysis.
Comparison 3: Group exercise: Tai Chi vs control: subgroup analysis by falls risk at baseline, Outcome 1: Rate of falls
3.2. Analysis.
Comparison 3: Group exercise: Tai Chi vs control: subgroup analysis by falls risk at baseline, Outcome 2: Number of fallers
Group and individual exercise: balance training versus control
In this group of trials, and the following groupings, the intervention was within one only of the categories of exercise using the ProFaNE classification.
Classes that included just gait, balance or functional training achieved a statistically significant reduction in rate of falls (RaR 0.72, 95% CI 0.55 to 0.94, 519 participants, 4 trials, Analysis 1.1.5) but not in risk of falling (RR 0.81, 0.62 to 1.07, 453 participants, 3 trials, Analysis 1.2.5).
Madureira 2010 contained no poolable data but reported no significant difference in mean number of falls. Individual computerised balance training on a force platform (Wolf 1996) also failed to achieve a significant reduction in rate of falls (128 participants, Analysis 1.1.6).
Group and individual exercise: strength/resistance training versus control
Strength/resistance training delivered in a group setting failed to achieve a significant reduction in rate of falls (64 participants, 1 trial, Analysis 1.1.7) or number of people falling (120 participants, 1 trial, Analysis 1.2.6). Fiatarone 1997 provided insufficient data to be included in this analysis but the authors reported that "no difference between groups was observed in the frequency of falls". Home‐based resistance training in Latham 2003 also failed to achieve a statistically significant reduction in rate of falls (222 participants, Analysis 1.1.8) and risk of falling (Analysis 1.2.7).
Two of the trials testing resistance training reported adverse events resulting from the intervention. Latham 2003 reported significantly more adverse events in the resistance training group: "Eighteen people had musculoskeletal injuries in the exercise group, compared with five in the control group; RR 3.6, 95% CI 1.5–8.0", and in Liu‐Ambrose 2004 "Musculoskeletal complaints (e.g., sore neck, bursitis of the hip) developed in 10 women in the resistance‐training group, three in the agility‐training group, and two in the stretching group."
Individual exercise: general physical activity (walking) versus control
Two trials investigated the effect of walking groups (Pereira 1998; Resnick 2002). There was no reduction in risk of falling in Pereira 1998 (Analysis 1.2.8). Resnick 2002 contained insufficient data to include in an analysis but reported no significant difference in number of falls.
Number of people sustaining a fracture
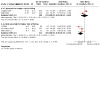
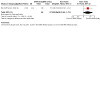
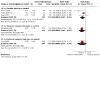
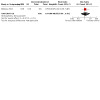
Overall, exercise interventions resulted in a statistically significant reduction in risk of fracture (RR 0.34, 95% CI 0.18 to 0.63; 810 participants, 6 trials, Analysis 1.3).
1.3. Analysis.
Comparison 1: Exercise vs control, Outcome 3: Number of people sustaining a fracture
Exercise versus exercise
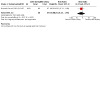
Seven trials compared different types of exercise, or methods of delivery. Kemmler 2010 (227 participants) compared higher intensity multiple component exercise with lower intensity exercise performed in groups and achieved a statistically significant reduction in rate of falls (RaR 0.60, 95% CI 0.47 to 0.76; Analysis 4.1.1) and risk of falling (RR 0.54, 95% CI 0.35 to 0.83; Analysis 4.2.1). In the remaining trials there was no significant reduction in rate of falls (Analysis 4.1) or risk of falling (Analysis 4.2). Three methods of delivery for a Tai Chi programme were compared in Wu 2010. Insufficient data for analysis were reported but "there was no significant group effect in the mean reduction of both falls and injurious falls".
4.1. Analysis.
Comparison 4: Exercise vs exercise, Outcome 1: Rate of falls
4.2. Analysis.
Comparison 4: Exercise vs exercise, Outcome 2: Number of fallers
Medication (drug target)
Medication provision: vitamin D (with or without calcium) versus control/placebo/calcium
Fourteen trials (28,135 randomised participants) evaluated the efficacy for fall prevention of supplementation with vitamin D, either alone or with calcium co‐supplementation (Bischoff‐Ferrari 2006; Bischoff‐Ferrari 2010; Dhesi 2004; Grant 2005; Harwood 2004; Kärkkäinen 2010; Latham 2003; Pfeifer 2000; Pfeifer 2009; Porthouse 2005; Prince 2008; Sanders 2010; Smith 2007; Trivedi 2003) (seeAppendix 5 for reported baseline vitamin D levels).
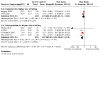
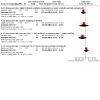
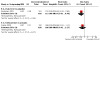
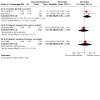
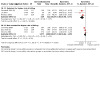
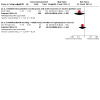
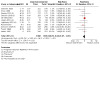
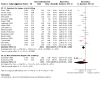
We used random‐effects models to pool data in the overall analyses of vitamin D versus control. These did not show a statistically significant difference in rate of falls (RaR 1.00, 95% CI 0.90 to 1.11; 9324 participants, 7 trials, Analysis 5.1), risk of falling (RR 0.96, 95% CI 0.89 to 1.03; 26,747 participants, 13 trials, Analysis 5.2), or risk of fracture (RR 0.94, 95% CI 0.82 to 1.09; 27,070 participants, 10 trials, Analysis 5.3).
5.1. Analysis.
Comparison 5: Medication provision: vitamin D (with or without calcium) vs control/placebo/calcium, Outcome 1: Rate of falls
5.2. Analysis.
Comparison 5: Medication provision: vitamin D (with or without calcium) vs control/placebo/calcium, Outcome 2: Number of fallers
5.3. Analysis.
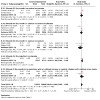
Comparison 5: Medication provision: vitamin D (with or without calcium) vs control/placebo/calcium, Outcome 3: Number of people sustaining a fracture
A pre‐planned subgroup analysis showed no significant difference in either rate of falls (Analysis 6.1) or risk of falls (Analysis 6.2) between trials recruiting participants with higher falls risk and trials not so doing.
6.1. Analysis.
Comparison 6: Vitamin D (with or without calcium) vs control: subgroup analysis by falls risk at baseline, Outcome 1: Rate of falls
6.2. Analysis.
Comparison 6: Vitamin D (with or without calcium) vs control: subgroup analysis by falls risk at baseline, Outcome 2: Number of fallers
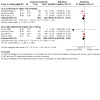
We carried out a subgroup analysis to explore the effect of only enrolling participants with lower vitamin D levels versus enrolling participants not so selected. The test for subgroup differences showed a significant difference between these two subgroups for rate of falls (P = 0.01, Analysis 7.1) and risk of falling (P = 0.003, Analysis 7.2). There was a greater reduction in rate of falls and risk of falling in the subgroups of trials only recruiting participants with lower vitamin D levels at enrolment: RaR 0.57, 95% CI 0.37 to 0.89 (260 participants, 2 trials) and RR 0.70, 95% CI 0.56 to 0.87 (804 participants, 4 trials). For the trials in which participants were not selected on the basis of their vitamin D levels the results were: RaR 1.02, 95% CI 0.93 to 1.13 (9064 participants, 5 trials) and RR 1.00, 95% CI 0.93 to 1.07 (25,943 participants, 9 trials).
7.1. Analysis.
Comparison 7: Vitamin D (with or without calcium) vs control: subgroup analysis by vitamin D level at baseline, Outcome 1: Rate of falls
7.2. Analysis.
Comparison 7: Vitamin D (with or without calcium) vs control: subgroup analysis by vitamin D level at baseline, Outcome 2: Number of fallers
Not all trials recorded adverse effects resulting from the intervention, and there were insufficient data to create forest plots for those that did. Reported adverse effects for trials administering vitamin D are described in Appendix 10; none was considered to be serious.
Medication provision: vitamin D 2000 IU/day versus 800 IU/day
Bischoff‐Ferrari 2010 compared vitamin D3 2000 IU per day with 800 IU per day in a placebo‐controlled trial and although the results were not significant, the point estimate for rate of falls favoured the group receiving the lower dose (RaR 1.30, 95% CI 0.99 to 1.71; 173 participants, Analysis 8.1). The reverse was the case for the risk of sustaining a fracture (RR 0.51, 95% CI 0.13 to 1.98; Analysis 8.2).
8.1. Analysis.
Comparison 8: Medication provision: vitamin D 2000 IU/day vs vitamin D 800 IU/day, Outcome 1: Rate of falls
8.2. Analysis.
Comparison 8: Medication provision: vitamin D 2000 IU/day vs vitamin D 800 IU/day, Outcome 2: Number of people sustaining a fracture
Medication provision: vitamin D analogue versus placebo
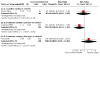
Gallagher 2001 tested the effect of calcitriol (1:25 dihydroxy‐vitamin D) alone and reported a statistically significant reduction in rate of falls (RaR 0.64, 95% CI 0.49 to 0.82; 213 participants, Analysis 9.1.1), and risk of falling (RR 0.54, 95% CI 0.31 to 0.93; 213 participants, Analysis 9.2.1), but not risk of fracture (Analysis 9.3.1). In Dukas 2004, alfacalcidol (1‐alpha hydroxycholecalciferol) supplementation did not result in a significant reduction in risk of falling (378 participants, Analysis 9.2.2).
9.1. Analysis.
Comparison 9: Medication provision: vitamin D analogue vs placebo, Outcome 1: Rate of falls
9.2. Analysis.
Comparison 9: Medication provision: vitamin D analogue vs placebo, Outcome 2: Number of fallers
9.3. Analysis.
Comparison 9: Medication provision: vitamin D analogue vs placebo, Outcome 3: Number of people sustaining a fracture
Reported vitamin D levels for trials administering vitamin D analogues are described in Appendix 5, and reported adverse effects in Appendix 10. There was a statistically significant increase in risk of hypercalcaemia in participants receiving vitamin D analogues (RR 2.49, 95% CI 1.12 to 5.50; 624 participants, 2 trials, Analysis 9.4).
9.4. Analysis.
Comparison 9: Medication provision: vitamin D analogue vs placebo, Outcome 4: Number of people developing hypercalcaemia
Medication provision: other medications versus control
There is no evidence to support the use of hormone replacement therapy (HRT) alone for reducing rate of falls (212 participants, 1 trial, Analysis 10.1.1) or risk of falling (585 participants, 2 trials, Analysis 10.2.1). In Gallagher 2001 HRT plus calcitriol significantly reduced the rate of falls (RaR 0.75, 95% CI 0.58 to 0.97; 214 participants, Analysis 10.1.2) as had administration of calcitriol alone in this trial. Risk of falling was not significantly reduced (RR 0.90, 95% CI 0.72 to 1.11, 214 participants, Analysis 10.2.2). Alendronate plus vitamin D3 did not significantly reduce risk of falling in Ralston 2011 (515 participants, Analysis 10.2.3). Reid 2006 tested the effect of calcium supplementation and reported no significant difference in rate of falls: "The incidence of falls was 595 per 1000 woman‐years (95% CI, 566‐626) for calcium, and 585 per 1000 woman‐years (95% CI, 556‐615) for placebo (P = .81)." Sato 2005a (Retracted) reported no significant differences between groups for percentage of fallers. Vellas 1991 (95 participants) reported that participants with a history of a recent fall who received six months of therapy with the vaso‐active medication raubasine‐dihydroergocristine "showed fewer new falls than the group receiving placebo", however, insufficient data were reported to determine whether this was a significant reduction.
10.1. Analysis.
Comparison 10: Medication provision: other medications vs control, Outcome 1: Rate of falls
10.2. Analysis.
Comparison 10: Medication provision: other medications vs control, Outcome 2: Number of fallers
Two trials reported fracture outcomes. Reid 2006 failed to achieve a significant reduction in risk of fracture (RR 0.90, 95% CI 0.69 to 1.16, 1255 participants; seeAnalysis 10.3). Sato 2005a (Retracted) reported data appearing to show a significant reduction in risk of fracture in people with "probable Alzheimer's disease" with a combination of vitamin K2, vitamin D2 and calcium; these data were removed from the review in 2020 as they were acknowledged by Sato to be fabricated.
10.3. Analysis.
Comparison 10: Medication provision: other medications vs control, Outcome 3: Number of people sustaining a fracture
Medication withdrawal versus control
Gradual withdrawal of psychotropic medication in a placebo‐controlled trial (Campbell 1999) significantly reduced rate of falls (RaR 0.34, 95% CI 0.16 to 0.73; 93 participants, Analysis 11.1.1) but not risk of falling (RR 0.61, 95% CI 0.32 to 1.17; 93 participants, Analysis 11.2.1).
11.1. Analysis.
Comparison 11: Medication withdrawal vs control, Outcome 1: Rate of falls
11.2. Analysis.
Comparison 11: Medication withdrawal vs control, Outcome 2: Number of fallers
Medication review and modification was not effective in reducing rate of falls (186 participants, 1 trial, Analysis 11.1.2) or risk of falling (445 participants, 2 trials, Analysis 11.2.2). Weber 2008 provided insufficient data to be included in these analyses; the authors stated that "when data on self‐reported falls [were] included, a nonsignificant reduction in fall risk was seen." In these three trials medication review was carried out by a pharmacist (or nurse or geriatrician) and recommendations regarding modification sent to the participant's family physician for implementation.
Pit 2007 included a major educational component for family physicians that included face‐to‐face education by a clinical pharmacist, feedback on prescribing practices, and financial rewards. This, combined with self assessment of medication use by their patients and subsequent medication review and modification, resulted in a significantly reduced risk of falling (RR 0.61, 95% CI 0.41 to 0.91; 659 participants, Analysis 11.2.3).
Surgery
Cardiac pacemaker insertion
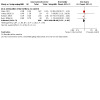
Cardiac pacing in fallers with cardioinhibitory carotid sinus hypersensitivity was associated with a statistically significant reduction in rate of falls (RaR 0.73, 95% CI 0.57 to 0.93; 349 participants, 3 trials, Analysis 12.1.1) but not in the risk of falling (RR 1.20, 95% CI 0.92 to 1.55; 178 participants, 2 trials, Analysis 12.2.1) or risk of fracture (RR 0.78, 95% CI 0.18 to 3.39; 171 participants, 1 trial, Analysis 12.3.1).
12.1. Analysis.
Comparison 12: Surgery vs control, Outcome 1: Rate of falls
12.2. Analysis.
Comparison 12: Surgery vs control, Outcome 2: Number of fallers
12.3. Analysis.
Comparison 12: Surgery vs control, Outcome 3: Number of people sustaining a fracture
Cataract surgery
In Harwood 2005, there was a significant reduction in rate of falls in people receiving expedited cataract surgery for the first eye (RaR 0.66, 0.45 to 0.95; 306 participants, Analysis 12.1.2), but not in risk of falling (RR 0.95, 95% CI 0.68 to 1.33, Analysis 12.2.2), or risk of fracture (RR 0.33, 95% CI 0.10 to 1.05, Analysis 12.3.2). In participants receiving cataract surgery for a second eye (Foss 2006), there was no evidence of effect on rate of falls (239 participants, Analysis 12.1.3), risk of falling (Analysis 12.2.3), or risk of fracture (Analysis 12.3.3).
Fluid or nutrition therapy
Risk of falling was not significantly reduced in older people receiving oral nutritional supplementation (RR 0.95, 95% CI 0.83 to 1.08; 1902 participants, 3 trials, Analysis 13.1).
13.1. Analysis.
Comparison 13: Fluid or nutrition therapy vs control, Outcome 1: Number of fallers
Psychological interventions
The cognitive behavioural interventions showed no difference between the intervention and control groups for rate of falls (RaR 1.00, 95% CI 0.37 to 2.72; 120 participants, 1 trial, Analysis 14.1) or risk of falling (RR 1.11, 95% CI 0.80 to 1.54; 350 participants, 2 trials, Analysis 14.2).
14.1. Analysis.
Comparison 14: Psychological interventions vs control, Outcome 1: Rate of falls
14.2. Analysis.
Comparison 14: Psychological interventions vs control, Outcome 2: Number of fallers
Environment/assistive technology
Environment (home safety and aids for personal mobility)
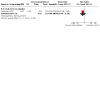
Overall, home safety assessment and modification interventions were effective in reducing rate of falls (RaR 0.81, 95% CI 0.68 to 0.97; 4208 participants, 6 trials, Analysis 15.1) and risk of falling (RR 0.88, 95% CI 0.80 to 0.96; 4051 participants, 7 trials, Analysis 15.2). There was no significant reduction in risk of fracture (RR 1.32, 95% CI 0.30 to 5.87; 360 participants, 1 trial, Analysis 15.3).
15.1. Analysis.
Comparison 15: Environment/assistive technology interventions: home safety vs control, Outcome 1: Rate of falls
15.2. Analysis.
Comparison 15: Environment/assistive technology interventions: home safety vs control, Outcome 2: Number of fallers
15.3. Analysis.
Comparison 15: Environment/assistive technology interventions: home safety vs control, Outcome 3: Number of participants sustaining a fracture
Home safety intervention versus control: subgroup analysis by risk of falling at baseline
We carried out an a priori subgroup analysis by falls risk at enrolment to test whether the intervention effect was greater in participants at higher risk of falling (i.e. with a history of falling or one or more risk factors). Home safety interventions were more effective in reducing rate of falls in the higher risk subgroup (test for subgroup differences P = 0.0009, Analysis 16.1). There was no evidence of a difference in treatment effect between the subgroups for risk of falling (test for subgroup differences P = 0.57, Analysis 16.2). Each subgroup was homogeneous (I² = 0%).
16.1. Analysis.
Comparison 16: Home safety intervention vs control: subgroup analysis by risk of falling at baseline, Outcome 1: Rate of falls
16.2. Analysis.
Comparison 16: Home safety intervention vs control: subgroup analysis by risk of falling at baseline, Outcome 2: Number of fallers
Home safety intervention versus control: subgroup analysis by delivery personnel
We carried out a post hoc subgroup analysis based on whether the home safety assessment/intervention was carried out by an occupational therapist (OT), or by other personnel. We did this because Pighills 2011 randomised participants to two intervention groups to explore the effect of using differently trained personnel to deliver the intervention.
There was some evidence that OT led interventions were more effective than non‐OT led interventions for rate of falls (test for subgroup differences P = 0.07, Analysis 17.1) and risk of falling (test for subgroup differences P = 0.05, Analysis 17.2).
17.1. Analysis.
Comparison 17: Home safety intervention vs control: subgroup analysis by delivery personnel, Outcome 1: Rate of falls
17.2. Analysis.
Comparison 17: Home safety intervention vs control: subgroup analysis by delivery personnel, Outcome 2: Number of fallers
Home safety interventions implemented by an occupational therapist resulted in a statistically significant difference in rate of falls (RaR 0.69, 95% CI 0.55 to 0.86; 1443 participants, 4 trials, Analysis 17.1.1) and risk of falling (RR 0.79, 95% CI 0.70 to 0.91; 1153 participants, 5 trials, Analysis 17.2.1).
In four trials the intervention was not occupational therapist‐led: Day 2002 (trained nurses or community work volunteers); Lin 2007 (public health worker); Pighills 2011 (trained non‐professionally qualified domiciliary support worker); Stevens 2001 (nurse). Pooled data from these trials showed no significant evidence of effect on rate of falls (RaR 0.91, 95% CI 0.75 to 1.11; 3075 participants, 4 trials, Analysis 17.1.2) or risk of falling (RR 0.94, 95% CI 0.85 to 1.05; 2975 participants, 3 trials, Analysis 17.2.2).
Environment (aids for communication, information, and signalling)
Vision improvement versus control
Three trials (Cumming 2007; Day 2002; Haran 2010) investigated the effect of interventions to improve vision. Results for each of these trials are shown in Analysis 18.1 and Analysis 18.2.
18.1. Analysis.
Comparison 18: Environment/assistive technology interventions: vision improvement vs control, Outcome 1: Rate of falls
18.2. Analysis.
Comparison 18: Environment/assistive technology interventions: vision improvement vs control, Outcome 2: Number of fallers
In Cumming 2007 (616 participants), the intervention involved vision assessment and eye examination and, if required, the provision of new spectacles, referral for expedited ophthalmology treatment, mobility training, and canes. This intervention resulted in a statistically significant increase in both rate of falls (RaR 1.57, 95% CI 1.19 to 2.06) and number of participants falling (RR 1.54, 95% CI 1.24 to 1.91).
Day 2002 (1090 participants) compared people who received a visual acuity assessment and referral with those who did not. There was no significant reduction in rate of falls (RaR 0.91, 95% CI 0.77 to 1.09) or risk of falling (RR 0.89, 95% CI 0.76 to 1.04).
Haran 2010 (597 participants) recruited regular wearers of multifocal glasses and provided the intervention group with single lens distance glasses to be used for most walking and standing activities (indoors and outdoors), while the controls continued to use their multifocal glasses. Overall, the intervention did not result in a significant reduction in rate of falls (RaR 0.92, 95% CI 0.73 to 1.17) or risk of falling (RR 0.97, 95% CI 0.85 to 1.11). Pre‐planned subgroup analyses by the trial authors divided participants into those who regularly took part, or did not take part, in outside activities, defined using components of the Adelaide activities profile. In the more active subgroup the intervention was effective in significantly reducing all falls (inside plus outside) and outside falls, whereas there was a significant increase in outside falls in people in the intervention group who took part in little outside activity (interaction term in both models P < 0.001).
In both Cumming 2007, which also included prescription of new glasses, and Haran 2010, there was an increase in risk of fracture, although this was not statistically significant in either trial (Analysis 18.3).
18.3. Analysis.
Comparison 18: Environment/assistive technology interventions: vision improvement vs control, Outcome 3: Number of people sustaining a fracture
Environment (body worn aids for personal care and protection)
Footwear modification versus control
McKiernan 2005 (109 participants) tested the effect of wearing a non‐slip device (Yaktrax® walker) on outdoor shoes in hazardous winter conditions and achieved a statistically significant reduction in rate of outdoor falls (RaR 0.42, 95% CI 0.22 to 0.78, Analysis 19.1). In Perry 2008 (40 participants), the use of balance‐enhancing insoles did not result in a significant reduction in risk of falling (RR 0.56, 95% CI 0.23 to 1.38, Analysis 19.2) when compared with 'normal' insoles.
19.1. Analysis.
Comparison 19: Environment/assistive technology interventions: footwear modification vs control, Outcome 1: Rate of falls
19.2. Analysis.
Comparison 19: Environment/assistive technology interventions: footwear modification vs control, Outcome 2: Number of fallers
Knowledge/education interventions
In interventions designed to reduce falls by increasing knowledge about fall prevention, there was no evidence of a reduction in rate of falls (45 participants, 1 trial, Analysis 20.1) or risk of falling (2555 participants, 4 trials, Analysis 20.2). There were insufficient data available for Harari 2008 to include in these analyses but the odds of having multiple falls was not reduced (odds ratio 1.15, 95% CI 0.87 to 1.54) (personal communication).
20.1. Analysis.
Comparison 20: Knowledge/education interventions vs control, Outcome 1: Rate of falls
20.2. Analysis.
Comparison 20: Knowledge/education interventions vs control, Outcome 2: Number of fallers
Multiple interventions
Multiple interventions consist of the same combination of single categories of intervention delivered to all participants in the group. We have grouped these by combinations of interventions; each combination was analysed separately.
Nineteen pair‐wise combinations of interventions (from 14 trials) provided data on rate of falls (Analysis 21.1) and 18 (from 13 trials) provided data on risk of falling (Analysis 21.2). Of these, 18 and 15 respectively contained an exercise component of varying intensity combined with one or more other interventions. The control group for each comparison is shown in Analysis 21.1 and Analysis 21.2.
21.1. Analysis.
Comparison 21: Multiple interventions, Outcome 1: Rate of falls
21.2. Analysis.
Comparison 21: Multiple interventions, Outcome 2: Number of fallers
In Day 2002 (1090 participants), a significant reduction in rate of falls was achieved when the effective exercise intervention in Analysis 1.1 was combined with the home safety intervention (RaR 0.77, 95% CI 0.61 to 0.98), with vision assessment (RaR 0.72, 95% CI 0.57 to 0.91), and with home safety plus vision assessment (RaR 0.71, 95% CI 0.53 to 0.96). Similarly the risk of falling was significantly reduced when the effective exercise intervention in Analysis 1.2 was combined with the home safety intervention (RR 0.76, 95% CI 0.60 to 0.97), with vision assessment (RR 0.73, 95% CI 0.59 to 0.91), and with vision assessment plus home safety (RR 0.67, 95% CI 0.51 to 0.88).
A combination of exercise, education, and a home safety intervention achieved a significant reduction in rate of falls in Clemson 2004 (RaR 0.69, 95% CI 0.50 to 0.96; 285 participants), but not risk of falling.
Swanenburg 2007 (20 participants) investigated the effect of exercise plus nutritional supplementation in vitamin D and calcium‐replete women. Although a highly significant reduction in rate of falls was achieved (RaR 0.19, 95% CI 0.05 to 0.68) these results should be treated with caution due to the very small sample size (N = 20).
In Comans 2010 (76 participants), there were significantly fewer falls in the group receiving a centre‐based rehabilitation programme that included exercise and education, when compared with a comparable home‐based programme (RaR 0.46, 95% CI 0.22 to 0.97). This approach also reduced risk of falling (RR 0.57, 95% CI 0.35 to 0.93).
Von Stengel 2011 (97 participants) compared multifunctional training plus whole body vibration with light physical exercise and achieved a statistically significant reduction in rate of falls (RaR 0.46, 95% CI 0.27 to 0.79).
In Spink 2011 (305 participants), a significant reduction in rate of falls was achieved in people with disabling foot pain receiving "multifaceted podiatry" (customised orthoses, footwear review, foot and ankle exercises, fall prevention education, and "usual podiatry care") compared with "usual podiatry care" alone (RaR 0.64, 95% CI 0.45 to 0.91).
Assantachai 2002 (815 participants) achieved a statistically significant reduction in risk of falling with an educational intervention combined with free access to a geriatric clinic (RR 0.77, 95% CI 0.63 to 0.94).
None of the remaining comparisons in Analysis 21.1 or Analysis 21.2 achieved a significant reduction in rate of falls or risk of falling.
Wilder 2001 found home safety plus exercise to be "significantly different from [home safety alone or no intervention] on ... number of falls recorded in the home over twelve months."
Two trials included fracture outcomes (Spink 2011; Von Stengel 2011); neither achieved a statistically significant reduction in risk of fracture (Analysis 21.3). We did not pool data due to the clinical heterogeneity of the interventions.
21.3. Analysis.
Comparison 21: Multiple interventions, Outcome 3: Number of people sustaining a fracture
Multifactorial interventions
Multifactorial interventions consist of more than one main category of intervention and participants receive different combinations of the interventions based on an individual assessment to identify potential risk factors for falling. We have analysed these trials as one group because there were several intervention components within each trial, and too many different combinations of components to allow grouping of trials with similar interventions.
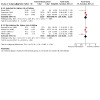
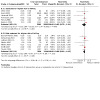
Multifactorial intervention versus control
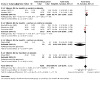
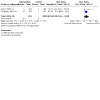
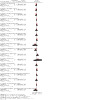
Multifactorial interventions significantly reduced the rate of falls (RaR (random‐effects) 0.76, 95% CI 0.67 to 0.86; 9503 participants, 19 trials, Analysis 22.1), but there was substantial heterogeneity between individual studies (I² = 85%, P < 0.00001). Current evidence does not confirm a significant reduction in risk of falling (RR (random‐effects) 0.93, 95% CI 0.86 to 1.02; 13,617 participants, 34 trials, Analysis 22.2). There was also substantial heterogeneity between individual studies in this analysis (I² = 69%, P < 0.00001). Pooled data from 11 trials (3808 participants) did not show a significant reduction in risk of fracture (RR 0.84, 95% CI 0.67 to 1.05, Analysis 22.3).
22.1. Analysis.
Comparison 22: Multifactorial intervention vs control, Outcome 1: Rate of falls
22.2. Analysis.
Comparison 22: Multifactorial intervention vs control, Outcome 2: Number of fallers
22.3. Analysis.
Comparison 22: Multifactorial intervention vs control, Outcome 3: Number of people sustaining a fracture
There were insufficient data to include Fabacher 1994 or Van Rossum 1993 in these analyses. In Fabacher 1994 "Self‐reported fall rates were not significantly different between groups", and in Van Rossum 1993 there were "no differences between the two groups with respect to these health aspects", which included falls.
Exploration of statistical heterogeneity
To explore possible reasons for heterogeneity we carried out two pre‐planned subgroup analyses. The subgroup analysis by falls risk at enrolment showed no evidence of difference in treatment effect between subgroups for both rate of falls (P = 0.50, I² = 0%, Analysis 23.1) and risk of falling (P = 0.88, I² = 0%, Analysis 23.2).
23.1. Analysis.
Comparison 23: Multifactorial intervention vs control: subgroup analysis by falls risk at baseline, Outcome 1: Rate of falls
23.2. Analysis.
Comparison 23: Multifactorial intervention vs control: subgroup analysis by falls risk at baseline, Outcome 2: Number of fallers
The subgroup analysis by scope and intensity of intervention showed no evidence of difference in treatment effect between subgroups for rate of falls (P = 0.36, I² = 0%, Analysis 24.1). For risk of falling there was evidence to suggest that the intervention may be more effective in the subgroup that received an assessment and active intervention compared with the subgroup that received assessment followed by referral or provision of information (P = 0.05, I² = 74.3%, Analysis 24.2).
24.1. Analysis.
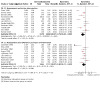
Comparison 24: Multifactorial intervention vs control: subgroup analysis by intensity of intervention, Outcome 1: Rate of falls
24.2. Analysis.
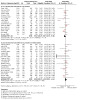
Comparison 24: Multifactorial intervention vs control: subgroup analysis by intensity of intervention, Outcome 2: Number of fallers
Statistical heterogeneity in the trials was not explained by these subgroup and sensitivity analyses, but may relate to the extent of risk assessment, the varying interventions included in these trials, and how the interventions were implemented.
Multifactorial interventions delivered in different settings
Two trials compared settings for carrying out multifactorial interventions. Suman 2011 (349 participants) compared a multifactorial intervention in a family physician surgery with a hospital‐based falls clinic intervention and found no significant difference in rate of falls (Analysis 25.1.1), risk of falling (Analysis 25.2.1), or risk of fracture (Analysis 25.3.1). Gill 2008 (234 participants) compared a Specialised Geriatric Service and the participant's family physician for the intervention and found no significant difference in the number of people falling (Analysis 25.2.2).
25.1. Analysis.
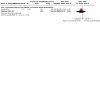
Comparison 25: Multifactorial intervention (setting 1) vs multifactorial intervention (setting 2), Outcome 1: Rate of falls
25.2. Analysis.
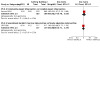
Comparison 25: Multifactorial intervention (setting 1) vs multifactorial intervention (setting 2), Outcome 2: Number of fallers
25.3. Analysis.
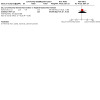
Comparison 25: Multifactorial intervention (setting 1) vs multifactorial intervention (setting 2), Outcome 3: Number of people sustaining a fracture
Economic evaluations
A total of 24 studies included in this review reported a comprehensive economic evaluation (cost‐effectiveness or cost‐utility analysis), the cost of delivering the intervention, or other healthcare cost items as an outcome measure (seeAppendix 11).
A cost‐effectiveness analysis compares the costs and consequences of alternative treatments or approaches with the same clinically relevant outcome (e.g. falls). Cost‐effectiveness, in terms of incremental cost per fall prevented, was established for the following:
exercise programmes (Campbell 1997; Davis 2011a; Liu‐Ambrose 2008; Robertson 2001a; Voukelatos 2007);
a home safety assessment and modification programme delivered to those with severe vision loss in Campbell 2005 and those recently in hospital (Cumming 1999);
the double‐blind gradual withdrawal of psychotropic medication (Campbell 1999);
multifactorial programmes (Conroy 2010; De Vries 2010; Tinetti 1994); and
first eye cataract surgery within one month after randomisation compared with the routine 12‐month wait (Harwood 2005).
The time period for these analyses was the trial duration, but the perspectives taken and the cost items measured and methods for valuing the items varied, so that comparison of incremental cost‐effectiveness ratios for the interventions was difficult even for evaluations carried out within similar health systems.
The results from three studies demonstrated the potential for cost savings from delivering the intervention to particular subgroups of older people at high risk of falling. One trial of the Otago Exercise Programme showed cost savings in those aged ≥ 80 years resulting from fewer hospital admissions (Robertson 2001a). Cost savings were also demonstrated for a home safety programme when delivered to the participants with a previous fall (Cumming 1999) and a multifactorial intervention for those with four or more of the eight targeted risk factors (Tinetti 1994).
In addition, cost‐utility analyses were reported for the studies that tested first (Harwood 2005) and second (Foss 2006) eye expedited cataract surgery, resistance training programmes (Davis 2011a), and a multifactorial programme (De Vries 2010). A cost‐utility analysis compares cost outcomes in terms of quality adjusted life years (QALYs) gained. For both first and second eye cataract surgery the incremental cost per QALY gained at one year was above a currently accepted UK threshold of willingness to pay per QALY gained of GBP 30,000. If, however, the time frame of the analyses was extended to the person's expected lifetime, the incremental cost per QALY gained was below this threshold at GBP 13,172 and GBP 17,299 respectively.
Discussion
Summary of main results
There is now strong evidence of effect in preventing falls for some interventions and no evidence of effect for others.
Exercises
This review endorsed the previously established effectiveness of certain exercise programmes in preventing falls. Programmes containing multiple categories of exercise were effective in reducing both rate of falls and risk of falling when delivered as group classes or when individually prescribed at home. The types of exercise commonly included were balance retraining and muscle strengthening. Overall, group exercise classes were effective whether or not the trial had recruited only people at higher risk of falling.
Tai Chi classes reduced risk of falling (six trials) but were less effective in trials selecting participants at higher risk of falling (two versus four trials).
Other than for Tai Chi, there was no evidence that single category programmes were effective, for example balance retraining or muscle strengthening exercises alone.
Overall, exercise significantly reduced risk of sustaining a fracture, although only six trials contributed data to this outcome.
Medication (drug target)
Vitamin D supplementation
Despite the addition of four new trials (5939 participants) bringing the total number randomised to 28,135, the evidence regarding vitamin D (with or without calcium) remained unchanged from the previous version of this review. Overall, vitamin D did not reduce either rate of falls or risk of falling, whether or not the trial had recruited only people at higher risk of falling. However, subgroup analysis showed that supplementation appeared effective in reducing rate of falls (seeAnalysis 7.1) and risk of falling (seeAnalysis 7.2) when administered to those selected on the basis of lower vitamin D levels at enrolment.
Vitamin D analogues (calcitriol and alfacalcidol) may be effective but the evidence base is limited and their use is associated with a significantly raised incidence of reported hypercalcaemia compared with placebo (Dukas 2004; Gallagher 2001).
Medication withdrawal interventions
Three trials involving medication review by a pharmacist (or nurse or geriatrician) but requiring implementation by participants' family physicians were not effective in reducing falls. However, the intensive educational programme for primary care physicians in Pit 2007, that included academic detailing and patient involvement, significantly reduced risk of falling in older people under their care. Gradual withdrawal of psychotropic medication reduced rate of falls, but not risk of falling (Campbell 1999).
Surgery
Pacemakers reduced rate of falls in people with carotid sinus hypersensitivity but not risk of falling. First eye cataract surgery in women reduced rate of falls but second eye cataract surgery did not.
Fluid or nutrition therapy
Nutritional supplementation has not been shown to reduce the risk of falling.
Psychological interventions
For cognitive behavioural interventions there is no evidence of effect on rate of falls or risk of falling.
Environment/assistive technology
Home safety interventions reduced rate of falls and risk of falling. Furthermore, subgroup analyses showed that home safety interventions were more effective in reducing rate of falls in participants who were at higher risk of falling (four versus four trials). These interventions appear to be more effective when delivered by an occupational therapist.
Providing single lens glasses reduced falls in those spending more time outdoors, but increased outdoor falls in frailer people (Haran 2010). An anti‐slip shoe device for icy conditions significantly reduced outside falls in winter (McKiernan 2005).
Knowledge/education interventions
The evidence relating to the provision of educational materials alone for preventing falls is inconclusive.
Multiple interventions
Few multiple interventions were effective. Spink 2011 provided new evidence to support "multifaceted" podiatry, including foot and ankle exercises, as an effective intervention for preventing falls in older people with disabling foot pain. Exercise was included in all but one of the other multiple interventions that were effective.
Multifactorial interventions
The addition of outcomes from nine new trials made no change to the findings for multifactorial interventions in the previous version of this review. Multifactorial interventions reduced the rate of falls but not the risk of falling. Neither the intensity of the intervention nor level of risk at recruitment explained the considerable statistical heterogeneity between studies, which may be due to differences in component interventions, settings, or healthcare systems.
Economic evaluations
In 13 studies in this review, the authors reported a comprehensive economic evaluation which provided an indication of value for money for the interventions being tested. Variations in the methods used, however, made comparisons across studies difficult. There was some, although limited, evidence that falls prevention strategies can be cost‐saving during the trial period, and may also be cost‐effective over the participants' remaining lifetime. The results indicate that, to obtain maximum value for money, effective strategies need to be targeted at particular subgroups of older people.
Overall completeness and applicability of evidence
Participants
The 159 trials in this review included 79,193 community‐dwelling older people, predominantly women (70%). A wide range of ages were included as few trials set upper age limits. Participant characteristics varied greatly due to the recruitment methods used, and the inclusion and exclusion criteria applied. Participants in some trials were healthy volunteers; in others they were more representative of older people as a whole having been randomly sampled from databases such as electoral rolls. Some trials recruited people being treated in hospital clinics or with specific conditions such as operable cataracts or severe visual impairment. Eighty‐three trials (52%) recruited participants with a history of falls or one or more risk factors for falling.
As the majority of trials specifically excluded older people who were cognitively impaired, the results of this review may not be applicable to this important group of people at risk.
We have excluded trials recruiting people with Parkinson's disease and post stroke from this review update as we felt the results of interventions for those neurological conditions were not necessarily applicable to older people as a whole. Fall prevention trials in these populations often include a wider age range which would result in some being excluded from this review; Cochrane reviews for each of these specific groups (including all age groups) would be preferable for summarising the evidence.
Interventions
Fall prevention interventions tested in a further 51 randomised controlled trials were included in this update. In some instances the additional trials had minimal impact on the size and precision of the results. For multifactorial interventions the addition of four trials (1363 participants) changed the rate ratio and 95% confidence interval by around 1% only (previous version rate ratio (RaR) 0.75, 95% confidence interval (CI) 0.65 to 0.86; this update RaR 0.76, 95% CI 0.67 to 0.85). Also, the addition of nine trials (2678 participants) changed the risk ratio and 95% confidence interval by a similar amount (previous version risk ratio (RR) 0.95, 95% CI 0.88 to 1.02; this update 0.94, 95% CI 0.86 to 1.02). Minimal effects were seen also with the addition of six trials (2899 participants) to the analysis for group exercise (previous version RR 0.83, 95% CI 0.72 to 0.97; this update RR 0.85, 95% CI 0.76 to 0.96).
This review differs from many in The Cochrane Library by including a large number of interventions. This precludes in‐depth subgroup analyses exploring the effect of different components within interventions such as those undertaken in Sherrington 2011 for exercise, or other factors that may affect results such as recruitment rates or adherence (Nyman 2012). This is an argument for splitting this review into a number of separate reviews focusing on specific interventions.
The included trials were conducted in over 21 countries, using a variety of healthcare models. The effectiveness of some interventions may be sensitive to differences between healthcare systems, structures, and networks at local and national level. For example Hendriks 2008 reported the results of a study which aimed to reproduce, in The Netherlands, the successful integrated multifactorial intervention reported by Close 1999 from the UK. Major differences in the health operational networks in The Netherlands health system compared with those in the UK appear to have made timely direct contact with the appropriate health professionals impossible to achieve (Lord 2008). That risk of falling was not reduced in Hendriks 2008 may be due to these differences in healthcare systems, rather than to sample variation, as negative results were also reported by Van Haastregt 2000 and Van Rossum 1993 in the same healthcare setting.
Interventions targeting most risk factors for falls have now been well researched. Gaps include interventions addressing the management of urinary incontinence, foot problems, and dementia. Further research is required to increase implementation of effective interventions by healthcare professionals.
Outcomes
We sought data for rate of falls, number of people falling, and number of people sustaining a fall‐related fracture, although few studies provided fracture data. As the analyses and Appendix 7 demonstrate, some studies provided data for both falls and fallers, as recommended in Lamb 2005. Others provided data only for one or other fall outcome. In most analyses we were able to pool more data on risk of falling than on rate of falls. Since robust statistical methods are now available to deal with comparison of the number of falls occurring in each group of a study, the use of rate of falls has a number of attractions. First, it improves power. In the sense that every fall carries a risk of injury, an intervention which reduces the number of times a faller falls, even if not the number of fallers, has clinical, public health, and economic relevance. However from a public health perspective, fall prevention lies between primary and secondary prevention. Older people who are not yet 'fallers', however defined, might wish to know how best to prolong their time free from falls.
Quality of the evidence
This review containing 159 trials (79,193 participants) provides robust evidence regarding effective interventions for reducing falls. However, not all studies met the contemporary standards of the CONSORT statement (Boutron 2008), including the extensions for pragmatic randomised trials (Zwarenstein 2008) and cluster‐randomised trials (Campbell 2004). Where factorial designs were employed, data for each treatment cell were not always reported (McAlister 2003).
The fact that the outcome of interest, falling, was not always defined, is a continuing concern. The use of two definitions in Wolf 1996 demonstrated that the definition of falling used can alter the significance of the results. Comparability of future research findings would be facilitated by adoption of the consensus definition of a fall developed for trials in community‐dwelling populations by the Prevention of Falls Network Europe (Lamb 2005).
The included studies also illustrated the wider problems of variation in the methods of ascertaining, recording, analysing, and reporting falls described in Hauer 2006. Studies should use consensus recommendations for conducting fall prevention trials which include the daily recording of falls, with monthly, or more frequent, follow‐up by the researchers blind to group allocation (Lamb 2005). Forty‐five per cent did not do this, despite empirical evidence showing a 25% underreporting of falls when data were collected retrospectively by telephone at the end of a three‐month period, compared with data collected daily and returned monthly over the same period (Hannan 2010).
We included 11 analyses with statistically significant pooled effect measures in our sensitivity analyses exploring the possible impact of risk of bias on the treatment effect. When trials with higher risk of bias in any of the pre‐determined domains were removed, the results remained statistically significant in all but three analyses (seeAppendix 12). These analyses indicate that the results in this review are robust to key risks of bias.
Potential biases in the review process
We attempted to minimise publication bias in the review by searching multiple databases and contacting authors of studies identified in trials registers that were completed, but for which full reports had not been identified. We included five abstracts not published as full reports (Cerny 1998; Fiatarone 1997; Hill 2000; Wilder 2001; Wyman 2005) and obtained supplementary information from authors of 29 studies. We also included studies published in languages other than English.
To explore the possibility of publication bias, we constructed funnel plots for all analyses that contained more than 10 data points. For exercise interventions and multifactorial interventions, asymmetry in the funnel plots was minimal (figures not shown). For vitamin D supplementation, there was asymmetry in the risk of falling plot which could indicate the absence of trials with negative results, i.e. publication bias (seeFigure 3).
3.
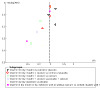
Funnel plot of Analysis 5.2: vitamin D (with or without calcium) vs control/placebo/calcium: number of fallers
We excluded 18 trials reporting falls as adverse effects, although in some instances the intervention might plausibly have reduced falls. Increased publication of protocols in trials registers will make it easier to establish whether the aim of the study was to prevent falls, thus making it eligible for inclusion in this review.
Authors' conclusions
Implications for practice.
We found evidence of effectiveness for a number of different approaches to fall prevention, some in all older people living in the community and others in particular subgroups. This evidence may not be applicable to older people with dementia as most included studies excluded them from participation.
There is strong evidence that certain exercise programmes prevent falls. Group exercise classes and exercises individually delivered at home reduce rate of falls and risk of falling. Tai Chi as a group exercise reduces risk of falling, but is less effective in people at higher risk of falling. Overall, exercise programmes aimed at reducing falls appear to reduce fractures.
Multifactorial interventions integrating assessment with individualised intervention, usually involving a multidisciplinary team, are effective in reducing rate of falls but not risk of falling.
Home safety interventions reduce rate of falls and risk of falling. These interventions are more effective in people at higher risk of falling, and when delivered by an occupational therapist. An anti‐slip shoe device for icy conditions significantly reduced winter outside falls in one study.
There is limited evidence for the effectiveness of interventions targeting medications (e.g. withdrawal of psychotropic medications, educational programmes for family physicians).
Overall, vitamin D does not appear to prevent falls in all older people living in the community but appears to be effective in people who have lower vitamin D levels before treatment.
In people with severe visual impairment, there is evidence from one trial for the effectiveness of a home safety assessment and modification intervention. Expedited first eye cataract surgery for people on a waiting list significantly reduces rate of falls compared with waiting list controls. Older people may be at increased risk of falling while adjusting to new spectacles or major changes in prescription.
In one study rate of falls was reduced in people with disabling foot pain receiving "multifaceted podiatry" (customised orthoses, footwear review, foot and ankle exercises, fall prevention education in addition to "usual podiatry care").
Evidence from three studies indicates that cardiac pacing in people with carotid sinus hypersensitivity, and a history of syncope and/or falls, reduces rate of falls.
The evidence relating to the provision of educational materials alone for preventing falls is inconclusive.
Implications for research.
Aspects of particular interventions to be addressed in future studies include:
Research targeting health professionals to increase implementation of effective interventions, i.e. translation of research into practice.
Methods for increasing uptake and adherence to effective programmes by older people.
Investigation of different methods for delivering proven programmes (e.g. peer exercise instructors, academic detailing, electronic media).
The impact of management programmes for risk factors such as cognitive impairment and urinary incontinence.
Aspects of research methods that need to be adopted in all future studies:
Studies evaluating fall prevention should be adequately powered and use a contemporary standard definition of a fall (Lamb 2005).
Falls should be recorded daily and monitored monthly. Falls should be monitored and verified by a researcher blind to group allocation.
Fall events should be reported by group as total number of falls, fallers, and people sustaining a fall‐related fracture; rate of falls (falls per person year); and number in each analysis.
Results should be analysed using appropriate, pre‐specified methodology (e.g. negative binomial regression, survival analysis) (Robertson 2005). Group comparisons should be expressed as incidence rate ratios and risk ratios with 95% confidence intervals.
Design and reporting of trials should meet the contemporary standards of the CONSORT statement (Boutron 2008; Zwarenstein 2008) including randomised sequence generation and allocation concealment prior to randomisation.
Design and reporting of cluster‐randomised trials should follow contemporary guidance (Campbell 2004) including the reporting of intra‐class correlation coefficients.
Where factorial designs are employed, data for each treatment cell should be reported to allow interpretation of possible interactions between different intervention components (McAlister 2003).
Economic evaluations should be conducted alongside randomised controlled trials to establish the cost‐effectiveness of each intervention being tested. This involves measuring health‐related quality of life as an outcome, defining the perspective and timeframe for costs, collecting data on healthcare use, costing healthcare resources, calculating cost‐effectiveness ratios (if the intervention is effective in reducing falls), and evaluating uncertainty. Guidelines for carrying out and reporting economic evaluations in falls prevention trials have recently been published (Davis 2011b).
Feedback
Definition of terms, 26 June 2009
Summary
Please could you clarify the definitions of falls risk and rate of falls? How do they differ from one another?
Reply
We are unclear as to whether the question relates to "falls risk" or whether Dr Foley is actually meaning "risk of falling".
In the review the term falls risk is used in relation to falls risk at enrolment. In subgroup analyses, we compared trials with participants at higher versus lower falls risk at enrolment (i.e. comparing trials with participants selected for inclusion based on history of falling or other specific risk factors for falling, versus unselected) (seeData collection and analysis: 'Subgroup analyses and investigation of heterogeneity').
The review reports two primary outcomes:
1. Rate of falls This is the number of falls over a period of time: for example, number of falls per person year. The statistic used to report this is the rate ratio which compares the rate of events (falls) in the two groups during the trial, or during a number of trials if the data are pooled. Based on these statistics we report whether an intervention has a significant effect on the rate of falls.
2. Number of people falling during follow up The statistic used to report this is the risk ratio which compares the number of participants in each group with one or more fall events during the trial, or during a number of trials if the data are pooled. Based on these statistics we report whether an intervention has a significant effect on the risk of falling.
For further details, please refer to the Methods section in the review: 'Data relating to rate of falls' and 'Data relating to number of fallers or participants with fall‐related fractures'.
Contributors
Comment from: Dr Charlotte Foley, UK Reply from: Mrs Lesley Gillespie, New Zealand
Availability of event rates in latest version of the review, 20 July 2010
Summary
1. We are keen to know why the meta‐analyses in the updated Cochrane review do not display the mean event rates of included studies as is common in other Cochrane reviews as well as in earlier versions of this review.
As authors of a consumers' brochure on evidence‐based fall prevention we try to apply the principles of evidence‐based patient information and risk communication. For this purpose, communication of interventional effects as relative risks or risk ratios is inappropriate. The non‐availability of event rates of the original studies analysed in the Cochrane review or of mean event rates for meta‐analyses makes it impossible to transform the pooled relative risks into absolute risk reductions, which is the meaningful information that consumers and patients should get.
2. Generally, we wonder if it isn't time to make all raw data accessible which have been collected and archived during the preparation of a Cochrane review at least as electronic supplement to the Cochrane review.
Reply
1. Thank you; this is a useful comment. It refers to the raw data on numbers of participants and number of events in experimental and control groups in included studies of Cochrane reviews. These were visible in the analyses in the previous review "Interventions for preventing falls in elderly people", which has now been replaced. In "Interventions for preventing falls in older people living in the community" these data are no longer shown alongside the graphs in the analyses.
This is because they were not entered directly into RevMan to generate the risk ratios used in the meta‐analyses. We used the generic inverse variance option in RevMan, which involves entering the natural logarithm of a risk ratio and its standard error, which are then displayed. These were first calculated, as described in the methods section of the review, using Microsoft Excel. We did this because event rates (in this case, number of people falling) are not always available in trial reports, or from the authors of reports. Using the generic inverse variance method allows inclusion in the meta‐analyses of studies which report only the trialists' calculation of the risk ratio and a P‐value or confidence interval. It also allows inclusion of cluster‐randomised studies in which reported event rates have been adjusted for clustering by either the trial authors or review authors.
2. We appreciate that many researchers, health practitioners, and funders might like to use, for example, an Absolute Risk Reduction (ARR), or even, despite its many associated difficulties, Number Needed to Treat (NNT).1,2 In future updates, we will aim to include tables showing the data used to calculate estimates of effect and standard errors of studies included in meta‐analyses which have been conducted using the generic inverse variance option.
Smeeth L, Haines A, Ebrahim S. Numbers needed to treat derived from meta‐analyses‐‐sometimes informative, usually misleading. BMJ 1999;318(7197):1548‐51.
Stang A, Poole C, Bender R. Common problems related to the use of number needed to treat. Journal of Clinical Epidemiology 2010;63(8):820‐5.
Contributors
Comment from Gabriele Meyer and Sascha Köpke, Germany. Reply from Lesley Gillespie, Corresponding Author, and Bill Gillespie, Feedback Editor, Cochrane Bone, Joint and Muscle Trauma Group.
Queries relating to Analysis 1.3, 27 September 2012
Summary
1. Is there an error in Analysis 1.3 where the first two studies, Bischoff‐Ferrari 2010 and Haines 2009 have the exact same values? 2. Why did you choose to exclude Robertson 2001a from Analysis 1.3 in this update when it was previously included?
Reply
1. Thank you for alerting us to the problem in Analysis 1.3. We can confirm that there were indeed errors in the data entered for both Bischoff‐Ferrari 2010 and Haines 2009. These have now been corrected. 2. The unpublished fracture data for Robertson 2001a were withdrawn at the request of the principal investigator. The data for Robertson 2001a have been reinserted after discussion with the trial authors.
Contributors
Comment from: Fabienne El Khoury, France. Reply from: Lesley Gillespie (Corresponding Author) and Clare Robertson (Author).
Retracted article, 30 September 2020
Summary
Dear authors, This Cochrane review cited the following trial publication, as an included trial, which has been retracted: Sato Y, Kanoko T, Satoh K, Iwamoto J. Menatetrenone and vitamin D2 with calcium supplements prevent nonvertebral fracture in elderly women with Alzheimer’s disease. Bone 2005;36(1):61–8. Details of all Sato retractions may be found on Retraction Watch’s database https://retractionwatch.com/retraction-watch-database-user-guide/ and on the journal’s website. Do you believe that any action needs to be taken?
Reply
Thank you for alerting us to this retracted article and for submitting this comment to facilitate a formal public response. Given this is a ‘stable’ review, that will not be updated, I took an editorial decision to act on this. As noted in the revised published ‘Notes’ of the review, I took the pragmatic decision to retain this study as an included study. This decision reflected a) its minimal impact on the review’s findings, including that it did not appear in the summaries or affect the conclusions and b) the wish to avoid the risk of data discrepancies resulting from its removal from this very large 'stable' review. Actions taken were to relabel the study (Sato 2005a (Retracted)), reference the retraction notice, add information on the retraction to the Characteristics of included studies table entry, and remove outcome data from the results text and analyses. Thank you again for your comment.
Contributors
Comment from: Alison Avenell* Andrew Grey# Mark Bolland# *Health Services Research Unit University of Aberdeen Aberdeen Scotland AB25 2ZD #Bone and Joint Research Group Department of Medicine Faculty of Medical and Health Sciences, University of Auckland Private Bag 92019, Auckland, New Zealand Reply from: Helen Handoll, Co‐ordinating Editor, Cochrane Bone, Joint and Muscle Trauma Group
What's new
| Date | Event | Description |
|---|---|---|
| 18 June 2021 | Amended | Note added addressing concerns raised on the use of the data from two trials (Pfeifer 2000 and Pfeifer 2009); see Published notes. |
History
Protocol first published: Issue 2, 2008 Review first published: Issue 2, 2009
| Date | Event | Description |
|---|---|---|
| 6 October 2020 | Amended | Upon notification via a Comment submitted to the Cochrane Library (30 September 2020) that an included trial had been retracted, changes were made to the review to alert the reader to this, including relabelling the study: Sato 2005a (Retracted); see Published notes. |
| 30 April 2015 | Amended | A statement has been added to the Published notes to clarify that this is the final version of this review. In addition, the contact author's email address has been changed. |
| 24 September 2013 | Amended | Contact author address changed |
| 9 October 2012 | Feedback has been incorporated | Prompted by feedback, received 27 September 2012, corrections were made to Analysis 1.3 (Exercise vs control: Number of people sustaining a fracture) and associated text. |
| 27 July 2012 | New search has been performed | 1. Search updated to September 2011 and trials included. Updated again in March 2012 and trials placed in 'Studies awaiting classification'. 2. Fifty‐one additional trials (24,177 participants) included in this update. 3. Three previously included trials excluded as they recruited people with Parkinson's disease (Ashburn 2007; Sato 2006) and post stroke (Green 2002), which are not within the scope of this version of the review. 4. Data for fall rates added for Day 2002 (published in Fitzharris 2010) and for fracture risk in Salminen 2009 (previously included as Salminen 2008). 5. 'Risk of bias' assessment items for performance bias, detection bias, and attrition bias were added and applied to all included studies. 6. Table added presenting the raw data for rate of falls and number of fallers when available for the included trials. |
| 27 July 2012 | New citation required and conclusions have changed | 1. Conclusions changed for home safety interventions. 2. Results from two additional interventions included: enhanced podiatry (Spink 2011) and single lens glasses (Haran 2010). 3. There has been a change in authorship. |
| 25 August 2010 | Feedback has been incorporated | Feedback added about the availability of event rates |
| 10 August 2009 | Feedback has been incorporated | Feedback added to clarify terms used |
| 13 May 2009 | Amended | Correction of several typographical errors |
| 27 October 2008 | Amended | Converted to new review format |
| 19 February 2008 | Amended | The published review 'Interventions for preventing falls in elderly people' (Gillespie 2003) is not being updated. Due to its size and complexity it was split into two reviews: 'Interventions for preventing falls in older people living in the community' and 'Interventions for preventing falls in older people in residential care facilities and hospitals'. |
Notes
Due to its size and complexity, this review is not being updated. Instead, the topic area is being split and separate reviews of the main interventions will be conducted.
Upon notification via a comment from Alison Avenell (received 30 September 2020) that an included study (Sato 2005a (Retracted)) had been retracted, Helen Handoll (Co‐ordinating Editor, Cochrane Bone, Joint and Muscle Trauma Group) took the pragmatic decision to retain this study as an included study. This decision reflected both its minimal impact on the review findings, including that it did not appear in the summaries or affect the conclusions, and the wish to avoid the risk of data discrepancies resulting from its removal from this large and 'stable' review. As well as relabelling the study, the retraction notice was referenced and information on the retraction added into the Characteristics of included studies table, and outcome data removed from text and the analyses.
Note added 18.06.21: Concerns have been raised on the use of the data from two trials (Pfeifer 2000 and Pfeifer 2009) testing vitamin D [e.g. 1]. We decided it would be useful to check on the contribution of these two small trials to the evidence for this intervention by conducting sensitivity analyses. Excluding the data from these trials from the analyses did not result in any important differences in the results for the three outcomes: rate of falls (sensitivity analysis: RaR 1.01, 95% CI 0.92 to 1.12 compared with RaR 1.00, 95% CI 0.90 to 1.11 (Analysis 5.1)); number of fallers (sensitivity analysis: RR 0.98, 95% CI 0.92 to 1.06 compared with RR 0.96, 95% CI 0.89 to 1.03 (Analysis 5.2)); or numbers of people sustaining a new fracture (sensitivity analysis: RR 0.96, 95% CI 0.83 to 1.11 compared with RR 0.94, 95% CI 0.82 to 1.09 (Analysis 5.3)). Sensitivity analysis upheld the results from subgroup analyses (6.1 and 6.2) showing no significant difference between trials recruiting participants with higher falls risk and trials with broader inclusion criteria. However, the removal of the Pfeifer trials from subgroup analyses (7.1 and 7.2) exploring the effect of only enrolling participants with lower vitamin D levels versus enrolling participants not so selected resulted in substantively underpowered subgroup analyses. We consider that the tentative conclusion that vitamin D “appears to be effective in people who have lower vitamin D levels before treatment” is not upheld with the exclusion of the Pfeiffer trials.
There is substantial discussion elsewhere of the methodological and analytical approaches used in these two trials authored by Pfeifer, but we confirm here that inclusion or exclusion of these trials makes no material difference to the overall findings of the review. A review that includes vitamin D, and thus will provide an update of the evidence on this intervention, is planned in due course.
[1] Bolland MJ, Grey A. Different outcomes of meta‐analyses and data inconsistency: response to comments by Pfeifer. Archives of Osteoporosis 2015;10:43
Note agreed by Sallie Lamb, on behalf the authors, and Helen Handoll, Editor of the BJMT Group
Acknowledgements
The authors would like to thank Lindsey Elstub, Joanne Elliott, and Catherine Deering for their support at the editorial base. We are grateful to Prof RG Cumming and Prof BH Rowe for their previous contributions as review authors. We thank the following for their useful and constructive comments on earlier versions of the protocol and/or review: Prof Clemens Becker, Assoc Prof Jacqueline Close, Dr Helen Handoll, Prof Peter Herbison, Prof Rajan Madhok, Dr Kilian Rapp, Prof Dawn Skelton, Prof Chris Todd, and Dr Janet Wale. In addition, we would also like to thank Geraldine Wallbank of the George Institute for Global Health, Sydney for preparing Appendix 6.
Appendices
Appendix 1. Search strategies and number of records identified
The Cochrane Library 2012, Issue 3 (Wiley InterScience)
#1 MeSH descriptor Accidental Falls, this term only (737) #2 ("falls" or "faller*"):ti,ab (1756) #3 (#1 OR #2) (1982) #4 MeSH descriptor Aged explode all trees (793) #5 ("older" or "senior*" or "elderly"):ti,ab (23049) #6 (#4 OR #5) (23153) #7 (#3 AND #6) in Trials (The Cochrane Central Register of Controlled Trials) (756)
* indicates truncation ti,ab denotes word in the title or abstract
MEDLINE (Ovid Interface) (1946 to 1 March 2012)
1. Accidental Falls/ (12544) 2. (falls or faller$1).tw. (22940 ) 3. or/1‐2 (29198 ) 4. exp Aged/ (2059145 ) 5. (senior$1 or elderly or older).tw. (336186) 6. or/4‐5 (2185007) 7. and/3,6 (12164) 8. randomized controlled trial.pt. (320017) 9. controlled clinical trial.pt. (83538) 10. randomized.ab. (225184) 11. placebo.ab. (128635) 12. randomly.ab. (162817) 13. trial.ab. (232226) 14. groups.ab. (1074761) 15. or/8‐14 (1573193) 16. humans.sh. (12076140) 17. and/15,16 (1192470) 18. and/7,17 (2770)
Ovid MEDLINE pending (searched 1 March 2012)
1. (falls or faller$1).tw. (1642) 2. (senior$1 or elderly or older).tw. (16025) 3. and/1‐2 (369) 4. randomized controlled trial.pt. (813) 5. controlled clinical trial.pt. (47) 6. random$.tw. (37884) 7. placebo.tw. (4914) 8. trial.tw. (14097 ) 9. groups.tw. (67271) 10. or/4‐9 (102433) 11. and/3,10 (96)
EMBASE (Ovid Interface) (1947 to 1 March 2012)
1 Falling/ (19691) 2 (falls or fallers).tw. (34231) 3 or/1‐2 (44965) 4 exp Aged/ (1979140) 5 (elderly or senior$ or older).tw. (461797) 6 or/4‐5 (2200808) 7 and/3,6 (15329) 8 exp Randomized Controlled trial/ (300381) 9 exp Double Blind Procedure/ (107916) 10 exp Single Blind Procedure/ (14885) 11 exp Crossover Procedure/ (32263) 12 or/8‐11 (343532) 13 ((clinical or controlled or comparative or placebo or prospective$ or randomi#ed) adj3 (trial or study)).tw. (629658) 14 (random$ adj7 (allocat$ or allot$ or assign$ or basis$ or divid$ or order$)).tw. (146149) 15 ((singl$ or doubl$ or trebl$ or tripl$) adj7 (blind$ or mask$)).tw. (147301) 16 (cross?over$ or (cross adj1 over$)).tw. (61912) 17 ((allocat$ or allot$ or assign$ or divid$) adj3 (condition$ or experiment$ or intervention$ or treatment$ or therap$ or control$ or group$)).tw. (191960) 18 or/13‐17 (944973) 19 or/12,18 (1059749) 20 Animal/ not Human/ (1279726) 21 19 not 20 (1029496) 22 and/7,21 (2456)
Footnote for OVID: .pt. denotes a Publication Type term; .ab. denotes a word in the abstract; .sh. or / denotes a Medical Subject Heading (MeSH) term; .ti. denotes a word in the title.
CINAHL (Ebsco) (1982 to 28 February 2012)
1. (MH "Accidental Falls") (10181) 2. TI ( falls or faller or fallers ) OR AB ( falls or faller or fallers ) (7898) 3. S1 or S2 (13330) 4. (MH Aged+) (357594) 5. TI ( senior or seniors or elderly or older ) OR AB ( senior or seniors or elderly or older ) (108768) 6. S4 or S5 (391502) 7. S3 and S6 (7562) 8. (MH "Clinical Trials+") (134839) 9. (MH "Evaluation Research+") (17947) 10. (MH "Comparative Studies") (65407) 11. (MH "Crossover Design") (8833) 12. PT clinical trial (69009) 13. (MH "Random Assignment") (31719) 14. S8 or S9 or S10 or S11 or S12 or S13 (221068) 15. TX ((clinical or controlled or comparative or placebo or prospective or randomi?ed) and (trial or study)) (382157) 16. TX (random* and (allocat* or allot* or assign* or basis* or divid* or order*)) (55209) 17.TX ((singl* or doubl* or trebl* or tripl*) and (blind* or mask*)) (602431) 18.TX ( crossover* or 'cross over' ) OR TX cross n1 over (11218) 19. TX ((allocat* or allot* or assign* or divid*) and (condition* or experiment* or intervention* or treatment* or therap* or control* or group*)) (68956) 20 S15 or S16 or S17 or S18 or S19 (912682) 21. S14 or S20 (968269) 22. S7 and S21 (3604)
Appendix 2. 'Risk of bias' assessment tool
| Domain | Criteria for judging risk of bias |
|
Random sequence generation Relating to selection bias (biased allocation to interventions) due to inadequate generation of a randomised sequence |
Judgement of 'Low risk' if A random component in the sequence generation was described, e.g. referring to a random number table; using a computer random number generator; coin tossing; shuffling cards or envelopes; throwing dice; drawing of lots; minimisation. Judgement of 'High risk' if A systematic non‐random method was used, e.g. date of admission; odd or even date of birth; case record number; clinician judgement; participant preference; patient risk factor score or test results; availability of intervention. Judgement of 'Unclear' if Insufficient information about the sequence generation process to permit judgement of 'Low risk' or 'High risk'. |
|
Allocation concealment Relating to selection bias (biased allocation to interventions) due to inadequate concealment of allocations prior to assignment |
Judgement of 'Low risk' in studies using individual randomisation if Allocation concealment was described as by central allocation (telephone, web‐based, or pharmacy‐controlled randomisation); sequentially‐numbered identical drug containers; sequentially‐numbered, opaque, sealed envelopes. in studies using cluster randomisation if Allocation of all cluster units performed at the start of the study AND Individual participant recruitment was completed prior to assignment of the cluster, and the same participants were followed up over time OR individual participants were recruited after cluster assignment, but recruitment carried out by a person unaware of group allocation and participant characteristics (e.g. fall history) OR individual participants in intervention and control arms were invited by mail questionnaire with identical information. Judgement of 'High risk' in studies using individual randomisation if Investigators enrolling participants could possibly foresee assignments and thus introduce selection bias, e.g. using an open random allocation schedule (e.g. a list of random numbers); assignment envelopes unsealed, non‐opaque, or not sequentially numbered; alternation or rotation; date of birth; case record number; or any other explicitly unconcealed procedure. in studies using cluster‐randomisation if Individual participant recruitment was undertaken after group allocation by a person who was unblinded and may have had knowledge of participant characteristics. Judgement of 'Unclear' if Insufficient information to permit judgement of 'Low risk' or 'High risk'. This is usually the case if the method of concealment is not described or not described in sufficient detail to allow a definite judgement, e.g. if the use of assignment envelopes is described, but it remains unclear whether envelopes were sequentially numbered, opaque and sealed. |
|
Blinding of participants and personnel Relating to performance bias due to knowledge of the allocated interventions by participants and personnel carrying out the interventions |
Judgement of 'Low risk' if Blinding of participants and personnel implementing the interventions ensured, and unlikely that the blinding could have been broken (e.g. control group received matching placebo medication prepared by a pharmacist) OR no blinding or incomplete blinding, but the review authors judge that the outcomes (falls and fractures) are not likely to be influenced by lack of blinding. Judgement of 'High risk' if Participants and/or intervention delivery personnel were not blind to group allocation (e.g. exercise intervention), and the outcomes (falls and fractures) are likely to be influenced by lack of blinding. Judgement of 'Unclear' if Insufficient information to make a judgement of 'Low risk' or 'High risk'. |
|
Blinding of outcome assessment Relating to detection bias due to knowledge of the allocated interventions by outcome assessors |
a. Falls and fallers:
Judgement of 'Low risk' if Falls were recorded/confirmed in all allocated groups using the same method AND the personnel recording/confirming falls were blind to group allocation. Judgement of 'High risk' if Falls were NOT recorded/confirmed in all allocated groups using the same method OR the personnel recording/confirming falls were NOT blind to group allocation. Judgement of 'Unclear' if Insufficient information to make a judgement of 'Low risk' or 'High risk'. b. Fractures: Judgement of 'Low risk' if Fractures were recorded/confirmed in all allocated groups using the same method AND fractures were confirmed by the results of radiological examination or from primary care case records AND the personnel recording/confirming fractures were blind to group allocation. Judgement of 'High risk' if Fractures were NOT recorded/confirmed in all allocated groups using the same method OR the only evidence for fractures was from self reports from participants or carers. Judgement of 'Unclear' if Insufficient information to make a judgement of 'Low risk' or 'High risk'. |
|
Incomplete outcome data Relating to attrition bias due to amount, nature or handling of incomplete outcome data |
a. Falls SeeAppendix 3 for details. b. Fallers SeeAppendix 3 for details. |
|
Method of ascertaining falls Relating to bias in the recall of falls due to unreliable methods of ascertainment |
Judgement of 'Low risk' if The study used some form of concurrent collection of data about falling, e.g. participants given postcards to fill in daily and mail back monthly, calendar to mark etc, with monthly, or more frequent, follow‐up by the researchers. Judgement of 'High risk' if Ascertainment relied on participant recall at longer intervals than one month during the study or at its conclusion. Judgement of 'Unclear' if there was retrospective recall over a short period only, or details of ascertainment were not described, i.e. insufficient information was provided to allow a judgement of 'Low risk' or 'High risk'. |
Adapted from Table 8.5.a 'The Cochrane Collaboration's tool for assessing risk of bias' and Table 8.5.d 'Criteria for judging risk of bias in the 'Risk of bias' assessment tool' (Higgins 2011a)
Appendix 3. 'Risk of bias' assessment methods for incomplete outcome data (attrition bias)
Falls
For studies reporting falls as an outcome, we first calculated a rate ratio (RaR1) by dividing falls per person year in the intervention group by falls per person year in the control group. If these data or the numbers lost to follow‐up in each group were not available we assessed the risk of bias as 'Unclear'. We estimated a second rate of falling for all participants randomised (RaR2) by using the conservative assumption that participants lost to follow‐up in the intervention group had the same rate of falls as observed in the control group, and vice versa.
A ratio of these rate ratios (RaR2/RaR1) of greater than 1.15 or less than 0.85 was assessed as 'High risk' indicating the possibility of clinically important bias; studies with values between 0.85 and 1.15 were assessed as 'Low risk'.
Fallers
For risk of falling, we first calculated for intervention and control groups in each study a risk of falling and a risk of falling ratio (RR1) using for each group the number of participants falling divided by the number analysed. Where the number analysed in each group was not provided, we used as denominator the number in each group providing complete data on falling throughout the study period. Where these data were not specifically mentioned, we used number of participants randomised less the number lost to follow‐up as the denominator.
Using the conservative assumption that participants lost to follow‐up in the intervention group had experienced the risk of falling observed in the control group, and vice‐versa, we calculated an estimated risk of falling ratio for all participants randomised (RR2). We added an imputed number of fallers in each group (the number of lost participants who might have experienced a fall) to the observed number of fallers in each group. The number randomised to that group was used as the denominator.
A ratio of the risk ratios RR2/RR1 of greater than 1.15 or less than 0.85 was assessed as 'High risk' indicating the possibility of clinically important bias; values between 0.85 and 1.15 were assessed as 'Low risk'. When data were not available to calculate RR1 and RR2, risk was assessed as 'Unclear'.
Appendix 4. Description of included studies: reference links
Appendix 5. Mean baseline vitamin D levels (25(OH)D) in included trials (nmol/L)
| Study | Overall | Intervention | Control | Men | Women | Selection criterion |
| Bischoff‐Ferrari 2006 | 74.7 (SD 38.3) | ND | ND | 82.9 (SD 44.9) | 66.4 (SD 31.7) | No |
| Bischoff‐Ferrari 2010 | 31.8 (SD 19.6)a | Factorial design: 2000 IU/d 32.9 (SD 20.2)a 800 IU/d 30.7 (SD 19.2)a extended PT 34.9 (SD 22.0)a standard PT 28.7 (SD 17.0)a |
NA | ND | ND | No |
| Dhesi 2004 | (range 23.7 to 28.0)a | 26.7 (range 25.5 to 28.0)a | 25.0 (range 23.7 to 26.1)a | ND | ND | Yes 25(OH)D ≤ 30a |
| Dukas 2004 | 72.6 (SD 27.9)a | 74.6 (SD 29.0)a | 70.6 (SD 26.7)a | ND | ND | No |
| Gallagher 2001 | 79.3 (SD 24.7) | 78.0 (SD 21.6)b | 80.5 (SD 27.4) | ND | ND | No |
| Grant 2005 | 38.8 (SD 15.6)c | 38.0 (SD 16.3)c | 39.5 (SD 14.8)c | ND | ND | No |
| Harwood 2004 | 29.5 (range 6 to 85) | 29 (range 6 to 85) | 30 (range 12 to 64) | NA | 29 (range 6 to 85) | No |
| Kärkkäinen 2010 | 49.7 (SD18.3) | 50.1 (SD 18.8) | 49.2 (SD 17.7) | NA | 49.7 (SD 18.3) | No |
| Latham 2003 | ND | 37.4 (95% CI 34.9 to 44.9)a | 47.4 (95% CI 39.9 to 52.4)a | ND | ND | No |
| Pfeifer 2000 | 25.2 (SD 12.9) | 25.7 (SD 13.6) | 24.6 (SD 12.1) | NA | ND | Yes 25(OH)D < 50 |
| Pfeifer 2009 | 54.5 (SD 18) | 55 (SD 18) | 54 (SD 18) | ND | ND | YES 25(OH)D < 78 |
| Porthouse 2005 | ND | ND | ND | ND | ND | No |
| Prince 2008 | 44.8 (SD 12.7)a | 45.2 (SD 12.5)a | 44.3 (SD 12.8)a | ND | ND | Yes 25(OH)D < 59.9a |
| Sanders 2010 | ND | Median (IQR) 53 (40 to 65) |
Median (IQR) 45 (40 to 57) |
NA | ND | 36% (819/2256) were classified as being at high risk of low vitamin D at baseline |
| Smith 2007 | ND | ND | ND | ND | ND | No |
| Trivedi 2003 | ND | ND | ND | ND | ND | No |
a Converted from ng/mL (ng/mL x 2.496 = nmol/L) b Calcitriol alone intervention group c Data from two trial centres only (random as stratified by trial centre) NA: not applicable ND: no data available 25(OH)D: 25‐hydroxyvitamin D
Appendix 6. Categories of exercise (ProFaNE) in interventions containing exercise alone
| Study ID | Gait/balance/functional training | Strength/resistance training | Flexibility | 3D (Tai Chi, dance etc) | General physical activity | Endurance | Other |
| Ballard 2004 | *****a | ***** | ***** | ***** | |||
| Barnett 2003 | ***** | ***** | ***** | ***** | |||
| Beyer 2007 | ***** | ***** | ***** | ||||
| Bischoff‐Ferrari 2010 | ***** extended physiotherapy groupsb |
***** extended physiotherapy groups |
|||||
| Brown 2002 | ***** | ***** | ***** | ***** | |||
| Buchner 1997a | ***** | ***** | |||||
| Bunout 2005 | ***** | ***** | |||||
| Campbell 1997 | ***** | ***** | ***** | ***** | |||
| Campbell 1999 | ***** | ***** | ***** | ***** | |||
| Carter 2002 | ***** | ***** | ***** | ||||
| Cerny 1998 | ***** | ***** | ***** | ***** | |||
| Clemson 2010 | ***** embedded in daily activities | ***** embedded in daily activities | |||||
| Cornillon 2002 | ***** | ? | ? | ? | ? | ||
| Dangour 2011 | ***** | ***** (dance) |
***** | ||||
| Davis 2011a | ***** balance and tone group |
***** once‐weekly, and twice‐weekly resistance training groups |
***** balance and tone group |
***** balance and tone group (core strength, pelvic floor, relaxation) |
|||
| Day 2002 | ***** | ***** | ***** | ||||
| Fiatarone 1997 | ***** | ||||||
| Grahn Kronhed 2009 | ***** | ***** | ***** | ***** | |||
| Hauer 2001 | ***** | ***** | ***** | ***** | |||
| Helbostad 2004 | ***** | ***** | |||||
| Haines 2009 | ***** | ***** | ***** (dynamic slow movement similar to Tai Chi) |
||||
| Huang 2010 | ***** | ||||||
| Iwamoto 2009 | ***** | ***** | ***** | ***** (multi‐directional stepping to improve walking ability) |
|||
| Kamide 2009 | ***** | ***** | ***** | ||||
| Kemmler 2010 | ***** high‐intensity group low‐intensity group |
***** high‐intensity group low‐intensity group |
***** high‐intensity group low‐intensity group |
***** high‐intensity group (dance) low‐intensity group (dance) |
***** high‐intensity group low‐intensity group |
||
| Korpelainen 2006 | ***** | ***** (dance) | ***** (stamping) | ||||
| Latham 2003 | ***** | ||||||
| Li 2005 | ***** | ||||||
| Lin 2007 | ***** | ***** | ***** | ||||
| Liu‐Ambrose 2004 | ***** agility training group | ***** resistance training group | |||||
| Liu‐Ambrose 2008 | ***** | ***** | ***** | ***** | |||
| Logghe 2009 | ***** | ||||||
| Lord 1995 | ***** | ***** | ***** | ||||
| Lord 2003 | ***** | ***** | ***** | ***** (dance) | |||
| Luukinen 2007 | ***** | ***** | ***** | ***** (self care) | |||
| Madureira 2010 | ***** | ***** | ***** | ||||
| McMurdo 1997 | ***** | ||||||
| Means 2005 | ***** | ***** | ***** | ||||
| Morgan 2004 | ***** | ***** | ***** | ||||
| Nitz 2004 | ***** | ***** | ***** | ||||
| Pereira 1998 | ***** (walking) |
||||||
| Reinsch 1992 | ***** "stand up/step up" group | ***** "stand up/step up" group | |||||
| Resnick 2002 | ***** (walking) |
||||||
| Robertson 2001a | ***** | ***** | ***** | ***** | |||
| Rubenstein 2000 | ***** | ***** | ***** | ||||
| Sherrington 2004 | ***** | ***** | |||||
| Shigematsu 2008 | ***** square stepping group | ***** walking group | |||||
| Skelton 2005 | ***** | ***** | ***** | ***** | |||
| Smulders 2010 | ***** | ***** (walking) |
***** | ***** (training in fall techniques, lifting techniques) |
|||
| Steadman 2003 | ***** | ||||||
| Suzuki 2004 | ***** | ***** | ***** | ***** | |||
| Trombetti 2011 | ***** | ***** | ***** (multi‐directional weight‐shifting exercises while walking and standing to different music rhythms) |
||||
| Voukelatos 2007 | ***** | ||||||
| Weerdesteyn 2006 | ***** | ||||||
| Wolf 1996 | ***** balance platform training group | ***** Tai Chi group | |||||
| Wolf 2003 | ***** | ||||||
| Woo 2007 | ***** resistance training group | ***** Tai Chi group | |||||
| Wu 2010 | ***** telecommunication group (home) community‐centre group DVD group (home) |
***** telecommunication group (home) community‐centre group DVD group (home) |
|||||
| Yamada 2010 | ***** | ***** | ***** | ***** | ***** |
a ***** indicates exercise categories in intervention
b "groups" are separate arms in the trial, i.e. people were randomised to the separate groups
Appendix 7. Source of data for generic inverse variance analysis (see footnotes for explanation of codes)
| Study ID |
Source for rate ratio (falls) |
Source for risk ratio (fallers) |
Source for risk ratio (number with fractures) |
| Assantachai 2002 | NA | 7c | NA |
| Ballard 2004 | 3 | 7 | NA |
| Barnett 2003 | 1 | 5 | NA |
| Beling 2009 | 3 | NA | NA |
| Beyer 2007 | NA | 7 | NA |
| Bischoff‐Ferrari 2006 | 3 | 6a | 7 |
| Bischoff‐Ferrari 2010 | 1 | NA | 7 |
| Blalock 2010 | 3 | 7 | NA |
| Brown 2002 | NA | 7 | NA |
| Buchner 1997a | 1 | 4 | NA |
| Bunout 2005 | 3 | 7 | NA |
| Campbell 1997 | 2 | 4 | NA |
| Campbell 1999 | 2a | 5 | NA |
| Campbell 2005 | 1 | 7 | NA |
| Carpenter 1990 | 3 | NA | NA |
| Carter 1997 | NA | 7 | NA |
| Carter 2002 | 3 | NA | NA |
| Cerny 1998 | NA | 7 | NA |
| Ciaschini 2009 | NA | 5 | 5 |
| Clemson 2004 | 1 | 5 | NA |
| Clemson 2010 | 1 | 7 | NA |
| Close 1999 | 3 | 6a | 7 |
| Coleman 1999 | NA | 7c | NA |
| Comans 2010 | 1 | 7 | NA |
| Conroy 2010 | 1a | 4 | 7 |
| Cornillon 2002 | 3 | 7 | NA |
| Cumming 1999 | 2 | 4 | NA |
| Cumming 2007 | 1 | 4 | 4 |
| Dangour 2011 | NA | 7c | ND |
| Dapp 2011 | NA | 7 | NA |
| Davis 2011a | 1 | NA | NA |
| Davison 2005 | 1 | 5 | 5 |
| Day 2002 | 1 | 4 | NA |
| De Vries 2010 | NA | 4 | 4 |
| Dhesi 2004 | 3 | 7 | NA |
| Di Monaco 2008 | 3 | 7 | NA |
| Dukas 2004 | NA | 6a | NA |
| Elley 2008 | 1 | 7 | NA |
| Fabacher 1994 | NA | 7 | NA |
| Faes 2011 | 1 | 7 | NA |
| Fiatarone 1997 | NA | ND | NA |
| Foss 2006 | 1 | 4 | 5 |
| Fox 2010 | NA | 6a | NA |
| Gallagher 1996 | 3 | NA | NA |
| Gallagher 2001 | 1a | 6a (vitamin D group vs control) 7 (HRT group vs control and vitamin D + HRT group vs control) |
5 |
| Gill 2008 | NA | 7 | NA |
| Grahn Kronhed 2009 | ND | NA | ND |
| Grant 2005 | NA | 4 | 4 |
| Gray‐Donald 1995 | NA | 7 | NA |
| Greenspan 2005 | NA | 7 | NA |
| Haines 2009 | 1 | 7 | 7 |
| Haran 2010 | 1 | 7 | 7 |
| Harari 2008 | NA | ND (multiple fallers only) | NA |
| Harwood 2004 | NA | 7 | 7 |
| Harwood 2005 | 1 | 4 | 5 |
| Hauer 2001 | NA | 5 | NA |
| Helbostad 2004 | 3 | 7 | NA |
| Hendriks 2008 | NA | 4 | NA |
| Hill 2000 | 3 | NA | NA |
| Hogan 2001 | 2a | 7 | 7 |
| Hornbrook 1994 | 3 | 7 | ND |
| Huang 2004 | NA | 7 | NA |
| Huang 2005 | NA | 7 | NA |
| Huang 2010 | NA | 7c | NA |
| Huang 2011 | 3 | 7 | NA |
| Iwamoto 2009 | ND | 7 | ND |
| Jitapunkul 1998 | NA | 7 | NA |
| Kamide 2009 | ND | 7 | NA |
| Kärkkäinen 2010 | 3 | 5 | 4 |
| Kemmler 2010 | 3 | 5 | ND |
| Kenny 2001 | 1 | NA | 7 |
| Kingston 2001 | NA | 7 | NA |
| Korpelainen 2006 | 3 | NA | 7 |
| Lannin 2007 | NA | 7 | NA |
| Latham 2003 | 3 | 4 | NA |
| Li 2005 | 2a | 4 | NA |
| Lightbody 2002 | 3 | 7 | 7 |
| Lin 2007 | 3 | NA | NA |
| Liu‐Ambrose 2004 | 3 | ND (multiple fallers only) | NA |
| Liu‐Ambrose 2008 | 1 | 7 | NA |
| Logan 2010 | 1a | 4a | ND |
| Logghe 2009 | 2 | 7 | NA |
| Lord 1995 | 3 | 5 | NA |
| Lord 2003 | 1a | NA | NA |
| Lord 2005 | 3 | 7 | NA |
| Luukinen 2007 | 2 | 7 | NA |
| Madureira 2010 | ND | NA | NA |
| Mahoney 2007 | 1 | NA | NA |
| Markle‐Reid 2010 | 3 | 7 | ND |
| McKiernan 2005 | 1 | NA | NA |
| McMurdo 1997 | 3 | 7 | 7 |
| McMurdo 2009 | ND | 7 | NA |
| Means 2005 | 3 | 7 | NA |
| Meredith 2002 | NA | 7 | NA |
| Morgan 2004 | NA | 7 | NA |
| Newbury 2001 | NA | 6 | NA |
| Nikolaus 2003 | 1 | NA | 7 |
| Nitz 2004 | 3 | NA | NA |
| Pardessus 2002 | NA | 7 | NA |
| Parry 2009 | 1a | 7 | ND |
| Pereira 1998 | NA | 7 | NA |
| Perry 2008 | NA | 7 | NA |
| Pfeifer 2000 | 3 | 7 | 7 |
| Pfeifer 2009 | ND | 4 | 7 |
| Pighills 2011 (OT) | 1 | 7 | NA |
| Pighills 2011 (non‐OT) | 1 | 7 | NA |
| Pighills 2011 (OT + non‐OT) | ND | 7 | NA |
| Pit 2007 | NA | 6a | NA |
| Porthouse 2005 | 3 | 6a | 6a |
| Prince 2008 | NA | 6 | ND |
| Ralston 2011 | NA | 4 | NA |
| Reid 2006 | ND | NA | 4 |
| Reinsch 1992 | NA | 7c | NA |
| Resnick 2002 | ND | NA | NA |
| Robertson 2001a | 1 | 7 | 7 |
| Robson 2003 | NA | 7 | NA |
| Rubenstein 2000 | 3 | 7 | NA |
| Rubenstein 2007 | 3c | 7c | NA |
| Russell 2010 | 1 | 5 | 5 |
| Ryan 1996 | 3 | 7 | NA |
| Ryan 2010 | 1 | 4 | NA |
| Salminen 2009 | 1 | 7 | NA |
| Sanders 2010 | 1 | 4 | 7 |
| Sato 2005a (Retracted) | ND | NA | 7 |
| Schrijnemaekers 1995 | NA | 7 | NA |
| Sherrington 2004 | NA | 7 | NA |
| Shigematsu 2008 | 3 | 7 | NA |
| Shumway‐Cook 2007 | 1 | 5 | NA |
| Shyu 2010 | NA | 6 | NA |
| Skelton 2005 | 1 | 7 | NA |
| Smith 2007 | NA | 4a | 4a |
| Smulders 2010 | 1 | 7 | 7 |
| Spice 2009 | NA | 7c | NA |
| Spink 2011 | 1 | 5 | 5 |
| Steadman 2003 | 3 | NA | NA |
| Steinberg 2000 | 3c | 7c | NA |
| Stevens 2001 | 1a | 6b | NA |
| Suman 2011 | 1 | 6 | 7 |
| Suzuki 2004 | 3 | 7 | NA |
| Swanenburg 2007 | 3 | NA | NA |
| Tinetti 1994 | 1ac | 7c | 7c |
| Trivedi 2003 | NA | 5a | 5a |
| Trombetti 2011 | 1 | 4 | NA |
| Van Haastregt 2000 | NA | 7 | NA |
| Van Rossum 1993 | ND | NA | NA |
| Vellas 1991 | ND | NA | NA |
| Vetter 1992 | NA | 7 | 7 |
| Vind 2009 | 1 | 4 | ND |
| Von Stengel 2011 | 1 | NA | 7 |
| Voukelatos 2007 | 1 | 4 | NA |
| Wagner 1994 | ND | 7 | NA |
| Weber 2008 | ND | ND | NA |
| Weerdesteyn 2006 | 3 | 7 | NA |
| Whitehead 2003 | NA | 6a | NA |
| Wilder 2001 | ND | NA | NA |
| Wolf 1996 | 3 | NA | NA |
| Wolf 2003 | 2b | 7c | NA |
| Woo 2007 | NA | 7 | NA |
| Wu 2010 | ND | NA | NA |
| Wyman 2005 | 1 | 7 | NA |
| Yamada 2010 | 1 | 7 | NA |
|
Abbreviations:
OT: occupational therapist group non‐OT: trained assessor group OT + non‐OT: occupational therapist group + trained assessor group Codes for source of rate ratio: 1: incidence rate ratio reported by trial authors 2: hazard ratio/relative hazard (multiple events) reported by trial authors 3: incidence rate ratio calculated by review authors a: adjusted for confounders by trial authors b: adjusted for clustering by trial authors c: adjusted for clustering by review authors Codes for source of risk ratio: 4: hazard ratio/relative hazard (first fall only) reported by trial authors 5: relative risk reported by trial authors 6: odds ratio reported by trial authors 7: relative risk calculated by review authors a: adjusted for confounders by trial authors b: adjusted for clustering by trial authors c: adjusted for clustering by review authors NA: not applicable. Falls (for rate ratio) or fallers (for risk ratio) or number of people sustaining a fracture (for risk ratio) not reported as an outcome in the trial ND: outcomes relating to falls or fallers or fractures were reported, but there were no useable data; results from the paper reported in the text of the review | |||
Appendix 8. Raw data for rate of falls and number of fallers when available
| Study ID | Intervention group: falls per person year | Control group: falls per person year | Intervention group: number of fallers | Intervention group: number in analysis | Intervention group: proportion of fallers | Control group: number of fallers | Control group: number in analysis | Control group: proportion of fallers | Follow‐up |
| Assantachai 2002 | — | — | 125 | 430 | 0.29 | 145 | 385 | 0.38 | 12 mo |
| Ballard 2004 | 0.16 | 0.41 | 4 | 20 | 0.20 | 7 | 19 | 0.37 | 16 mo |
| Barnett 2003 | 0.605 | 0.946 | 27 | 76 | 0.36 | 37 | 74 | 0.50 | 12 mo |
| Beling 2009 | 0.36 | 2.00 | — | 11 | — | — | 8 | — | 3 mo |
| Beyer 2007 | — | — | 12 | 24 | 0.50 | 14 | 29 | 0.48 | 12 mo |
| Bischoff‐Ferrari 2006 | 0.42 | 0.37 | 107 | 219 | 0.49 | 124 | 226 | 0.55 | 36 mo |
| Bischoff‐Ferrari 2010 Cholecalciferol 2000 IU/d vs 800 IU/d | 1.63 | 1.25 | — | 86 | — | — | 87 | — | 12 mo |
| Extended vs standard physiotherapy | 1.21 | 1.66 | — | 87 | — | — | 86 | — | 12 mo |
| Blalock 2010 | 2.16 | 2.13 | 53 | 93 | 0.57 | 52 | 93 | 0.56 | 12 mo |
| Brown 2002 Exercise classes vs control | — | — | 20 | 39 | 0.51 | 21 | 32 | 0.66 | 14 mo |
| Social sessions vs control | — | — | 24 | 37 | 0.65 | 21 | 32 | 0.66 | 14 mo |
| Buchner 1997a | 0.49 | 0.81 | 29 | 70 | 0.41 | 18 | 30 | 0.60 | 25 mo |
| Bunout 2005 | 0.23 | 0.18 | 23 | 111 | 0.21 | 16 | 130 | 0.12 | 12 mo |
| Campbell 1997 | 0.87 | 1.34 | 53 | 116 | 0.46 | 62 | 117 | 0.53 | 12 mo |
| Campbell 1999 Home exercise vs remainder | 0.71 | 0.97 | 12 | 45 | 0.27 | 16 | 48 | 0.33 | 11 mo |
| Withdrawal of psychotropic medication vs remainder | 0.52 | 1.16 | 11 | 48 | 0.23 | 17 | 45 | 0.38 | 11 mo |
| Campbell 2005 Home exercise + vitamin D vs remainder | 1.23 | 1.13 | 94 | 195 | 0.48 | 95 | 196 | 0.48 | 12 mo |
| Home safety vs remainder | 0.90 | 1.47 | 83 | 198 | 0.42 | 106 | 193 | 0.55 | 12 mo |
| Carpenter 1990 | 0.80 | 2.32 | — | 181 | — | — | 186 | — | 1 mo |
| Carter 1997 Feedback on home safety checklist, pamphlet on medicines | — | — | 19 | 163 | 0.12 | 29 | 161 | 0.18 | 3 mo |
| Home safety + medication review | — | — | 19 | 133 | 0.14 | 29 | 161 | 0.18 | 3 mo |
| Carter 2002 | 0.46 | 0.52 | — | 40 | — | — | 40 | — | 5 mo |
| Cerny 1998 | — | — | 3 | 15 | 0.20 | 3 | 13 | 0.23 | 6 mo |
| Ciaschini 2009 | — | — | 26 | 101 | 0.26 | 17 | 100 | 0.17 | 6 mo |
| Clemson 2004 | — | — | 82 | 157 | 0.52 | 89 | 153 | 0.58 | 14 mo |
| Clemson 2010 | — | — | 8 | 17 | 0.47 | 9 | 14 | 0.64 | 6 mo |
| Close 1999 | 1.30 | 3.13 | 59 | 184 | 0.32 | 111 | 213 | 0.52 | 12 mo |
| Coleman 1999 | — | — | 34 | 79 | 0.43 | 24 | 63 | 0.38 | 12 mo |
| Comans 2010 | 1.1 | 2.3 | 12 | 32 | 0.38 | 27 | 41 | 0.66 | 6 mo |
| Conroy 2010 | 1.7 | 2.0 | 69 | 136 | 0.51 | 73 | 138 | 0.53 | 12 mo |
| Cornillon 2002 | 0.39 | 0.47 | 39 | 150 | 0.26 | 48 | 153 | 0.31 | 12 mo |
| Cumming 1999 | — | — | 96 | 264 | 0.36 | 119 | 266 | 0.45 | 12 mo |
| Cumming 2007 | — | — | 201 | 309 | 0.65 | 153 | 307 | 0.50 | 12 mo |
|
Dangour 2011 Group exercise classes vs remainder |
— | — | 402 | 854 | 0.47 | 389 | 811 | 0.48 | 24 mo |
| Nutritional supplement vs remainder | — | — | 404 | 865 | 0.47 | 387 | 800 | 0.48 | 24 mo |
| Dapp 2011 | — | — | 130 | 587 | 0.22 | 332 | 1376 | 0.24 | 12 mo |
| Davis 2011a Once weekly resistance training vs balance and tone classes | — | — | — | 54 | — | — | 49 | — | 12 mo |
| Twice weekly resistance training vs balance and tone classes | — | — | — | 52 | — | — | 49 | — | 12 mo |
| Davison 2005 | 3.3 | 5.1 | 94 | 144 | 0.65 | 102 | 149 | 0.68 | 12 mo |
| Day 2002 Exercise vs remainder | 0.91 | 1.14 | 279 | 541 | 0.52 | 327 | 549 | 0.60 | 18 mo |
| Vision intervention vs remainder | 0.98 | 1.08 | 291 | 547 | 0.53 | 315 | 543 | 0.58 | 18 mo |
| Home safety intervention vs remainder | 1.02 | 1.04 | 285 | 543 | 0.52 | 321 | 547 | 0.59 | 18 mo |
| Exercise + vision vs remainder | 0.74 | — | 66 | 136 | 0.49 | 470 | 954 | 0.49 | 18 mo |
| Exercise + home safety vs remainder | 0.88 | — | 72 | 135 | 0.53 | 471 | 955 | 0.49 | 18 mo |
| Vision + home safety vs remainder | 1.06 | — | 78 | 137 | 0.57 | 469 | 953 | 0.49 | 18 mo |
| Exercise + vision + home safety vs remainder | 0.96 | — | 65 | 135 | 0.48 | 471 | 955 | 0.49 | 18 mo |
| De Vries 2010 | — | — | 55 | 106 | 0.52 | 62 | 111 | 0.56 | 12 mo |
| Dhesi 2004 | 0.48 | 0.79 | 11 | 62 | 0.18 | 14 | 61 | 0.23 | 6 mo |
| Di Monaco 2008 | 0.37 | 0.79 | 6 | 45 | 0.13 | 13 | 50 | 0.26 | 6 mo |
| Dukas 2004 | — | — | 40 | 166 | 0.24 | 46 | 155 | 0.30 | 9 mo |
| Elley 2008 | 1.91 | 2.01 | 106 | 155 | 0.68 | 98 | 157 | 0.62 | 12 mo |
| Fabacher 1994 | — | — | 14 | 100 | 0.14 | 22 | 95 | 0.23 | 12 mo |
| Faes 2011 | 4.94 | 1.17 | 10 | 18 | 0.56 | 6 | 15 | 0.40 | 7 mo |
| Fiatarone 1997 | — | — | — | — | — | — | — | — | 4 mo |
| Foss 2006 | 1.06 | 1.57 | 48 | 120 | 0.40 | 41 | 119 | 0.34 | 12 mo |
| Fox 2010 | — | — | — | 288 | — | — | 264 | — | 12 mo |
| Gallagher 1996 | 3.40 | 4.20 | — | 50 | — | — | 50 | — | 6 mo |
|
Gallagher 2001 Vitamin D vs control |
0.27 | 0.43 | 50 | 101 | 0.50 | 72 | 112 | 0.64 | 36 mo |
| HRT vs control | 0.39 | 0.43 | 57 | 100 | 0.57 | 72 | 112 | 0.64 | 36 mo |
| HRT + vitamin D vs control | 0.35 | 0.43 | 59 | 102 | 0.58 | 72 | 112 | 0.64 | 36 mo |
| Gill 2008 | — | — | 51 | 117 | 0.44 | 53 | 117 | 0.45 | 12 mo |
| Grahn Kronhed 2009 | — | — | — | — | — | — | — | — | 12 mo |
| Grant 2005 Vitamin D vs no vitamin D | — | — | 380 | 2649 | 0.14 | 381 | 2643 | 0.14 | 4 mo |
| Gray‐Donald 1995 | — | — | 0 | 22 | 0.00 | 5 | 24 | 0.21 | 3 mo |
| Greenspan 2005 | — | — | 93 | 187 | 0.50 | 94 | 185 | 0.51 | 36 mo |
| Haines 2009 | — | — | 11 | 19 | 0.58 | 20 | 34 | 0.59 | 6 mo |
| Haran 2010 | 1.54 | 1.66 | 170 | 299 | 0.57 | 175 | 298 | 0.59 | 13 mo |
| Harari 2008 | — | — | — | — | — | — | — | — | 12 mo |
| Harwood 2004 | — | — | 15 | 84 | 0.18 | 13 | 35 | 0.37 | 12 mo |
| Harwood 2005 | 0.37 | 0.55 | 76 | 142 | 0.54 | 69 | 131 | 0.53 | 12 mo |
| Hauer 2001 | — | — | 14 | 31 | 0.45 | 15 | 25 | 0.60 | 6 mo |
| Helbostad 2004 | 1.45 | 1.33 | 20 | 34 | 0.59 | 18 | 34 | 0.53 | 12 mo |
| Hendriks 2008 | — | — | 55 | 124 | 0.44 | 63 | 134 | 0.47 | 12 mo |
| Hill 2000 | 8.4 | 9.4 | — | 40 | — | — | 38 | — | 6 mo |
| Hogan 2001 | — | — | 54 | 75 | 0.72 | 61 | 77 | 0.79 | 12 mo |
| Hornbrook 1994 | 0.586 | 0.699 | 628 | 1611 | 0.39 | 691 | 1571 | 0.44 | 23 mo |
| Huang 2004 | — | — | 0 | 55 | 0.00 | 4 | 58 | 0.07 | 2 mo |
| Huang 2005 | — | — | 5 | 63 | 0.08 | 7 | 59 | 0.12 | 3 mo |
| Huang 2010 Education programme vs control | — | — | 2 | 29 | 0.07 | 2 | 47 | 0.04 | 5 mo |
| Tai Chi classes vs control | — | — | 0 | 31 | 0.00 | 2 | 47 | 0.04 | 5 mo |
| Tai Chi classes + education programme vs control | — | — | 3 | 56 | 0.05 | 2 | 47 | 0.04 | 5 mo |
| Huang 2011 Cognitive behavioural therapy vs control | 0.01 | 0.01 | 8 | 60 | 0.13 | 8 | 60 | 0.13 | 3 mo |
| Cognitive behavioural therapy + Tai Chi classes vs control | 0.01 | 0.004 | 3 | 56 | 0.05 | 8 | 60 | 0.13 | 3 mo |
| Iwamoto 2009 | 0.00 | 0.29 | 0 | 34 | 0.00 | 4 | 33 | 0.12 | 5 mo |
| Jitapunkul 1998 | — | — | 3 | 57 | 0.05 | 6 | 59 | 0.10 | 3 mo |
| Kamide 2009 | — | — | 0 | 20 | 0.00 | 1 | 23 | 0.04 | 6 mo |
| Kärkkäinen 2010 | 0.39 | 0.41 | 812 | 1566 | 0.52 | 833 | 1573 | 0.53 | 36 mo |
| Kemmler 2010 | 0.17 | 0.28 | — | 112 | — | — | 115 | — | 18 mo |
| Kenny 2001 | 4.1 | 9.3 | — | 84 | — | — | 87 | — | 12 mo |
| Kingston 2001 | — | — | 4 | 51 | 0.08 | 5 | 41 | 0.12 | 3 mo |
| Korpelainen 2006 | 0.42 | 0.53 | — | 84 | — | — | 76 | — | 30 mo |
| Lannin 2007 | — | — | 1 | 5 | 0.20 | 2 | 5 | 0.40 | 3 mo |
| Latham 2003 Resistance training vs no resistance training | 1.02 | 1.07 | 60 | 112 | 0.54 | 64 | 110 | 0.58 | 6 mo |
| Vitamin D vs no vitamin D | 1.11 | 0.99 | 64 | 108 | 0.59 | 60 | 114 | 0.53 | 6 mo |
| Li 2005 | 0.80 | 1.57 | 27 | 95 | 0.28 | 43 | 93 | 0.46 | 6 mo |
| Lightbody 2002 | 1.82 | 2.15 | 39 | 155 | 0.25 | 41 | 159 | 0.26 | 6 mo |
| Lin 2007 Home safety vs education | 0.40 | 0.88 | — | — | — | — | — | — | 6 mo |
| Home exercise vs education | 0.58 | 0.88 | — | — | — | — | — | — | 6 mo |
| Liu‐Ambrose 2004 Group resistance training vs stretching (sham) exercises | 1.13 | 0.63 | — | 32 | — | — | 32 | — | 6 mo |
| Group agility training vs stretching (sham) exercises | 0.65 | 0.63 | — | 34 | — | — | 32 | — | 6 mo |
| Liu‐Ambrose 2008 | — | — | 12 | 28 | 0.43 | 16 | 24 | 0.67 | 12 mo |
| Logan 2010 | 3.46 | 7.68 | 81 | 98 | 0.83 | 96 | 99 | 0.97 | 12 mo |
| Logghe 2009 | — | — | 58 | 138 | 0.42 | 59 | 131 | 0.45 | 12 mo |
| Lord 1995 | 0.53 | 0.63 | 26 | 75 | 0.35 | 33 | 94 | 0.35 | 12 mo |
| Lord 2003 | 0.67 | 0.85 | — | 259 | — | — | 249 | — | 12 mo |
| Lord 2005 Extensive intervention group vs control | 0.906 | 0.871 | 93 | 202 | 0.46 | 90 | 201 | 0.45 | 12 mo |
| Minimal intervention group vs control | 0.784 | 0.871 | 94 | 194 | 0.48 | 90 | 201 | 0.45 | 12 mo |
| Extensive + minimal intervention groups vs control | 0.846 | 0.871 | 187 | 396 | 0.47 | 90 | 201 | 0.45 | 12 mo |
| Luukinen 2007 | 1.23 | 1.15 | 126 | 217 | 0.58 | 136 | 220 | 0.62 | 16 mo |
| Madureira 2010 | — | — | — | 30 | — | — | 30 | — | 12 mo |
| Mahoney 2007 | 1.88 | 2.31 | — | 172 | — | — | 172 | — | 12 mo |
| Markle‐Reid 2010 | 0.73 | 0.67 | 28 | 49 | 0.57 | 20 | 43 | 0.47 | 6 mo |
| McKiernan 2005 | 1.91 | 3.67 | — | 55 | — | — | 54 | — | 3 mo |
| McMurdo 1997 | 0.17 | 0.32 | 13 | 44 | 0.30 | 21 | 48 | 0.44 | 24 mo |
| McMurdo 2009 | — | — | 26 | 93 | 0.28 | 33 | 98 | 0.34 | 4 mo |
| Means 2005 | 0.48 | 1.18 | 22 | 144 | 0.15 | 36 | 94 | 0.38 | 6 mo |
| Meredith 2002 | — | — | 17 | 130 | 0.13 | 15 | 129 | 0.12 | 3 mo |
| Morgan 2004 | — | — | 34 | 119 | 0.29 | 34 | 110 | 0.31 | 12 mo |
| Newbury 2001 | — | — | 12 | 45 | 0.27 | 17 | 44 | 0.39 | 12 mo |
| Nikolaus 2003 | 0.965 | 1.243 | — | 140 | — | — | 139 | — | 12 mo |
| Nitz 2004 | 1.00 | 1.24 | — | 24 | — | — | 21 | — | 6 mo |
| Pardessus 2002 | — | — | 13 | 30 | 0.43 | 15 | 30 | 0.50 | 12 mo |
| Parry 2009a | 6.51 | 8.31 | 16 | 25 | 0.64 | 14 | 25 | 0.56 | 6 mo |
| Pereira 1998 | — | — | 26 | 96 | 0.27 | 33 | 100 | 0.33 | 12 mo |
| Perry 2008 | — | — | 5 | 20 | 0.25 | 9 | 20 | 0.45 | 3 mo |
| Pfeifer 2000 | 0.24 | 0.45 | 11 | 70 | 0.16 | 19 | 67 | 0.28 | 12 mo |
| Pfeifer 2009 | — | — | 49 | 122 | 0.40 | 75 | 120 | 0.63 | 12 mo |
| Pighills 2011 Occupational therapist led environmental assessment vs control | — | — | 50 | 85 | 0.59 | 54 | 77 | 0.70 | 12 mo |
| Trained assessor led environmental assessment vs control | — | — | 50 | 71 | 0.70 | 54 | 77 | 0.70 | 12 mo |
| Occupational therapist group + trained assessor group combined vs control | — | — | 100 | 156 | 0.64 | 54 | 77 | 0.70 | 12 mo |
| Pit 2007 | — | — | 70 | 350 | 0.20 | 94 | 309 | 0.30 | 12 mo |
| Porthouse 2005 | 0.51 | 0.57 | 329 | 1125 | 0.29 | 561 | 1877 | 0.30 | 12 mo |
| Prince 2008 | — | — | 80 | 151 | 0.53 | 95 | 151 | 0.63 | 12 mo |
| Ralston 2011 | — | — | — | 257 | 0.24 | — | 258 | 0.30 | 12 mo |
| Reid 2006 | 0.595 | 0.585 | — | 620 | — | — | 635 | — | 60 mo |
| Reinsch 1992 Exercise vs no exercise | — | — | 55 | 129 | 0.43 | 34 | 101 | 0.34 | 12 mo |
| Cognitive‐behavioural vs no cognitive‐behavioural intervention | — | — | 50 | 123 | 0.41 | 39 | 107 | 0.36 | 12 mo |
| Resnick 2002 | — | — | — | 10 | — | — | 7 | — | 6 mo |
| Robertson 2001a | 0.69 | 1.01 | 38 | 121 | 0.31 | 51 | 119 | 0.43 | 12 mo |
| Robson 2003 | — | — | 41 | 235 | 0.17 | 55 | 236 | 0.23 | 4 mo |
| Rubenstein 2000 | 1.68 | 2.00 | 12 | 28 | 0.43 | 9 | 31 | 0.29 | 3 mo |
| Rubenstein 2007 | 1.51 | 1.27 | 160 | 327 | 0.49 | 167 | 352 | 0.47 | 12 mo |
| Russell 2010 | 2.77 | 4.24 | 163 | 320 | 0.51 | 151 | 330 | 0.46 | 12 mo |
| Ryan 1996 | 0.53 | 1.60 | 3 | 30 | 0.10 | 3 | 15 | 0.20 | 3 mo |
| Ryan 2010 | 1.71 | 1.32 | 44 | 66 | 0.67 | 33 | 62 | 0.53 | 24 mo |
| Salminen 2009 | 0.86 | 0.94 | 140 | 292 | 0.48 | 131 | 297 | 0.44 | 12 mo |
| Sanders 2010 | 0.834 | 0.727 | 837 | 1131 | 0.74 | 769 | 1125 | 0.68 | 60 mo |
| Sato 2005a (Retracted) | — | — | — | 90 | — | — | 88 | — | 24 mo |
| Schrijnemaekers 1995 | — | — | 17 | 85 | 0.20 | 26 | 97 | 0.27 | 6 mo |
| Sherrington 2004 Weight‐bearing exercise vs control | — | — | 11 | 35 | 0.31 | 15 | 36 | 0.42 | 4 mo |
| Non weight‐bearing exercise vs control | — | — | 11 | 37 | 0.30 | 15 | 36 | 0.42 | 4 mo |
| Shigematsu 2008 | 0.234 | 0.333 | 4 | 32 | 0.13 | 7 | 36 | 0.19 | 8 mo |
| Shumway‐Cook 2007 | 1.33 | 1.77 | 124 | 226 | 0.55 | 130 | 227 | 0.57 | 12 mo |
| Shyu 2010 | — | — | — | 55 | — | — | 48 | — | 24 mo |
| Skelton 2005 | — | — | 35 | 43 | 0.81 | 23 | 27 | 0.85 | 9 mo |
| Smith 2007 | — | — | 2544 | 4727 | 0.55 | 2577 | 4713 | 0.55 | 36 mo |
| Smulders 2010 | 0.72 | 1.18 | 21 | 47 | 0.45 | 23 | 45 | 0.51 | 12 mo |
| Spice 2009 | — | — | 276 | 346 | 0.80 | 133 | 159 | 0.84 | 12 mo |
| Spink 2011 | 0.69 | 1.07 | 64 | 153 | 0.42 | 75 | 152 | 0.49 | 12 mo |
| Steadman 2003 | 7.13 | 7.13 | — | 69 | — | — | 64 | — | 1 mo |
| Steinberg 2000 Education + exercise vs education | 0.76 | 0.85 | 39 | 69 | 0.57 | 42 | 63 | 0.67 | 17 mo |
| Education + exercise + home safety vs education | 0.79 | 0.85 | 35 | 61 | 0.57 | 42 | 63 | 0.67 | 17 mo |
| Education + exercise + home safety + clinical assessment vs education | 0.76 | 0.85 | 32 | 59 | 0.54 | 42 | 63 | 0.67 | 17 mo |
| Stevens 2001 | 0.69 | 0.72 | — | 524 | — | — | 1091 | — | 12 mo |
| Suman 2011 | — | — | 50 | 183 | 0.27 | 38 | 166 | 0.23 | 12 mo |
| Suzuki 2004 | 0.16 | 0.46 | 3 | 22 | 0.14 | 12 | 22 | 0.55 | 20 mo |
| Swanenburg 2007 | — | — | — | 10 | — | — | 10 | — | 12 mo |
| Tinetti 1994 | 0.62 | 0.94 | 52 | 147 | 0.35 | 68 | 144 | 0.47 | 12 mo |
| Trivedi 2003 | — | — | 254 | 1027 | 0.25 | 261 | 1011 | 0.26 | 12 mo |
| Trombetti 2011 | 0.7 | 1.6 | 19 | 66 | 0.29 | 32 | 68 | 0.47 | 6 mo |
| Van Haastregt 2000 | — | — | 63 | 127 | 0.50 | 53 | 120 | 0.44 | 12 mo |
| Van Rossum 1993 | — | — | — | — | — | — | — | — | 36 mo |
| Vellas 1991 | — | — | — | 48 | — | — | 47 | — | 6 mo |
| Vetter 1992 | — | — | 95 | 240 | 0.40 | 65 | 210 | 0.31 | 48 mo |
| Vind 2009 | — | — | 110 | 196 | 0.56 | 101 | 196 | 0.52 | 12 mo |
| Von Stengel 2011 | 0.43 | 1.14 | — | 47 | — | — | 50 | — | 18 mo |
| Voukelatos 2007 | 0.50 | 0.75 | 71 | 347 | 0.20 | 81 | 337 | 0.24 | 6 mo |
| Wagner 1994 Multifactorial intervention vs control | — | — | 175 | 635 | 0.28 | 223 | 607 | 0.37 | 12 mo |
| Chronic disease prevention nurse visit vs control | — | — | 94 | 317 | 0.30 | 223 | 607 | 0.37 | 12 mo |
| Weber 2008 | — | — | — | — | — | — | — | — | 15 mo |
| Weerdesteyn 2006 | 0.89 | 1.68 | 10 | 30 | 0.33 | 9 | 28 | 0.32 | 7 mo |
| Whitehead 2003 | — | — | 28 | 58 | 0.48 | 15 | 65 | 0.23 | 6 mo |
| Wilder 2001 | — | — | — | — | — | — | — | — | 12 mo |
| Wolf 1996 Tai Chi group vs education | 0.86 | 1.29 | — | 72 | — | — | 64 | — | 8 mo |
| Balance training vs education | 1.53 | 1.29 | — | 64 | — | — | 64 | — | 8 mo |
| Wolf 2003 | — | — | 69 | 145 | 0.48 | 85 | 141 | 0.60 | 11 mo |
| Woo 2007 Tai Chi group vs control | — | — | 15 | 60 | 0.25 | 31 | 60 | 0.52 | 12 mo |
| Group resistance training vs control | — | — | 24 | 60 | 0.40 | 31 | 60 | 0.52 | 12 mo |
| Wu 2010 Telecommunication‐based Tai Chi vs group Tai Chi | — | — | — | 22 | — | — | 20 | — | 4 mo |
| Home video‐based Tai Chi vs group Tai Chi | — | — | — | 22 | — | — | 20 | — | 4 mo |
| Wyman 2005 | 0.637 (12 mo) | 0.888 (12 mo) | 59 | 126 | 0.47 | 53 | 126 | 0.42 | 24 mo |
| Yamada 2010 | — | — | 5 | 29 | 0.17 | 11 | 29 | 0.38 | 12 mo |
a cross‐over trial mo: months
Appendix 9. Description of excluded studies: reference links
Appendix 10. Adverse effects possibly attributable to vitamin D or vitamin D analogues reported in included studies
| Study ID | Hypercalcaemia | Renal disease | Gastrointestinal effects | Other |
| Bischoff‐Ferrari 2006 (reported in Dawson‐Hughes 1999) | ND | Only side effects resulting in discontinuation of treatment. Calcium–vitamin D group: hypercalciuria 1/219 | Only side effects resulting in discontinuation of treatment. Placebo group: epigastric distress 2/216. Calcium–vitamin D group: constipation 3/219, epigastric distress 1/219 |
Only side effects resulting in discontinuation of treatment. Placebo group: flank pain 1/216. Calcium–vitamin D group: sweating 1/219. |
| Bischoff‐Ferrari 2010 | At 7 to 10 days mild hypercalcaemia was recorded in two 800 IU participants and one 2000 IU participant. At 6‐month follow‐up mild hypercalcaemia was recorded in one 800 IU participant, and in two 2000 IU participants. |
“Creatinine clearance did not differ significantly between groups at baseline or at 7 to 10 days, or 6 and 12 months of follow‐up. There was no report of nephrolithiasis throughout the trial period.” | ND | ND |
| Dhesi 2004 | — | — | — | — |
| Dukas 2004 | "During the 36 weeks of intervention, six cases (1 in the placebo group and 5 in the alfacalcidol group) of slight transient hypercalcemia (one measurement of serum calcium above normal with subsequent (1 week later) control measurement within normal ranges) were observed..." "The difference in the incidence of hypercalcaemia between study groups was not significant (P=0.0621)." | ND | ND | “Frequency of reported side effects was equally distributed between treatment groups (82 cases in placebo vs 75 cases in alfacalcidol, P = 0.850. The most common side effects were itching (placebo treatment group: 23 cases; alfacalcidol treatment group: 22 cases) and skin eruption (placebo treatment group: 11 cases; alfacalcidol treatment groups: 15 cases)." |
| Gallagher 2001 | Mild hypercalcaemia occurred in 6% of placebo participants and 12% of calcitriol participants | "At least one episode of hypercalciuria (400 mg or 10 mmol) occurred in 8% of the patients on placebo, 26% on calcitriol ...There were 58 cases of hypercalciuria occurring on calcitriol alone" | Gastrointestinal problems were reported in the calcitriol group (N = 20) and the placebo group (N = 22) | ND |
| Grant 2005 | 21 participants developed hypercalcaemia; there was no significant difference between groups | 7 participants developed renal insufficiency and 4 developed renal stones. No significant difference between groups. | 428/2617 (16.4%) allocated to calcium; 319/2675 (11.9%) not allocated to calcium. 363/2646 (13.7%) allocated to vitamin D3; 386/2643 (14.7%) not allocated to vitamin D3 |
ND |
| Harwood 2004 | No cases occurred in either participant group | ND | ND | ND |
| Kärkkäinen 2010 | ND | ND | Adverse events in the intervention group (N = 1586) resulting in discontinuation of the intervention. Gastrointestinal symptoms (abdominal pain and heartburn) 64/1586, nausea 12/1586 | Adverse events in the intervention group (N = 1586) resulting in discontinuation of the intervention Skin reactions 9/1586, miscellaneous other adverse effects (not individually listed) 28/1586 |
| Latham 2003 | — | — | — | — |
| Pfeifer 2000 | — | — | — | — |
| Pfeifer 2009 | — | — | — | — |
| Porthouse 2005 | — | — | — | — |
| Prince 2008 | One participant in the ergocalciferol group had mild asymptomatic hypercalcaemia on one occasion | ND | Constipation: ergocalciferol group 16/151 (10.6%) vs control group 18/151 (11.9%) | No difference in incidence of cancer, ischaemic heart disease, or stroke |
| Sanders 2010 | ND | ND | ND | “Serious adverse events (International Conference on Harmonization/WHO Good Clinical Practice definition including hospitalization or death) did not differ significantly. None of the serious adverse events were considered related to study medication.” |
| Smith 2007 | — | — | — | — |
| Trivedi 2003 | ND | ND | ND | The incidence of major health events did not differ significantly between groups. |
—: adverse events not described in the study
ND: no incidence available for this adverse event
Appendix 11. Studies reporting cost‐effectiveness, cost‐utility, or costs of the intervention and/or healthcare resource use
| Study ID (source if not primary reference), sample, efficacy analyses, type of evaluation | Intervention(s) and comparator (N in analysis) | Perspective(s), type of currency, price year, time horizon | Cost items measured | Mean (SD) intervention cost per person | Healthcare service costs | Incremental cost per fall prevented/per QALY gained |
| •Buchner 1997a •Patients from a HMO, mild deficits in strength and balance, mean age 75 years •Analysis 1.1, 1.2, 2.1, 2.2 •Cost analysis |
•Centre based endurance training and/or strength training, supervised for 24 to 26 weeks then self supervised (N = 75) vs no intervention (N = 30) |
•HMO •US dollar •Not specified (presumed 1992) •Period 7 to 18 months after randomisation |
•Hospital costs, ancillary outpatient costs (from HMO computerised records) |
•Hospitalised control participants more likely to have hospital costs > USD 5000 (P < 0.05) |
||
| •Campbell 1997 and Campbell 1999c (Robertson 2001c) •Women aged ≥ 80 years from 17 general practices, mean age (SD) 84.1 (3.3) years •Analysis 1.1, 1.2 •Cost‐effectiveness analysis |
•Specific set of muscle strengthening and balance retraining exercises individually prescribed at home (OEP) by physiotherapist, 4 home visits and monthly phone calls in year 1, phone contact only in year 2 (N = 116) vs social visits and usual care (N = 117) |
•Societal •New Zealand dollar •1995 •During participation in trial (up to 2 years) |
•Intervention costs (recruitment, programme delivery, overheads) •Healthcare costs resulting from falls (actual costs of hospital admissions and outpatient services, estimates of GP visits and other costs) •Total healthcare resource use (actual costs of hospital admissions and outpatient services) |
In research setting: •NZD 173 (0) in year 1 •NZD 22 (0) in year 2 |
•No difference between the 2 groups for healthcare costs resulting from falls or for total healthcare costs •27% of hospital admission costs during trial resulted from falls |
At 1 year: •NZD 314 per fall prevented (programme implementation costs only) At 2 years: •NZD 265 per fall prevented (programme implementation costs only) |
| •Campbell 1999 (Robertson 2001d) •Men and women aged ≥ 65 years currently taking psychotropic medication, mean (SD) age 74.7 (7.2) years •Analysis 11.1, 11.2 •Cost‐effectiveness analysis |
•Gradual withdrawal of psychotropic medication over 14 weeks (N = 48) vs continued to take psychotropic medication (N = 45) (double‐blind) |
•Health system •New Zealand dollar •1996 •During participation in trial (44 weeks) |
•Intervention costs (recruitment, medication preparation and delivery, overheads) •Healthcare costs resulting from falls (actual costs of hospital admissions and outpatient services, emergency department, community services) •Total healthcare resource use (actual costs of hospital admissions and outpatient services, emergency department, community services) |
In research setting: •NZD 258 (0) for 44 weeks |
•Total hospital admission costs NZD 21,871 intervention group NZD 68,006 control group (P = 0.044) | •NZD 538 per fall prevented (programme implementation costs only) |
| •Campbell 2005 •People aged ≥ 75 years with severe visual impairment, mean (SD) age 83.6 (4.8) years •Analysis 15.1, 15.2, 16.1, 16.2, 17.1, 17.2 •Cost‐effectiveness analysis |
•Home safety assessment and modification programme, 1 to 2 home visits by experienced occupational therapist (N = 198) vs no home safety programme (N = 193) |
•Health system •New Zealand dollar •2004 •During trial period (1 year) |
•Intervention costs (training; recruitment; occupational therapists’ time, transport, administration; services and equipment installed in homes; overhead costs) |
•NZD 325 (292) |
•Not calculated (preplanned, no significant difference in number of fall injuries in the 2 groups) |
•NZD 650 per fall prevented (home safety programme implementation costs only) |
| •Close 1999 (Close 2000) •People aged ≥ 65 years attending emergency department with a fall, mean (SD) age 78.2 (7.5) years •Analysis 22.1, 22.2, 22.3, 23.1, 23.2, 24.1, 24.2 •Cost analysis |
•Multifactorial medical and occupational therapy assessment with referral to relevant services if indicated, 1 visit to day hospital for assessments, 1 home visit by occupational therapist (N = 184) vs usual care (N = 213) |
•Health system •Pounds sterling •Not specified (presumed 1995) •For 12 months after randomisation |
•Medical and occupational therapy assessment (unit cost GBP 90.00), hospital admissions (unit cost GBP 220.77), outpatient visits (unit cost GBP 58.38), GP visits (unit cost GBP 17.89) |
•GBP 74 (0) for medical and occupational therapist assessment |
•No difference between the 2 groups for health service costs (GBP 1953 intervention groups, GBP 2549 control group) |
|
| •Coleman 1999 •Patients from a HMO aged ≥ 65 years at high risk of hospitalisation and functional decline, mean age 77.3 years •Analysis 22.2, 23.2, 24.2 •Cost analysis |
•Multifactorial at a primary care clinic, half‐day clinic held every 3 to 4 months (5 physicians, N = 96) vs usual care (4 physicians, N = 73) |
•Health system •US dollar •Not specified •During trial period (24 months) |
•Medical care (hospitalisation, emergency, and outpatient visits, pharmacy costs) |
•No difference between the 2 groups for pharmacy costs or total health service costs |
||
| •Conroy 2010 (Irvine 2010) •Community‐living, aged ≥ 70, at high risk of falling (defined using modified Falls Risk Assessment Tool questionnaire) •Analysis 22.1, 22.2, 22.3, 23.1, 23.2, 24.1, 24.2 •Cost‐effectiveness analysis |
•Multifactorial programme at day hospital (physiotherapy, occupational therapy, nurse, medical review, referral to specialist) (N = 172 of 183) vs falls prevention information booklet only (N = 171 of 181) |
•National Health Service, personal social services •Pound sterling •2007‐8 •12‐month study period |
•Screening, recruitment, intervention programme (multidisciplinary staff time), health services potentially relevant to falls (GP and practice nurse consultations, outpatient first visit, emergency, inpatient bed days) |
•GBP 349 (316) |
•Mean total healthcare costs GBP 2238 (4957) intervention group GBP 1659 (5100) control group (mean incremental cost GBP 578 (95% CI ‐12,593 to 17,264) |
•GBP 3320 per fall prevented |
| •Cumming 1999 (Salkeld 2000) •Men and women recruited primarily before discharge from selected hospital wards, mean age 77 years •Analysis 15.1, 15.2, 16.1, 16.2; 17.1, 17.2 •Cost‐effectiveness analysis |
•Home safety visit by experienced occupational therapist, environmental hazard assessment, facilitation for necessary modifications, 1 home visit, follow‐up telephone call 2 weeks later (N = 264) vs routine care (N = 266) |
•Societal •Australian dollar •1997 •1 year from trial entry |
In subsample of 103 intervention group and 109 control group (last 212 recruited into trial): •Hospitalisation, other healthcare costs provided in an institutional setting (e.g. outpatients), healthcare costs provided in the home (e.g. home nursing), informal care costs (e.g. personal care provided by a relative or friend, help around the home), home modification costs, occupational therapist (intervention costs) |
•AUD 223 (0) intervention group, AUD 15 control group (home modification and occupational therapist intervention costs only) |
•Mean total healthcare costs AUD 10,084 intervention group, AUD 8279 control group (P = 0.26 for median costs) |
•AUD 4986 per fall prevented (all N = 527 participants) •AUD 3980 per fall prevented for participants reporting a fall in previous year (N = 203 participants) •< AUD 0 per fall prevented i.e. cost saving for participants reporting a fall in previous year (sensitivity analysis, outliers removed) |
| •Dangour 2011 •People aged 65 to 67.9 years living in low‐middle socioeconomic status municipalities in Santiago, Chile •Analysis 1.2, 2.2, 13.1 •Cost analysis |
2 x 2 factorial trial: •Nutritional supplement for 24 months (10 health centres, N = 865) vs remainder (10 health centres, N = 800) •Multicomponent exercise classes, 2 x 1‐hour supervised classes per week for 24 months (10 health centres, N = 854) vs remainder (10 health centres, N = 811) |
•Societal and health system •Chilean peso converted to US dollar •2007 •During 2‐year trial |
From 94 exit interviews: •Nutritional supplementation intervention From 93 exit interviews: •Physical activity intervention |
•USD 91 for nutritional supplement •USD 164 for physical activity intervention |
•Not calculated (neither intervention reduced risk of falling; cost‐effectiveness of physical activity intervention reported as USD 4.84 per extra metre walked) |
|
| •Davis 2011a •Community‐living women aged 65 to 75 years •Analysis 4.1 •Cost‐effectiveness analysis, cost‐utility analysis |
•Once weekly resistance training (N = 54) vs twice weekly balance and tone classes (N = 49) •Twice weekly resistance training (N = 51) vs twice weekly balance and tone classes (N = 49) |
•Health service •Canadian dollar •2008 •9 months |
•Costs of delivering the interventions (staff time, room use, equipment, building overhead costs); visits to health professionals; all visits, admissions, and procedures in hospital; laboratory and diagnostic tests |
•CAD 353 once weekly resistance training •CAD 706 twice weekly resistance training •CAD 706 twice weekly balance and tone classes |
•Mean healthcare costs resulting from falls, mean total healthcare costs respectively: CAD 547, CAD 1379 once weekly resistance training •CAD 184, CAD 1684 twice weekly resistance training •CAD 162, CAD 1772 twice weekly balance and tone classes |
•Both once and twice weekly resistance training dominated balance and tone classes in terms of both falls and QALYs (i.e. less costly, more effective) |
| •De Vries 2010 (Peeters 2011) •People aged ≥ 65 years who consulted their GP or emergency department after a fall event within the previous 3 months, risk score ≥ 8 or living in a residential home •Analysis 22.2, 22.3, 23.2, 24.2 •Cost‐effectiveness analysis, cost‐utility analysis |
•Multifactorial risk assessment by geriatrician at a geriatric outpatient clinic, individually tailored intervention regimen (e.g. withdrawal of psychotropic medication, balance and strength exercises by a physiotherapist, home hazard reduction by an occupational therapist, referral to ophthalmologist or cardiologist) (N = 106) vs usual care (N = 111) |
•Societal •Euro (The Netherlands) •2007 •During 1 year from baseline |
•Healthcare costs (e.g. geriatrician consult, GP care, specialist care, therapy, medication, hospitalisation, nursing home admission), patient and family costs (e.g. informal care), costs in other sectors (e.g. medical devices, home modifications, transportation aids) |
•Mean of total healthcare costs intervention group EUR 7740 (9129) control group EUR 6838 (8623), difference EUR 902 (95% CI ‐1534 to 3357) |
•EUR 226 per percentage reduction in fallers •If EUR 300,000 invested, probability that the intervention would improve quality of life (utility) by 1 point was 0.30 (incremental cost per QALY gained not reported) |
|
| •Foss 2006 (Sach 2010) •Women aged > 70 years with one unoperated cataract •Analysis 12.1, 12.2, 12.3 •Cost‐utility analysis |
•Second eye cataract surgery, routine post surgery care (N = 116) vs first eye cataract surgery only ( N = 113) |
•National Health Service, personal social services •Pound sterling •2004 •During participation in 1 year trial; participants’ expected lifetime |
•Secondary healthcare (cataract operation, bed days, outpatient, emergency department, lower and upper limb fractures), primary health care (GP visits, practice/district nurse visits), personal social services (home care, day care centre, residential and nursing home care, meals on wheels, special equipment), patient and carers’ costs (home care, carer time costs) |
•Cataract operation GBP 672 (0) |
•Mean of total healthcare costs intervention group GBP 646 (95% CI 16 to 1276) more than control group |
•Incremental cost per fall prevented not calculated as intervention did not reduce falls At 1 year: •GBP 44,263 per QALY gained (excluding carer costs) •GBP 58,667 per QALY gained (including carer costs) Over participants’ expected lifetime: •GBP 17,299 per QALY gained (discount rate 3.5% per annum) |
| •Harwood 2005 (Sach 2007) •Women aged > 70 years with bilateral cataracts, mean (SD) age 84.1 (3.3) years •Analysis 12.1, 12.2, 12.3 •Cost‐effectiveness analysis, cost‐utility analysis |
•Expedited (4 weeks) first eye cataract surgery, routine post surgery care (N = 148) vs control (routine, 12 months wait) (N = 140) |
•National Health Service, personal social services •Pound sterling •2004 •During participation in 1 year trial; participants’ expected lifetime |
•Secondary healthcare (cataract operation, bed days, outpatient, emergency department, lower and upper limb fractures), primary health care (GP visits, practice/district nurse visits), personal social services (home care, day care centre, residential and nursing home care, meals on wheels, special equipment), patient and carers’ costs (home care, carer time costs) |
•Cataract operation GBP 672 (0) |
•Mean of total healthcare costs intervention group GBP 2004 (95% CI 1363 to 2833) more than control group |
At 1 year: •GBP 4390 per fall prevented (excluding carer costs) •GBP 3983 per fall prevented (with carer costs included) •GBP 35,704 per QALY gained (excluding carer costs) Over participants’ expected lifetime: •GBP 13,172 per QALY gained (discount rate 3.5% per annum) |
| •Hendriks 2008 •Patients aged ≥ 65 years who visited the emergency department or GP for the consequences of a fall •Analysis 22.2, 23.2, 24.2 •Cost analysis |
•Multifactorial programme (detailed medical and occupational therapy assessment with referral to relevant services if indicated) approximately 3.5 months after baseline assessment (N = 166) vs usual care (N = 167) |
•Societal •Euro (The Netherlands) •2004 •During participation in 1 year trial |
For 120 of intervention group and 129 of control group: •Programme costs (time for geriatrician, nurse, occupational therapist and administration) •Health service costs (GP, specialist, hospital admission, nursing home admission, allied health care, aids and assistive devices, home care, medication) •Participant and family costs (home modifications, out‐of‐pocket expenses) |
•EUR 385 (0) |
•EUR 4857 (4470) intervention group and EUR 4991 (6835) control group for mean total healthcare costs (P = 0.856) |
•Incremental ratios not calculated as intervention did not reduce falls or result in QALY gains |
| •Hornbrook 1994 •Patients from a HMO aged ≥ 65 years, mean (SD) age 73.4 (6.1) years •Analysis 22.1, 22.2, 23.1, 23.2, 24.1, 24.2 •Cost description |
•Multifactorial including 90 minute group meetings for 4 weeks led by health behaviourist and physical therapist (environmental, behavioural and physical risk factors, 20 minutes of exercises), encouraged to walk 3 times a week, quarterly follow‐up sessions (N = 1611) vs information on home safety (N = 1571) |
•Study plus personal •US dollar •Not specified •During intervention |
•Subsidised home safety repairs (e.g. bath tub grab bars, stair railings) in intervention group | •Project‐subsidised repairs USD 78 (subsidy USD 46, participant contribution USD 32) |
||
| •Kemmler 2010 •Women aged ≥ 65 living independently •Analysis 4.1, 4.2 •Cost analysis |
•Multicomponent exercise, two 60‐minute classes and two 20‐minute home training sessions weekly for 18 months (N = 115) vs control (low‐intensity exercise classes 60 minutes once weekly for 10 weeks followed by 10 weeks of rest) (N = 112) •All participants received calcium (1500 m/d) and cholecalciferol (500 IU/d) supplements |
•Health system •Euro (Germany) •Not specified •During participation in 18 month trial |
•Total healthcare costs (no details provided) |
•EUR 2255 (2596) exercise group and EUR 2780 (3318) control group for mean total healthcare costs (P = 0.20) |
|
|
| •Liu‐Ambrose 2008 (Davis 2009) •Women and men aged ≥ 70 years recruited from 2 referral based falls clinics •Analysis 1.1, 1.2 •Cost‐effectiveness analysis |
•Specific set of muscle strengthening and balance retraining exercises individually prescribed at home (OEP) by trained physiotherapist for 1 year (N = 36) vs guideline care (N = 38) •All participants received falls risk assessment, comprehensive geriatric assessment and treatment |
•Health system •Canadian dollar •Not specified •12 months |
•Cost of delivering the intervention •Cost of the falls clinic |
•CAD 14,285 | •CAD 247 per fall prevented (comparable to incremental cost‐effectiveness ratios in New Zealand studies of the Otago Exercise Programme) | |
| •Markle‐Reid 2010 •Community‐living aged ≥ 75, newly referred to and eligible for home support services; reported a fall in previous year, fear of falling or unsteady on feet •Analysis 22.1, 22.2, 23.1, 23.2, 24.1, 24.2 •Cost analysis |
•Multifactorial individually tailored home visits (case manager, registered nurse, occupational therapist, physiotherapist, registered dietitian) once per month for 6 months in addition to standard home care services (N = 49) vs control (standard home care services) (N = 43) | •Societal •Canadian dollar •2006 •6 months |
•Primary care; emergency department and specialists; hospital days; 7 types of other health and social professionals; medications; laboratory services using the Health and Social Services Utilization Inventory |
|
•Mean total direct healthcare costs CAD 5126 intervention group, CAD 4800 control group at 6 months (P = 0.330) | •Not calculated (intervention did not reduce falls) |
| •Robertson 2001a •Men and women aged ≥ 75 years from 17 general practices, mean (SD) age 80.9 (4.2) years •Analysis 1.1, 1.2, 1.3 •Cost‐effectiveness analysis |
•Specific set of muscle strengthening and balance retraining exercises individually prescribed at home (OEP) by trained district nurse, supervised by physiotherapist, 5 home visits and monthly phone calls for 1 year (N = 121) vs usual care (N = 119) |
•Health system •New Zealand dollar •1998 •During participation in 1‐year trial |
•Intervention costs (training, recruitment, programme delivery, supervision of exercise instructor, overheads) •Hospital admission costs resulting from fall injuries during trial (actual costs of hospital admissions) |
In community health service setting: •NZD 432 (0) for 1 year |
•5 hospital admissions due to fall injuries in control group, none in exercise group (cost savings of NZD 47,818) |
•NZD 1803 per fall prevented (programme implementation costs only) •NZD 155 per fall prevented (programme implementation costs and hospital admission cost savings) |
| •Tinetti 1994 (Rizzo 1996) •Men and women aged ≥ 70 years with ≥ 1 risk factor for falling (postural hypotension; use of sedatives; ≥ 4 medications; impairment in arm or leg strength or range of motion, balance, gait, transfer skills; environmental hazards), mean (SD) age 77.9 (5.3) years •Analysis 22.1, 22.2, 22.3, 23.1, 23.2, 24.1, 24.2 •Cost‐effectiveness analysis |
•Multifactorial targeted intervention for 3 months after the baseline assessment, extended if health problems had interfered with ability to exercise (behavioural instructions, exercise programmes, adjustment to medications, home safety) delivered by physician and at home by nurse and physiotherapist (8 physicians, N = 148) vs home visits by social work student (8 physicians, N = 140) |
•Health system •US dollar •1993 •The year following study enrolment |
•Intervention costs (developmental and training costs, recruitment costs, overheads, equipment, and staff related costs) •Health services (hospitalisation and emergency department, outpatient, home care, skilled nursing facilities) |
•USD 905 (range 588 to 1346) |
•Mean total healthcare costs USD 8310 intervention group and USD 10,439 control group |
Using mean costs: •USD 1772 per fall prevented (intervention costs only) •< USD 0 per fall prevented, i.e. cost saving (total healthcare costs) •< USD 0 per ‘medical’ fall prevented, i.e. cost saving (total healthcare costs) |
| •Van Rossum 1993 •General population aged 75 to 84 years, 73% aged 75 to 79 years •No data available for pooling •Cost analysis |
•Multifactorial home visits 4 times a year for 3 years, extra visits if necessary by public health nurses lasting 45 to 60 minutes (N = 292) vs no home visits (N = 288) |
•Health system •Dutch guilder •Not specified •During 3 year trial period |
•Health services (community care services, hospital, long term institutional care, home visits) | •Total 393,981 Dutch guilders for intervention group home visits |
•Total health service costs were 4% per person less for control (mean 19,321 guilders) than intervention group (mean 20,080 guilders) |
|
| •Voukelatos 2007 (Haas 2006) •Healthy community‐living people aged ≥ 60 years, mean (SD) age 69 (6.5) years •Analysis 1.1, 1.2, 3.1, 3.2 •Cost‐effectiveness analysis |
•Tai Chi classes 1 hour weekly for 16 weeks (N = 347) vs no intervention (N = 337) |
•Public health system (NSW Health) •Australian dollar •Not specified (presumed 2001) •During 24 week trial period |
•Intervention costs (cost of venues, advertising, instructors) •Health service use related to falls from health care use diary and hospital records, valued at standard costs (GP, specialist, tests, hospitalisations, medications) |
•AUD 245 (0) intervention group plus charge AUD 44 per participant |
•Mean total healthcare costs higher for Tai Chi group (AUD 55) than control group (AUD 17) (P < 0.0001) |
•AUD 1683 per fall prevented (includes cost offset by charging AUD 44 per instruction course) |
| •Weber 2008 •Community living patients of the Geisinger Health System, rural Pennsylvania aged ≥ 70 years, ≥ 4 prescription medications, ≥ 1 psychoactive medications •No data available for pooling •Cost analysis |
•Standardised medication review by clinical pharmacist or geriatrician, recommendations to the primary physician via an electronic medical record system (15 clinic sites, N = 413) vs usual care (3 clinic sites, N = 207) |
•Geisinger Health System •US dollar •Not specified (presumed 2003) •From date of electronic message (intervention) or 30 January 2003 (comparator) to end of 15 month study |
•Health services (outpatient, inpatient, emergency department, total costs calculated from the Geisinger Health Plan insurance database) |
•No significant trends in health service costs |
||
| •Wyman 2005 (Findorff 2007) •Women aged ≥ 70 years, mean (SD) 78.8 (5.6) years •Analysis 22.1, 22.2, 23.1, 23.2, 24.1, 24.2 •Cost description |
•Multifactorial home‐based programme for 12 weeks followed by 16 weeks of computerised telephone support (risk factor assessment, tailored counselling, education, exercise, walking programme, referrals as needed) delivered by nurses (N = 137) vs health education (N = 135) |
•Health system •US dollar •Not specified •From end of 28 week intervention period, end point not reported |
•Health service costs associated with falls (clinic visit, emergency department, ambulance, hospital inpatient, outpatient physical therapy, rehabilitation centre, home care) |
•Mean cost of an injurious fall USD 6606 (range 63 to 85,984), median USD 658 (costs not broken down by group) |
See also Davis 2010 GP: general practitioner HMO: health maintenance organisation OEP: Otago Exercise Programme QALY: quality adjusted life year
Appendix 12. Sensitivity analyses exploring impact of risk of bias on effect sizes
| Intervention | Number of trials (participants) in the analysis | Pooled effect size, 95% CI | Number of trials (participants) in the sensitivity analysisa | Pooled effect size, 95% CI | Impact |
| Group exercise: multiple categories of exercise (Analysis 1.1.1) | 16 (3622) |
RaR 0.71, 95% CI 0.63 to 0.82 | 11 (2978) | RaR 0.79, 95% CI 0.71 to 0.88 | Remained statistically significant |
| Group exercise: multiple categories of exercise (Analysis 1.2.1) | 22 (5333) | RR 0.85, 95% CI 0.76 to 0.96 | 12 (2454) | RR 0.86, 95% CI 0.79 to 0.94 | Remained statistically significant |
| Individual exercise at home: multiple categories of exercise (Analysis 1.1.2) | 7 (951) |
RaR 0.68, 95% CI 0.58 to 0.80 | 4 (559) | RaR 0.69, 95% CI 0.55 to 0.86 | Remained statistically significant |
| Individual exercise at home: multiple categories of exercise (Analysis 1.2.2) | 6 (714) | RR 0.78, 95% CI 0.64 to 0.94 | 3 (386) | RR 0.81, 95% CI 0.63 to 1.04 | No longer statistically significant |
| Group exercise: Tai Chi (Analysis 1.1.4) | 5 (1563) | RaR 0.72, 95% CI 0.52 to 1.00 | 4 (1375) | RaR 0.81, 95% CI 0.61 to 1.09 | No longer statistically significant |
| Group exercise: Tai Chi (Analysis 1.2.4) | 6 (1625) | RR 0.71, 95% CI 0.57 to 0.87 | 3 (1239) | RR 0.80, 95% CI 0.67 to 0.95 | Remained statistically significant |
| Group exercise: gait, balance or functional training (Analysis 1.1.5) | 4 (519) |
RaR 0.72, 95% CI 0.55 to 0.94 | 1 (303) | RaR 0.82, 95% CI 0.58 to 1.17 | No longer statistically significant |
| Cardiac pacing (Analysis 12.1.1) | 3 (349) | RaR 0.73, 95% CI 0.57 to 0.93 | 3 (349) | RaR 0.73, 95% CI 0.57, 0.93 | Unchanged |
| Home safety intervention (OT) (Analysis 17.1.1) | 4 (1446) | RaR 0.69, 95% CI 0.55 to 0.86 | 4 (1446) | RaR 0.69, 95% CI 0.55 to 0.86 | Unchanged |
| Home safety intervention (OT) (Analysis 17.2.1) | 5 (1156) | RR 0.79, 95% CI 0.69 to 0.90 | 4 (1146) | RR 0.79, 95% CI 0.69 to 0.90 | Unchanged |
| Multifactorial intervention (Analysis 22.1) | 19 (9503) | RaR 0.76, 95% CI 0.67 to 0.86 | 16 (8153) | RaR 0.80, 95% CI 0.72 to 0.87 | Remained statistically significant |
aAfter removing trials assessed as high risk of bias in one or more key domains: random sequence generation (selection bias), allocation concealment (selection bias), blinding of outcome assessors (detection bias), and incomplete outcome data (attrition bias).
Data and analyses
Comparison 1. Exercise vs control.
| Outcome or subgroup title | No. of studies | No. of participants | Statistical method | Effect size |
|---|---|---|---|---|
| 1.1 Rate of falls | 34 | Rate Ratio (IV, Random, 95% CI) | Subtotals only | |
| 1.1.1 Group exercise: multiple categories of exercise vs control | 16 | 3622 | Rate Ratio (IV, Random, 95% CI) | 0.71 [0.63, 0.82] |
| 1.1.2 Individual exercise at home: multiple categories of exercise vs control | 7 | 951 | Rate Ratio (IV, Random, 95% CI) | 0.68 [0.58, 0.80] |
| 1.1.3 Individual exercise: LiFE (balance and strength training in daily life activities) vs control | 1 | 34 | Rate Ratio (IV, Random, 95% CI) | 0.21 [0.06, 0.71] |
| 1.1.4 Group exercise: Tai Chi vs control | 5 | 1563 | Rate Ratio (IV, Random, 95% CI) | 0.72 [0.52, 1.00] |
| 1.1.5 Group exercise: gait, balance or functional training vs control | 4 | 519 | Rate Ratio (IV, Random, 95% CI) | 0.72 [0.55, 0.94] |
| 1.1.6 Individual exercise: balance training vs control | 1 | 128 | Rate Ratio (IV, Random, 95% CI) | 1.19 [0.77, 1.82] |
| 1.1.7 Group exercise: strength/resistance training vs control | 1 | 64 | Rate Ratio (IV, Random, 95% CI) | 1.80 [0.84, 3.87] |
| 1.1.8 Individual exercise at home: resistance training vs control | 1 | 222 | Rate Ratio (IV, Random, 95% CI) | 0.95 [0.77, 1.18] |
| 1.2 Number of fallers | 40 | Risk Ratio (IV, Random, 95% CI) | Subtotals only | |
| 1.2.1 Group exercise: multiple categories of exercise vs control | 22 | 5333 | Risk Ratio (IV, Random, 95% CI) | 0.85 [0.76, 0.96] |
| 1.2.2 Individual exercise at home: multiple categories of exercise vs control | 6 | 714 | Risk Ratio (IV, Random, 95% CI) | 0.78 [0.64, 0.94] |
| 1.2.3 Individual exercise: LiFE (balance and strength training in daily life activities) vs control | 1 | 31 | Risk Ratio (IV, Random, 95% CI) | 0.73 [0.39, 1.37] |
| 1.2.4 Group exercise: Tai Chi vs control | 6 | 1625 | Risk Ratio (IV, Random, 95% CI) | 0.71 [0.57, 0.87] |
| 1.2.5 Group exercise: gait, balance or functional training vs control | 3 | 453 | Risk Ratio (IV, Random, 95% CI) | 0.81 [0.62, 1.07] |
| 1.2.6 Group exercise: strength/resistance training vs control | 1 | 120 | Risk Ratio (IV, Random, 95% CI) | 0.77 [0.52, 1.14] |
| 1.2.7 Individual exercise at home: resistance training vs control | 1 | 222 | Risk Ratio (IV, Random, 95% CI) | 0.97 [0.68, 1.38] |
| 1.2.8 Individual exercise: general physical activity (walking) vs control | 1 | 196 | Risk Ratio (IV, Random, 95% CI) | 0.82 [0.53, 1.26] |
| 1.3 Number of people sustaining a fracture | 6 | 810 | Risk Ratio (IV, Fixed, 95% CI) | 0.34 [0.18, 0.63] |
Comparison 2. Group exercise: multiple categories of exercise vs control: subgroup analysis by falls risk at baseline.
| Outcome or subgroup title | No. of studies | No. of participants | Statistical method | Effect size |
|---|---|---|---|---|
| 2.1 Rate of falls | 16 | Rate Ratio (IV, Random, 95% CI) | Subtotals only | |
| 2.1.1 Selected for higher risk of falling | 9 | 1261 | Rate Ratio (IV, Random, 95% CI) | 0.70 [0.58, 0.85] |
| 2.1.2 Not selected for higher risk of falling | 7 | 2361 | Rate Ratio (IV, Random, 95% CI) | 0.72 [0.58, 0.90] |
| 2.2 Number of fallers | 22 | Risk Ratio (IV, Random, 95% CI) | Subtotals only | |
| 2.2.1 Selected for higher risk of falling | 12 | 1430 | Risk Ratio (IV, Random, 95% CI) | 0.87 [0.78, 0.97] |
| 2.2.2 Not selected for higher risk of falling | 10 | 3903 | Risk Ratio (IV, Random, 95% CI) | 0.85 [0.68, 1.06] |
Comparison 3. Group exercise: Tai Chi vs control: subgroup analysis by falls risk at baseline.
| Outcome or subgroup title | No. of studies | No. of participants | Statistical method | Effect size |
|---|---|---|---|---|
| 3.1 Rate of falls | 5 | Rate Ratio (IV, Random, 95% CI) | Subtotals only | |
| 3.1.1 Selected for higher risk of falling | 2 | 555 | Rate Ratio (IV, Random, 95% CI) | 0.95 [0.62, 1.46] |
| 3.1.2 Not selected for higher risk of falling | 3 | 1008 | Rate Ratio (IV, Random, 95% CI) | 0.59 [0.45, 0.76] |
| 3.2 Number of fallers | 6 | Risk Ratio (IV, Random, 95% CI) | Subtotals only | |
| 3.2.1 Selected for higher risk of falling | 2 | 555 | Risk Ratio (IV, Random, 95% CI) | 0.85 [0.71, 1.01] |
| 3.2.2 Not selected for higher risk of falling | 4 | 1070 | Risk Ratio (IV, Random, 95% CI) | 0.58 [0.46, 0.74] |
Comparison 4. Exercise vs exercise.
| Outcome or subgroup title | No. of studies | No. of participants | Statistical method | Effect size |
|---|---|---|---|---|
| 4.1 Rate of falls | 7 | Rate Ratio (IV, Fixed, 95% CI) | Subtotals only | |
| 4.1.1 Group exercise: higher intensity multiple components vs lower intensity multiple components | 1 | 227 | Rate Ratio (IV, Fixed, 95% CI) | 0.60 [0.47, 0.76] |
| 4.1.2 Group exercise: resistance training 1x per week vs balance and tone | 1 | 103 | Rate Ratio (IV, Fixed, 95% CI) | 0.73 [0.44, 1.22] |
| 4.1.3 Group exercise: resistance training 2x per week vs balance and tone | 1 | 101 | Rate Ratio (IV, Fixed, 95% CI) | 0.88 [0.67, 1.16] |
| 4.1.4 Group exercise: balance training in workstations vs 'conventional' fall‐prevention exercise class | 1 | 45 | Rate Ratio (IV, Fixed, 95% CI) | 0.81 [0.37, 1.78] |
| 4.1.5 Group exercise: enhanced balance therapy vs conventional physiotherapy post hip fracture | 1 | 133 | Rate Ratio (IV, Fixed, 95% CI) | 1.00 [0.64, 1.57] |
| 4.1.6 Group exercise: square stepping vs walking | 1 | 68 | Rate Ratio (IV, Fixed, 95% CI) | 0.70 [0.23, 2.13] |
| 4.1.7 Group exercise: exercise class + "trail walking" vs exercise class + indoor walking | 1 | 58 | Rate Ratio (IV, Fixed, 95% CI) | 0.45 [0.14, 1.49] |
| 4.1.8 Group exercise + home exercise vs home exercise | 1 | 68 | Rate Ratio (IV, Fixed, 95% CI) | 1.09 [0.74, 1.62] |
| 4.2 Number of fallers | 4 | Risk Ratio (IV, Fixed, 95% CI) | Subtotals only | |
| 4.2.1 Group exercise: higher intensity multiple components vs lower intensity multiple components | 1 | 227 | Risk Ratio (IV, Fixed, 95% CI) | 0.54 [0.35, 0.83] |
| 4.2.2 Group exercise: square stepping vs walking | 1 | 68 | Risk Ratio (IV, Fixed, 95% CI) | 0.64 [0.21, 1.95] |
| 4.2.3 Group exercise: exercise class + "trail walking" vs exercise class + indoor walking | 1 | 58 | Risk Ratio (IV, Fixed, 95% CI) | 0.45 [0.18, 1.13] |
| 4.2.4 Group exercise + home exercise vs home exercise: multiple components | 1 | 68 | Risk Ratio (IV, Fixed, 95% CI) | 1.11 [0.72, 1.70] |
Comparison 5. Medication provision: vitamin D (with or without calcium) vs control/placebo/calcium.
| Outcome or subgroup title | No. of studies | No. of participants | Statistical method | Effect size |
|---|---|---|---|---|
| 5.1 Rate of falls | 7 | 9324 | Rate Ratio (IV, Random, 95% CI) | 1.00 [0.90, 1.11] |
| 5.1.1 Vitamin D3 (by mouth) vs control or placebo | 2 | 2478 | Rate Ratio (IV, Random, 95% CI) | 1.14 [1.03, 1.27] |
| 5.1.2 Vitamin D3 (by mouth) + calcium vs control or placebo | 3 | 6586 | Rate Ratio (IV, Random, 95% CI) | 0.96 [0.89, 1.04] |
| 5.1.3 Vitamin D3 (by mouth) + calcium vs calcium | 1 | 137 | Rate Ratio (IV, Random, 95% CI) | 0.54 [0.30, 0.98] |
| 5.1.4 Vitamin D2 (by injection) vs placebo | 1 | 123 | Rate Ratio (IV, Random, 95% CI) | 0.61 [0.32, 1.17] |
| 5.2 Number of fallers | 13 | 26747 | Risk Ratio (IV, Random, 95% CI) | 0.96 [0.89, 1.03] |
| 5.2.1 Vitamin D3 (by mouth) vs control or placebo | 3 | 4516 | Risk Ratio (IV, Random, 95% CI) | 1.08 [0.93, 1.26] |
| 5.2.2 Vitamin D3 (by mouth) + calcium vs control or placebo | 3 | 6576 | Risk Ratio (IV, Random, 95% CI) | 0.98 [0.92, 1.03] |
| 5.2.3 Vitamin D3 (by mouth) + calcium vs calcium | 2 | 379 | Risk Ratio (IV, Random, 95% CI) | 0.70 [0.53, 0.92] |
| 5.2.4 Vitamin D2 (by mouth) + calcium vs placebo + calcium | 1 | 302 | Risk Ratio (IV, Random, 95% CI) | 0.66 [0.41, 1.05] |
| 5.2.5 Vitamin D2 (by injection) vs placebo | 2 | 9563 | Risk Ratio (IV, Random, 95% CI) | 0.98 [0.92, 1.04] |
| 5.2.6 Vitamin D (by mouth or by injection) with or without calcium vs control: studies with multiple arms combined | 2 | 5411 | Risk Ratio (IV, Random, 95% CI) | 0.73 [0.37, 1.44] |
| 5.3 Number of people sustaining a fracture | 10 | 27070 | Risk Ratio (IV, Random, 95% CI) | 0.94 [0.82, 1.09] |
| 5.3.1 Vitamin D3 (by mouth) vs control or placebo | 2 | 4942 | Risk Ratio (IV, Random, 95% CI) | 0.97 [0.63, 1.51] |
| 5.3.2 Vitamin D3 (by mouth) + calcium vs control or placebo | 3 | 6898 | Risk Ratio (IV, Random, 95% CI) | 0.83 [0.59, 1.16] |
| 5.3.3 Vitamin D3 (by mouth) + calcium vs calcium | 2 | 379 | Risk Ratio (IV, Random, 95% CI) | 0.54 [0.26, 1.15] |
| 5.3.4 Vitamin D2 (by injection) vs placebo | 1 | 9440 | Risk Ratio (IV, Random, 95% CI) | 1.09 [0.94, 1.28] |
| 5.3.5 Vitamin D (by mouth or by injection) with or without calcium vs control: studies with multiple arms combined | 2 | 5411 | Risk Ratio (IV, Random, 95% CI) | 0.90 [0.53, 1.53] |
Comparison 6. Vitamin D (with or without calcium) vs control: subgroup analysis by falls risk at baseline.
| Outcome or subgroup title | No. of studies | No. of participants | Statistical method | Effect size |
|---|---|---|---|---|
| 6.1 Rate of falls | 7 | Rate Ratio (IV, Random, 95% CI) | Subtotals only | |
| 6.1.1 Selected for higher risk of falling | 3 | 5381 | Rate Ratio (IV, Random, 95% CI) | 1.02 [0.85, 1.23] |
| 6.1.2 Not selected for higher risk of falling | 4 | 3943 | Rate Ratio (IV, Random, 95% CI) | 1.00 [0.86, 1.17] |
| 6.2 Number of fallers | 13 | Risk Ratio (IV, Random, 95% CI) | Subtotals only | |
| 6.2.1 Selected for higher risk of falling | 6 | 11094 | Risk Ratio (IV, Random, 95% CI) | 0.93 [0.78, 1.11] |
| 6.2.2 Not selected for higher risk of falling | 7 | 15653 | Risk Ratio (IV, Random, 95% CI) | 0.96 [0.90, 1.02] |
Comparison 7. Vitamin D (with or without calcium) vs control: subgroup analysis by vitamin D level at baseline.
| Outcome or subgroup title | No. of studies | No. of participants | Statistical method | Effect size |
|---|---|---|---|---|
| 7.1 Rate of falls | 7 | Rate Ratio (IV, Random, 95% CI) | Subtotals only | |
| 7.1.1 Selected for lower vitamin D levels | 2 | 260 | Rate Ratio (IV, Random, 95% CI) | 0.57 [0.37, 0.89] |
| 7.1.2 Not selected for lower vitamin D levels | 5 | 9064 | Rate Ratio (IV, Random, 95% CI) | 1.02 [0.93, 1.13] |
| 7.2 Number of fallers | 13 | Risk Ratio (IV, Random, 95% CI) | Subtotals only | |
| 7.2.1 Selected for lower vitamin D levels | 4 | 804 | Risk Ratio (IV, Random, 95% CI) | 0.70 [0.56, 0.87] |
| 7.2.2 Not selected for lower vitamin D levels | 9 | 25943 | Risk Ratio (IV, Random, 95% CI) | 1.00 [0.93, 1.07] |
Comparison 8. Medication provision: vitamin D 2000 IU/day vs vitamin D 800 IU/day.
| Outcome or subgroup title | No. of studies | No. of participants | Statistical method | Effect size |
|---|---|---|---|---|
| 8.1 Rate of falls | 1 | 173 | Rate Ratio (IV, Fixed, 95% CI) | 1.30 [0.99, 1.71] |
| 8.2 Number of people sustaining a fracture | 1 | 173 | Risk Ratio (IV, Fixed, 95% CI) | 0.51 [0.13, 1.98] |
Comparison 9. Medication provision: vitamin D analogue vs placebo.
| Outcome or subgroup title | No. of studies | No. of participants | Statistical method | Effect size |
|---|---|---|---|---|
| 9.1 Rate of falls | 1 | Rate Ratio (IV, Fixed, 95% CI) | Subtotals only | |
| 9.1.1 Calcitriol vs placebo | 1 | 213 | Rate Ratio (IV, Fixed, 95% CI) | 0.64 [0.49, 0.82] |
| 9.2 Number of fallers | 2 | Risk Ratio (IV, Fixed, 95% CI) | Subtotals only | |
| 9.2.1 Calcitriol vs placebo | 1 | 213 | Risk Ratio (IV, Fixed, 95% CI) | 0.54 [0.31, 0.93] |
| 9.2.2 Alfacalcidol vs placebo | 1 | 378 | Risk Ratio (IV, Fixed, 95% CI) | 0.69 [0.41, 1.17] |
| 9.3 Number of people sustaining a fracture | 1 | Risk Ratio (IV, Fixed, 95% CI) | Subtotals only | |
| 9.3.1 Calcitriol vs placebo | 1 | 246 | Risk Ratio (IV, Fixed, 95% CI) | 0.60 [0.28, 1.29] |
| 9.4 Number of people developing hypercalcaemia | 2 | 624 | Risk Ratio (M‐H, Fixed, 95% CI) | 2.49 [1.12, 5.50] |
Comparison 10. Medication provision: other medications vs control.
| Outcome or subgroup title | No. of studies | No. of participants | Statistical method | Effect size |
|---|---|---|---|---|
| 10.1 Rate of falls | 1 | Rate Ratio (IV, Fixed, 95% CI) | Subtotals only | |
| 10.1.1 Hormone replacement therapy vs placebo | 1 | 212 | Rate Ratio (IV, Fixed, 95% CI) | 0.88 [0.65, 1.18] |
| 10.1.2 Hormone replacement therapy + calcitriol vs placebo | 1 | 214 | Rate Ratio (IV, Fixed, 95% CI) | 0.75 [0.58, 0.97] |
| 10.2 Number of fallers | 3 | Risk Ratio (IV, Fixed, 95% CI) | Subtotals only | |
| 10.2.1 Hormone replacement therapy vs control/placebo | 2 | 585 | Risk Ratio (IV, Fixed, 95% CI) | 0.94 [0.81, 1.08] |
| 10.2.2 Hormone replacement therapy + calcitriol vs placebo | 1 | 214 | Risk Ratio (IV, Fixed, 95% CI) | 0.90 [0.72, 1.11] |
| 10.2.3 Alendronate + vitamin D3 vs control | 1 | 515 | Risk Ratio (IV, Fixed, 95% CI) | 0.82 [0.59, 1.14] |
| 10.3 Number of people sustaining a fracture | 1 | Risk Ratio (IV, Fixed, 95% CI) | Subtotals only | |
| 10.3.1 Calcium vs placebo | 1 | 1255 | Risk Ratio (IV, Fixed, 95% CI) | 0.90 [0.69, 1.16] |
| 10.3.2 Vitamin K2 + vitamin D2 + calcium vs control (Alzheimer's disease) | 0 | 0 | Risk Ratio (IV, Fixed, 95% CI) | Not estimable |
Comparison 11. Medication withdrawal vs control.
| Outcome or subgroup title | No. of studies | No. of participants | Statistical method | Effect size |
|---|---|---|---|---|
| 11.1 Rate of falls | 2 | Rate Ratio (IV, Fixed, 95% CI) | Subtotals only | |
| 11.1.1 Psychotropic medication withdrawal vs control | 1 | 93 | Rate Ratio (IV, Fixed, 95% CI) | 0.34 [0.16, 0.73] |
| 11.1.2 Medication review and modification vs usual care | 1 | 186 | Rate Ratio (IV, Fixed, 95% CI) | 1.01 [0.81, 1.25] |
| 11.2 Number of fallers | 4 | Risk Ratio (IV, Fixed, 95% CI) | Subtotals only | |
| 11.2.1 Psychotropic medication withdrawal vs control | 1 | 93 | Risk Ratio (IV, Fixed, 95% CI) | 0.61 [0.32, 1.17] |
| 11.2.2 Medication review and modification vs usual care | 2 | 445 | Risk Ratio (IV, Fixed, 95% CI) | 1.03 [0.81, 1.31] |
| 11.2.3 GP educational programme + medication review and modification vs control | 1 | 659 | Risk Ratio (IV, Fixed, 95% CI) | 0.61 [0.41, 0.91] |
Comparison 12. Surgery vs control.
| Outcome or subgroup title | No. of studies | No. of participants | Statistical method | Effect size |
|---|---|---|---|---|
| 12.1 Rate of falls | 5 | Rate Ratio (IV, Fixed, 95% CI) | Subtotals only | |
| 12.1.1 Cardiac pacing vs control | 3 | 349 | Rate Ratio (IV, Fixed, 95% CI) | 0.73 [0.57, 0.93] |
| 12.1.2 Cataract surgery (1st eye) vs control | 1 | 306 | Rate Ratio (IV, Fixed, 95% CI) | 0.66 [0.45, 0.95] |
| 12.1.3 Cataract surgery (2nd eye) vs control | 1 | 239 | Rate Ratio (IV, Fixed, 95% CI) | 0.68 [0.39, 1.17] |
| 12.2 Number of fallers | 4 | Risk Ratio (IV, Fixed, 95% CI) | Subtotals only | |
| 12.2.1 Cardiac pacing vs control | 2 | 178 | Risk Ratio (IV, Fixed, 95% CI) | 1.20 [0.92, 1.55] |
| 12.2.2 Cataract surgery (1st eye) vs control | 1 | 306 | Risk Ratio (IV, Fixed, 95% CI) | 0.95 [0.68, 1.33] |
| 12.2.3 Cataract surgery (2nd eye) vs control | 1 | 239 | Risk Ratio (IV, Fixed, 95% CI) | 1.06 [0.69, 1.63] |
| 12.3 Number of people sustaining a fracture | 3 | Risk Ratio (IV, Fixed, 95% CI) | Subtotals only | |
| 12.3.1 Cardiac pacing vs control | 1 | 171 | Risk Ratio (IV, Fixed, 95% CI) | 0.78 [0.18, 3.39] |
| 12.3.2 Cataract surgery (1st eye) vs control | 1 | 306 | Risk Ratio (IV, Fixed, 95% CI) | 0.33 [0.10, 1.05] |
| 12.3.3 Cataract surgery (2nd eye) vs control | 1 | 239 | Risk Ratio (IV, Fixed, 95% CI) | 2.51 [0.50, 12.52] |
Comparison 13. Fluid or nutrition therapy vs control.
| Outcome or subgroup title | No. of studies | No. of participants | Statistical method | Effect size |
|---|---|---|---|---|
| 13.1 Number of fallers | 3 | Risk Ratio (IV, Fixed, 95% CI) | Subtotals only | |
| 13.1.1 Nutritional supplementation vs control | 3 | 1902 | Risk Ratio (IV, Fixed, 95% CI) | 0.95 [0.83, 1.08] |
Comparison 14. Psychological interventions vs control.
| Outcome or subgroup title | No. of studies | No. of participants | Statistical method | Effect size |
|---|---|---|---|---|
| 14.1 Rate of falls | 1 | Rate Ratio (IV, Fixed, 95% CI) | Subtotals only | |
| 14.1.1 Cognitive behavioural intervention vs control | 1 | 120 | Rate Ratio (IV, Fixed, 95% CI) | 1.00 [0.37, 2.72] |
| 14.2 Number of fallers | 2 | Risk Ratio (IV, Fixed, 95% CI) | Subtotals only | |
| 14.2.1 Cognitive behavioural intervention vs control | 2 | 350 | Risk Ratio (IV, Fixed, 95% CI) | 1.11 [0.80, 1.54] |
Comparison 15. Environment/assistive technology interventions: home safety vs control.
| Outcome or subgroup title | No. of studies | No. of participants | Statistical method | Effect size |
|---|---|---|---|---|
| 15.1 Rate of falls | 6 | 4208 | Rate Ratio (IV, Random, 95% CI) | 0.81 [0.68, 0.97] |
| 15.2 Number of fallers | 7 | 4051 | Risk Ratio (IV, Fixed, 95% CI) | 0.88 [0.80, 0.96] |
| 15.3 Number of participants sustaining a fracture | 1 | 360 | Risk Ratio (IV, Fixed, 95% CI) | 1.32 [0.30, 5.87] |
Comparison 16. Home safety intervention vs control: subgroup analysis by risk of falling at baseline.
| Outcome or subgroup title | No. of studies | No. of participants | Statistical method | Effect size |
|---|---|---|---|---|
| 16.1 Rate of falls | 6 | Rate Ratio (IV, Random, 95% CI) | Subtotals only | |
| 16.1.1 Selected for higher risk of falling | 3 | 851 | Rate Ratio (IV, Random, 95% CI) | 0.62 [0.50, 0.77] |
| 16.1.2 Not selected for higher risk of falling | 3 | 3357 | Rate Ratio (IV, Random, 95% CI) | 0.94 [0.84, 1.05] |
| 16.2 Number of fallers | 7 | Risk Ratio (IV, Random, 95% CI) | Subtotals only | |
| 16.2.1 Selected for higher risk of falling | 3 | 684 | Risk Ratio (IV, Random, 95% CI) | 0.85 [0.75, 0.97] |
| 16.2.2 Not selected for higher risk of falling | 4 | 3367 | Risk Ratio (IV, Random, 95% CI) | 0.90 [0.80, 1.00] |
Comparison 17. Home safety intervention vs control: subgroup analysis by delivery personnel.
| Outcome or subgroup title | No. of studies | No. of participants | Statistical method | Effect size |
|---|---|---|---|---|
| 17.1 Rate of falls | 7 | Rate Ratio (IV, Random, 95% CI) | Subtotals only | |
| 17.1.1 Home safety intervention (OT) vs control | 4 | 1443 | Rate Ratio (IV, Random, 95% CI) | 0.69 [0.55, 0.86] |
| 17.1.2 Home safety intervention (not OT) vs control | 4 | 3075 | Rate Ratio (IV, Random, 95% CI) | 0.91 [0.75, 1.11] |
| 17.2 Number of fallers | 7 | Risk Ratio (IV, Random, 95% CI) | Subtotals only | |
| 17.2.1 Home safety intervention (OT) vs control | 5 | 1153 | Risk Ratio (IV, Random, 95% CI) | 0.79 [0.70, 0.91] |
| 17.2.2 Home safety intervention (not OT) vs control | 3 | 2975 | Risk Ratio (IV, Random, 95% CI) | 0.94 [0.85, 1.05] |
Comparison 18. Environment/assistive technology interventions: vision improvement vs control.
| Outcome or subgroup title | No. of studies | No. of participants | Statistical method | Effect size |
|---|---|---|---|---|
| 18.1 Rate of falls | 3 | Rate Ratio (IV, Fixed, 95% CI) | Subtotals only | |
| 18.1.1 Vision assessment and eye examination + intervention (with or without referral) vs control | 1 | 616 | Rate Ratio (IV, Fixed, 95% CI) | 1.57 [1.19, 2.06] |
| 18.1.2 Visual acuity assessment and referral vs remainder | 1 | 1090 | Rate Ratio (IV, Fixed, 95% CI) | 0.91 [0.77, 1.09] |
| 18.1.3 Single lens distance glasses vs usual glasses (multifocal) | 1 | 597 | Rate Ratio (IV, Fixed, 95% CI) | 0.92 [0.73, 1.17] |
| 18.2 Number of fallers | 3 | Risk Ratio (IV, Fixed, 95% CI) | Subtotals only | |
| 18.2.1 Vision assessment and eye examination + intervention (with or without referral) vs control | 1 | 616 | Risk Ratio (IV, Fixed, 95% CI) | 1.54 [1.24, 1.91] |
| 18.2.2 Visual acuity assessment and referral vs remainder | 1 | 1090 | Risk Ratio (IV, Fixed, 95% CI) | 0.89 [0.76, 1.04] |
| 18.2.3 Single lens distance glasses vs usual glasses (multifocal) | 1 | 597 | Risk Ratio (IV, Fixed, 95% CI) | 0.97 [0.85, 1.11] |
| 18.3 Number of people sustaining a fracture | 2 | Risk Ratio (IV, Fixed, 95% CI) | Subtotals only | |
| 18.3.1 Vision assessment and eye examination + intervention (with or without referral) vs control | 1 | 616 | Risk Ratio (IV, Fixed, 95% CI) | 1.73 [0.96, 3.12] |
| 18.3.2 Single lens distance glasses vs usual glasses (multifocal) | 1 | 597 | Risk Ratio (IV, Fixed, 95% CI) | 1.58 [0.74, 3.40] |
Comparison 19. Environment/assistive technology interventions: footwear modification vs control.
| Outcome or subgroup title | No. of studies | No. of participants | Statistical method | Effect size |
|---|---|---|---|---|
| 19.1 Rate of falls | 1 | Rate Ratio (IV, Fixed, 95% CI) | Subtotals only | |
| 19.1.1 Anti‐slip shoe device for icy conditions vs control | 1 | 109 | Rate Ratio (IV, Fixed, 95% CI) | 0.42 [0.22, 0.78] |
| 19.2 Number of fallers | 1 | Risk Ratio (IV, Fixed, 95% CI) | Subtotals only | |
| 19.2.1 Balance‐enhancing insoles vs conventional insoles | 1 | 40 | Risk Ratio (IV, Fixed, 95% CI) | 0.56 [0.23, 1.38] |
Comparison 20. Knowledge/education interventions vs control.
| Outcome or subgroup title | No. of studies | No. of participants | Statistical method | Effect size |
|---|---|---|---|---|
| 20.1 Rate of falls | 1 | Rate Ratio (IV, Fixed, 95% CI) | Subtotals only | |
| 20.1.1 Education interventions vs control | 1 | 45 | Rate Ratio (IV, Fixed, 95% CI) | 0.33 [0.09, 1.20] |
| 20.2 Number of fallers | 4 | Risk Ratio (IV, Fixed, 95% CI) | Subtotals only | |
| 20.2.1 Education interventions vs control | 4 | 2555 | Risk Ratio (IV, Fixed, 95% CI) | 0.88 [0.75, 1.03] |
Comparison 21. Multiple interventions.
| Outcome or subgroup title | No. of studies | No. of participants | Statistical method | Effect size |
|---|---|---|---|---|
| 21.1 Rate of falls | 14 | Rate Ratio (IV, Fixed, 95% CI) | Subtotals only | |
| 21.1.1 Exercise + home safety vs remainder | 1 | 1090 | Rate Ratio (IV, Fixed, 95% CI) | 0.77 [0.61, 0.98] |
| 21.1.2 Exercise + vision assessment vs remainder | 1 | 1090 | Rate Ratio (IV, Fixed, 95% CI) | 0.72 [0.57, 0.91] |
| 21.1.3 Exercise + home safety + vision assessment vs remainder | 1 | 1090 | Rate Ratio (IV, Fixed, 95% CI) | 0.71 [0.53, 0.96] |
| 21.1.4 Home safety + vision assessment vs remainder | 1 | 1090 | Rate Ratio (IV, Fixed, 95% CI) | 0.89 [0.70, 1.12] |
| 21.1.5 Exercise + home safety +education vs control | 1 | 285 | Rate Ratio (IV, Fixed, 95% CI) | 0.69 [0.50, 0.96] |
| 21.1.6 Exercise + home safety + education vs education | 1 | 124 | Rate Ratio (IV, Fixed, 95% CI) | 0.93 [0.61, 1.44] |
| 21.1.7 Exercise + home safety + education + clinical assessment vs education | 1 | 122 | Rate Ratio (IV, Fixed, 95% CI) | 0.89 [0.58, 1.37] |
| 21.1.8 Exercise + home safety + multifactorial assessment and referral vs multifactorial assessment and referral | 1 | 19 | Rate Ratio (IV, Fixed, 95% CI) | 0.18 [0.02, 1.59] |
| 21.1.9 Exercise + vitamin D vs no exercise/no vitamin D (severe visual impairment) | 1 | 391 | Rate Ratio (IV, Fixed, 95% CI) | 1.15 [0.82, 1.61] |
| 21.1.10 Exercise + nutrition + calcium + vitamin D vs calcium + vitamin D | 1 | 20 | Rate Ratio (IV, Fixed, 95% CI) | 0.19 [0.05, 0.68] |
| 21.1.11 Exercise + cognitive behavioural therapy vs control | 1 | 116 | Rate Ratio (IV, Fixed, 95% CI) | 0.38 [0.10, 1.47] |
| 21.1.12 Exercise + "individualised fall prevention advice" vs control | 1 | 78 | Rate Ratio (IV, Fixed, 95% CI) | 0.89 [0.71, 1.10] |
| 21.1.13 Centre‐based rehabilitation (exercise + education) vs home‐based rehabilitation (exercise + education) | 1 | 76 | Rate Ratio (IV, Fixed, 95% CI) | 0.46 [0.22, 0.97] |
| 21.1.14 Physical training + education vs control | 1 | 33 | Rate Ratio (IV, Fixed, 95% CI) | 2.12 [0.59, 7.57] |
| 21.1.15 Exercise + education vs education | 1 | 132 | Rate Ratio (IV, Fixed, 95% CI) | 0.90 [0.61, 1.33] |
| 21.1.16 Exercise + education + risk assessment vs control | 1 | 453 | Rate Ratio (IV, Fixed, 95% CI) | 0.75 [0.52, 1.09] |
| 21.1.17 Multifunctional training + whole body vibration vs light physical exercise | 1 | 97 | Rate Ratio (IV, Fixed, 95% CI) | 0.46 [0.27, 0.79] |
| 21.1.18 Multifaceted podiatry including foot and ankle exercises vs routine podiatry care | 1 | 305 | Rate Ratio (IV, Fixed, 95% CI) | 0.64 [0.45, 0.91] |
| 21.1.19 Multidisciplinary rehabilitation + home safety visit vs multidisciplinary rehabilitation (no home visit) | 1 | 95 | Rate Ratio (IV, Fixed, 95% CI) | 0.46 [0.21, 1.00] |
| 21.2 Number of fallers | 13 | Risk Ratio (IV, Fixed, 95% CI) | Subtotals only | |
| 21.2.1 Exercise + home safety vs remainder | 1 | 1090 | Risk Ratio (IV, Fixed, 95% CI) | 0.76 [0.60, 0.97] |
| 21.2.2 Exercise + vision assessment vs remainder | 1 | 1090 | Risk Ratio (IV, Fixed, 95% CI) | 0.73 [0.59, 0.91] |
| 21.2.3 Exercise + home safety + vision assessment vs remainder | 1 | 1090 | Risk Ratio (IV, Fixed, 95% CI) | 0.67 [0.51, 0.88] |
| 21.2.4 Home safety + vision assessment vs remainder | 1 | 1090 | Risk Ratio (IV, Fixed, 95% CI) | 0.81 [0.65, 1.01] |
| 21.2.5 Exercise + home safety + education vs control | 1 | 310 | Risk Ratio (IV, Fixed, 95% CI) | 0.90 [0.74, 1.09] |
| 21.2.6 Exercise + home safety + education vs education | 1 | 124 | Risk Ratio (IV, Fixed, 95% CI) | 0.87 [0.61, 1.24] |
| 21.2.7 Exercise + home safety + education + clinical assessment vs education | 1 | 122 | Risk Ratio (IV, Fixed, 95% CI) | 0.83 [0.57, 1.20] |
| 21.2.8 Exercise + vit D vs no exercise/no vit D (severe visual impairment) | 1 | 391 | Risk Ratio (IV, Fixed, 95% CI) | 0.99 [0.81, 1.20] |
| 21.2.9 Exercise + cognitive behavioural therapy vs control | 1 | 116 | Risk Ratio (IV, Fixed, 95% CI) | 0.40 [0.11, 1.45] |
| 21.2.10 Centre‐based rehabilitation (exercise + education) vs home‐based rehabilitation (exercise + education) | 1 | 73 | Risk Ratio (IV, Fixed, 95% CI) | 0.57 [0.35, 0.93] |
| 21.2.11 Physical training + education vs control | 1 | 33 | Risk Ratio (IV, Fixed, 95% CI) | 1.39 [0.66, 2.93] |
| 21.2.12 Exercise + education vs control | 1 | 103 | Risk Ratio (IV, Fixed, 95% CI) | 1.68 [0.16, 17.67] |
| 21.2.13 Exercise + education vs education | 1 | 132 | Risk Ratio (IV, Fixed, 95% CI) | 0.84 [0.59, 1.20] |
| 21.2.14 Exercise + education + risk assessment vs control | 1 | 453 | Risk Ratio (IV, Fixed, 95% CI) | 0.96 [0.82, 1.12] |
| 21.2.15 Multifaceted podiatry including foot and ankle exercises vs routine podiatry care | 1 | 305 | Risk Ratio (IV, Fixed, 95% CI) | 0.85 [0.66, 1.10] |
| 21.2.16 Home safety + medication review vs control | 1 | 294 | Risk Ratio (IV, Fixed, 95% CI) | 0.79 [0.46, 1.34] |
| 21.2.17 Education + free access to geriatric clinic vs control | 1 | 815 | Risk Ratio (IV, Fixed, 95% CI) | 0.77 [0.63, 0.94] |
| 21.2.18 Multidisciplinary rehabilitation + home safety visit vs multidisciplinary rehabilitation (no home visit) | 1 | 95 | Risk Ratio (IV, Fixed, 95% CI) | 0.51 [0.21, 1.24] |
| 21.3 Number of people sustaining a fracture | 2 | Risk Ratio (IV, Fixed, 95% CI) | Subtotals only | |
| 21.3.1 Multifaceted podiatry including foot and ankle exercises vs routine podiatry care | 1 | 305 | Risk Ratio (IV, Fixed, 95% CI) | 0.14 [0.02, 1.05] |
| 21.3.2 Multifunctional training + whole body vibration vs light physical exercise | 1 | 97 | Risk Ratio (IV, Fixed, 95% CI) | 0.46 [0.13, 1.64] |
Comparison 22. Multifactorial intervention vs control.
| Outcome or subgroup title | No. of studies | No. of participants | Statistical method | Effect size |
|---|---|---|---|---|
| 22.1 Rate of falls | 19 | 9503 | Rate Ratio (IV, Random, 95% CI) | 0.76 [0.67, 0.86] |
| 22.2 Number of fallers | 34 | 13617 | Risk Ratio (IV, Random, 95% CI) | 0.93 [0.86, 1.02] |
| 22.3 Number of people sustaining a fracture | 11 | 3808 | Risk Ratio (IV, Random, 95% CI) | 0.84 [0.67, 1.05] |
Comparison 23. Multifactorial intervention vs control: subgroup analysis by falls risk at baseline.
| Outcome or subgroup title | No. of studies | No. of participants | Statistical method | Effect size |
|---|---|---|---|---|
| 23.1 Rate of falls | 19 | Rate Ratio (IV, Random, 95% CI) | Subtotals only | |
| 23.1.1 Selected for higher risk of falling | 17 | 5954 | Rate Ratio (IV, Random, 95% CI) | 0.77 [0.66, 0.90] |
| 23.1.2 Not selected for higher risk of falling | 2 | 3549 | Rate Ratio (IV, Random, 95% CI) | 0.57 [0.23, 1.38] |
| 23.2 Number of fallers | 34 | Risk Ratio (IV, Random, 95% CI) | Subtotals only | |
| 23.2.1 Selected for higher risk of falling | 25 | 7536 | Risk Ratio (IV, Random, 95% CI) | 0.94 [0.85, 1.03] |
| 23.2.2 Not selected for higher risk of falling | 9 | 6081 | Risk Ratio (IV, Random, 95% CI) | 0.92 [0.76, 1.11] |
Comparison 24. Multifactorial intervention vs control: subgroup analysis by intensity of intervention.
| Outcome or subgroup title | No. of studies | No. of participants | Statistical method | Effect size |
|---|---|---|---|---|
| 24.1 Rate of falls | 19 | Rate Ratio (IV, Random, 95% CI) | Subtotals only | |
| 24.1.1 Assessment and active intervention | 11 | 6338 | Rate Ratio (IV, Random, 95% CI) | 0.74 [0.61, 0.89] |
| 24.1.2 Assessment and referral or provision of information | 9 | 3376 | Rate Ratio (IV, Random, 95% CI) | 0.82 [0.71, 0.95] |
| 24.2 Number of fallers | 34 | Risk Ratio (IV, Random, 95% CI) | Subtotals only | |
| 24.2.1 Assessment and active intervention | 16 | 7315 | Risk Ratio (IV, Random, 95% CI) | 0.87 [0.76, 0.98] |
| 24.2.2 Assessment and referral or provision of information | 20 | 6662 | Risk Ratio (IV, Random, 95% CI) | 1.02 [0.93, 1.12] |
Comparison 25. Multifactorial intervention (setting 1) vs multifactorial intervention (setting 2).
| Outcome or subgroup title | No. of studies | No. of participants | Statistical method | Effect size |
|---|---|---|---|---|
| 25.1 Rate of falls | 1 | Rate Ratio (IV, Fixed, 95% CI) | Subtotals only | |
| 25.1.1 Community‐based intervention vs hospital‐based intervention | 1 | 349 | Rate Ratio (IV, Fixed, 95% CI) | 0.84 [0.49, 1.46] |
| 25.2 Number of fallers | 2 | Risk Ratio (IV, Fixed, 95% CI) | Subtotals only | |
| 25.2.1 Community‐based intervention vs hospital‐based intervention | 1 | 349 | Risk Ratio (IV, Fixed, 95% CI) | 1.27 [0.78, 2.08] |
| 25.2.2 Specialised Geriatric Service intervention vs family physician intervention | 1 | 234 | Risk Ratio (IV, Fixed, 95% CI) | 0.96 [0.72, 1.29] |
| 25.3 Number of people sustaining a fracture | 1 | Risk Ratio (IV, Fixed, 95% CI) | Subtotals only | |
| 25.3.1 Community‐based intervention vs hospital‐based intervention | 1 | 219 | Risk Ratio (IV, Fixed, 95% CI) | 1.17 [0.20, 6.85] |
Characteristics of studies
Characteristics of included studies [ordered by study ID]
Assantachai 2002.
| Study characteristics | ||
| Methods | CCT (cluster‐randomised by community) | |
| Participants | Setting: Bangkok, Thailand N = 1043 Sample: people living in 11 selected urban communities (64% women) Age (years): mean 67.6 (SD 6.2) Inclusion criteria: aged at least 60; living in one of the selected communities | |
| Interventions | 1. Educational leaflet and free access to geriatric clinic. Leaflet about locally identified risk factors for falling (kyphoscoliosis, nutritional status, ADL, hypertension, special sense function, cognitive problems) and ways of preventing, correcting, coping with them. Assessed musculoskeletal deformity, arthralgia, hypertension, ADL, mobility, gait, hearing, vision, and presumably any problems addressed at geriatric clinic 2. Control: no intervention | |
| Outcomes | 1. Number of people falling | |
| Duration of the study | 1 year | |
| Notes | ||
| Risk of bias | ||
| Bias | Authors' judgement | Support for judgement |
| Random sequence generation (selection bias) | High risk | Communities drawn from pool of 20 until 1043 subjects recruited. Communities then allocated to intervention (odd number) or control (even number) using enrolment sequence (information provided by author). |
| Allocation concealment (selection bias) | High risk | Alternation |
| Blinding of participants and personnel (performance bias) All outcomes | Unclear risk | Cluster‐randomised by community. Control groups received leaflet and offer of hospital access and self reported falls every 2 months. Insufficient information to judge risk of bias. |
| Blinding of outcome assessment (detection bias) Falls and fallers | Unclear risk | Falls recorded in both groups by participants who were aware of their group allocation. Blinding of assessors not described. |
| Incomplete outcome data (attrition bias) Fallers | Low risk | SeeAppendix 3 for method of assessment |
| Risk of bias in recall of falls | High risk | Interval recall. Falls ascertained by postcards every 2 months, and phone call if no card returned. |
Ballard 2004.
| Study characteristics | ||
| Methods | RCT | |
| Participants | Setting: USA N = 40 Sample: volunteers (100% women) Age (years): mean 72.9 (SD 6) Inclusion criteria: aged ≥ 65; ambulatory; community‐dwelling; history of falling in previous year or fear of future fall; able to moderate exercise Exclusion criteria: cardiovascular disease or extreme vertigo that might prohibit moderate exercise; requiring walker for support | |
| Interventions | 1. Exercise sessions (warm up, low impact aerobics, exercise for strength and balance, cool down) 1 hour, 3 x per wk, for 15 wk. Plus 6 home safety education classes. 2. Control: exercise sessions as above 1 hour, 3 x per wk, for 2 wk + videotape so could continue at home. Plus 6 home safety education classes as above. | |
| Outcomes | 1. Rate of falls
2. Number of people falling Falls a secondary outcome of study Other outcomes reported but not included in this review |
|
| Duration of the study | 16 months | |
| Notes | ||
| Risk of bias | ||
| Bias | Authors' judgement | Support for judgement |
| Random sequence generation (selection bias) | Unclear risk | Quote: "assigned to exercise and control groups using stratified randomisation". |
| Allocation concealment (selection bias) | Unclear risk | Insufficient information to permit judgement |
| Blinding of participants and personnel (performance bias) All outcomes | Unclear risk | Control group had 2 wk exercise programme ‐ study group 15 wk. Neither participants or study personnel blinded. |
| Blinding of outcome assessment (detection bias) Falls and fallers | Unclear risk | Falls data collected by telephone at 1 year. Blinding of telephone assessors not reported. |
| Incomplete outcome data (attrition bias) Falls | Low risk | SeeAppendix 3 for method of assessment |
| Incomplete outcome data (attrition bias) Fallers | Low risk | SeeAppendix 3 for method of assessment |
| Risk of bias in recall of falls | High risk | Falls identified retrospectively during intervention at each home safety class (every 2 months), and by telephone follow‐up 1 year after end of intervention |
Barnett 2003.
| Study characteristics | ||
| Methods | RCT | |
| Participants | Setting: Australia N = 163 Sample: elderly people identified (67% women) as at risk of falling by general practitioner or hospital physiotherapist using assessment tool Age (years): mean 74.9 (SD 10.9) Inclusion criteria: age over 65 years; identified as 'at risk' of falling (1 or more of the following risk factors: lower limb weakness, poor balance, slow reaction time) Exclusion criteria: cognitive impairment; degenerative conditions, e.g. Parkinson's disease or medical condition involving neuromuscular, skeletal, or cardiovascular system that precluded taking part in exercise programme | |
| Interventions | 1. Exercise sessions (stretching, and for strength, balance, co‐ordination, aerobic capacity) by accredited exercise instructor, in groups of 6 to 18, 1 hour per wk for 4 terms for 1 year (37 classes)
Home exercise programme based on class content + diaries to record participation
2. Control: no exercise intervention Both groups received information on strategies for avoiding falls, e.g. hand and foot placement if loss of balance occurred |
|
| Outcomes | 1. Rate of falls 2. Number of people falling Other outcomes reported but not included in this review | |
| Duration of the study | 1 year | |
| Notes | ||
| Risk of bias | ||
| Bias | Authors' judgement | Support for judgement |
| Random sequence generation (selection bias) | Unclear risk | Quote: "randomised in matched blocks" (N = 6) |
| Allocation concealment (selection bias) | Low risk | Consecutively numbered, opaque envelopes |
| Blinding of participants and personnel (performance bias) All outcomes | Unclear risk | Both groups received information on strategies for avoiding falls. Intervention group received structured weekly exercise sessions. Blinding not reported, but impact of non‐blinding unclear. |
| Blinding of outcome assessment (detection bias) Falls and fallers | Unclear risk | Falls reported by participants who were aware of their group allocation, by postal surveys monthly in both groups. Telephone interview if not returned by 2 weeks. Unclear whether those conducting telephone check were unblinded. |
| Incomplete outcome data (attrition bias) Falls | Low risk | SeeAppendix 3 for method of assessment |
| Incomplete outcome data (attrition bias) Fallers | Low risk | SeeAppendix 3 for method of assessment |
| Risk of bias in recall of falls | Unclear risk | Interval recall. Falls identified by postal survey at the end of each calendar month. Phoned if not returned within 2 weeks. |
Beling 2009.
| Study characteristics | ||
| Methods | RCT | |
| Participants | Setting: California State University, Northridge, California, USA N = 23 Sample: volunteers recruited through press releases, newspaper advertisements and university website (42% women) Age (years): mean 80 (SD 5.7) Inclusion criteria: ≥ 65 years; community‐dwelling; English speaking; minimal vision and hearing deficit; access to transportation; consenting; with physician approval to participate; MMSE ≥ 24/30; 3 m TUG test ≥ 13.5 sec and/or to have ≥ 2 falls in past year and/or 1 injurious fall in the past year Exclusion criteria: cardiac conditions; musculoskeletal and/or neurological impairment that could result in falls, e.g. stroke, Parkinson's disease, lower extremity joint replacement, fracture in last year | |
| Interventions | Both groups received multifactorial intervention (assessment and referral) prior to randomisation 1. Intervention: physiotherapist‐led, group‐based balance training 3 x per wk for 12 wks. Tailored to address risk factors identified at pre‐testing. Home assessment by physiotherapist students. Written recommendations given and discussed. Funding to assist with modifications. Measured and supplied with hip protectors. 2. Control: usual activities but offered intervention after post test |
|
| Outcomes | 1. Rate of falls Other outcomes reported but not included in this review | |
| Duration of the study | 3 months | |
| Notes | Required to attend minimum of 30 sessions | |
| Risk of bias | ||
| Bias | Authors' judgement | Support for judgement |
| Random sequence generation (selection bias) | Unclear risk | Quote: "Twelve subjects were randomly assigned to the experimental group and 11 subjects were assigned to the control group." Insufficient information to permit judgement. |
| Allocation concealment (selection bias) | Unclear risk | Quote: "randomly assigned". Insufficient information to permit judgement. |
| Blinding of participants and personnel (performance bias) All outcomes | Unclear risk | Participants and personnel not blind to allocated group but impact of non‐blinding unclear |
| Blinding of outcome assessment (detection bias) Falls and fallers | Unclear risk | No information on method of recording falls. Insufficient information to permit judgement. |
| Incomplete outcome data (attrition bias) Falls | High risk | SeeAppendix 3 for method of assessment |
| Risk of bias in recall of falls | High risk | Quote: "The number of falls that occurred in both groups during the 12 week intervention was also collected at the end of the intervention." Ascertainment relied on participant recall at the end of the 12 week intervention. |
Beyer 2007.
| Study characteristics | ||
| Methods | RCT | |
| Participants | Setting: Copenhagen, Denmark N = 65 Sample: women with a history of a fall identified from hospital records Age (years): range 70 to 90 Inclusion criteria: community‐dwelling; at a relatively high risk of falls, defined as either ≥ 80 years old or ≥ 65 years with history of a fall in the previous 12 months or a timed up and go test score of at least 15 seconds; home‐dwelling; aged 70 to 90 years; history of a fall requiring treatment in ED but not hospitalisation; able to come to training facility Exclusion criteria: lower limb fracture in last 6 months; neurological diseases, unable to understand Danish; cognitively impaired (MMSE < 24) | |
| Interventions | 1. Supervised group exercise programme (flexibility, lower limb resistance exercise, balance training, stretching), 60 min, 2 x per wk, for 6 months 2. Control: no intervention, but offered intervention after 1 year | |
| Outcomes | 1. Number of people falling Other outcomes reported but not included in this review | |
| Duration of the study | 1 year | |
| Notes | ||
| Risk of bias | ||
| Bias | Authors' judgement | Support for judgement |
| Random sequence generation (selection bias) | Low risk | Quote: "…using the minimization method with the aid of a computer program for randomization" |
| Allocation concealment (selection bias) | Unclear risk | Insufficient information to permit judgement |
| Blinding of participants and personnel (performance bias) All outcomes | Unclear risk | Participants and personnel not blind to allocated group but impact of non‐blinding unclear |
| Blinding of outcome assessment (detection bias) Falls and fallers | Unclear risk | Falls were recorded in both allocated groups using the same method (a monthly falls calendar), but no mention of blinding of personnel confirming falls or carrying out data entry. Insufficient information to make a judgement of 'Low risk' or 'High risk'. |
| Incomplete outcome data (attrition bias) Fallers | Low risk | SeeAppendix 3 for method of assessment |
| Risk of bias in recall of falls | Low risk | Quote: "A falls calendar was sent to every participant on the first day of each month" for 1 year |
Bischoff‐Ferrari 2006.
| Study characteristics | ||
| Methods | RCT | |
| Participants | Setting: Boston, MA, USA N = 445 Sample: men and women recruited by direct mailings and presentations (sample frame not given) (55% women) Age (years): mean 71 Inclusion criteria: aged ≥ 65 Exclusion criteria: current cancer or hyperparathyroidism; kidney stone in last 5 years; renal disease; bilateral hip surgery; bisphosphonate, calcitonin, oestrogen, tamoxifen, or testosterone therapy in past 6 months, or fluoride in past 2 years; femoral neck BMD > 2 SD below the mean for subjects of the same age and sex; dietary calcium intake > 1500 mg/day; laboratory evidence of kidney disease | |
| Interventions | 1. Cholecalciferol (700 IU vitamin D) and calcium citrate malate (500 mg elemental calcium) orally, daily at bedtime for 3 years 2. Control: double placebo tablets | |
| Outcomes | 1. Rate of falls
2. Number of people falling
3. Number sustaining a fracture 4. Adverse effects Other outcomes reported but not included in this review |
|
| Duration of the study | 3 years | |
| Notes | ||
| Risk of bias | ||
| Bias | Authors' judgement | Support for judgement |
| Random sequence generation (selection bias) | Unclear risk | Quote: "Participants were randomly assigned ..." Quote: "Random group assignment was performed with stratification according to sex, race and decade of age." |
| Allocation concealment (selection bias) | Unclear risk | Insufficient information to permit judgement |
| Blinding of participants and personnel (performance bias) All outcomes | Low risk | Placebo‐controlled medication trial |
| Blinding of outcome assessment (detection bias) Falls and fallers | Low risk | Falls reported by participants who were blind to their group allocation (placebo‐controlled trial) |
| Blinding of outcome assessment (detection bias) Fractures | Low risk | Quote: "... cases of nonvertebral fracture were ascertained by means of interviews and verified with use of hospital records." |
| Incomplete outcome data (attrition bias) Falls | Low risk | SeeAppendix 3 for method of assessment |
| Incomplete outcome data (attrition bias) Fallers | Low risk | SeeAppendix 3 for method of assessment |
| Risk of bias in recall of falls | Low risk | Quote: "Participants were asked to send a postcard after every fall, which was then followed by a telephone call from a staff member to assess the circumstances of the fall. In addition, falls were ascertained at every follow‐up visit." |
Bischoff‐Ferrari 2010.
| Study characteristics | ||
| Methods | RCT (2 x 2 factorial design) | |
| Participants | Setting: hospital centre, Triemli, Switzerland N = 173 Sample: acute hip fracture (79% women) Age (years): mean 84 (range 65 to 99) Inclusion criteria: aged ≥ 65; acute hip fracture; MMSE ≥ 15; creatinine clearance > 15 mL/min; able to walk 3 m before hip fracture Exclusion criteria: prior hip fracture at same hip; cancer or chemotherapy in last year; severe visual or hearing impairment; kidney stone in past 5 years; hypercalcaemia; primary parathyroidism or sarcoidosis | |
| Interventions | 1. Cholecalciferol (vitamin D3) 2000 IU/day (breakfast and bedtime 400 IU cholecalciferol + 500 mg calcium carbonate + 1200 IU cholecalciferol at breakfast) + standard physiotherapy (supervised physiotherapy 30 min/day in acute care) 2. Cholecalciferol 2000 IU/day (breakfast and bedtime 400 IU cholecalciferol + 500 mg calcium carbonate + 1200 IU cholecalciferol at breakfast) + extended physiotherapy (supervised physiotherapy 30 min/day + 30 min/day home programme instruction in acute care + unsupervised home programme for 12 months (standing on 1, 2 legs; Theraband for arms; getting in/out chairs; going up/down stairs)) 3. Cholecalciferol 800 IU/day (breakfast and bedtime 400 IU cholecalciferol + 500 mg calcium carbonate + placebo cholecalciferol at breakfast) + standard physiotherapy (as above) 4. Cholecalciferol 800 IU/day (breakfast and bedtime 400 IU cholecalciferol + 500 mg calcium carbonate + placebo cholecalciferol at breakfast) + extended physiotherapy (as above) |
|
| Outcomes | 1. Rate of falls
2. Number sustaining a hip fracture 3. Adverse effects |
|
| Duration of the study | 1 year | |
| Notes | ||
| Risk of bias | ||
| Bias | Authors' judgement | Support for judgement |
| Random sequence generation (selection bias) | Low risk | Quote: "Computer‐based randomization was performed by the study statistician" |
| Allocation concealment (selection bias) | Unclear risk | Insufficient information to permit judgement of 'high' or 'low' |
| Blinding of participants and personnel (performance bias) All outcomes | Low risk | Quote: "Randomization for the dosage of cholecalciferol was double‐blinded, whereas randomization for PT was single‐blinded (all study staff except the treating physiotherapist who instructed the home program were blinded to the PT treatment allocation)." Trial with 4 arms (factorial design) with varying risk of bias. Drug intervention placebo‐controlled (low risk). Although participants and PT aware of which physiotherapy intervention they were receiving the impact of non‐blinding likely to be low or unclear |
| Blinding of outcome assessment (detection bias) Falls and fallers | Low risk | Phoned by assessor blind to allocation. Quote: "... all study staff except the treating physiotherapist who instructed the home program were blinded to the PT treatment allocation." "To maintain the blinding of our study staff to the PT group, we assessed adherence to the home program (at least once per wk vs less) only at the 12‐month follow‐up visit or by telephone call." |
| Blinding of outcome assessment (detection bias) Fractures | Low risk | Quote: "Falls, fall‐related injuries, and hospital readmissions were assessed by monthly telephone calls and a patient diary." "All admission records were reviewed by 3 blinded coinvestigators (H.A.B.‐F., A.E., and N.J.M.) to determine the main cause of readmission." Hip fracture data used in this review and these participants would have been hospitalised and therefore confirmed by blinded coinvestigators. |
| Incomplete outcome data (attrition bias) Falls | Low risk | SeeAppendix 3 for method of assessment |
| Risk of bias in recall of falls | Low risk | Quote: "Falls, fall‐related injuries, and hospital readmissions were assessed by monthly telephone calls and a patient diary. In addition, a telephone hotline was provided to report these events at any time." |
Blalock 2010.
| Study characteristics | ||
| Methods | RCT | |
| Participants | Setting: North Carolina, USA N = 186 Sample: recruited through a chain of community pharmacies (71% women) Age (years): mean 74.8 (SD 6.9) Inclusion criteria: aged ≥ 65 years; ≥ 1 falls during 12‐month period before study entry; taking ≥ 4 prescription medications; taking ≥ 1 high falls‐risk medication; able to speak and read English Exclusion criteria: resident of long‐term care facility; cognitively impaired; housebound | |
| Interventions | 1. Pharmacist intervention: face‐to‐face consultation with community pharmacist about medication regimen (identifying side effects etc). Pharmacist follow‐up as required; participants' physicians to co‐ordinate any recommended medication changes. Given fall prevention brochure and home safety checklist 2. Control: given fall prevention brochure and home safety checklist | |
| Outcomes | 1. Rate of falls 2. Number of people falling |
|
| Duration of the study | 1 year | |
| Notes | ||
| Risk of bias | ||
| Bias | Authors' judgement | Support for judgement |
| Random sequence generation (selection bias) | Low risk | Quote: "The allocation sequence used for making group assignments was created using a list of random numbers, generated in blocks of 20 to ensure balancing of group assignment over the duration of participant recruitment." |
| Allocation concealment (selection bias) | Unclear risk | Quote: "The allocation sequence was concealed from all study personnel except the principal investigator, who had no contact with study participants during the process of data collection or intervention delivery." Insufficient information to permit judgement. |
| Blinding of participants and personnel (performance bias) All outcomes | Unclear risk | Participants and personnel not blind to allocated group but impact of non‐blinding unclear |
| Blinding of outcome assessment (detection bias) Falls and fallers | Low risk | Participants contacted by phone if calendars not returned, or reporting a fall. The only unblinded member of the research group was not involved in data collection (see above). |
| Incomplete outcome data (attrition bias) Falls | Low risk | SeeAppendix 3 for method of assessment |
| Incomplete outcome data (attrition bias) Fallers | Low risk | SeeAppendix 3 for method of assessment |
| Risk of bias in recall of falls | Low risk | Quote: "... each participant received a set of twelve 1‐month calendars. They were asked to record each fall they experienced on the calendar for the current month. …asked to return each calendar to study staff at the end of the month. Participants who did not return a calendar by the 10th of the following month were called by study personnel to obtain the required information by phone." |
Brown 2002.
| Study characteristics | ||
| Methods | RCT (individually randomised, but 6 clusters containing couples at same address) | |
| Participants | Setting: Perth, Western Australia N = 149 Sample: men and women recruited by press releases in 11 newspapers and information brochures distributed to organisations, GPs, etc (79% women) Age (years): N = 101 aged 75 to 84, N = 48 aged 85 to 94 Inclusion criteria: age ≥ 75; community‐living; independent in basic ADL; able to walk 20 m without personal assistance Exclusion criteria: cognitive impairment (MMSE ≤ 24); various conditions, e.g. angina, claudication, cerebrovascular disease, low or high blood pressure, major systemic disease, mental illness | |
| Interventions | 1. Exercise intervention to improve cardiovascular endurance, general muscle performance, balance, co‐ordination and flexibility. 60 min, 2 x per wk for 16 wks (32 hours). 2. Social intervention for 13 wks involving presentations of travel slides and videos by participants 3. Control: no intervention | |
| Outcomes | 1. Number of participants falling | |
| Duration of the study | 14 months | |
| Notes | ||
| Risk of bias | ||
| Bias | Authors' judgement | Support for judgement |
| Random sequence generation (selection bias) | Low risk | Quote: "randomised into one of three groups using a table of random numbers". |
| Allocation concealment (selection bias) | Low risk | Randomised into one of 3 groups "by a physiotherapist uninvolved in the study." |
| Blinding of participants and personnel (performance bias) All outcomes | Unclear risk | Participants and personnel not blind to allocated group but impact of non‐blinding unclear |
| Blinding of outcome assessment (detection bias) Falls and fallers | Low risk | Falls reported by participants who were aware of their group allocation, but outcome assessors were blinded |
| Incomplete outcome data (attrition bias) Fallers | Low risk | SeeAppendix 3 for method of assessment |
| Risk of bias in recall of falls | Low risk | Participants provided details of falls in monthly report sheet returned in reply paid addressed envelopes |
Buchner 1997a.
| Study characteristics | ||
| Methods | RCT | |
| Participants | Setting: Seattle, USA N = 105 Sample: random sample of HMO members (FICSIT intervention groups only) (51% women) Age (years): mean 75 Inclusion criteria: aged 68 to 85; unable to do 8‐step tandem gait test without errors; below 50th percentile in knee extensor strength for height and weight Exclusion criteria: active cardiovascular, pulmonary, vestibular, and bone disease; positive cardiac stress test; body weight > 180% ideal; major psychiatric illness; active metabolic disease; chronic anaemia; amputation; chronic neurological or muscle disease; inability to walk; dependency in eating, dressing, transfer or bathing; terminal illness; inability to speak English or complete written forms | |
| Interventions | Randomised into 7 groups: 6 intervention groups (3 FICSIT trial, 3 MoveIT trial), and 1 control group. Only FICSIT trial and control groups included in this review. Supervised exercise classes 1 hour, 3 x per wk for 24 to 26 wks followed by unsupervised exercise 1. 6 months endurance training (ET) (stationary cycles) with arms and legs propelling wheel 2. 6 months strength training (ST) classes (using weight machines for resistance exercises for upper and lower body) 3. 6 months ST plus ET 4. Control: usual activity levels but "allowed to exercise after 6 months" Exercise sessions started with a 10 to 15‐minute warm‐up and ended with a 5 to 10‐minute cool down |
|
| Outcomes | 1. Rate of falls
2. Number of people falling
3. Number of people with adverse effects "A priori decision" to report fall outcomes for "any exercise" (all 3 exercise groups combined) compared with control group |
|
| Duration of the study | Maximum 25 months (median 18 months) | |
| Notes | Seattle FICSIT trial. Only 1.3% of original sample randomised. Falls not primary outcome. Other outcomes assessed at end of intervention (6 months) then "control group allowed to exercise after 6 months" (7/30 participants did). Cost analysis reported in primary reference. | |
| Risk of bias | ||
| Bias | Authors' judgement | Support for judgement |
| Random sequence generation (selection bias) | Low risk | Randomised "using a variation of randomly permuted blocks." |
| Allocation concealment (selection bias) | Unclear risk | Insufficient information to permit judgement |
| Blinding of participants and personnel (performance bias) All outcomes | Unclear risk | Participants and personnel not blind to allocated group but impact of non‐blinding unclear |
| Blinding of outcome assessment (detection bias) Falls and fallers | Unclear risk | Falls reported by participants who were aware of their group allocation. Quote: "Most study outcomes were measured by blinded examiners..." but unclear whether this applies to personnel carrying out telephone follow‐up of falls. |
| Incomplete outcome data (attrition bias) Falls | Low risk | SeeAppendix 3 for method of assessment |
| Incomplete outcome data (attrition bias) Fallers | Low risk | SeeAppendix 3 for method of assessment |
| Risk of bias in recall of falls | Low risk | Falls reported immediately by mail, also monthly postcard return; telephone follow‐up if no postcard received |
Bunout 2005.
| Study characteristics | ||
| Methods | RCT | |
| Participants | Setting: Chile N = 298 Sample: men and women (71% women) Age (years): mean 75 (SD 5) Inclusion criteria: "elderly subjects" consenting to participate; able to reach community centre Exclusion criteria: severe disabling condition; cognitive impairment (MMSE < 20) | |
| Interventions | 1. Exercise class: 1 hour, 2 x per wk, for 1 year, moderate‐intensity resistance exercise training (functional weight bearing exercises, exercises with TheraBands and walking (see Appendix 2 of supplementary data on journal website for details) 2. Control: no intervention | |
| Outcomes | 1. Rate of falls 2. Number of people falling Other outcomes reported but not included in this review |
|
| Duration of the study | For the 1 year of intervention | |
| Notes | Journal website for supplementary data www.ageing.oupjournals.org. Additional data obtained from author. | |
| Risk of bias | ||
| Bias | Authors' judgement | Support for judgement |
| Random sequence generation (selection bias) | Low risk | Randomised using computer‐generated random number table |
| Allocation concealment (selection bias) | Unclear risk | Insufficient information to permit judgement |
| Blinding of participants and personnel (performance bias) All outcomes | Unclear risk | Participants and personnel not blind to allocated group but impact of non‐blinding unclear |
| Blinding of outcome assessment (detection bias) Falls and fallers | Unclear risk | Falls reported at follow‐up clinics by participants who were aware of their group allocation. Blinding of researchers at follow‐up not reported. |
| Incomplete outcome data (attrition bias) Falls | Low risk | SeeAppendix 3 for method of assessment |
| Incomplete outcome data (attrition bias) Fallers | High risk | SeeAppendix 3 for method of assessment |
| Risk of bias in recall of falls | Unclear risk | Interval recall. Falls ascertained at monthly outpatient clinic or by telephone. |
Campbell 1997.
| Study characteristics | ||
| Methods | RCT | |
| Participants | Setting: Dunedin, New Zealand N = 233 Sample: women identified from general practice registers Age (years): mean 84.1 (SD 3.1) Inclusion criteria: at least 80 years old; community‐living Exclusion criteria: cognitive impairment; not ambulatory in own residence; already receiving physiotherapy | |
| Interventions | Baseline health and physical assessment for both groups. 1. 1‐hour visits by physiotherapist x 4 in first 2 months to prescribe home‐based individualised exercise and walking programme. Exercise, 30 min, 3 x per wk plus walk outside home 3 x per wk. Encouraged to continue for 1 year. Regular phone contact to maintain motivation after first 2 months. 2. Control: social visit by research nurse x 4 in first 2 months. Regular phone contact. | |
| Outcomes | 1. Rate of falls 2. Number of people falling | |
| Duration of the study | 24 months but 12‐month data used in analyses | |
| Notes | Otago Exercise Programme manual can be obtained from www.cdc.gov/HomeandRecreationalSafety/Falls/compendium/1.2_otago.html. Cost‐effectiveness analysis reported (Robertson 2001c). | |
| Risk of bias | ||
| Bias | Authors' judgement | Support for judgement |
| Random sequence generation (selection bias) | Low risk | Allocation schedule developed using computer‐generated numbers |
| Allocation concealment (selection bias) | Low risk | Assignment by independent person off site |
| Blinding of participants and personnel (performance bias) All outcomes | Unclear risk | Participants and personnel not blind to allocated group but impact of non‐blinding unclear |
| Blinding of outcome assessment (detection bias) Falls and fallers | High risk | Falls reported by participants who were aware of group allocation. Blinding of adjudicator reported, but researcher making telephone contact was aware of group allocation as she also did social visits (personal communication). |
| Incomplete outcome data (attrition bias) Falls | Low risk | SeeAppendix 3 for method of assessment |
| Incomplete outcome data (attrition bias) Fallers | Low risk | SeeAppendix 3 for method of assessment |
| Risk of bias in recall of falls | Low risk | Falls recorded daily on postcard calendars, mail registration monthly by postcard, telephone follow‐up |
Campbell 1999.
| Study characteristics | ||
| Methods | RCT (2 x 2 factorial design) | |
| Participants | Setting: community. Dunedin, New Zealand N = 93 Sample: identified from general practice registers (76% women) Age (years): mean 74.7 (SD 7.2) Inclusion criteria: at least 65 years old; currently taking a benzodiazepine, any other hypnotic, or any antidepressant or major tranquilliser; ambulatory in own residence; not receiving physiotherapy; thought by GP to benefit from psychotropic medication withdrawal Exclusion criteria: cognitive impairment | |
| Interventions | Baseline assessment
1. Gradual withdrawal of psychotropic medication (placebo substitution) over 14 wk period plus home‐based exercise programme
2. Psychotropic medication withdrawal (placebo substitution) with no exercise programme
3. No change in psychotropic medication plus exercise programme
4. No change in psychotropic medication, no exercise programme Exercise programme: 1‐hour physiotherapist visits 4 x in first 2 months to prescribe home‐based individualised exercises (muscle strengthening and balance retraining exercises 30 min, 3 x per wk) and walking 2 x per wk Regular phone contact to maintain motivation Study capsules created by grinding tablets and packing into gelatin capsules. Capsules containing inert and active ingredients looked and tasted the same. |
|
| Outcomes | 1. Rate of falls 2. Number of people falling | |
| Duration of the study | 44 wks | |
| Notes | Only 19% randomised. Psychotropic medications recorded 1 month after completion of study. 8 of the 17 who had taken the placebo for 44 wks had restarted 1 month after end of study. Otago Exercise Programme manual can be obtained from www.cdc.gov/HomeandRecreationalSafety/Falls/compendium/1.2_otago.html. Cost‐effectiveness analysis reported (Robertson 2001d). | |
| Risk of bias | ||
| Bias | Authors' judgement | Support for judgement |
| Random sequence generation (selection bias) | Low risk | Allocation schedule developed using computer‐generated numbers |
| Allocation concealment (selection bias) | Low risk | Assignment by independent person off site |
| Blinding of participants and personnel (performance bias) All outcomes | Low risk | Participants and personnel blinded to psychotropic medication dose. Although participants and PT aware of which physiotherapy intervention they were receiving this is unlikely to have introduced performance bias. |
| Blinding of outcome assessment (detection bias) Falls and fallers | Low risk | Falls reported by participants who were aware of exercise allocation, but not medication withdrawal. Investigator confirming fall events blind to group allocation. |
| Incomplete outcome data (attrition bias) Falls | High risk | SeeAppendix 3 for method of assessment |
| Incomplete outcome data (attrition bias) Fallers | Low risk | SeeAppendix 3 for method of assessment |
| Risk of bias in recall of falls | Low risk | Falls recorded daily on postcard calendars, mail registration monthly by postcard, telephone follow‐up |
Campbell 2005.
| Study characteristics | ||
| Methods | RCT (2 x 2 factorial design) | |
| Participants | Setting: New Zealand N = 391 Sample: men and women with severe visual impairment (visual acuity 6/24 or worse) identified in blind register, university and hospital outpatient clinics, and private ophthalmology practice (68% women) Age (years): mean 83.6 (SD 4.8), range 75 to 96 Inclusion criteria: vision worse than 6/24 in better eye; age ≥ 75 years Exclusion criteria: unable to walk around home | |
| Interventions | 1. Home safety programme 2. Otago Exercise Programme plus vitamin D supplements 3. Both of the above 4. Control: 2 x 1‐hour social visits during the first 6 months of the trial | |
| Outcomes | 1. Rate of falls 2. Number of people falling | |
| Duration of the study | 1 year | |
| Notes | Otago Exercise Programme manual can be obtained from www.cdc.gov/HomeandRecreationalSafety/Falls/compendium/1.2_otago.html. Cost‐effectiveness analysis reported in the primary reference. | |
| Risk of bias | ||
| Bias | Authors' judgement | Support for judgement |
| Random sequence generation (selection bias) | Low risk | Computer‐generated random numbers |
| Allocation concealment (selection bias) | Low risk | Schedule held by independent person at separate site, telephone access |
| Blinding of participants and personnel (performance bias) All outcomes | Unclear risk | Participants and personnel not blind to allocated group but impact of non‐blinding unclear |
| Blinding of outcome assessment (detection bias) Falls and fallers | Low risk | Falls reported by participants who were aware of their group allocation. Phoned by independent assessor blind to allocation. Person classifying fall events also blind to allocation. |
| Incomplete outcome data (attrition bias) Falls | Low risk | SeeAppendix 3 for method of assessment |
| Incomplete outcome data (attrition bias) Fallers | Low risk | SeeAppendix 3 for method of assessment |
| Risk of bias in recall of falls | Low risk | Prospective. Falls recorded on daily on monthly pre‐paid postcard calendars, telephone follow‐up |
Carpenter 1990.
| Study characteristics | ||
| Methods | RCT (individually randomised, but small number of clusters as husbands allocated to same group) | |
| Participants | Setting: Andover, United Kingdom N = 539 Sample: women and men recruited from patient lists of 2 general medical practices. The sample represents 89.5% of those in the age group in the participating practices (65% women) Age (years): ≥ 75; 23 men and 49 women > 85 Inclusion criteria: aged ≥ 75; living in Andover area Exclusion criteria: living in residential care | |
| Interventions | 1. Visit by trained volunteers for dependency surveillance using Winchester disability rating scale. The intervention was stratified by degree of disability on the entry evaluation. For those with no disability, the visit was every 6 months; for those with disability, 3 months. Scores compared with previous assessment and referral to GP if score increased by 5 or more. 2. Control: no disability surveillance between initial and final evaluation | |
| Outcomes | 1. Rate of falls (in each group in the month before the final interview at 3 years) Other outcomes reported but not included in this review |
|
| Duration of the study | 3 years | |
| Notes | ||
| Risk of bias | ||
| Bias | Authors' judgement | Support for judgement |
| Random sequence generation (selection bias) | Low risk | Randomised by random number tables |
| Allocation concealment (selection bias) | Unclear risk | Insufficient information to permit judgement |
| Blinding of participants and personnel (performance bias) All outcomes | Unclear risk | Participants and personnel no blind to allocated group, but impact of non‐blinding unclear |
| Blinding of outcome assessment (detection bias) Falls and fallers | Unclear risk | Recollection of falls in the preceding month was ascertained at final interview in both groups by an assessor. Blinding not described. |
| Incomplete outcome data (attrition bias) Falls | High risk | SeeAppendix 3 for method of assessment |
| Risk of bias in recall of falls | Unclear risk | Retrospective recall, but over 1‐month period |
Carter 1997.
| Study characteristics | ||
| Methods | RCT | |
| Participants | Setting: Hunter Valley, Australia N = 657 Sample: men and women identified by 37 general practitioners as meeting inclusion criteria (30% women) Age (years): ≥ 70 Inclusion criteria: aged ≥ 70; able to speak and understand English; community‐dwelling; living independently Exclusion criteria: psychiatric disturbance affecting comprehension of the aims of the study | |
| Interventions | 1. Brief feedback on home safety plus pamphlets on home safety and medication use (low‐intensity intervention) 2. Action plan for home safety plus medication review (high‐intensity intervention) 3. Control: no intervention during study period but intervention after the end of the study period | |
| Outcomes | 1. Number of people falling (during previous month at 3, 6, and 12 months) | |
| Duration of the study | 1 year | |
| Notes | Unpublished study | |
| Risk of bias | ||
| Bias | Authors' judgement | Support for judgement |
| Random sequence generation (selection bias) | Low risk | Random number generator |
| Allocation concealment (selection bias) | Unclear risk | Insufficient information to permit judgement |
| Blinding of participants and personnel (performance bias) All outcomes | Unclear risk | Participants and personnel not blind to allocated group but impact of non‐blinding unclear |
| Blinding of outcome assessment (detection bias) Falls and fallers | Unclear risk | Self reported falls and blinding of personnel carrying out structured interview at 3, 6, and 12 months not described |
| Incomplete outcome data (attrition bias) Fallers | High risk | SeeAppendix 3 for method of assessment |
| Risk of bias in recall of falls | High risk | 4‐week retrospective diary used by participants prior to structured interview at 3, 6, and 12 months |
Carter 2002.
| Study characteristics | ||
| Methods | RCT | |
| Participants | Setting: Vancouver, Canada N = 93 Subjects: community‐dwelling osteoporotic women Age (years): mean 69 (SD 3) Inclusion criteria: aged 65 to 75 years; residents of greater Vancouver; osteoporotic (based on BMD) Exclusion criteria: < 5 years post menopause; weighed > 130% ideal body weight; other contraindications to exercising; already doing > 8 hours/wk moderate to hard exercise; planning to be out of city > 4 wk during 20 wk programme | |
| Interventions | 1. Exercise class (Osteofit) for 40 min, 2 x per wk, for 20 wks in community centres. Classes of 12 per instructor. 8 to 16 strengthening and stretching exercises using Theraband elastic bands and small free weights. Bimonthly social seminar. 2. Control: usual routine activities and bimonthly social seminar separate from intervention group | |
| Outcomes | 1. Rate of falls Other outcomes reported but not included in this review |
|
| Duration of the study | 20 wks | |
| Notes | ||
| Risk of bias | ||
| Bias | Authors' judgement | Support for judgement |
| Random sequence generation (selection bias) | Low risk | Randomised by computer‐generated programme |
| Allocation concealment (selection bias) | Unclear risk | Insufficient information to permit judgement |
| Blinding of participants and personnel (performance bias) All outcomes | Unclear risk | Participants and personnel not blind to allocated group but impact of non‐blinding unclear |
| Blinding of outcome assessment (detection bias) Falls and fallers | Low risk | Quote: "All data were collected by trained researchers blinded to group assignment." |
| Incomplete outcome data (attrition bias) Falls | Low risk | SeeAppendix 3 for method of assessment |
| Risk of bias in recall of falls | Low risk | Falls recorded in falls calendars returned monthly |
Cerny 1998.
| Study characteristics | ||
| Methods | RCT (individually randomised but some clusters, e.g. couples or 2 ladies where one was dependent on the other for transport) | |
| Participants | Setting: California, USA N = 28 Sample: community‐dwelling "well elderly" (proportion of women not stated) Age (years): mean 71 (SD 4) Inclusion criteria: none described Exclusion criteria: none described | |
| Interventions | 1. Exercise programme of progressive resistance, stretching, aerobic and balance exercises, and brisk walking over various terrains for 1.5 hours, 3 x per wk, for 6 months 2. Control: no intervention | |
| Outcomes | 1. Number of people falling Other outcomes reported but not included in this review. Falls a secondary outcome |
|
| Duration of the study | 6 months | |
| Notes | Contact with lead author but no full paper or report prepared | |
| Risk of bias | ||
| Bias | Authors' judgement | Support for judgement |
| Random sequence generation (selection bias) | Low risk | Randomised by coin toss. Individually randomised but some clusters, e.g. couples or 2 ladies where one was dependent on the other for transport (information from author). |
| Allocation concealment (selection bias) | High risk | Coin toss on site |
| Blinding of participants and personnel (performance bias) All outcomes | Unclear risk | Participants and personnel not blind to allocated group but impact of non‐blinding unclear |
| Blinding of outcome assessment (detection bias) Falls and fallers | Unclear risk | Reported only in abstract. Insufficient information to permit judgement. |
| Incomplete outcome data (attrition bias) Fallers | Low risk | SeeAppendix 3 for method of assessment |
| Risk of bias in recall of falls | High risk | Assume retrospective recall and 3 and 6 months assessment |
Ciaschini 2009.
| Study characteristics | ||
| Methods | RCT | |
| Participants | Setting: Algoma District (including Sault Ste Marie), Ontario, Canada N = 201 Sample: community‐dwelling people at risk of a fall‐related fracture (94% women) Age (years): mean 72 (SD 8.4) Inclusion criteria: community‐dwelling; > 55 years old; able to consent; at risk of fracture (non‐pathological fracture in past year with T‐score < 2.0; attended ED with a fall, self referred, or referred by health professional and at high risk of falls (TUG test > 14 sec)) Exclusion criteria: if already receiving therapy for osteoporosis as per Osteoporosis Canada guidelines | |
| Interventions | 1. Multifactorial falls risk assessment by nurse + counselling and referral for PT and OT and interventions, plus recommendations for osteoporosis therapy targeting physicians and their patients 2. Control: usual care until 6 months, then same as intervention group | |
| Outcomes | 1. Number of people falling 2. Number of sustaining a fracture Other outcomes reported but not included in this review: primary outcome implementation of appropriate falls risk management by 6 months | |
| Duration of the study | 6 months | |
| Notes | 12‐month study but 6‐month data used in review analysis as control group participants were offered the intervention after 6 months | |
| Risk of bias | ||
| Bias | Authors' judgement | Support for judgement |
| Random sequence generation (selection bias) | Low risk | Quote: "Eligible patients were randomized using a computer generated randomization scheme under supervision of the study biostatistician, into an immediate intervention protocol (IP) group or to a delayed intervention protocol (DP) group". |
| Allocation concealment (selection bias) | Unclear risk | Insufficient information to permit judgement (see above) |
| Blinding of participants and personnel (performance bias) All outcomes | Unclear risk | Quote: "The patients, treating physicians and outcomes collectors could not be blinded to the intervention status." but impact of non‐blinding unclear. |
| Blinding of outcome assessment (detection bias) Falls and fallers | High risk | Outcome collection stated not to be blind to allocation |
| Blinding of outcome assessment (detection bias) Fractures | Low risk | Probably low risk as fractures ascertained in both groups from patient records |
| Incomplete outcome data (attrition bias) Fallers | Low risk | SeeAppendix 3 for method of assessment |
| Risk of bias in recall of falls | Low risk | Quote: "Falls and falls‐related injuries were obtained from electronic medical records as well as patient diaries." Quote: "the number of falls and fractures as recorded in monthly patient diaries. Followup telephone calls every 3 months were used to obtain this data and completed patient diaries were mailed to the investigators at study end." |
Clemson 2004.
| Study characteristics | ||
| Methods | RCT. Randomised in blocks of 4 stratified by sex and number of falls in previous 12 months | |
| Participants | Setting: Sydney, Australia N = 310 Sample: volunteer community‐dwelling men and women recruited by various strategies (74% women) Age (years): mean 78 (SD 5) Inclusion criteria: aged ≥ 70; community‐dwelling; fallen in past year or felt themselves to be at risk of falling. Exclusion criteria: dementia (> 3 errors on Short Portable Mental Status Questionnaire); homebound; unable to independently leave home; unable to speak English | |
| Interventions | Both groups received baseline assessment at home before randomisation 1. Stepping On programme. Multifaceted small‐group (N = 12) learning environment to encourage self efficacy, behaviour change, and reduce falls using decision‐making theory and a variety of learning strategies. Facilitated by OT. 2 hours per wk, for 7 wks; taught exercises and practised in classes. OT home visit within 6 wks of final programme session; booster session 3 months after final session. 2. Control: at least 2 social visits from student OT with no discussion of falls or fall prevention |
|
| Outcomes | 1. Rate of falls 2. Number of people falling | |
| Duration of the study | 14 months | |
| Notes | Details of programme in Appendix A of Clemson 2004: risk appraisal, exercise, moving safely, home hazards, community safety, footwear, vision and falls, vitamin D, hip protectors, medication management, mobility mastery, review and plan | |
| Risk of bias | ||
| Bias | Authors' judgement | Support for judgement |
| Random sequence generation (selection bias) | Unclear risk | Quote: "Randomised by researcher not involved in subject screening or assessment". Method not described. |
| Allocation concealment (selection bias) | Unclear risk | Insufficient information to permit judgement |
| Blinding of participants and personnel (performance bias) All outcomes | Unclear risk | Study participants and personnel not blinded, but staff visiting control group instructed not to discuss falls or fall prevention |
| Blinding of outcome assessment (detection bias) Falls and fallers | Unclear risk | All participants used monthly calendar; telephone contact if not returned in 2 weeks. Blinding of study personnel recording data from the calendars not described. |
| Incomplete outcome data (attrition bias) Falls | Unclear risk | SeeAppendix 3 for method of assessment. Insufficient information to permit judgement. |
| Incomplete outcome data (attrition bias) Fallers | Low risk | SeeAppendix 3 for method of assessment |
| Risk of bias in recall of falls | Low risk | Prospective. Monthly falls postcard calendar. |
Clemson 2010.
| Study characteristics | ||
| Methods | RCT | |
| Participants | Setting: Sydney, Australia N = 34 Sample: volunteer community‐dwelling men and women recruited by various strategies (47% women) Age (years): mean 82 (SD 5.9) Inclusion criteria: aged > 70 years; ≥ 2 falls or an injurious fall in previous year Exclusion criteria: cognitive impairment; no conversational English; unable to ambulate independently; resident in nursing home or hostel; unstable or terminal illness that would preclude planned exercises; neurological conditions, e.g. Parkinson's disease | |
| Interventions | 1. LiFE (Lifestyle approach to reducing Falls through Exercise) programme (progressive balance and strength training embedded in daily life activities). Taught in 5 home visits + 2 booster visits over 3 months + 2 phone calls. Included evaluation of functional balance and strength, profile of current activities, taught LiFE principles and given safety advice relating to activities, planning of activities, and goal setting. 2. Control: no intervention | |
| Outcomes | 1. Rate of falls 2. Number of people falling Other outcomes reported but not included in this review | |
| Duration of the study | 6 months | |
| Notes | ||
| Risk of bias | ||
| Bias | Authors' judgement | Support for judgement |
| Random sequence generation (selection bias) | Low risk | Quote: "Randomisation was conducted … using a random numbers table" |
| Allocation concealment (selection bias) | Low risk | Quote: "Randomisation was conducted by an investigator not involved in assessment or intervention …" "Once baseline assessments were completed by the research assistant (RA), participants were then allocated in order of completion from the generated lists by the blinded investigator." |
| Blinding of participants and personnel (performance bias) All outcomes | Unclear risk | Participants and personnel carrying out the intervention were not blind to allocated groups. Unclear whether this could result in performance bias. |
| Blinding of outcome assessment (detection bias) Falls and fallers | Unclear risk | Quote: "An RA who was not involved in the intervention and masked to the group allocation conducted all assessments. Falls surveillance was by daily calendar, which participants mailed monthly, using pre‐addressed envelopes to the RA. An investigator telephoned any participant who failed to return the calendar or who reported a fall." Unclear whether the investigator carrying out the telephone calls was blind to group allocation. |
| Incomplete outcome data (attrition bias) Falls | Unclear risk | SeeAppendix 3 for method of assessment. Insufficient information to permit judgement. |
| Incomplete outcome data (attrition bias) Fallers | Low risk | SeeAppendix 3 for method of assessment |
| Risk of bias in recall of falls | Low risk | Quote: "Falls surveillance was by daily calendar, which participants mailed monthly, using pre‐addressed envelopes …" |
Close 1999.
| Study characteristics | ||
| Methods | RCT | |
| Participants | Setting: London, United Kingdom N = 397 Sample: community‐dwelling individuals presenting at A&E after a fall (68% women). Admitted patients not recruited until discharge Age (years): mean 78.2 (SD 7.5) Inclusion criteria: aged ≥ 65; history of falling Exclusion criteria: cognitive impairment (AMT < 7) and no regular carer (for informed consent reasons); speaking little or no English; not living locally | |
| Interventions | 1. Medical and occupational therapy assessments and interventions Medical assessment to identify primary cause of fall and other risk factors present (general examination and visual acuity, balance, cognition, affect, medications). Intervention and referral as required. Home visit by occupational therapist (functional assessment and environmental hazards). Advice, equipment, and referrals as required. 2. Control: usual care only | |
| Outcomes | 1. Rate of falls
2. Number of people falling Other outcomes reported but not included in this review |
|
| Duration of the study | 1 year | |
| Notes | Cost analysis reported in Close 2000 | |
| Risk of bias | ||
| Bias | Authors' judgement | Support for judgement |
| Random sequence generation (selection bias) | Low risk | Randomised by random numbers table |
| Allocation concealment (selection bias) | Low risk | List held independently of the investigators |
| Blinding of participants and personnel (performance bias) All outcomes | Unclear risk | Participants and personnel not blind to allocated group but impact of non‐blinding unclear |
| Blinding of outcome assessment (detection bias) Falls and fallers | Unclear risk | All participants received falls diary and 4‐monthly postal questionnaire. Blinding of personnel recording the questionnaires not described. |
| Blinding of outcome assessment (detection bias) Fractures | Unclear risk | Self reported and blinding of personnel recording the questionnaires not described, confirmation of fractures not described |
| Incomplete outcome data (attrition bias) Falls | High risk | SeeAppendix 3 for method of assessment |
| Incomplete outcome data (attrition bias) Fallers | High risk | SeeAppendix 3 for method of assessment |
| Risk of bias in recall of falls | Low risk | Quote: "Each participant was given a “falls diary” with 12 monthly sheets to assist with the recall of further falls." Quote: "Follow‐up was done by postal questionnaire, which was sent to all participants every 4 months for 1 year after the fall. Information about subsequent falls, fall‐related injury, and details of doctor and hospital visits or admissions and degree of function were requested. |
Coleman 1999.
| Study characteristics | ||
| Methods | RCT (cluster‐randomised by physician practice) | |
| Participants | Setting: HMO members, Washington, USA N = 169 Sample: community‐dwelling men and women in 9 physician practices in an ambulatory clinic (49% women) Age (years): mean 77 Inclusion criteria: aged ≥ 65; high risk of being hospitalised or of developing functional decline; community‐dwelling Exclusion criteria: living in nursing home; terminal illness; moderate to severe dementia or "too ill" (physician's judgement) | |
| Interventions | 1. Half‐day Chronic Care Clinics every 3 to 4 months in 5 practices focusing on planning chronic disease management (physician and nurse); reducing polypharmacy and high‐risk medications (pharmacist); patient self management/support group 2. Control: usual care (4 practices) | |
| Outcomes | 1. Number of people falling | |
| Duration of the study | 24 months (data at 12 months used in analysis) | |
| Notes | Cost analysis reported in primary reference | |
| Risk of bias | ||
| Bias | Authors' judgement | Support for judgement |
| Random sequence generation (selection bias) | Unclear risk | Quote: "randomized using simple randomization" |
| Allocation concealment (selection bias) | High risk | Cluster‐randomised |
| Blinding of participants and personnel (performance bias) All outcomes | Unclear risk | Participants and personnel not blind to allocated group but impact of non‐blinding unclear |
| Blinding of outcome assessment (detection bias) Falls and fallers | Low risk | Falls were recorded by participants on a standardised questionnaire at 12 and 24 months. Chart abstraction conducted by a member of the study team and an additional reviewer blinded to study group. |
| Incomplete outcome data (attrition bias) Fallers | Low risk | SeeAppendix 3 for method of assessment |
| Risk of bias in recall of falls | High risk | Retrospective recall. Quote: "Falls were assessed using a standardized questionnaire" at 12 and 24 months. |
Comans 2010.
| Study characteristics | ||
| Methods | RCT | |
| Participants | Setting: Metro South Community Rehabilitation Service, Brisbane, Australia N = 107 Sample: recruited from people referred to Metro South Community Rehabilitation Service from 3 local EDs following presentation for a fall, or from local GPs (66% women) Age (years): mean 78.9 (SD 7.7) Inclusion criteria: community‐dwelling; age > 60 years; referred with history of a fall (see above) and/or declining mobility, function, or physical conditioning; able to complete TUG test Exclusion criteria: living in high‐level care; non‐ambulant; assessed by OP or PT as unable to participate due to cognitive and/or physical function | |
| Interventions | 1. Centre‐based (group) intervention: 2 hours, 1 x per wk, for 8 wks. Group exercises (modified Tai Chi warm‐up, balance exercises, indoors walking circuit, lower limb strengthening exercises (30 min); education and discussion group covering falls prevention, promoting physical activity, National Nutritional Guidelines, relaxation, stress management, future planning; upper limb strengthening and functional activities (30 min) 2. Home‐based (individual) intervention: 1 x per wk, for 8 wks. Home visits by Community Rehabilitation Service (CRS) staff 45 to 60 min, 1 to 2 x wk, for 8 wks. Visits include 30 to 45 min personalised exercises and education modules as for the group programme but outdoors walking and ADL, e.g. hanging out washing for upper limb functional activities Both groups received OT home safety recommendations and a tailored balance‐specific home exercise programme (10 min, 2 x per day) |
|
| Outcomes | 1. Rate of falls 2. Number of fallers Other outcomes reported but not included in this review | |
| Duration of the study | 6 months | |
| Notes | ||
| Risk of bias | ||
| Bias | Authors' judgement | Support for judgement |
| Random sequence generation (selection bias) | Low risk | A list of computer‐generated random numbers was used to allocate subjects to home or centre‐based treatment |
| Allocation concealment (selection bias) | Low risk | Quote: "The randomization sequence was placed into sealed, opaque numbered envelopes by administration staff not connected with research. Following consent, the assessing therapist contacted administration staff who opened the next envelope in the sequence and informed the therapist of the participant's group allocation." |
| Blinding of participants and personnel (performance bias) All outcomes | Low risk | Although participants and personnel carrying out the intervention were not blind to allocated groups this is unlikely to have introduced bias as both groups received a similar intervention, but in different settings |
| Blinding of outcome assessment (detection bias) Falls and fallers | Low risk | Quote: "Participants were followed up by monthly telephone contact for falls data and reassessed 6 months after initial randomization again by a blinded assessor." |
| Incomplete outcome data (attrition bias) Falls | High risk | SeeAppendix 3 for method of assessment |
| Incomplete outcome data (attrition bias) Fallers | High risk | SeeAppendix 3 for method of assessment |
| Risk of bias in recall of falls | Unclear risk | No mention of concurrent recording of falls by participants Quote: "Falls after the intervention commenced were collected monthly by telephone contact and at interview at the 8‐week and 6‐month follow‐up assessments." |
Conroy 2010.
| Study characteristics | ||
| Methods | RCT (multicentre) | |
| Participants | Setting: Nottingham and Derbyshire, United Kingdom N = 364 Sample: community‐dwelling people registered with participating GPs (N = 8) (60% women) Age (years): mean 78.6 (SD 5.7), range 70 to 101 Inclusion criteria: > 70 years; identified as being at high risk of falling by a postal screening questionnaire Exclusion criteria: living in care home; receiving end of life care; already receiving a falls prevention programme; unwilling or unable to attend falls prevention programme; unable to provide informed consent | |
| Interventions | 1. Screening questionnaire, information leaflets, and invitation to attend the day hospital for multifactorial assessment and any subsequent intervention 2. Control: screening questionnaire, information leaflets, and usual care from primary care service until outcome data collected, then offered day‐hospital intervention | |
| Outcomes | 1. Rate of falls 2. Number of people falling 3. Number sustaining a fracture |
|
| Duration of the study | 1 year | |
| Notes | Cost‐effectiveness analysis reported in Irvine 2010 | |
| Risk of bias | ||
| Bias | Authors' judgement | Support for judgement |
| Random sequence generation (selection bias) | Low risk | Quote: "The randomisation list was computer generated using a random block size to maximise allocation concealment" |
| Allocation concealment (selection bias) | Low risk | Quote: "participants were allocated into the intervention or control arm by research assistants using an internet based randomization service" |
| Blinding of participants and personnel (performance bias) All outcomes | Unclear risk | Quote: "Owing to the nature of the intervention, it was not possible to blind participants or researchers to allocation" but impact of non‐blinding unclear. |
| Blinding of outcome assessment (detection bias) Falls and fallers | Low risk | Outcome assessor stated to be blinded. Quote: "Participants will be contacted via telephone by the "blinded" assessor at the end of each month to encourage return of the diary." (protocol paper) |
| Blinding of outcome assessment (detection bias) Fractures | Unclear risk | Not completely clear that fractures were recorded in diaries in the same way as falls but seems to be the case. Quote: "Participants will be asked to record falls in the diary, along with the outcome (saw GP, phoned ambulance, sent to hospital, injuries)." Contacted by "blinded" assessor but no confirmation of fractures from medical records. |
| Incomplete outcome data (attrition bias) Falls | Low risk | SeeAppendix 3 for method of assessment |
| Incomplete outcome data (attrition bias) Fallers | Low risk | SeeAppendix 3 for method of assessment |
| Risk of bias in recall of falls | Low risk | Quote: "… ascertained using prospective, participant‐completed monthly falls diaries, mailed to the research team at the end of every month." |
Cornillon 2002.
| Study characteristics | ||
| Methods | RCT | |
| Participants | Setting: St Étienne, France N = 303 Subjects: community‐dwelling and independent in ADL (83% women) Age (years): mean 71 Inclusion criteria: aged over 65; living at home; ADL independent; consented Exclusion criteria: cognitively impaired (MMSE < 20); obvious disorder of walking or balance | |
| Interventions | 1. Information on fall risk, and balance and sensory training in groups of 10 to 16. One session per wk, for 8 wks. Session started with foot and ankle warm‐up (walking on tip toe and on heels etc), walking following verbal orders, walking bare foot on different surfaces, standing on one leg with eyes open and shut, practising getting up from the floor 2. Control: normal activities | |
| Outcomes | 1. Rate of falls 2. Number of people falling | |
| Duration of the study | 1 year | |
| Notes | ||
| Risk of bias | ||
| Bias | Authors' judgement | Support for judgement |
| Random sequence generation (selection bias) | Low risk | Randomised by random number tables |
| Allocation concealment (selection bias) | Unclear risk | Insufficient information to permit judgement |
| Blinding of participants and personnel (performance bias) All outcomes | Unclear risk | Participants and personnel not blind to allocated group but impact of non‐blinding unclear |
| Blinding of outcome assessment (detection bias) Falls and fallers | Unclear risk | Falls recorded on 6‐monthly falls calendars. No telephone contact described. Blinding of study personnel recording data from the calendars not described. |
| Incomplete outcome data (attrition bias) Falls | Low risk | SeeAppendix 3 for method of assessment |
| Incomplete outcome data (attrition bias) Fallers | Low risk | SeeAppendix 3 for method of assessment |
| Risk of bias in recall of falls | Low risk | Prospective. Falls recorded on 6 monthly falls calendars. |
Cumming 1999.
| Study characteristics | ||
| Methods | RCT (randomised consent design) | |
| Participants | Setting: Sydney, Australia N = 530 Sample: community‐dwelling people recruited in hospital wards, clinics, and day care centres (57% women) Age (years): mean 77 (SD 7.2) Inclusion criteria: aged ≥ 65; community‐dwelling within study area Exclusion criteria: cognitively impaired and not living with someone who could give informed consent and report falls; if OT home visit already planned | |
| Interventions | 1. One home visit by experienced OT assessing environmental hazards (standardised form) and supervision of home modifications Telephone follow‐up after 2 wks 2. Control: usual care | |
| Outcomes | 1. Rate of falls 2. Number of people falling | |
| Duration of the study | 1 year | |
| Notes | Cost‐effectiveness analysis reported in Salkeld 2000 | |
| Risk of bias | ||
| Bias | Authors' judgement | Support for judgement |
| Random sequence generation (selection bias) | Low risk | Stratified block randomisation using random numbers table |
| Allocation concealment (selection bias) | Low risk | Randomised off site by person not involved in recruitment |
| Blinding of participants and personnel (performance bias) All outcomes | Unclear risk | Participants and personnel not blind to allocated group but impact of non‐blinding unclear |
| Blinding of outcome assessment (detection bias) Falls and fallers | Low risk | Falls self reported by participants. Quote: "Subjects who had not returned a calendar within 10 days of the end of the month were telephoned and asked about falls in the previous month. If one or more falls were reported, a telephone‐administered questionnaire was used to elicit details of each fall". Quote: "Follow‐up interviews were blind to group allocation" |
| Incomplete outcome data (attrition bias) Falls | Unclear risk | SeeAppendix 3 for method of assessment. Insufficient information to permit judgement. |
| Incomplete outcome data (attrition bias) Fallers | Low risk | SeeAppendix 3 for method of assessment |
| Risk of bias in recall of falls | Low risk | Prospective. Falls ascertained using monthly falls calendar. |
Cumming 2007.
| Study characteristics | ||
| Methods | RCT | |
| Participants | Setting: Sydney, Australia N = 616 Sample: men and women from outpatient aged care services, some volunteers recruited by advertisement (68% women) Age (years): mean 80.6 (SD 6) Inclusion criteria: age 70 and older; living independently in the community; no cataract surgery or new eye glass prescription in previous 3 months; participant or care giver able to complete monthly falls calendar Exclusion criteria: none noted | |
| Interventions | 1. Vision tests and eye examinations. Dispensing of new spectacles if required. Referral for expedited ophthalmology treatment if appropriate occular pathology identified. Mobility training and canes if required. 2. Control: usual care | |
| Outcomes | 1. Rate of falls 2. Number of people falling 3. Number sustaining a fracture | |
| Duration of the study | 1 year | |
| Notes | ||
| Risk of bias | ||
| Bias | Authors' judgement | Support for judgement |
| Random sequence generation (selection bias) | Unclear risk | Not described |
| Allocation concealment (selection bias) | Low risk | Randomised off site by person not involved in recruitment |
| Blinding of participants and personnel (performance bias) All outcomes | Unclear risk | Participants and personnel not blind to allocated group but impact of non‐blinding unclear |
| Blinding of outcome assessment (detection bias) Falls and fallers | Unclear risk | All participants used monthly falls diary, with telephone contact if not returned in 2 weeks. Blinding of study personnel recording data from the calendars not described. |
| Blinding of outcome assessment (detection bias) Fractures | High risk | Fractures were self reported by participants who were aware of their group allocation, and not confirmed by the results of radiological examination or from primary care case records |
| Incomplete outcome data (attrition bias) Falls | Unclear risk | SeeAppendix 3 for method of assessment. Insufficient information to permit judgement. |
| Incomplete outcome data (attrition bias) Fallers | Low risk | SeeAppendix 3 for method of assessment |
| Risk of bias in recall of falls | Low risk | Quote: "Ascertainment of falls involved a self‐report falls calendar ... Subjects were asked to record on each day an "N" if they did not fall and an "F" if they had a fall. If a fall occurred, the subject completed an additional postcard about fall‐related injuries (including fractures)". |
Dangour 2011.
| Study characteristics | ||
| Methods | RCT (cluster‐randomised by health centre, 2 x 2 factorial design) | |
| Participants | Setting: Santiago, Chile N = 2799. N = 28 clusters; N = 20 clusters only for fallers and fractures Sample: randomly sampled households in health centre catchment areas and health centre registries (68% women) Age (years): range 65 to 68 Inclusion criteria (clusters): health centres with > 400 residents aged 65 to 67.9 years in low‐middle economic status municipalities Exclusion criteria (individuals): unable to walk unaided; seeking medical advice for unplanned 3 kg weight loss over 3 months; planning to move house within 3 months; already enrolled in national Programme of Complementary Feeding for the Older Population (PACAM) or consuming PACAM programme supplements; scoring ≥ 6 on Pfeffer screen (poor cognitive function) | |
| Interventions | 1. Nutritional supplements (50 g daily of a vegetable powdered food and 50 g daily of a powdered low‐lactose milk based drink)
2. Physical activity classes (1 hour supervised group training sessions, 2 x per wk, encouraged to walk to sessions) 3. Nutritional supplements + physical activity classes 4. Control: no intervention |
|
| Outcomes | 1. Number of people falling Other outcomes reported but not included in this review Primary outcomes were pneumonia and walking capacity |
|
| Duration of the study | 24 months | |
| Notes | Cost analysis reported in primary reference. | |
| Risk of bias | ||
| Bias | Authors' judgement | Support for judgement |
| Random sequence generation (selection bias) | Low risk | Quote: "The center names (clusters) were put into a hat. The four treatment arms (nutritional supplementation, nutritional supplementation+physical activity, physical activity, control) were randomly numbered 1–4. As each name was drawn out of the hat by a member of the study team, it was assigned to the next treatment number until each arm contained five clusters." |
| Allocation concealment (selection bias) | High risk | In the Methods section, page 3, the following paragraph came after the paragraph about random sequence generation in item 1 above: "Participants were recruited from May to December 2005.", implying recruitment took place after health centres were randomised to the 4 groups. There was no mention of active blinding of research team members recruiting participants. |
| Blinding of participants and personnel (performance bias) All outcomes | Unclear risk | Participants and personnel not blind to allocated group but impact of non‐blinding unclear |
| Blinding of outcome assessment (detection bias) Falls and fallers | High risk | Although assessors of the primary outcomes (pneumonia, physical function) were blind to group allocation, this was not mentioned, therefore assumed not to apply, for secondary outcomes (included fallers and fractures) |
| Blinding of outcome assessment (detection bias) Fractures | High risk | Self reported fractures, not confirmed by the results of radiological examination or from primary care case records |
| Incomplete outcome data (attrition bias) Fallers | Low risk | SeeAppendix 3 for method of assessment |
| Risk of bias in recall of falls | High risk | Participant recall for falls was at 12 and 24 months. For secondary outcomes including "self‐reported incidence of falls" ... "Participants in the original 20 clusters were re‐interviewed after 12 and 24 mo for outcome data." |
Dapp 2011.
| Study characteristics | ||
| Methods | RCT (cluster‐randomised by household if more than one person per household) | |
| Participants | Setting: 14 general practices, Hamburg, Germany N = 2580 Sample: registered with participating practices (63% women) Age (years): mean 71.8 (SD 7.6) Inclusion criteria: aged ≥ 60 Exclusion criteria: need for human help or nursing care; cognitive impairment; terminal disease | |
| Interventions | 1. High‐risk appraisal with GP feedback. Patients chose reinforcement with group sessions or home visits 2. Control: usual care | |
| Outcomes | 1. Number of fallers | |
| Duration of the study | 1 year | |
| Notes | Health promotion rather than fall prevention specifically | |
| Risk of bias | ||
| Bias | Authors' judgement | Support for judgement |
| Random sequence generation (selection bias) | Low risk | Quote: "computer generated allocation sequence" |
| Allocation concealment (selection bias) | Low risk | Quote: "randomly allocated to intervention and control groups by the independent study centre" |
| Blinding of participants and personnel (performance bias) All outcomes | Unclear risk | Participants and personnel not blind to allocated group but impact of non‐blinding unclear |
| Blinding of outcome assessment (detection bias) Falls and fallers | Low risk | Questionnaire completed independently by participant at home, and then "All data were double entered by staff blinded for subject allocation." |
| Incomplete outcome data (attrition bias) Fallers | Low risk | SeeAppendix 3 for method of assessment |
| Risk of bias in recall of falls | High risk | Retrospective recall at 12 months |
Davis 2011a.
| Study characteristics | ||
| Methods | RCT | |
| Participants | Setting: Vancouver, Canada N = 155 Sample: community‐dwelling women Age (years): mean 70 (range 65 to 75) Inclusion criteria: aged 65 to 75; cognitively intact; visual acuity 20/40 or better Exclusion criteria: resistance training in the last 6 months; medical condition for which exercise is contraindicated; neurogenerative disease; taking cholinesterase inhibitors; depression; on hormone replacement therapy during previous 12 months | |
| Interventions | 1. Resistance training classes, 1 x per wk 2. Resistance training classes, 2 x per wk 3. Control: balance and tone classes, 2 x per wk | |
| Outcomes | 1. Rate of falls | |
| Duration of the study | 1 year | |
| Notes | Cost‐effectiveness analysis and cost utility analysis reported in primary reference | |
| Risk of bias | ||
| Bias | Authors' judgement | Support for judgement |
| Random sequence generation (selection bias) | Low risk | Quote: "The randomization sequence was generated by http://www.randomization.com" |
| Allocation concealment (selection bias) | Low risk | Quote: "The randomization sequence … was concealed until interventions were assigned. This sequence was held independently and remotely by the research coordinator" |
| Blinding of participants and personnel (performance bias) All outcomes | Low risk | Not possible to blind participants or personnel but both groups received an exercise intervention so unlikely to introduce bias |
| Blinding of outcome assessment (detection bias) Falls and fallers | Low risk | Quote: "The assessors were blinded to the participants' assignments" |
| Incomplete outcome data (attrition bias) Falls | Low risk | SeeAppendix 3 for method of assessment |
| Risk of bias in recall of falls | Low risk | Quote: "We used monthly fall diary calendars to track all falls for each participant during the 12‐month study period." |
Davison 2005.
| Study characteristics | ||
| Methods | RCT | |
| Participants | Setting: A&E, Newcastle, United Kingdom N = 313 Sample: people presenting at A&E with a fall or fall‐related injury (72% women) Age (years): mean 77 (SD 7) Inclusion criteria: age > 65 years, presenting at A&E with a fall or fall‐related injury; history of at least 1 additional fall in previous year; community‐dwelling Exclusion criteria: cognitively impaired (MMSE < 24); > 1 previous episode of syncope; immobile; live > 15 miles away from A&E; registered blind; aphasic; clear medical explanation for their fall, e.g. acute myocardial infarction, stroke, epilepsy; enrolled in another study | |
| Interventions | 1. Multifactorial post‐fall assessment and intervention. Hospital‐based medical assessment and intervention: fall history and examination including medications, vision, cardiovascular assessment, laboratory blood tests, ECG. Home‐based physiotherapist assessment and intervention: gait, balance, assistive devices, footwear. Home‐based OT home hazard assessment and interventions. 2. Control: usual care | |
| Outcomes | 1. Rate of falls 2. Number of people falling | |
| Duration of the study | 1 year | |
| Notes | Only 1 participant in residential/nursing care. More detailed description of intervention on journal website (www.ageing.oupjournals.org) | |
| Risk of bias | ||
| Bias | Authors' judgement | Support for judgement |
| Random sequence generation (selection bias) | Low risk | Randomised by computer‐generated block randomisation |
| Allocation concealment (selection bias) | Unclear risk | Insufficient information to permit judgement |
| Blinding of participants and personnel (performance bias) All outcomes | Unclear risk | Participants and personnel not blind to allocated group but impact of non‐blinding unclear |
| Blinding of outcome assessment (detection bias) Falls and fallers | Low risk | All participants used monthly falls diaries. Quote: "These data were processed by a researcher blinded to randomisation and otherwise unconnected with the study." |
| Blinding of outcome assessment (detection bias) Fractures | Low risk | Quote: "Secondary outcome measures [including fractures] were recorded with interviewer‐led questionnaires ... The interviewer was blind to randomisation". "Hospital records were checked retrospectively at 1 year for all participants." |
| Incomplete outcome data (attrition bias) Falls | Low risk | SeeAppendix 3 for method of assessment |
| Incomplete outcome data (attrition bias) Fallers | Low risk | SeeAppendix 3 for method of assessment |
| Risk of bias in recall of falls | Low risk | Prospective. Falls data collected using fall diaries returned 4‐weekly. |
Day 2002.
| Study characteristics | ||
| Methods | RCT (factorial design) | |
| Participants | Setting: Melbourne, Australia N = 1107 Sample: community‐dwelling men and women identified from electoral roll (60% women) Age (years): mean 76.1 (SD 5.0) Inclusion criteria: aged ≥ 70; community‐dwelling and able to make modifications; expected to remain in area for 2 years (except for short absences); have approval of family physician Exclusion criteria: undertaken regular to moderate exercise with a balance component in previous 2 months; unable to walk 10 to 20 m without rest or help or having angina; severe respiratory or cardiac disease; psychiatric illness prohibiting participation; dysphasia; recent major home modifications; education and language adjusted score > 4 on the short portable mental status questionnaire | |
| Interventions | 1. Exercise: 1 hour class per wk for 15 wks, plus daily home exercises. Designed by physiotherapist to improve flexibility, leg strength, and balance (or less demanding routine depending on subject's capability).
2. Home hazard management: home assessed by "trained assessor", hazards removed or modified by participants or City of Whitehorse's home maintenance programme. Staff visited home, provided quote for work including free labour and materials up to AUD 100.
3. Vision improvement: assessed at baseline using dual visual acuity chart. Referred to usual eye care provider, general practitioner, or local optometrist if not already receiving treatment for identified impairment.
4. (1) + (2)
5. (1) + (3)
6. (3) + (2)
7. (1) + (2) + (3) 8. No intervention. Received brochure on eye care for over 40‐year olds. |
|
| Outcomes | 1. Rate of falls 2. Number of people falling |
|
| Duration of the study | 18 months | |
| Notes | ||
| Risk of bias | ||
| Bias | Authors' judgement | Support for judgement |
| Random sequence generation (selection bias) | Low risk | Randomised by "adaptive biased coin" technique, to ensure balanced group numbers |
| Allocation concealment (selection bias) | Low risk | Computer‐generated by an independent third party contacted by telephone |
| Blinding of participants and personnel (performance bias) All outcomes | Unclear risk | Participants and personnel not blind to allocated group but impact of non‐blinding unclear |
| Blinding of outcome assessment (detection bias) Falls and fallers | Low risk | All participants used monthly falls diary, with telephone contact from a researcher blinded to group allocation if not returned in 5 days |
| Incomplete outcome data (attrition bias) Falls | Unclear risk | Insufficient information to permit judgement. SeeAppendix 3 for method of assessment. |
| Incomplete outcome data (attrition bias) Fallers | Unclear risk | Insufficient information to permit judgement. SeeAppendix 3 for method of assessment. |
| Risk of bias in recall of falls | Low risk | Falls reported using monthly postcard to record daily falls. Telephone follow‐up if calendar not returned within 5 working days of the end of each month, or reporting a fall. |
De Vries 2010.
| Study characteristics | ||
| Methods | RCT | |
| Participants | Setting: Amsterdam, the Netherlands N = 217 Sample: people consulting ED or family physician after a fall (71% women) Age (years): mean 79.8 (SD 7.35) Inclusion criteria: aged ≥ 65 years; living independently or in assisted living facility; living near University Medical Center; history of fall in previous 3 months Exclusion criteria: unable sign informed consent or provide a fall history; cognitive impairment (MMSE < 24); fall due to traffic or occupational accident; living in nursing home; acute pathology requiring long‐term rehabilitation, e.g. stroke | |
| Interventions | 1. Multidisciplinary assessment in geriatric outpatient clinic and individually tailored treatment in collaboration with patient's GP e.g. withdrawal of psychotropic drugs, balance and strength exercises, home hazard reduction, referral to specialists 2. Control: usual care | |
| Outcomes | 1. Number of people falling 2. Number sustaining a fracture Other outcomes reported but not included in this review | |
| Duration of the study | 1 year | |
| Notes | Cost‐effectiveness analysis and cost utility analysis reported in Peeters 2011 | |
| Risk of bias | ||
| Bias | Authors' judgement | Support for judgement |
| Random sequence generation (selection bias) | Low risk | Quote: "computer‐generated random sequence" |
| Allocation concealment (selection bias) | Low risk | Quote: "…opaque envelopes are numbered and filled with group names. When a participant is designated to the high‐risk group, the interviewer, who is unaware of the content, opens the envelope with the lowest number." (from protocol paper) |
| Blinding of participants and personnel (performance bias) All outcomes | Unclear risk | Quote: "Participants, intervention caregivers, and interviewers could not be blinded to group assignment." but impact of non‐blinding unclear. |
| Blinding of outcome assessment (detection bias) Falls and fallers | High risk | Not completely clear but study personnel stated to be non‐blinded, and falls self reported |
| Blinding of outcome assessment (detection bias) Fractures | High risk | Quote: "By their response to a questionnaire sent 11⁄2 years after the first home visit, participants were asked to indicate whether they had sustained a fracture since the first home visit." Study personnel non‐blinded, and no confirmation of fractures from medical records. |
| Incomplete outcome data (attrition bias) Fallers | Low risk | SeeAppendix 3 for method of assessment |
| Risk of bias in recall of falls | Low risk | Quote: "For 1 year, the participants recorded each week whether they had fallen." "Once per 3 months the participants return a calendar sheet by mail. When no sheet is received, or when the sheet is completed incorrectly, we inquire by telephone whether, and if yes, when the participant has fallen in the past 3 months." |
Dhesi 2004.
| Study characteristics | ||
| Methods | RCT | |
| Participants | Setting: United Kingdom N = 139 Sample: patients attending a falls clinic (78% women) Age (years): mean 76.8 (SD 6.2) Inclusion criteria: aged ≥ 65; community‐dwelling; fallen in previous 8 wks; normal bone chemistry; 25 OHD ≤ 12 µg/litre Exclusion criteria: AMT < 7/10; taking vitamin D or calcium supplements; history of chronic renal failure, alcohol abuse, conditions or medications likely to impair postural stability or vitamin D metabolism | |
| Interventions | 1. One intramuscular injection (2 ml) of 600,000 IU ergocalciferol 2. Control: one placebo injection of 2 ml normal saline | |
| Outcomes | 1. Rate of falls 2. Number of people falling | |
| Duration of the study | 6 months | |
| Notes | Flowchart in Figure 1 shows N = 139 randomised with 70 in intervention group, but Table 1 (baseline characteristics) shows N = 138 randomised with 69 in intervention group | |
| Risk of bias | ||
| Bias | Authors' judgement | Support for judgement |
| Random sequence generation (selection bias) | Low risk | Randomised in blocks of 20, by computer program |
| Allocation concealment (selection bias) | Low risk | Randomised independently of the investigators |
| Blinding of participants and personnel (performance bias) All outcomes | Low risk | Double‐blind, placebo‐controlled study |
| Blinding of outcome assessment (detection bias) Falls and fallers | Low risk | All participants used a 6‐month falls diary which was reviewed with the patient by blinded trialist |
| Incomplete outcome data (attrition bias) Falls | Low risk | SeeAppendix 3 for method of assessment |
| Incomplete outcome data (attrition bias) Fallers | Low risk | SeeAppendix 3 for method of assessment |
| Risk of bias in recall of falls | Low risk | Falls recorded in falls diary which was reviewed at follow‐up assessment |
Di Monaco 2008.
| Study characteristics | ||
| Methods | Quasi‐randomised trial (alternation) | |
| Participants | Setting: Torino, Italy
N = 119
Sample: women in hospital after a fall‐related hip fracture Age (years): mean 80 (SD 6.6) Inclusion criteria: history of fall‐related hip fracture; returning to same dwelling in the community; aged ≥ 60 years Exclusion criteria: not living in Turin; MMSE < 23 |
|
| Interventions | 1. Multidisciplinary fall prevention programme during hospital stay plus single home visit by OT (median 20 days post discharge); assessed hazards, gave advice on modifying home environment, behaviour changes and use of assistive devices 2. Control: as above but no home visit | |
| Outcomes | 1. Rate of falls 2. Number of people falling | |
| Duration of the study | 6 months | |
| Notes | Intervention commences in hospital but designed to prevent falls in the community | |
| Risk of bias | ||
| Bias | Authors' judgement | Support for judgement |
| Random sequence generation (selection bias) | High risk | Quote: "...119 women were allocated to intervention or control groups alternately." |
| Allocation concealment (selection bias) | High risk | Randomised by alternation. No concealment. |
| Blinding of participants and personnel (performance bias) All outcomes | Unclear risk | Participants and personnel not blind to allocated group but impact of non‐blinding unclear |
| Blinding of outcome assessment (detection bias) Falls and fallers | High risk | Falls data were collected at home visit at 6 months by same OTs that carried out the interventions, i.e. not blind to intervention group |
| Incomplete outcome data (attrition bias) Falls | High risk | SeeAppendix 3 for method of assessment |
| Incomplete outcome data (attrition bias) Fallers | High risk | SeeAppendix 3 for method of assessment |
| Risk of bias in recall of falls | Unclear risk | Quote: "During their stay in hospital, all the women were asked to record falls occurring after discharge, and to report them at a home visit by an occupational therapist scheduled for approximately 6 months after discharge. During this home visit, the occupational therapist asked the women in detail about falls occurring after discharge from hospital." |
Dukas 2004.
| Study characteristics | ||
| Methods | RCT | |
| Participants | Setting: Basel, Switzerland N = 378. Sample: volunteers recruited from long‐term cohort study, and newspaper advertisements (52% women) Age (years): mean 75 (SD 4.2) Inclusion criteria: aged over 70; mobile; independent lifestyle Exclusion criteria: primary hyperparathyroidism; polyarthritis or inability to walk; calcium supplementation > 500 mg/day; vitamin D intake > 200 IU/day, active kidney stone disease; history of hypercalcuria, cancer or other incurable diseases; dementia, elective surgery planned within next 3 months; severe renal insufficiency; fracture or stroke within last 3 months | |
| Interventions | 1. Alfacalcidol (Alpha D3 TEVA) 1 µg/day for 36 wks 2. Placebo daily for 36 wks | |
| Outcomes | 1. Number of people falling 2. Adverse effects Other outcomes reported but not included in this review | |
| Duration of the study | 9 months | |
| Notes | ||
| Risk of bias | ||
| Bias | Authors' judgement | Support for judgement |
| Random sequence generation (selection bias) | Low risk | Randomised using "numbered containers"; numbered and blinded by independent statistical group |
| Allocation concealment (selection bias) | Low risk | Numbered and blinded by independent statistical group |
| Blinding of participants and personnel (performance bias) All outcomes | Low risk | Double‐blind, placebo‐controlled study |
| Blinding of outcome assessment (detection bias) Falls and fallers | Low risk | Subjects (blind to intervention group) asked to record falls in a diary and to telephone within 48 hours of a fall. Questionnaire about incidence of falls at clinic visits (4 wks, 12 wks, and every 12 wks subsequently to 36 wks) and "All investigators and staff conducting the study remained blinded throughout the treatment period." |
| Incomplete outcome data (attrition bias) Fallers | Low risk | SeeAppendix 3 for method of assessment |
| Risk of bias in recall of falls | Unclear risk | Subjects asked to record falls in a diary and to telephone within 48 hours of a fall. Also questionnaire about incidence of falls at clinic visits (4 wks, 12 wks, and every 12 wks subsequently to 36 wks). |
Elley 2008.
| Study characteristics | ||
| Methods | RCT | |
| Participants | Setting: Hutt Valley, New Zealand N = 312 Sample: patients from 19 primary care practices (69% women) Age (years): mean 80.8 (SD 5) Inclusion criteria: aged ≥ 75 (> 50 years for Maori and Pacific people), fallen in last year, living independently Exclusion criteria: unable to understand study information and consent processes, unstable or progressive medical condition, severe physical disability, dementia (< 7 on Abbreviated Mental Test Score) | |
| Interventions | 1. Community‐based nurse assessment of falls and fracture risk factors, home hazards, referral to appropriate community interventions, and strength and balance exercise programme 2. Control: usual care and social visits | |
| Outcomes | 1. Rate of falls 2. Number of people falling | |
| Duration of the study | 1 year | |
| Notes | ||
| Risk of bias | ||
| Bias | Authors' judgement | Support for judgement |
| Random sequence generation (selection bias) | Low risk | Quote: "computer randomisation" |
| Allocation concealment (selection bias) | Low risk | Quote: "independent researcher at a distant site" |
| Blinding of participants and personnel (performance bias) All outcomes | Unclear risk | Participants and personnel not blind to allocated group but impact of non‐blinding unclear |
| Blinding of outcome assessment (detection bias) Falls and fallers | Low risk | Partipants recorded falls prospectively using postcard calendars, completed daily and mailed monthly. Follow‐up telephone calls were by blinded research staff. |
| Incomplete outcome data (attrition bias) Falls | Low risk | SeeAppendix 3 for method of assessment |
| Incomplete outcome data (attrition bias) Fallers | Low risk | SeeAppendix 3 for method of assessment |
| Risk of bias in recall of falls | Low risk | Quote: "Postcard calendars completed daily and posted monthly". |
Fabacher 1994.
| Study characteristics | ||
| Methods | RCT | |
| Participants | Setting: California, USA N = 254 Sample: men and women aged over 70 years and eligible for veterans medical care. Identified from voter registration lists and membership lists of service organisations (2% women) Age (years): mean 73 years Inclusion criteria: aged ≥ 70; not receiving health care at Veterans Administration Medical Centre Exclusion criteria: known terminal disease, dementia | |
| Interventions | 1. Home visit by health professional to screen for medical, functional, and psychosocial problems, followed by a letter for participants to show to their personal physician. Targeted recommendations for individual disease states, preventive health practices 2. Control: follow‐up telephone calls for outcome data only | |
| Outcomes | 1. Number of people falling Other outcomes reported but not included in this review |
|
| Duration of the study | 1 year | |
| Notes | ||
| Risk of bias | ||
| Bias | Authors' judgement | Support for judgement |
| Random sequence generation (selection bias) | Unclear risk | Quote: "randomly assigned ... using randomly generated assignment cards in sealed envelopes". Judged to be unclear. |
| Allocation concealment (selection bias) | Unclear risk | Quote: "randomly assigned ... using randomly generated assignment cards in sealed envelopes". Judged to be unclear. |
| Blinding of participants and personnel (performance bias) All outcomes | Unclear risk | Participants and personnel not blind to allocated group but impact of non‐blinding unclear |
| Blinding of outcome assessment (detection bias) Falls and fallers | High risk | Intervention group data collected on a structured interview form at 4‐monthly face to face visits. Control group received only 4‐monthly telephone interviews. |
| Incomplete outcome data (attrition bias) Fallers | High risk | SeeAppendix 3 for method of assessment |
| Risk of bias in recall of falls | High risk | Falls identified at 4‐monthly intervals, by structured interview for active arm and by telephone for controls |
Faes 2011.
| Study characteristics | ||
| Methods | RCT (cluster‐randomised in pairs: participant + caregiver) | |
| Participants | Settting: Arnhem and Nijmegan, the Netherlands N = 33 pairs Sample: patients recruited from 3 geriatric outpatient clinics (70% women) Age (years): mean 78.3 (SD 7) Inclusion criteria: fallen in previous 6 months; able to walk 15 m independently (with or without walking aid); had a primary informal caregiver; community‐dwelling; life expectancy > 1 year; frail (≥ 2 frailty indicators) Exclusion criteria: awaiting nursing home admission; MMSE < 15 |
|
| Interventions | 1. Psychological teaching and training + physical training in small groups. 10 x 2 h sessions 2 x per wk + booster session 6 wks later. Caregivers trained in autonomy boosting strategies, and being co‐therapist at home 2. Control: usual care |
|
| Outcomes | 1. Rate of falls 2. Number of people falling Other outcomes reported but not included in this review |
|
| Duration of the study | 7 months | |
| Notes | Trial terminated due to "Extremely difficult recruitment. Preliminary analysis showed no effect of the intervention." Target sample 160 people plus their carer (N = 320) | |
| Risk of bias | ||
| Bias | Authors' judgement | Support for judgement |
| Random sequence generation (selection bias) | Low risk | Quote: "Treatment allocation…was based on a minimization algorithm that balanced for the minimization factors" |
| Allocation concealment (selection bias) | Low risk | Quote: "allocation, carried out by an independent statistician" |
| Blinding of participants and personnel (performance bias) All outcomes | Unclear risk | Participants and personnel not blind to allocated group but impact of non‐blinding unclear |
| Blinding of outcome assessment (detection bias) Falls and fallers | Low risk | Quote: "Nonresponders were contacted over the telephone so that the fall history for the missing calendar weeks and underlying reasons for their lack of response could be assessed" "The assessors (M.F.R. and M.C.F.) were blinded." |
| Incomplete outcome data (attrition bias) Falls | High risk | SeeAppendix 3 for method of assessment |
| Incomplete outcome data (attrition bias) Fallers | Low risk | SeeAppendix 3 for method of assessment |
| Risk of bias in recall of falls | Low risk | Quote: "Falls were registered daily using a preaddressed, reply‐paid 2‐weekly fall registration calendar throughout the whole course of the trial." |
Fiatarone 1997.
| Study characteristics | ||
| Methods | RCT | |
| Participants | Setting: USA N = 34 Sample: frail older people (94% women) Age (years): mean 82 (SD 1) Inclusion criteria: community‐dwelling older people; moderate to severe functional impairment Exclusion criteria: none given | |
| Interventions | 1. High‐intensity progressive resistance training exercises in own home (3 day/wk for 16 wks). 2 weeks instruction and then weekly phone calls. 11 different upper and lower limb exercises with arm and leg weights 2. Control: wait list control. Weekly phone calls | |
| Outcomes | 1. "Frequency of falls" but probably means fallers Other outcomes reported but not included in this review |
|
| Duration of the study | 16 wks (duration of intervention) | |
| Notes | Abstract only | |
| Risk of bias | ||
| Bias | Authors' judgement | Support for judgement |
| Random sequence generation (selection bias) | Unclear risk | Method of randomisation not described |
| Allocation concealment (selection bias) | Unclear risk | Insufficient information to permit judgement |
| Blinding of participants and personnel (performance bias) All outcomes | Unclear risk | Insufficient information to permit judgement |
| Blinding of outcome assessment (detection bias) Falls and fallers | Unclear risk | Insufficient information to permit judgement |
| Incomplete outcome data (attrition bias) Fallers | Unclear risk | SeeAppendix 3 for method of assessment. Insufficient information to permit judgement. |
| Risk of bias in recall of falls | Unclear risk | Interval recall. Falls identified weekly by phone call. |
Foss 2006.
| Study characteristics | ||
| Methods | RCT | |
| Participants | Setting: Nottingham, United Kingdom N = 239 Sample: women referred to ophthalmology outpatient clinic Age (years): median 79.5 (range 70 to 92) Inclusion criteria: over 70 years of age; following successful cataract operation and with operable second cataract Exclusion criteria: having complex cataracts; visual field defects or severe comorbid eye disease affecting visual acuity; memory problems preventing completion of questionnaires or reliable recall of falls | |
| Interventions | 1. Small incision cataract surgery with insertion of intraocular lens under local anaesthetic 2. Control: waiting list | |
| Outcomes | 1. Rate of falls 2. Number of people falling 3. Number sustaining a fracture | |
| Duration of the study | 1 year | |
| Notes | Cost utility analysis reported in Sach 2010 | |
| Risk of bias | ||
| Bias | Authors' judgement | Support for judgement |
| Random sequence generation (selection bias) | Low risk | Quote: "lists prepared from random numbers in variably sized permuted blocks to maintain approximate equality in the size of the groups". |
| Allocation concealment (selection bias) | Low risk | Sequentially numbered, opaque envelopes |
| Blinding of participants and personnel (performance bias) All outcomes | Unclear risk | Participants and personnel not blind to allocated group but impact of non‐blinding unclear |
| Blinding of outcome assessment (detection bias) Falls and fallers | High risk | Falls were noted on diary by participants who were aware of their group allocation, and the data collected at 3 and 9 months by telephone and at 4 and 6 months at interview. These assessments were "not masked to allocation." |
| Blinding of outcome assessment (detection bias) Fractures | High risk | Fractures were noted on diary by participants who were aware of their group allocation, and the data collected at 3 and 9 months by telephone and at 4 and 6 months at interview. These assessments were "not masked to allocation." No mention of confirmation by radiological examination reports or from primary care case records. |
| Incomplete outcome data (attrition bias) Falls | Low risk | SeeAppendix 3 for method of assessment |
| Incomplete outcome data (attrition bias) Fallers | Low risk | SeeAppendix 3 for method of assessment |
| Risk of bias in recall of falls | Low risk | Prospective. Falls recorded on daily diary. Data collected by phone at 3 and 9 months, and by interview at 6 and 12 months. |
Fox 2010.
| Study characteristics | ||
| Methods | RCT (individually randomised, but small number of clusters as husbands allocated to same group) | |
| Participants | Setting: Humboldt County and San Diego County, California, USA
N = 552
Sample: new and existing 'Preventive Health Care for the Aging' (PHCA) clients (67% women)
Age (years): mean 76.9 (SD 6.8) Inclusion criteria: ≥ 65 years; no plans to move within 1 year; speaking English, Spanish, Cantonese or Vietnamese Exclusion criteria: serious cognitive impairment; medical disorders that would affect participation |
|
| Interventions | 1. Usual PHCA care (community‐based health promotion programme) + multifactorial fall prevention programme targeting 10 risk factors: fall risk factor assessment by public health nurse followed by education and written care plan with fall prevention goals; referral to individually tailored physical activity programmes. 50% received a home hazard assessment. 2. Control: usual PHCA care | |
| Outcomes | 1. Number of people falling | |
| Duration of the study | 1 year | |
| Notes | Only adjusted odds ratio reported. No raw data. Mean number of falls (SD) reported, but only by quarter year. | |
| Risk of bias | ||
| Bias | Authors' judgement | Support for judgement |
| Random sequence generation (selection bias) | Low risk | Quote: "computer‐generated list of random numbers" |
| Allocation concealment (selection bias) | Unclear risk | Insufficient information to permit judgement |
| Blinding of participants and personnel (performance bias) All outcomes | High risk | Neither clinicians nor participants blinded |
| Blinding of outcome assessment (detection bias) Falls and fallers | Unclear risk | Not stated whether assessors were blind to randomised group |
| Incomplete outcome data (attrition bias) Fallers | Unclear risk | SeeAppendix 3 for method of assessment |
| Risk of bias in recall of falls | Unclear risk | Quote: "Clients in both the treatment and control groups were given calendars to record falls and fall‐related physician visits" Quote: "We measured fall frequency at 3‐month intervals using a form developed for this project. We asked clients questions regarding the occurrence of falls in the previous quarter ..." |
Gallagher 1996.
| Study characteristics | ||
| Methods | RCT | |
| Participants | Setting: Victoria, British Columbia, Canada N = 100 Sample: community‐dwelling volunteers (80% women) Age (years): mean 74.6 Inclusion criteria: aged ≥ 60; fallen in previous 3 months Exclusion criteria: none described | |
| Interventions | 1. 2 risk assessment interviews of 45 min each. One counselling interview of 60 min showing video and booklet and results of risk assessment 2. Control: baseline interview and follow‐up only. No intervention | |
| Outcomes | 1. Rate of falls Other outcomes reported but not included in this review |
|
| Duration of the study | 6 months | |
| Notes | ||
| Risk of bias | ||
| Bias | Authors' judgement | Support for judgement |
| Random sequence generation (selection bias) | Unclear risk | Method of randomisation not described |
| Allocation concealment (selection bias) | Unclear risk | Method of randomisation not described |
| Blinding of participants and personnel (performance bias) All outcomes | Unclear risk | Participants and personnel not blind to allocated group but impact of non‐blinding unclear |
| Blinding of outcome assessment (detection bias) Falls and fallers | Unclear risk | Participants completed a calendar daily and returned it every 2 weeks; a telephone interview was then conducted. At final interview at 6 months, the interviewer was not blinded. |
| Incomplete outcome data (attrition bias) Falls | Low risk | SeeAppendix 3 for method of assessment |
| Risk of bias in recall of falls | Low risk | Calendar postcards completed and returned every 2 weeks for 6 months. Telephone follow‐up of reported falls. |
Gallagher 2001.
| Study characteristics | ||
| Methods | RCT | |
| Participants | Setting: presumed community, Omaha, USA N = 489 Sample: mailing lists used to contact women aged 65 to 77 years in Omaha and surrounding district Age (years): mean 71 (SD 4), range 65 to 77 Inclusion criteria: 65 to 77 years; not osteoporotic (femoral neck density in normal range for age) Exclusion criteria: severe chronic illness; primary hyperparathyroidism or active renal stone disease; on certain medications in last 6 months, e.g. bisphosphonates, anticonvulsants, oestrogen, fluoride, thiazide diuretics | |
| Interventions | 1. Calcitriol (Rocaltrol) 0.25 µg twice daily for 3 years
2. HRT/ERT (conjugate estrogens (Premarin) 0.625 mg daily + medroxyprogesterone (Provera) 2.5 mg daily
3. Calcitriol plus HRT/ERT as above
4. Control: placebo (ERT given to hysterectomised women N = 290, i.e. not given progestin) All groups advised to increase dietary calcium if daily intake < 500 mg/day and to decrease dietary calcium if intake > 1000 mg/day |
|
| Outcomes | 1. Rate of falls
2. Number of people falling 3. Number sustaining a fracture 4. Number of people with adverse effects Other outcomes reported but not included in this review |
|
| Duration of the study | 3 years | |
| Notes | ||
| Risk of bias | ||
| Bias | Authors' judgement | Support for judgement |
| Random sequence generation (selection bias) | Unclear risk | Quote: "Simple randomisation", stratified on presence or absence of uterus. No further details. |
| Allocation concealment (selection bias) | Unclear risk | Quote: "randomly assigned". No methods described. |
| Blinding of participants and personnel (performance bias) All outcomes | Low risk | Double‐blind, placebo‐controlled study |
| Blinding of outcome assessment (detection bias) Falls and fallers | Low risk | Data on falls and fractures were collected by questionnaire at interview at intervals over 36 months. Participants and assessors both blinded. |
| Blinding of outcome assessment (detection bias) Fractures | Low risk | Data on falls and fractures were collected by questionnaire at interview at intervals over 36 months. Quote: "All fractures were confirmed from x‐ray reports." |
| Incomplete outcome data (attrition bias) Falls | Low risk | SeeAppendix 3 for method of assessment |
| Incomplete outcome data (attrition bias) Fallers | Low risk | SeeAppendix 3 for method of assessment |
| Risk of bias in recall of falls | High risk | Falls retrospectively monitored by interview questionnaire at 6 weeks, 3 months, and‐6 monthly thereafter |
Gill 2008.
| Study characteristics | ||
| Methods | RCT | |
| Participants | Setting: Ontario, Canada N = 241 Sample: male Canadian veterans of WWII and Korean War living in south‐west Ontario Age (years): mean 81 (SD 3.8) Inclusion criteria: living independently in the community; able to understand and respond to questionnaire; at least 1 modifiable risk factor for falling identified by initial screening questionnaire | |
| Interventions | Initial postal risk factor screening questionnaire to all potential participants 1. Specialised geriatric services group: comprehensive geriatric assessment by geriatrician or PT with individual recommendations for fall risk factor reduction 2. Family physician group: participants sent letter summarising risk factors reported in questionnaire. Similar letter sent to participant's family physician. Treatment left to discretion of family physician |
|
| Outcomes | 1. Number of fallers | |
| Duration of the study | 1 year | |
| Notes | ||
| Risk of bias | ||
| Bias | Authors' judgement | Support for judgement |
| Random sequence generation (selection bias) | Unclear risk | Quote: "Randomized". No description of sequence generation. |
| Allocation concealment (selection bias) | Unclear risk | Insufficient information to permit judgement |
| Blinding of participants and personnel (performance bias) All outcomes | Unclear risk | Participants and personnel not blind to allocated group but impact of non‐blinding unclear |
| Blinding of outcome assessment (detection bias) Falls and fallers | Unclear risk | Falls reported by participants who were aware of their group allocation. Unclear whether staff who confirmed falls by telephone were blinded. |
| Incomplete outcome data (attrition bias) Fallers | Low risk | SeeAppendix 3 for method of assessment |
| Risk of bias in recall of falls | Low risk | Monthly falls calendars returned for 1 year. Telephone follow‐up if calendar not returned or falls reported. |
Grahn Kronhed 2009.
| Study characteristics | ||
| Methods | RCT | |
| Participants | Setting: Linköping, Sweden
N = 73 Sample: women with osteoporosis identified from Linköping Hospital, Osteoporosis Unit files Age (years): mean 71.4, range 60 to 81 Inclusion criteria: BMD measured within previous 9 months and T‐score ≤ ‐2.5 SD Exclusion criteria: enrolled in a pharmacological RCT; requiring indoor walking aids; cognitively impaired (MMSE < 20); severe heart disease, malignancy, recent arthroplasty, unhealed fractures; unable to understand Swedish |
|
| Interventions | 1. Group exercise programme (60 min, 2 x per wk, for 4 months) supervised by PT 2. Control: no intervention. Instructed not to change exercise routines for 1 year | |
| Outcomes | 1. Mean number of falls (no SD reported) 2. Number sustaining a fracture Other outcomes reported but not included in this review | |
| Duration of the study | 1 year | |
| Notes | No participants sustained a fracture during follow‐up | |
| Risk of bias | ||
| Bias | Authors' judgement | Support for judgement |
| Random sequence generation (selection bias) | Low risk | Method not described but assume it was truly random given that "An independent statistical unit randomized the participants ..." |
| Allocation concealment (selection bias) | Low risk | Quote: "An independent statistical unit randomized the participants..." |
| Blinding of participants and personnel (performance bias) All outcomes | Unclear risk | Participants and personnel not blind to allocated group but impact of non‐blinding unclear |
| Blinding of outcome assessment (detection bias) Falls and fallers | Low risk | Quote: "… participants were followed‐up concerning … falls … for 1 year by the independent statistical unit." Probably blind to allocated group or at least unlikely to introduce bias. |
| Blinding of outcome assessment (detection bias) Fractures | High risk | Appear to be participant‐reported fractures with no description of confirmation |
| Incomplete outcome data (attrition bias) Falls | Unclear risk | SeeAppendix 3 for method of assessment. Insufficient information to permit judgement. |
| Risk of bias in recall of falls | Low risk | Quote: "... participants reported number of falls each week for the 1‐year study period" |
Grant 2005.
| Study characteristics | ||
| Methods | RCT (multicentre, 2 x 2 factorial design) | |
| Participants | Setting: United Kingdom N = 5292 Sample: 21 centres in England and Scotland (85% women) Age (years): mean 77 (SD 6) Inclusion criteria: aged ≥ 70; recent fracture caused by a fall Exclusion criteria: bed or chair bound prior to fracture; abbreviated mental test score 6 or less; cancer likely to metastasise to bone within previous 10 years; fracture associated with pre‐existing bone abnormality; known hypercalcaemia; renal stone in last 10 years; life expectancy < 6 mo; known to be leaving the UK; taking > 200 IU (5 µg) vitamin D or > 500 mg calcium supplements daily; had fluoride, calcitonin, tibolone, HRT, selective oestrogen receptor modulators or any vitamin D metabolite (such as calcitriol) in the last 5 years; vitamin D by injection in preceding year | |
| Interventions | 2 tablets daily with meals for 2 years. Tablets delivered every 4 months by post. Randomised to tablets containing a total of either: 1. 800 IU (20 µg) vitamin D3 plus placebo calcium 2. 800 IU vitamin D3 + 1000 mg calcium 3. 1000 mg elemental calcium (calcium carbonate) plus placebo vitamin D 4. Double placebo | |
| Outcomes | 1. Number of people falling 2. Number sustaining a fracture 3. Number of people with adverse effects | |
| Duration of the study | 60 months | |
| Notes | ||
| Risk of bias | ||
| Bias | Authors' judgement | Support for judgement |
| Random sequence generation (selection bias) | Low risk | Computer‐generated, centralised randomisation, stratified by centre |
| Allocation concealment (selection bias) | Low risk | Centralised randomisation |
| Blinding of participants and personnel (performance bias) All outcomes | Low risk | Double‐blind, placebo‐controlled study |
| Blinding of outcome assessment (detection bias) Falls and fallers | Low risk | Data from falls window periods throughout the study collected by self report ‐ both participants and assessors were blinded to allocation |
| Blinding of outcome assessment (detection bias) Fractures | Low risk | Fracture data from participants in all groups were confirmed by the checking of patient records by blinded assessors |
| Incomplete outcome data (attrition bias) Fallers | Low risk | SeeAppendix 3 for method of assessment |
| Risk of bias in recall of falls | Unclear risk | Interval recall. Falls ascertained in 4‐monthly postal questionnaire ("Have you fallen during the last week") with telephone follow‐up if required, also from hospital and GP staff annotating notes |
Gray‐Donald 1995.
| Study characteristics | ||
| Methods | RCT | |
| Participants | Setting: Quebec, Canada N = 50 Subjects: recruited from people receiving long‐term home help services (71% women) Age (years): mean 77.5 (SD 8) Inclusion criteria: aged over 60; requiring community services; elevated risk of under‐nutrition (excessive weight loss or BMI < 24 kg/m2) Exclusion criteria: alcoholic; terminal illness | |
| Interventions | 1. 12 wk intervention of high energy nutrient dense supplements provided by dietitian. Two 235 ml cans/day (1045 to 1480 kj per can) for 12 wks. 2. Control: visits only (encouragement and suggestions about improving diets) | |
| Outcomes | 1. Number of people falling | |
| Duration of the study | 12 wks | |
| Notes | ||
| Risk of bias | ||
| Bias | Authors' judgement | Support for judgement |
| Random sequence generation (selection bias) | Unclear risk | Method of randomisation not described. Stratified by gender and nutritional risk criteria. |
| Allocation concealment (selection bias) | Unclear risk | Insufficient information to permit judgement |
| Blinding of participants and personnel (performance bias) All outcomes | Unclear risk | Participants and personnel not blind to allocated group but impact of non‐blinding unclear |
| Blinding of outcome assessment (detection bias) Falls and fallers | Unclear risk | Fall events ascertained at each of two 6‐weekly interviews. Blinding of assessors not reported. |
| Incomplete outcome data (attrition bias) Fallers | High risk | SeeAppendix 3 for method of assessment |
| Risk of bias in recall of falls | High risk | Retrospectively monitored at 6 and 12 weeks |
Greenspan 2005.
| Study characteristics | ||
| Methods | RCT (2 x 2 factorial design) | |
| Participants | Setting: Boston, USA
N = 373
Sample: women identified from newspaper advertisements, targeted mailings, presentations to seniors groups, and physician referrals Age (years): mean 71.3 (SD 5.2) Inclusion criteria: community‐dwelling women including women with hysterectomy; aged 65 and older Exclusion criteria: illness that could affect bone mineral metabolism; current use of medications known to alter bone mineral metabolism; known contraindication to HRT use |
|
| Interventions | 1. HRT/ERT plus placebo alendronate 2. HRT/ERT plus alendronate 3. Alendronate plus placebo HRT/ERT 4. Placebo HRT/ERT plus placebo alendronate All participants received calcium and vitamin D supplementation throughout the study (ERT given to hysterectomised women, i.e. not given progestin) | |
| Outcomes | 1. Number of people falling Falls a secondary outcome of study. Other outcomes reported but not included in this review |
|
| Duration of the study | 3 years | |
| Notes | In the 2005 report the data presented are for all women receiving HRT. This includes women who received HRT + alendronate. Although there is no evidence of an interaction between these agents which might plausibly affect falls, this cannot be absolutely ruled out. Therefore in this review we have taken a conservative approach, and not used data the group who received HRT + alendronate. | |
| Risk of bias | ||
| Bias | Authors' judgement | Support for judgement |
| Random sequence generation (selection bias) | Low risk | Computer random number generation |
| Allocation concealment (selection bias) | Low risk | Sequentially numbered, opaque, sealed envelopes |
| Blinding of participants and personnel (performance bias) All outcomes | Low risk | Double‐blind, placebo‐controlled study |
| Blinding of outcome assessment (detection bias) Falls and fallers | Low risk | Participants in both groups and assessors blinded to treatment group |
| Incomplete outcome data (attrition bias) Fallers | Low risk | SeeAppendix 3 for method of assessment |
| Risk of bias in recall of falls | High risk | Interval recall, but at 6 months and 1 year |
Haines 2009.
| Study characteristics | ||
| Methods | RCT | |
| Participants | Setting: Brisbane, Australia N = 53 Sample: patients in geriatric rehabilitation, medical, or surgical units in Princess Alexandra Hospital (60% women) Age (years): mean 80.7 (SD 7.7) Inclusion criteria: aged > 65 years; gait instability or walking with a mobility aid; discharged from hospital to a community‐dwelling Exclusion criteria: unstable severe cardiac disease; cognitive impairment; aggressive behaviour; restricted weight‐bearing status; referred for post‐discharge community rehabilitation services | |
| Interventions | 1. 'Kitchen Table Exercise Program': DVD and workbook. Progressive lower limb strength and balance exercises, 3 to 7 x per wk. DVD player provided if required. At least 1 home visit from project PT, then telephone contact weekly for 8 wks from first home visit, then 18 wks without active encouragement 2. Control: no exercise intervention | |
| Outcomes | 1. Rate of falls
2. Number of people falling
3. Number sustaining a fracture Other outcomes reported but not included in this review |
|
| Duration of the study | 6 months | |
| Notes | ||
| Risk of bias | ||
| Bias | Authors' judgement | Support for judgement |
| Random sequence generation (selection bias) | Low risk | Quote: "The random allocation sequence was generated by an investigator (TH) using a computerized random number generator." |
| Allocation concealment (selection bias) | Low risk | Quote: "This sequence was entered into sealed, consecutively numbered, opaque envelopes. Each envelope corresponding to the participants study number (allocated in the order in which participants consented to participate in the study) was opened following completion of the baseline assessment. The envelopes containing the allocation sequence were secured within a locked office." |
| Blinding of participants and personnel (performance bias) All outcomes | High risk | Participants and personnel not blind to intervention, and falls were self reported |
| Blinding of outcome assessment (detection bias) Falls and fallers | Low risk | Quote: "All participants received monthly follow‐up phone calls from the blinded outcome assessor." |
| Blinding of outcome assessment (detection bias) Fractures | High risk | The only evidence for fractures was from self reports from participants |
| Incomplete outcome data (attrition bias) Falls | Unclear risk | SeeAppendix 3 for method of assessment |
| Incomplete outcome data (attrition bias) Fallers | Low risk | SeeAppendix 3 for method of assessment |
| Risk of bias in recall of falls | Low risk | Quote: "Participants in both group were provided with a log for recording falls and details surrounding them." "All participants received monthly follow‐up phone calls from the blinded outcome assessor." |
Haran 2010.
| Study characteristics | ||
| Methods | RCT | |
| Participants | Setting: Sydney and Illawarra regions, New South Wales, Australia N = 606 Sample: sample from electoral roll; residents of retirement villages; outpatients and inpatients discharged from rehabilitation and orthopaedic ward; responders to advertising etc (65% women) Age (years): mean 80 (SD 6.6) Inclusion criteria: community‐dwelling; at a relatively high risk of falls (≥ 80 years, or 65 to 79 and TUG test ≥ 15 sec and/or ≥ 1 fall in past 12 mo); using bifocal, trifocal, or progressive lens glasses ≥ 3 x per wk when walking outdoors; reviewed by an optometrist or ophthalmologist in previous 24 months; "quite or very confident" that they could comply with the study recommendations Exclusion criteria: using single lens distance glasses; residing in high‐care residential facility; cognitive impairment (MMSE < 24); severe visual impairment (MET < 16 dB); insufficient English language skills; ophthalmic surgery planned in the next 12 months; unstable medical condition | |
| Interventions | 1. Optometrist examination; prescribed single lens distance glasses for use in most walking or standing activities and given advice on use of their glasses 2. Control: used their multifocal glasses in their usual manner (no advice) All participants received an optometry assessment and updated multifocal glasses (if required) at baseline | |
| Outcomes | 1. Rate of falls 2. Number of people falling 3. Number sustaining fall‐related fractures Other outcomes reported but not included in this review |
|
| Duration of the study | 13 months | |
| Notes | ||
| Risk of bias | ||
| Bias | Authors' judgement | Support for judgement |
| Random sequence generation (selection bias) | Low risk | Quote: "Each stratum was randomly allocated in permuted blocks of 10 generated externally (by JS)" a professor of statistics |
| Allocation concealment (selection bias) | Low risk | Quote: "by using sequentially numbered opaque sealed envelopes containing group assignment" |
| Blinding of participants and personnel (performance bias) All outcomes | Unclear risk | Both groups received an intervention, i.e. an optometrist examination and updated multifocal lens prescription if required. The intervention group were prescribed a pair of single lens distance glasses and advice. |
| Blinding of outcome assessment (detection bias) Falls and fallers | Low risk | Monthly calendars and follow‐up telephone calls as required. Research personnel who received the calendars and made the calls were blinded to group allocation. |
| Blinding of outcome assessment (detection bias) Fractures | High risk | Injurious falls were defined as those that resulted in fractures, dislocations, and organ and soft tissue trauma. These were collected as self report from the monthly calendars and telephone calls and not verified from primary source. |
| Incomplete outcome data (attrition bias) Falls | Low risk | SeeAppendix 3 for method of assessment |
| Incomplete outcome data (attrition bias) Fallers | Low risk | SeeAppendix 3 for method of assessment |
| Risk of bias in recall of falls | Low risk | Daily diaries returned monthly with a follow‐up phone call if not returned |
Harari 2008.
| Study characteristics | ||
| Methods | RCT (cluster‐randomised by household if more than 1 person per household) | |
| Participants | Setting: London, United Kingdom N = 2503 Sample: patients in 3 computerised group practices (26 GPs) (55% women) Age (years): mean 74 (SD 6.2) Inclusion criteria: aged ≥ 65; registered with participating group practice Exclusion criteria: needing human assistance with basic ADL; living in a nursing/residential home; dementia; terminal disease; non‐English speaking |
|
| Interventions | 1. Participants sent Health Risk Appraisal for Older Persons (HRA‐O) questionnaire; feedback (20 to 35 page report) from GP on modifying risk, personalised preventive health checklist, sources of support including local exercise schemes etc. Advised to discuss issues with GP or practice nurse; reminder card sent to non‐responders 6 months later. HRA‐O and feedback documented in patient record 2. Control: usual care | |
| Outcomes | No useable data. Obtained number of multiple fallers from author. Other outcomes reported but not included in this review |
|
| Duration of the study | 1 year | |
| Notes | Initially 4 practices, 3 randomised to participate in trial and 1 to act as a control. Patients within the participating practices randomised to intervention or control group. 1 centre from an international multicentre study (PRO‐AGE) (see Dapp 2011a for other centre recording falls) | |
| Risk of bias | ||
| Bias | Authors' judgement | Support for judgement |
| Random sequence generation (selection bias) | Low risk | Quote: "Randomisations were computer generated at an independent centre." |
| Allocation concealment (selection bias) | Low risk | Quote: "Randomisations were computer generated at an independent centre." Although people living in the same household were allocated to the same group (so this could not be concealed) this should not have introduced bias given that the randomisation took place at an independent centre. |
| Blinding of participants and personnel (performance bias) All outcomes | High risk | Participants and GPs not blind to allocated group. Patients were individually randomised in each practice which could mean there is a risk of contamination as GPs treating both intervention and control participants were given training, and additionally those not in the intervention group could have sought health advice elsewhere. |
| Blinding of outcome assessment (detection bias) Falls and fallers | Unclear risk | Participants and health practitioners not blind to group allocation, but does not mention whether person abstracting data from the questionnaire was blind to allocation |
| Incomplete outcome data (attrition bias) Fallers | Unclear risk | SeeAppendix 3 for method of assessment. Insufficient information to permit judgement. |
| Risk of bias in recall of falls | High risk | No concurrent recording of falls. Quote: "... at the one year follow‐up, as a secondary outcome, we asked people about falls in the previous year." (personal communication). |
Harwood 2004.
| Study characteristics | ||
| Methods | RCT | |
| Participants | Setting: Nottingham, United Kingdom N = 150 Sample: women admitted to orthogeriatric rehabilitation ward within 7 days of surgery for hip fracture Age (years): mean 81.2, range 67 to 92 Inclusion criteria: recent surgery for hip fracture; previous community residence; previous independence in ADL Exclusion criteria: previously institutionalised; disease or medication known to affect bone metabolism; < 7 on 10‐point mental state score | |
| Interventions | 1. Single injection of vitamin D2 (ergocalciferol) 300,000 units 2. Single injection of vitamin D2 (ergocalciferol) 300,000 units plus oral calcium carbonate (Calcichew) 1 tablet x 2/day (1 g elemental calcium daily) 3. Oral vitamin D3 + calcium carbonate (Calceos) 1 tablet x 2/day (cholecalciferol 800 units/day + calcium 1 g/day) 4. Control: no treatment | |
| Outcomes | 1. Number of people falling
2. Number sustaining a fracture
3. Number of people with adverse effects Other outcomes reported but not included in this review |
|
| Duration of the study | 1 year | |
| Notes | Recruited in hospital but meets the inclusion criteria as participants were all community‐dwelling and intervention was designed to prevent falls in the community | |
| Risk of bias | ||
| Bias | Authors' judgement | Support for judgement |
| Random sequence generation (selection bias) | Low risk | Randomised to 4 groups by computer‐generated random number lists |
| Allocation concealment (selection bias) | Unclear risk | Quote: "using sealed, opaque, envelopes" |
| Blinding of participants and personnel (performance bias) All outcomes | High risk | No placebo was used; participants aware of whether they were receiving medication or no treatment |
| Blinding of outcome assessment (detection bias) Falls and fallers | High risk | Falls reported at intervals by participants to researchers who were aware of their group allocation |
| Blinding of outcome assessment (detection bias) Fractures | High risk | Fractures reported by participants to researchers who were aware of their group allocation. Fracture reports were not verified. |
| Incomplete outcome data (attrition bias) Fallers | High risk | SeeAppendix 3 for method of assessment |
| Risk of bias in recall of falls | High risk | Falls not recorded in diaries. Presume falls and fractures ascertained at dedicated clinic at 3, 6 and 12 months. |
Harwood 2005.
| Study characteristics | ||
| Methods | RCT | |
| Participants | Setting: Nottingham, United Kingdom N = 306 Sample: women referred to 1 of 3 consultant ophthalmologists (or optometrist‐led cataract clinic) Age (years): median 78.5, range 70 to 95 Inclusion criteria: women; aged > 70 years; with cataract; no previous ocular surgery Exclusion criteria: cataract not suitable for surgery by phacoemulsification; severe refraction error in 2nd eye; visual field deficits; severe co‐morbid eye disease affecting visual acuity; registrable partially sighted as a result of cataract; memory problems | |
| Interventions | 1. Expedited cataract surgery (target within 1 month) 2. Routine waiting list for surgery (within 13 months) plus up‐to‐date spectacle prescription | |
| Outcomes | 1. Rate of falls
2. Number of people falling
3. Number sustaining a fracture Other outcomes reported but not included in this review |
|
| Duration of the study | 1 year | |
| Notes | Cost‐effectiveness analysis and cost utility analysis reported in Sach 2007 | |
| Risk of bias | ||
| Bias | Authors' judgement | Support for judgement |
| Random sequence generation (selection bias) | Low risk | Random numbers in variably sized permuted blocks. Quote: "Block randomised consecutively to groups." |
| Allocation concealment (selection bias) | Low risk | Sequentially numbered, opaque, sealed envelopes |
| Blinding of participants and personnel (performance bias) All outcomes | Unclear risk | Participants and personnel not blind to allocated group but impact of non‐blinding unclear |
| Blinding of outcome assessment (detection bias) Falls and fallers | High risk | All participants used falls diaries. Neither assessors nor participants were blinded. |
| Blinding of outcome assessment (detection bias) Fractures | Unclear risk | Neither assessors nor participants were blinded. Unclear whether fracture were confirmed. |
| Incomplete outcome data (attrition bias) Falls | Low risk | SeeAppendix 3 for method of assessment |
| Incomplete outcome data (attrition bias) Fallers | Low risk | SeeAppendix 3 for method of assessment |
| Risk of bias in recall of falls | Low risk | Prospective. Falls recorded in diaries, telephoned at 3 and 9 months, interviewed at 6 and 12 months for data. |
Hauer 2001.
| Study characteristics | ||
| Methods | RCT | |
| Participants | Setting: Germany
N = 57
Sample: women recruited at the end of ward rehabilitation in a geriatric hospital Age (years): mean 82 (SD 4.8), range 75 to 90 Inclusion criteria: ≥ 75 years; fall(s) as reason for admission to hospital or recent history of injurious fall leading to medical treatment; residing within study community Exclusion criteria: acute neurological impairment; severe cardiovascular disease; unstable chronic or terminal illness; major depression; severe cognitive impairment; musculoskeletal impairment preventing participation in training regimen; falls known to be due to a single, identifiable disease, e.g. stroke or hypoglycaemia |
|
| Interventions | 1. Exercise: group lower‐extremity progressive resistance training and progressive functional balance training, 90 min, 3 x per wk, for 12 wks
2. Control: "motor placebo", i.e. flexibility, calisthenics, ball games, and memory tasks while seated, 60 min, 3 x per wk, for 12 wks Both groups also received identical physiotherapy (25 min, 2 x per wk) |
|
| Outcomes | 1. Number of people falling | |
| Duration of the study | 6 months after intervention | |
| Notes | ||
| Risk of bias | ||
| Bias | Authors' judgement | Support for judgement |
| Random sequence generation (selection bias) | Unclear risk | Stratified randomisation |
| Allocation concealment (selection bias) | Unclear risk | Insufficient information to permit judgement |
| Blinding of participants and personnel (performance bias) All outcomes | Low risk | Control group received "placebo activities" and both groups received identical physiotherapy sessions |
| Blinding of outcome assessment (detection bias) Falls and fallers | Low risk | Falls reported by participants but control group received "placebo activities". Assessor was blinded. |
| Incomplete outcome data (attrition bias) Fallers | Low risk | SeeAppendix 3 for method of assessment |
| Risk of bias in recall of falls | Low risk | Prospective. Daily diaries collected every 2 weeks. |
Helbostad 2004.
| Study characteristics | ||
| Methods | RCT | |
| Participants | Setting: 6 local districts in Trondheim, Norway N = 77 Sample: volunteers recruited through newspapers and invitations from health workers (81% women) Age (years): mean 81 (SD 4.5) Inclusion criteria: aged ≥ 75; fallen in last year; using walking aid indoor or outdoor Exclusion criteria: exercising 1 or more times weekly; terminal illness; cognitive impairment (MMSE < 22); recent stroke; unable to tolerate exercise | |
| Interventions | 1. Combined training: home visit by physical therapist for assessment; group classes, 5 to 8 people (individually tailored progressive resistance exercises, functional balance training) 1 h, 2 x per wk, for 12 wks + home exercises as below (2) 2. Home training: 4 non‐progressive exercises (functional balance and strength exercises) 2 x daily, for 12 wks + 3 group meetings |
|
| Outcomes | 1. Rate of falls 2. Number of people falling | |
| Duration of the study | 1 year | |
| Notes | ||
| Risk of bias | ||
| Bias | Authors' judgement | Support for judgement |
| Random sequence generation (selection bias) | Unclear risk | Quote: "randomised into one of two exercise programs" |
| Allocation concealment (selection bias) | Low risk | Randomised by independent research office using sealed envelopes |
| Blinding of participants and personnel (performance bias) All outcomes | Low risk | Cluster‐randomised trial comparing 2 types of exercise intervention. Low risk of performance bias. |
| Blinding of outcome assessment (detection bias) Falls and fallers | Low risk | Falls reported by participants but both groups received an exercise intervention. Assessors blind to subjects' assignment. |
| Incomplete outcome data (attrition bias) Falls | Low risk | SeeAppendix 3 for method of assessment |
| Incomplete outcome data (attrition bias) Fallers | Low risk | SeeAppendix 3 for method of assessment |
| Risk of bias in recall of falls | Low risk | Monthly falls diary (pre‐paid post card), telephone call if no response or fall reported |
Hendriks 2008.
| Study characteristics | ||
| Methods | RCT with economic evaluation | |
| Participants | Setting: Maastricht, The Netherlands N = 333 Sample: people who have visited an ED or a GP because of a fall (68% women) Age (years): mean 74.8 (SD 6.4) Inclusion criteria: ≥ 65 years; community‐dwelling; history of a fall requiring visit to ED or GP; living in Maastricht area Exclusion criteria: not able to speak or understand Dutch; unable to complete questionnaires or interviews by telephone; cognitive impairment (< 4 on AMT4); long‐term admission to hospital or other institution (> 4 wks from date of inclusion); permanently bedridden; fully dependent on a wheelchair | |
| Interventions | 1. Multifactorial intervention: detailed assessment by geriatrician, rehabilitation physician, geriatric nurse; recommendations and indications for referral sent to participants' GPs. GPs could then take action if they agreed with the recommendations and/or referrals. Home assessment by OT; recommendations sent to participants and their GPs, and direct referral to social or community services for provision of technical aids and adaptations or additional support. 2. Control: usual care | |
| Outcomes | 1. Number of people falling | |
| Duration of the study | 1 year | |
| Notes | Cost analysis reported in primary reference | |
| Risk of bias | ||
| Bias | Authors' judgement | Support for judgement |
| Random sequence generation (selection bias) | Unclear risk | Quote: "Randomisation was achieved by means of computerised alternative allocation and performed by an external agency". |
| Allocation concealment (selection bias) | Unclear risk | Quote: "Randomisation was achieved by means of computerised alternative allocation and performed by an external agency". |
| Blinding of participants and personnel (performance bias) All outcomes | High risk | GPs received copy of notes made for intervention group participants. Although GPs may have been unaware which participants were in the control group this may have influenced treatment that they prescribed to control participants, especially as the trialists "placed no restrictions on co‐interventions". |
| Blinding of outcome assessment (detection bias) Falls and fallers | Low risk | Falls reported by participants who were aware of their group allocation. Quote: "To ensure blinding during data collection, measurements by phone were contracted out to an independent call centre ..., whose operators were unaware of group allocation." |
| Incomplete outcome data (attrition bias) Fallers | Low risk | SeeAppendix 3 for method of assessment |
| Risk of bias in recall of falls | Low risk | Quote: "Participants recorded their falls continuously on a fall calendar during twelve months after baseline. They were contacted monthly by telephone by an independent call centre (MEMIC) to report the falls noted on the calendar". |
Hill 2000.
| Study characteristics | ||
| Methods | RCT | |
| Participants | Setting: Staffordshire, United Kingdom N = 78 Sample: people referred to falls assessment clinic (73% women) Age (years): mean 78.5 Inclusion criteria: history of recurrent falls referred to falls clinic Exclusion criteria: cognitive impairment | |
| Interventions | 1. Supervised group balance exercise and individualised fall prevention advice. Daily exercise, 2 x per wk 2. Control: standard fall prevention advice | |
| Outcomes | 1. Rate of falls | |
| Duration of the study | 6 months | |
| Notes | ||
| Risk of bias | ||
| Bias | Authors' judgement | Support for judgement |
| Random sequence generation (selection bias) | Unclear risk | Method of randomisation not described |
| Allocation concealment (selection bias) | Unclear risk | Insufficient information to permit judgement |
| Blinding of participants and personnel (performance bias) All outcomes | Unclear risk | Insufficient detail for judgement |
| Blinding of outcome assessment (detection bias) Falls and fallers | Unclear risk | Falls reported by participants who were aware of their group allocation. Unclear whether assessors collecting data were. |
| Incomplete outcome data (attrition bias) Falls | Low risk | SeeAppendix 3 for method of assessment |
| Risk of bias in recall of falls | High risk | Recall at end of study period (6 months) |
Hogan 2001.
| Study characteristics | ||
| Methods | RCT | |
| Participants | Setting: Calgary, Canada N = 163 Sample: high‐risk community‐dwelling men and women (72% women) Age (years): mean 77.6 (SD 6.8) Inclusion criteria: aged ≥ 65; fallen in previous 3 months; community‐dwelling; ambulatory (with or without aid); mentally intact (able to give consent) Exclusion criteria: qualifying fall resulted in lower extremity fracture, resulted from vigorous or high‐risk activities, because of syncope or acute stroke, or while undergoing active treatment in hospital | |
| Interventions | 1. One in‐home assessment by a geriatric specialist (doctor, nurse, physiotherapist, or OT) lasting 1 to 2 hours. Intrinsic and environmental risk factors assessed. Multidisciplinary case conference (20 min). Recommendations sent to patients and patients' doctor for implementation. Subjects referred to exercise class if problems with balance or gait and not already attending an exercise programme. Given instructions about exercises to do at home 2. Control: 1 home visit by recreational therapist | |
| Outcomes | 1. Rate of falls 2. Number of people falling 3. Number of fractures (not number of people sustaining a fracture) | |
| Duration of the study | 1 year | |
| Notes | ||
| Risk of bias | ||
| Bias | Authors' judgement | Support for judgement |
| Random sequence generation (selection bias) | Low risk | Computer‐generated. Stratified by number of falls in previous year: 1 or > 1. |
| Allocation concealment (selection bias) | Unclear risk | Sequence concealed in locked cabinet prior to randomisation |
| Blinding of participants and personnel (performance bias) All outcomes | Unclear risk | Participants and personnel not blind to allocated group but impact of non‐blinding unclear |
| Blinding of outcome assessment (detection bias) Falls and fallers | Low risk | Falls reported by participants who were aware of their group allocation. Quote: "The RA (research assistant) remained blinded throughout the study as to each subject's group assignment." |
| Blinding of outcome assessment (detection bias) Fractures | Unclear risk | No mention of whether fractures reported were confirmed |
| Incomplete outcome data (attrition bias) Falls | Unclear risk | SeeAppendix 3 for method of assessment |
| Incomplete outcome data (attrition bias) Fallers | Low risk | SeeAppendix 3 for method of assessment |
| Risk of bias in recall of falls | Unclear risk | Falls recorded on monthly calenders (47.8% returned). Also retrospective recall at 3, 6 months (at visit), and 12 months (by phone). |
Hornbrook 1994.
| Study characteristics | ||
| Methods | RCT (cluster‐randomised by household) | |
| Participants | Setting: USA N = 3182 (N = 2509 households) Sample: independently living members of HMO recruited by mail (62% women) Age (years): mean 73 (SD 6) Inclusion criteria: aged over 65; ambulatory; living within 20 miles of investigation site; consenting Exclusion criteria: blind; deaf; institutionalised; housebound; non‐English speaking; severely mentally ill; terminally ill; unwilling to travel to research centre | |
| Interventions | 1. Home visit, safety inspection (prior to randomisation), hazards booklet, repair advice, fall prevention classes (addressing environmental, behavioural, and physical risk factors), financial and technical assistance 2. Control: home visit, safety inspection (prior to randomisation), hazards booklet | |
| Outcomes | 1. Rate of falls 2. Number of people falling 3. Number sustaining a fracture | |
| Duration of the study | 23 months | |
| Notes | Cost description reported in primary reference. | |
| Risk of bias | ||
| Bias | Authors' judgement | Support for judgement |
| Random sequence generation (selection bias) | Unclear risk | Quote: "randomly assigned" |
| Allocation concealment (selection bias) | Unclear risk | Insufficient information to permit judgement |
| Blinding of participants and personnel (performance bias) All outcomes | Unclear risk | Participants and personnel not blind to allocated group but impact of non‐blinding unclear |
| Blinding of outcome assessment (detection bias) Falls and fallers | Low risk | Falls self reported by postcard, which prompted telephone interview. Quote: "Fall interviewers were blind to group assignment and did not include anyone who had interacted with participants during intervention sessions." |
| Blinding of outcome assessment (detection bias) Fractures | Unclear risk | Quote: "Fall interviewers were blind to group assignment and did not include anyone who had interacted with participants during intervention sessions." but "Fracture falls and hospitalised falls defined based on participant report" and not confirmed by the results of radiological examination or from primary care case records. |
| Incomplete outcome data (attrition bias) Falls | Unclear risk | SeeAppendix 3 for method of assessment. Insufficient information to permit judgement. |
| Incomplete outcome data (attrition bias) Fallers | Unclear risk | SeeAppendix 3 for method of assessment. Insufficient information to permit judgement. |
| Risk of bias in recall of falls | Low risk | Prospective. Returned a postcard after each fall. Also recorded falls on monthly diaries, and received quarterly mail/telephone contacts. |
Huang 2004.
| Study characteristics | ||
| Methods | RCT | |
| Participants | Setting: Hsin‐Chu County, Northwest Taiwan N = 120 Sample: persons in registered households (46% women) Age (years): mean 72 (SD 5.7) Inclusion criteria: aged ≥ 65; community‐dwelling; cognitively intact Exclusion criteria: none stated | |
| Interventions | 1. 3 home visits over 4 months (HV1, HV2, and HV3) by a nurse
HV1: risk assessment (medications and environmental hazards)
HV2: 2 months later: standard fall prevention brochure plus individualised verbal teaching and brochure relating to fall risk factors identified at HV1
HV3: assessment and collection of falls data 2. Control: HV1: risk assessment HV2: standard fall prevention brochure HV3: assessment and collection of falls data |
|
| Outcomes | 1. Number of people falling Other outcomes reported but not included in this review |
|
| Duration of the study | 4 months | |
| Notes | ||
| Risk of bias | ||
| Bias | Authors' judgement | Support for judgement |
| Random sequence generation (selection bias) | Unclear risk | Method of randomisation not described. Quote: "In applying cluster sampling, half of the sample was randomly assigned to the experimental group, and the other half as the comparison group". |
| Allocation concealment (selection bias) | Unclear risk | Insufficient information to permit judgement |
| Blinding of participants and personnel (performance bias) All outcomes | Unclear risk | Participants may have been unaware of which group they were in but personnel not blind to allocated group. Impact of non‐blinding unclear. |
| Blinding of outcome assessment (detection bias) Falls and fallers | High risk | Falls self reported. Researcher who carried out the intervention also collected "Falls Record Checklist" at second and third home visits. |
| Incomplete outcome data (attrition bias) Fallers | High risk | SeeAppendix 3 for method of assessment |
| Risk of bias in recall of falls | Low risk | Prospective. Self reported falls recorded on a Falls Record Checklist for the 2 months after the intervention visit. |
Huang 2005.
| Study characteristics | ||
| Methods | RCT | |
| Participants | Setting: hospital, northern Taiwan N = 141 Sample: people in hospital with a fall‐related hip fracture (69% women) Age (years): mean 77 (SD 7.6) Inclusion criteria: in hospital with fall‐related hip fracture; aged ≥ 65; discharged within medical centre catchment area Exclusion criteria: cognitively impaired; too ill (comorbidities, unable to communicate or in intensive care unit) | |
| Interventions | 1. Discharge planning intervention by masters‐level gerontological nurse, from hospital admission until 3 months after discharge (first visit within 48 hours of admission, seen every 48 hours while in hospital, 1 home visit 3 to 7 days after discharge, available by phone 8am ‐ 8pm 7 days/wk, phoned participant or care‐giver once a week). Nurse created individualised discharge plan and facilitated set up of home‐care services etc. Participants provided with brochures on self care for hip fracture patients and fall prevention (environmental safety and medication issues). Nurse provided direct care and education on correct use of assistive devices, assessed rehabilitation needs, and collaborated with physicians to modify therapies. 2. Control: usual discharge planning also by nurses, but not specialists. No brochures, written discharge summaries, home visits, or phone calls. | |
| Outcomes | 1. Number of people falling Other outcomes reported but not included in this review |
|
| Duration of the study | 3 months | |
| Notes | Majority were community‐dwelling as states "the majority of older people with hip fracture who are discharged from hospital are at home..." Intervention included a home visit. 91% living with family. | |
| Risk of bias | ||
| Bias | Authors' judgement | Support for judgement |
| Random sequence generation (selection bias) | Low risk | Randomly assigned using a computer‐generated table |
| Allocation concealment (selection bias) | Unclear risk | Insufficient information to permit judgement |
| Blinding of participants and personnel (performance bias) All outcomes | Unclear risk | The discharge planning in the intervention group was conducted by a full‐time geriatric nurse. Discharge planning in the control group was conducted by general nurses. Impact of non‐blinding of participants and personnel unclear. |
| Blinding of outcome assessment (detection bias) Falls and fallers | Unclear risk | Falls reported by participants who would have some knowledge of their group allocation. Research assistant stated to be blinded on page 1194, but on page 1295 to have conducted the allocation to groups. Unclear whether same research assistant carried out assessments. |
| Incomplete outcome data (attrition bias) Fallers | Low risk | SeeAppendix 3 for method of assessment |
| Risk of bias in recall of falls | Unclear risk | Falls data collected using falls diary. Appear to have been interviewed at 2 weeks and 3 months. No mention of diaries being returned by post. |
Huang 2010.
| Study characteristics | ||
| Methods | RCT (cluster‐randomised by village). Not analysed as factorial design | |
| Participants | Setting: Taipei, Taiwan
N = 261 (N = 4 villages)
Sample: people registered as living in 4 randomly selected villages (48% women after loss to follow‐up)
Age (years): mean 71.5 (SD 0.64) in people not lost to follow‐up
Inclusion criteria: aged > 65 years; living in a non‐organised community of Taiwan Exclusion criteria: immobile; living outside registered living area |
|
| Interventions | 1. Education: 5 group teaching sessions over 5 months (medications, nutrition, environment (inside and outside), footwear) plus discussion 2. Tai Chi Chuan: 13 simple movements, 40 min, 3 x per wk for 20 wks 3. Tai Chi Chuan + education 4. Control |
|
| Outcomes | 1. Number of people falling | |
| Duration of the study | 5 months and 18 months | |
| Notes | Reported results not adjusted for clustering. Raw data at 5 months used in the review and adjusted for clustering. No raw data for 18 months so not possible to adjust for clustering. | |
| Risk of bias | ||
| Bias | Authors' judgement | Support for judgement |
| Random sequence generation (selection bias) | Unclear risk | Quote: "The three intervention groups and one control group were then assigned randomly to one each of the four selected villages." |
| Allocation concealment (selection bias) | High risk | Individual participant recruitment was undertaken after group allocation of the 4 villages. There was no mention of active blinding of research team members recruiting participants. |
| Blinding of participants and personnel (performance bias) All outcomes | High risk | Interventions (Tai Chi, education classes) were such that it was not possible to blind either participants or those delivering the interventions |
| Blinding of outcome assessment (detection bias) Falls and fallers | Unclear risk | Insufficient information to permit judgement |
| Incomplete outcome data (attrition bias) Fallers | High risk | SeeAppendix 3 for method of assessment |
| Risk of bias in recall of falls | Unclear risk | No mention of how falls were monitored |
Huang 2011.
| Study characteristics | ||
| Methods | RCT | |
| Participants | Setting: Yi‐Lan county, Taiwan N = 186 Sample: randomly selected sample of registered households in Yi‐Lan county (59% women) Age (years): not stated Inclusion criteria: aged ≥ 60; community‐dwelling; able to communicate in Mandarin or Taiwanese Exclusion criteria: cognitively impaired; artificial leg or leg brace; unstable health problems or terminally ill | |
| Interventions | 1. Cognitive behavioural intervention: 60 to 90 min 1 x per wk for 8 wks, in groups of 8 to 12. Promoting view that fall risk and fear of falling is controllable 2. Cognitive behavioural intervention + intense Tai Chi: as above plus Tai Chi 60 min, 5 x per wk for 8 wks, in groups of 10 to 16 3. Control: no intervention |
|
| Outcomes | 1. Rate of falls 2. Number of people falling Other outcomes not included in this review |
|
| Duration of the study | 5 months (3‐month follow‐up after intervention completed) | |
| Notes | Fear of falling the primary outcome | |
| Risk of bias | ||
| Bias | Authors' judgement | Support for judgement |
| Random sequence generation (selection bias) | Low risk | Quote: "The first author used a computer‐developed random table to randomly assign patients to three intervention groups … " |
| Allocation concealment (selection bias) | Low risk | Quote: "Allocation was concealed from the recruiting RA" |
| Blinding of participants and personnel (performance bias) All outcomes | High risk | Participants and personnel not blind to allocation and self reported falls |
| Blinding of outcome assessment (detection bias) Falls and fallers | Low risk | Quote: "Participants in all three groups were assessed in their homes for outcomes at baseline, 2 months, and 5 months by an RA blinded to their group allocation." Outcomes include falls. |
| Incomplete outcome data (attrition bias) Falls | Low risk | SeeAppendix 3 for method of assessment |
| Incomplete outcome data (attrition bias) Fallers | Low risk | SeeAppendix 3 for method of assessment |
| Risk of bias in recall of falls | Unclear risk | Quote: "Participants in all three groups were assessed in their homes for outcomes (see below) at baseline, 2 months, and 5 months by an RA blinded to their group allocation." "Number of falls was recorded using the Falls Record Checklist (Huang & Acton 2004), which has a calendar for participants to circle dates when a fall occurred." Unclear whether falls were recorded concurrently or retrospectively at 2‐month and 5‐month assessments. No regular telephone follow‐up described. |
Iwamoto 2009.
| Study characteristics | ||
| Methods | RCT | |
| Participants | Setting: Tokyo, Japan N = 68 Sample: volunteer patients from Department of Orthopaedic Surgery (2 hospitals) and Orthopaedic Clinics (3) (90% women) Age (years): mean 76.4 (SD 5.6), range 66 to 88 Inclusion criteria: aged > 50 years; fully ambulatory; able to complete physical assessments Exclusion criteria: using walking aids; severe kyphosis due to osteoporotic vertebral fractures; acute illness; severe cardiovascular disease | |
| Interventions | 1. Exercise: supervised daily exercise programme, in clinic or hospital: 30 min, 3 x per wk for 20 wks 2. Control: no exercise |
|
| Outcomes | 1. Rate of falls 2. Number of people falling 3. Number sustaining a fracture |
|
| Duration of the study | 5 months | |
| Notes | Place of residence not specified, i.e. not specifically community‐dwelling, but not preventing falls in hospital or specifically in an institution | |
| Risk of bias | ||
| Bias | Authors' judgement | Support for judgement |
| Random sequence generation (selection bias) | Unclear risk | Quote: "The subjects were randomly divided into two groups ..." |
| Allocation concealment (selection bias) | Unclear risk | Quote: "The subjects were randomly divided into two groups ..." |
| Blinding of participants and personnel (performance bias) All outcomes | High risk | Participants and personnel not blinded to allocation and falls were self reported. Control group received no intervention but were aware of study aims. |
| Blinding of outcome assessment (detection bias) Falls and fallers | Unclear risk | Insufficient information to permit judgement |
| Blinding of outcome assessment (detection bias) Fractures | High risk | Fractures appear to be self reported with no confirmation from medical records |
| Incomplete outcome data (attrition bias) Falls | Low risk | SeeAppendix 3 for method of assessment. Insufficient information to permit judgement. |
| Incomplete outcome data (attrition bias) Fallers | Low risk | SeeAppendix 3 for method of assessment |
| Risk of bias in recall of falls | High risk | Quote: "The incidence of fall and fracture … was assessed 2.5 and 5 months after the start of the trial. In particular, information regarding falls and fractures was obtained every week by directly asking the participants." No mention of diaries or calendars. Retrospective recall. Possibly only the intervention group were asked every week (at class) and remainder at 2.5 and 5 months. |
Jitapunkul 1998.
| Study characteristics | ||
| Methods | RCT | |
| Participants | Setting: Thailand N = 160 Sample: people recruited from a sample for a previous study (65% women) Age (years): mean 75.6 (SD 5.8) Inclusion criteria: aged ≥ 70; living at home Exclusion criteria: none stated | |
| Interventions | 1. Home visit from non‐professional personnel with structured questionnaire. 3‐monthly visits for 3 years. Referred to nurse/geriatrician (community‐based) if Barthel ADL index and/or Chula ADL index declined ≥ 2 points, or ≥ 1 fall in previous 3 months. Nurse/geriatrician would visit, assess, educate, prescribe drugs/aids, provide rehabilitation programme, make referrals 2. Control: no intervention. Visit at the end of 3 years | |
| Outcomes | 1. Number of people falling | |
| Duration of the study | Falls measured at the end of 3 years. Falls during previous 3 months only. | |
| Notes | ||
| Risk of bias | ||
| Bias | Authors' judgement | Support for judgement |
| Random sequence generation (selection bias) | Unclear risk | Quote: "... divided into case group (n = 80) and control group (n = 80) at random." Insufficient information to permit judgement. |
| Allocation concealment (selection bias) | Unclear risk | Insufficient information to permit judgement |
| Blinding of participants and personnel (performance bias) All outcomes | Unclear risk | Participants and personnel not blind to allocated group but impact of non‐blinding unclear |
| Blinding of outcome assessment (detection bias) Falls and fallers | High risk | Falls reported by participants who were aware of their group allocation to personnel who were aware of group allocation. Possible bias. Intervention group provided falls data every 3 months for 3 years, but control group received only 1 visit in which falls data were collected. |
| Incomplete outcome data (attrition bias) Fallers | High risk | SeeAppendix 3 for method of assessment |
| Risk of bias in recall of falls | High risk | Retrospective, and different methods used in the 2 groups. Intervention group provided falls data every 3 months for 3 years, but falls data for control group only collected at exit assessment at 3 years, and data for preceding 3 months only. |
Kamide 2009.
| Study characteristics | ||
| Methods | RCT | |
| Participants | Setting: Kanagawa, Japan
N = 57
Sample: women registered at an employment agency for older people (see Notes)
Age (years): mean 71 (SD 3.6)
Inclusion criteria: aged ≥ 65 years; community‐dwelling; independently mobile; no restriction on physical activities Exclusion criteria: cerebrovascular, cardiopulmonary, neuromuscular, liver, or kidney disease; hyperparathyroidism; unstable diabetes mellitus or hypertension; fracture of spine or lower limbs; taking prednisolone; exercising regularly |
|
| Interventions | 1. Home‐based exercise at least 3 days/wk for 24 wks. Initial 1‐hour educational session plus 1‐hour exercise instruction by PT. Exercise: stretching, moderate intensity lower‐limb strength training, balance training, impact training. No home visits but telephone or mail contact monthly. 2. Control: usual activities. Telephone or mail contact from PT every 3 months |
|
| Outcomes | 1. Number of people falling | |
| Duration of the study | Falls data for previous 6 months collected retrospectively at the end of 12 months follow‐up | |
| Notes | Employment agency providing light work or volunteer activities for older people and encouraging social activities | |
| Risk of bias | ||
| Bias | Authors' judgement | Support for judgement |
| Random sequence generation (selection bias) | Low risk | Quote: "The random assignment procedure was performed using random numbers generated by a computer program ..." |
| Allocation concealment (selection bias) | Unclear risk | Quote: "The subjects were randomly assigned to either the home‐based exercise group or the control group". Insufficient information to permit judgement. |
| Blinding of participants and personnel (performance bias) All outcomes | High risk | Participants and therapists aware of group allocation with potential for performance bias. Intervention group: "the therapist contacted each subject by telephone or mail every month to maintain their motivation." Control group: "The subjects who were assigned to the control group were instructed to continue with their usual daily activities, with no restrictions on their exercise activities. A therapist contacted them every 3 months by telephone or mail." |
| Blinding of outcome assessment (detection bias) Falls and fallers | Low risk | Quote: "Functional capacity, physical function, and bone mineral density were assessed in all subjects in both groups before and after the 6‐month intervention. The staff performing the assessments were blinded to each subject's group assignment. Falls were also assessed before and after the 12‐month followup." |
| Incomplete outcome data (attrition bias) Falls | Unclear risk | SeeAppendix 3 for method of assessment |
| Incomplete outcome data (attrition bias) Fallers | High risk | SeeAppendix 3 for method of assessment |
| Risk of bias in recall of falls | High risk | Quote: "Falls were also assessed before and after the 12‐month followup." No concurrent recording described. No mention of frequent telephone monitoring. |
Kärkkäinen 2010.
| Study characteristics | ||
| Methods | RCT | |
| Participants | Setting: Kuopio, Finland N = 3432 Sample: women from the OSTPRE (Osteoporosis Risk Factor and Prevention Study) cohort Age (years): mean 67.3 (SD 1.8) Inclusion criteria: aged 65 or older at end of November 2002; living in the Kuopio province area Exclusion criteria: not belonging to OSTPRE bone densitometry sample | |
| Interventions | 1. Cholecalciferol 800 IU + calcium carbonate 1000 mg daily 2. Control: no supplementation | |
| Outcomes | 1. Rate of falls 2. Number of fallers 3. Number sustaining a fracture 4. Number with adverse effects |
|
| Duration of the study | 3 years | |
| Notes | ||
| Risk of bias | ||
| Bias | Authors' judgement | Support for judgement |
| Random sequence generation (selection bias) | Low risk | Quote: "Randomization was performed with SPSS ... statistical software without any blocking or stratification." |
| Allocation concealment (selection bias) | Unclear risk | Quote: "… randomized into intervention (n = 1718) and control (n = 1714) groups by an based on simple randomization. " "The subjects were informed by letter to which group they were randomized. The letter contained information concerning the trial and the prescription for the intervention." Unclear whether person sending letter was blind to allocation. |
| Blinding of participants and personnel (performance bias) All outcomes | High risk | Quote: "OSTPRE‐FPS was conducted as an open‐label trial and neither placebo control nor blinding was applied." |
| Blinding of outcome assessment (detection bias) Falls and fallers | High risk | Quote: "OSTPRE‐FPS was an open trial and neither placebo control nor blinding was applied." |
| Blinding of outcome assessment (detection bias) Fractures | Low risk | Period of recall differed between the randomly selected subgroup and the remaining sample. Quote: "However, the average time of phone contacts was similar in both groups." Quote: "All self‐reported fractures were validated using medical records or radiologic reports. Only fractures with radiologic confirmation were regarded as valid fractures, with the exception of rib fractures, for which a physician's clinical diagnosis was regarded as valid." |
| Incomplete outcome data (attrition bias) Falls | Low risk | SeeAppendix 3 for method of assessment |
| Incomplete outcome data (attrition bias) Fallers | Low risk | SeeAppendix 3 for method of assessment |
| Risk of bias in recall of falls | High risk | Retrospective recall over a long period of time with no concurrent recording described. Period of recall differed between the randomly selected subgroup and the remaining sample. Quote: "However, the average time of phone contacts was similar in both groups." Quote: "The participants in the subsample were telephoned at 4‐month intervals to record the incidence and circumstances of falls ... " "The rest of the trial population was interviewed by phone once a year between January and April during the trial." |
Kemmler 2010.
| Study characteristics | ||
| Methods | RCT | |
| Participants | Setting: Erlangen‐Nuremberg area, Germany
N = 246
Sample: women members of Siemens Health Insurance living in Erlangen‐Nuremberg area
Age (years): mean 69 (SD 4)
Inclusion criteria: aged ≥ 65; community‐dwelling; consenting Exclusion criteria: diseases affecting bone metabolism or fall risk; medication affecting bone metabolism or fall risk; history of profound coronary heart diseases (stroke, cardiac events), acute or chronic inflammatory diseases, or secondary osteoporosis; participation in exercise studies during previous 2 years; very low physical capacity (< 50 W during ergometry) |
|
| Interventions | 1. Intervention: progressive high‐intensity exercise programme (group classes in gymnasium 60 min, 2 x per wk): warm up, static and dynamic balance training, functional gymnastics, isometric strength training, and stretching for trunk, hip, and thigh, and upper body exercises using elastic belts + progressive home training sessions (20 min, 2 x per wk) emphasising strength and flexibility. 2. Control: low to moderate intensity (low frequency) "Wellness programme" (not progressive) (1 hour, 1 x per wk for 10 wks then 10 wk rest): relaxation, games/interaction, general co‐ordination, endurance, balance, dances, body sensitivity, muscle strength, breathing, and flexibility |
|
| Outcomes | 1. Rate of falls
2. Number of people falling 3. Number of fractures (not number of people with fracture) Other outcomes reported but not included in this review |
|
| Duration of the study | 18 months | |
| Notes | Cost analysis in primary reference | |
| Risk of bias | ||
| Bias | Authors' judgement | Support for judgement |
| Random sequence generation (selection bias) | Low risk | Quote: "computer‐generated block randomization" |
| Allocation concealment (selection bias) | Low risk | Quote: "Computer‐generated block randomization stratified for age performed by an independent statistician." "The allocation sequence and group assignment were performed by the Institute of Biometry and Epidemiology. Participants were enrolled by the Institute of Medical Physics." |
| Blinding of participants and personnel (performance bias) All outcomes | Low risk | Quote: "The study was blinded for the outcome assessors and participants ..." "To blind the participants, the control group performed a program that focused on well‐being and was designed not to cause physical adaptations" "The effectiveness of the blinding in the control group was proven in structured interviews conducted by the primary investigators at the end of the 18 months" |
| Blinding of outcome assessment (detection bias) Falls and fallers | Low risk | Falls reported by participants who were aware of their group allocation. Outcome assessors were blind to allocation. |
| Blinding of outcome assessment (detection bias) Fractures | Unclear risk | Quote: "The study was blinded for the outcome assessors". No report of radiological confirmation of fractures. |
| Incomplete outcome data (attrition bias) Falls | Low risk | SeeAppendix 3 for method of assessment |
| Incomplete outcome data (attrition bias) Fallers | Unclear risk | SeeAppendix 3 for method of assessment. Insufficient information to permit judgement |
| Risk of bias in recall of falls | Low risk | Quote: "Injurious falls and overall fractures were monitored daily with the use of fall calendars compiled by the participants. Outcome assessors contacted subjects who fell and nonresponders monthly by telephone." |
Kenny 2001.
| Study characteristics | ||
| Methods | RCT | |
| Participants | Setting: Cardiovascular Investigation Unit, Newcastle, United Kingdom N = 175 Sample: individuals presenting at A&E with non‐accidental fall (59% women) Age (years): mean 73 (SD 10) Inclusion criteria: aged ≥ 50; history of a non‐accidental fall; diagnosed as having cardioinhibitory CSH Exclusion criteria: cognitive impairment; medical explanation of fall within 10 days of presentation; blind; lived > 15 miles from A&E; had contraindication to CSM; receiving medications known to cause a hypersensitive response to CSM | |
| Interventions | 1. Pacemaker (rate drop response physiologic dual‐chamber pacemaker: Thera RDR, Medtronic, Minneapolis, Minnesota) 2. Control: no pacemaker | |
| Outcomes | 1. Rate of falls
2. Number sustaining a fracture Other outcomes reported but not included in this review |
|
| Duration of the study | 1 year after randomisation | |
| Notes | Out of 3384 A&E attendees with non‐accidental falls, 257 were diagnosed as having carotid sinus hypersensitivity. 175 of these were randomised, i.e. 5% of non‐accidental falls. | |
| Risk of bias | ||
| Bias | Authors' judgement | Support for judgement |
| Random sequence generation (selection bias) | Unclear risk | Quote: "Randomised ... block randomisation; in blocks of eight". Method of sequence generation not described. |
| Allocation concealment (selection bias) | Unclear risk | Insufficient information to permit judgement |
| Blinding of participants and personnel (performance bias) All outcomes | Unclear risk | Participants and personnel not blind to allocated group but impact of non‐blinding unclear |
| Blinding of outcome assessment (detection bias) Falls and fallers | Unclear risk | Falls reported by participants who were aware of their group allocation. Blinding of assessment personnel not mentioned in report. Insufficient evidence to make judgement. |
| Blinding of outcome assessment (detection bias) Fractures | Unclear risk | Insufficient information in the report to permit judgement |
| Incomplete outcome data (attrition bias) Falls | Low risk | SeeAppendix 3 for method of assessment |
| Risk of bias in recall of falls | Low risk | Prospective. Falls recorded daily on self completion diary cards which were returned at the end of each week for 1 year. |
Kingston 2001.
| Study characteristics | ||
| Methods | RCT | |
| Participants | Setting: A&E, Staffordshire, United Kingdom N = 109 Sample: community‐dwelling women attending A&E with a fall Age (years): mean 71.9 Inclusion criteria: female; aged 65 to 79; history of a fall; discharged directly to own home Exclusion criteria: admitted from A&E to hospital or any form of institutional care | |
| Interventions | 1. Rapid Health Visitor intervention within 5 working days of index fall: pain control and medication, how to get up after a fall, education about risk factors (environmental and drugs, alcohol etc), advice on diet and exercise to strengthen muscles and joints. 2. Control: usual post fall treatment, i.e. letter to GP from A&E detailing the clinical event, any interventions carried out in hospital and recommendations about follow‐up | |
| Outcomes | 1. Number of people falling Falls not primary outcome of study. Other outcomes reported but not included in this review |
|
| Duration of the study | 12 wks | |
| Notes | ||
| Risk of bias | ||
| Bias | Authors' judgement | Support for judgement |
| Random sequence generation (selection bias) | Unclear risk | Quote: "randomly allocated" |
| Allocation concealment (selection bias) | Unclear risk | Quote: "randomly allocated". Insufficient information to permit judgement. |
| Blinding of participants and personnel (performance bias) All outcomes | Unclear risk | Participants and personnel not blind to allocated group but impact of non‐blinding unclear |
| Blinding of outcome assessment (detection bias) Falls and fallers | Low risk | Quote: "Both groups ... were assessed by face‐to‐face interview with an independent researcher at baseline ..." and "... by the same researcher 12 weeks after the fall" |
| Incomplete outcome data (attrition bias) Fallers | Low risk | SeeAppendix 3 for method of assessment |
| Risk of bias in recall of falls | High risk | Quote: "Falls were recorded at week twelve assessment" (information from author) |
Korpelainen 2006.
| Study characteristics | ||
| Methods | RCT | |
| Participants | Setting: Oulu, Finland N = 160 Sample: birth cohort of women Age (years): mean 73 (SD 1.2) Inclusion criteria: hip BMD > 2 less than the reference value Exclusion criteria: "medical reasons"; use of a walking aid other than a stick; bilateral total hip joint replacement; unstable chronic illness; malignancy; medication known to affect bone density; severe cognitive impairment; involvement in other interventions | |
| Interventions | 1. Supervised exercise programme (physiotherapist led). Mixed home and supervised group programme plus twice yearly seminars on nutrition, health, medical treatment and fall prevention 2. Control: twice yearly seminars on nutrition, health, medical treatment, and fall prevention | |
| Outcomes | 1. Rate of falls 2. Number sustaining a fracture | |
| Duration of the study | 30 months | |
| Notes | ||
| Risk of bias | ||
| Bias | Authors' judgement | Support for judgement |
| Random sequence generation (selection bias) | Low risk | Quote: "Each participant received sequentially, according to the original identification numbers, the next random assignment in the computer list". |
| Allocation concealment (selection bias) | Low risk | The randomisation was "provided by a technical assistant not involved in the conduction of the trial." |
| Blinding of participants and personnel (performance bias) All outcomes | Unclear risk | Participants and personnel not blind to allocated group but impact of non‐blinding unclear |
| Blinding of outcome assessment (detection bias) Falls and fallers | Low risk | Falls reported by participants who were aware of their group allocation. Assessors blind to allocation. |
| Blinding of outcome assessment (detection bias) Fractures | Low risk | Fractures reported by participants who were aware of their group allocation. Assessors blind to allocation. Quote: "In the event of a need for medical treatment, the self reported information was checked from the medical records." |
| Incomplete outcome data (attrition bias) Falls | Low risk | SeeAppendix 3 for method of assessment |
| Risk of bias in recall of falls | High risk | 3‐monthly retrospective recall |
Lannin 2007.
| Study characteristics | ||
| Methods | RCT | |
| Participants | Setting: Sydney, Australia N = 10 Sample: patients admitted to a rehabilitation facility and referred to OT (80% women) Age (years): mean 81 (SD 7) Inclusion criteria: mild or no cognitive impairment; community‐dwelling (non institutional); aged 65 or older; no medical contraindications that would require strict adherence to equipment recommendations Exclusion criteria: none | |
| Interventions | 1. Best practice occupational therapy home visit intervention 2. Control: standard practice in‐hospital assessment and education | |
| Outcomes | 1. Number of people falling | |
| Duration of the study | 3 months | |
| Notes | Pilot study | |
| Risk of bias | ||
| Bias | Authors' judgement | Support for judgement |
| Random sequence generation (selection bias) | Low risk | Allocation schedule computer‐generated |
| Allocation concealment (selection bias) | Low risk | Quote: "Concealed in opaque, consecutively numbered envelopes by a person not involved in the study." |
| Blinding of participants and personnel (performance bias) All outcomes | Unclear risk | Participants and personnel not blind to allocated group but impact of non‐blinding unclear |
| Blinding of outcome assessment (detection bias) Falls and fallers | Low risk | Falls reported by participants who were aware of their group allocation. Quote: "The assessor was blinded to group allocation." |
| Incomplete outcome data (attrition bias) Fallers | High risk | SeeAppendix 3 for method of assessment |
| Risk of bias in recall of falls | Unclear risk | Interval recall. Falls ascertained by assessor at home visit at 2 weeks, and 1, 2 and 3 months after discharge. |
Latham 2003.
| Study characteristics | ||
| Methods | RCT (factorial design) | |
| Participants | Setting: 5 hospitals in Auckland, New Zealand and Sydney, Australia N = 243 Sample: frail older people recently discharged from hospital (53% women) Age (years): mean 79 Inclusion criteria: aged ≥ 65, considered frail (one or more health problems, e.g. dependency in an ADL, prolonged bed rest, impaired mobility, or a recent fall); no clear indication or contraindication to either of the study treatments Exclusion criteria: poor prognosis and unlikely to survive 6 months; severe cognitive impairment; physical limitations that would limit adherence to exercise programme; unstable cardiac status; large ulcers around ankles that would preclude use of ankle weights; living outside hospitals' geographical zone; not fluent in English | |
| Interventions | 1. Exercise: quadriceps exercises using adjustable ankle cuff weights 3 x per wk for 10 wks. First 2 sessions in hospital, remainder at home. Monitored weekly by physiotherapist: alternating home visit with telephone calls. 2. "Attention" control: frequency matched telephone calls and home visits from research physical therapist including general enquiry about recovery, general advice on problems, support 3. Vitamin D: single oral dose of six 1.25 mg calciferol (300,000 IU) 4. Vitamin D control: placebo tablets | |
| Outcomes | 1. Rate of falls
2. Number of people falling
3. Number of people with adverse effects from exercise (not vitamin D) Other outcomes reported but not included in this review |
|
| Duration of the study | 6 months | |
| Notes | Detailed description of exercise regimen given in paper | |
| Risk of bias | ||
| Bias | Authors' judgement | Support for judgement |
| Random sequence generation (selection bias) | Low risk | Study biostatistician‐generated random sequence. Block randomisation technique. |
| Allocation concealment (selection bias) | Low risk | Computerised centralised randomisation scheme |
| Blinding of participants and personnel (performance bias) All outcomes | Low risk | Trial with 4 arms with varying risk of bias (factorial design). 2 arms double‐blind, placebo‐controlled (low risk) and 2 arms exercise and attention control with matched frequency of visits where impact of non‐blinding likely to be low or unclear. |
| Blinding of outcome assessment (detection bias) Falls and fallers | Low risk | Falls reported by participants who were blinded to group allocation (placebo‐controlled arms) and assessor blind to group allocation. Falls reported by participants who were aware of their group allocation (exercise and exercise control arms) but assessor blind to group allocation. |
| Incomplete outcome data (attrition bias) Falls | Low risk | SeeAppendix 3 for method of assessment |
| Incomplete outcome data (attrition bias) Fallers | Low risk | SeeAppendix 3 for method of assessment |
| Risk of bias in recall of falls | Low risk | Prospective. Falls recorded in fall diary with weekly reminders for first 10 weeks. Nurses examined fall diaries and sought further details about each fall at 3 and 6‐month visits. Reminder phone call between visits. |
Li 2005.
| Study characteristics | ||
| Methods | RCT | |
| Participants | Setting: Legacy Health System, Portland, Oregon, USA N = 256 Sample: people enrolled in health maintenance organisation (70% women) Age (years): mean 77.5 (SD 5), range 70 to 92 Inclusion criteria: age ≥ 70; physician clearance to participate; inactive (no moderate to strenuous activity in last 3 months); walks independently Exclusion criteria: chronic medical problems that would limit participation; cognitive impairment | |
| Interventions | 1. Exercise intervention: Tai Chi 1 hour, 3 x per wk for 26 wks 2. Control: low‐level stretching 1 hour, 3 x per wk for 26 wks | |
| Outcomes | 1. Rate of falls 2. Number of people falling Other outcomes reported but not included in this review | |
| Duration of the study | 1 year | |
| Notes | ||
| Risk of bias | ||
| Bias | Authors' judgement | Support for judgement |
| Random sequence generation (selection bias) | Low risk | Computer‐generated random numbers |
| Allocation concealment (selection bias) | Unclear risk | Insufficient information to permit judgement |
| Blinding of participants and personnel (performance bias) All outcomes | Unclear risk | Participants and personnel not blind to allocated group but impact of non‐blinding unclear |
| Blinding of outcome assessment (detection bias) Falls and fallers | Low risk | Falls reported by participants who were aware of their group allocation. Fall diaries coded by blinded research assistant. |
| Incomplete outcome data (attrition bias) Falls | High risk | SeeAppendix 3 for method of assessment |
| Incomplete outcome data (attrition bias) Fallers | High risk | SeeAppendix 3 for method of assessment |
| Risk of bias in recall of falls | Low risk | Prospective. Quote: "... recorded by each participant in a daily "fall calendar." Collected on a monthly basis. |
Lightbody 2002.
| Study characteristics | ||
| Methods | RCT | |
| Participants | Setting: hospital, Liverpool, United Kingdom N = 348 Subjects: consecutive patients attending A&E with a fall (74% women) Age (years): median (IQR) 75 (70 to 81) Inclusion criteria: aged > 65, patients attending A&E with a fall Exclusion criteria: admitted to hospital as result of index fall, living in institutional care, refused or unable to consent, lived out of the area | |
| Interventions | 1. Multifactorial assessment by falls nurse at 1 home visit (medication, ECG, blood pressure, cognition, visual acuity, hearing, vestibular dysfunction, balance, mobility, feet and footwear, environmental assessment). Referral for specialist assessment or further action (relatives, community therapy services, social services, primary care team. No referrals to day hospital or hospital outpatients). Advice and education about home safety and simple modifications, e.g. mat removal 2. Control: usual care | |
| Outcomes | 1. Rate of falls
2. Number of people falling 3. Number sustaining a fracture Other outcomes reported but not included in this review |
|
| Duration of the study | 6 months | |
| Notes | Assessment of risk factors: medication, ECG, blood pressure, cognition, visual acuity, hearing, vestibular dysfunction, balance, mobility, feet and footwear. Environmental assessment. Falls reported in diary and by questionnaire different | |
| Risk of bias | ||
| Bias | Authors' judgement | Support for judgement |
| Random sequence generation (selection bias) | Unclear risk | Quote: "Patients were block‐randomized consecutively to groups". Insufficient information to permit judgement. |
| Allocation concealment (selection bias) | Unclear risk | Insufficient information to permit judgement |
| Blinding of participants and personnel (performance bias) All outcomes | Unclear risk | Participants and personnel not blind to allocated group but impact of non‐blinding unclear |
| Blinding of outcome assessment (detection bias) Falls and fallers | Unclear risk | Participants completed a falls diary for up to 6 months. Postal questionnaires completed at 6 months. Insufficient information to permit judgement. |
| Blinding of outcome assessment (detection bias) Fractures | Low risk | Quote: "Further falls, consequent injury and subsequent place of treatment (i.e. GP, hospital) were recorded." Quote: "GP records were reviewed and hospital databases interrogated for attendances and admissions." |
| Incomplete outcome data (attrition bias) Falls | Low risk | SeeAppendix 3 for method of assessment |
| Incomplete outcome data (attrition bias) Fallers | Low risk | SeeAppendix 3 for method of assessment |
| Risk of bias in recall of falls | Low risk | Prospective. Falls, injury, and treatment recorded in diary. Postal questionnaire at 6 months to collect data. GP records and hospital databases searched. |
Lin 2007.
| Study characteristics | ||
| Methods | RCT | |
| Participants | Setting: Taiwan N = 150 Sample: residents of rural agricultural area (51% women) Age (years): mean 76.5 Inclusion criteria: medical attention for a fall in previous 4 wks, ≥ 65 years Exclusion criteria: none described | |
| Interventions | 1. Home‐based exercise training (physiotherapist) 2. Home safety assessment and modification (public health worker) 3. Control: "education". 1 social visit 30 to 40 min every 2 wks for 4 months with fall prevention pamphlets provided (public health worker) | |
| Outcomes | 1. Rate of falls Other outcomes reported but not included in this review |
|
| Duration of the study | 6 months | |
| Notes | ||
| Risk of bias | ||
| Bias | Authors' judgement | Support for judgement |
| Random sequence generation (selection bias) | Unclear risk | Block randomised. Insufficient information to permit judgement. |
| Allocation concealment (selection bias) | Unclear risk | Insufficient information to permit judgement |
| Blinding of participants and personnel (performance bias) All outcomes | Unclear risk | Participants and personnel not blind to allocated group but impact of non‐blinding unclear |
| Blinding of outcome assessment (detection bias) Falls and fallers | Unclear risk | Quote: "Participants were asked to report their falls by telephone or postcard; they were also contacted by telephone every 2 weeks to ascertain the occurrence of falling". Blinding of assessors not reported. |
| Incomplete outcome data (attrition bias) Falls | High risk | High risk of bias for both home‐based exercise versus control and home safety intervention versus control. SeeAppendix 3 for method of assessment. |
| Risk of bias in recall of falls | Low risk | Prospective. Reported falls by telephone or postcard when they occurred. Phoned every 2 weeks to ascertain occurrence of falls. |
Liu‐Ambrose 2004.
| Study characteristics | ||
| Methods | RCT | |
| Participants | Setting: British Colombia (BC), Canada N = 104 Sample: women with osteoporosis or osteopenia diagnosed at BC Women's Hospital and Health Centre; individuals with low BMD identified through Osteoporosis Society of Canada; advertising Age (years): mean 79 (SD 3), range 75 to 85 Inclusion criteria: women aged 75 to 85; osteoporosis or osteopenia (BMD total hip or spine T score at least 1 SD below young normal sex matched area BMD of the Lunar reference database); resident in greater Vancouver Exclusion criteria: living in care facility; non‐Caucasian race; regularly exercising 2 x per wk or more; history of illness or a condition affecting balance (stroke, Parkinson's disease); unable to safely participate in exercise programme; MMSE 23 or less | |
| Interventions | 1. High‐intensity resistance training 50 min, 2 x per wk 25 wks using Keiser Pressurized Air system and free weights. Instructor:participant ratio 1:2 2. Agility training 50 min, 2 x per wk for 25 wks. Training (ball games, relay races, dance movements, obstacle courses wearing hip protectors) designed to challenge hand‐eye and foot‐eye co‐ordination, and dynamic, standing and leaning balance, and reaction time. Instructor:participant ratio 1:3 3. Control: sham exercises 50 min, 2 x per wk for 25 wks. Stretching, deep breathing, relaxation, general posture. Instructor:participant ratio 1:4 | |
| Outcomes | 1. Rate of falls 2. Number of people with more than 1 fall (i.e. frequent fallers) 3. Number of people with adverse effects Other outcomes reported but not included in this review |
|
| Duration of the study | 25 wks | |
| Notes | ||
| Risk of bias | ||
| Bias | Authors' judgement | Support for judgement |
| Random sequence generation (selection bias) | Unclear risk | Method of randomisation not described but stratified by baseline performance in postural sway |
| Allocation concealment (selection bias) | Unclear risk | Insufficient information to permit judgement |
| Blinding of participants and personnel (performance bias) All outcomes | Unclear risk | Participants and personnel not blind to allocated group but impact of non‐blinding unclear |
| Blinding of outcome assessment (detection bias) Falls and fallers | High risk | All participants asked to keep falls diary. All groups had exercise interventions. Study described as "single blind" which indicates that assessors were not blinded. |
| Incomplete outcome data (attrition bias) Falls | Low risk | SeeAppendix 3 for method of assessment |
| Incomplete outcome data (attrition bias) Fallers | Unclear risk | SeeAppendix 3 for method of assessment |
| Risk of bias in recall of falls | Low risk | Prospective. Quote: "Falls documented using monthly falls calendars." |
Liu‐Ambrose 2008.
| Study characteristics | ||
| Methods | RCT | |
| Participants | Setting: Vancouver, Canada N = 74 Sample: people attending a falls clinic after presenting at ED or to GP with a fall or fall‐related injury (41/59 completing baseline assessment (69%) were women) Age (years): mean 82.2 (SD 6.3) (in 59 participants completing baseline assessment) Inclusion criteria: aged ≥ 70; community‐dwelling; attending one of 2 falls clinics (criteria for attending clinic: history of a fall and considered at risk for further falls); able to walk at least 3 m; 1 additional nonsyncopal fall in previous year (if index fall was suspected to be due to carotid sinus syndrome); at risk of further falls (TUG test > 15 seconds or PPA z‐score of ≥ 1) Exclusion criteria: progressive neurological condition (e.g. Parkinson's disease); life expectancy < 12 months; cognitively impaired (MMSE score < 24) |
|
| Interventions | 1. 12‐month home‐based strength and balance‐retraining programme (Otago Exercise Programme) 2. Control: semi‐structured interview about their presenting fall and their experience seeking care for the fall at ED Both groups received falls risk factor assessment and comprehensive geriatric assessment followed by "Guideline Care" through falls clinic |
|
| Outcomes | 1. Rate of falls 2. Number of people falling Other outcomes not included in this review |
|
| Duration of the study | 1 year | |
| Notes | Cost‐effectiveness analysis reported in Davis 2009 | |
| Risk of bias | ||
| Bias | Authors' judgement | Support for judgement |
| Random sequence generation (selection bias) | Low risk | Quote: "The randomization sequence was computer generated (www.randomization.com)" |
| Allocation concealment (selection bias) | Low risk | Quote: "The Family Practice Research Coordinator at the University of British Columbia held this sequence independently and remotely" |
| Blinding of participants and personnel (performance bias) All outcomes | Unclear risk | Participants and personnel not blind to allocated group but impact of non‐blinding unclear |
| Blinding of outcome assessment (detection bias) Falls and fallers | High risk | Falls self reported and "A research assistant who was not blinded to treatment group" phoned participants at the end of each month |
| Incomplete outcome data (attrition bias) Falls | Unclear risk | SeeAppendix 3 for method of assessment |
| Incomplete outcome data (attrition bias) Fallers | High risk | SeeAppendix 3 for method of assessment |
| Risk of bias in recall of falls | Low risk | Quote: "Ascertainment of falls ... documented on monthly calendars that were returned in prepaid preaddressed envelopes at the end of each month." "A research assistant who was not blinded to treatment group but was unaware of the study hypotheses made three attempts by telephone to contact participants at the end of each month. The purpose of each phone call was to inquire about falls (both groups) ... for all participants regardless of whether the calendar was returned." |
Logan 2010.
| Study characteristics | ||
| Methods | RCT | |
| Participants | Setting: 4 primary care trusts, Nottinghamshire, United Kingdom N = 204 Sample: people living in the 4 primary care trust areas (65% women) Age (years): median (IQR) 83 (77 to 86) Inclusion criteria: aged ≥ 60; living at home or in a care home (see Notes); called for an ambulance after a fall and not taken to hospital, or taken to hospital but not admitted Exclusion criteria: receiving a falls prevention services (in geriatric day hospitals or hospital out‐patient departments) | |
| Interventions | 1. Intervention: referred to multidisciplinary falls prevention service for assessment and interventions. Tailored interventions including balance training, muscle strengthening, reduction of environmental hazards, education about how to get off the floor, and provision of equipment. If medical assessment required for medication check or visual problems, referred to GP in first instance and then to the community geriatrician if necessary 2. Control: no intervention by falls prevention service | |
| Outcomes | 1. Rate of falls 2. Number of people falling 3. Only reported number sustaining a fracture requiring admission to hospital, i.e. subgroup of fractures Other outcomes reported but not included in this review |
|
| Duration of the study | 1 year | |
| Notes | Predominantly community‐dwelling (only 5% in care home or hospital) Trial acronym: SAFER (Support and Assessment for Fall Emergency Referrals) Trial |
|
| Risk of bias | ||
| Bias | Authors' judgement | Support for judgement |
| Random sequence generation (selection bias) | Low risk | Quote: "Nottingham Clinical Trials Unit produced a computer generated randomisation scheme with stratification by primary care trust" |
| Allocation concealment (selection bias) | Low risk | Quote: "The allocation sequence was concealed until allocation. After written consent had been obtained, PAL accessed the randomisation sequence through the internet and assigned the participants to their group." |
| Blinding of participants and personnel (performance bias) All outcomes | Unclear risk | Quote: "It was not possible to blind the participants and treating therapists to allocation group as they would be aware of receiving or giving falls rehabilitation." Unclear whether this would introduce bias in this study |
| Blinding of outcome assessment (detection bias) Falls and fallers | Low risk | Quote: "A trained assessor who was independent of the community fall team and masked to group allocation contacted by telephone or visited those participants who did not return their diaries or questionnaires." The assessors who contacted the participants to collect missing data on outcome measures and the research staff who input data were blinded to allocation group |
| Blinding of outcome assessment (detection bias) Fractures | Low risk | To ascertain number of participants sustaining a fracture "a researcher blind to allocation checked the Nottingham University Hospital computer system." Assume that checking this one hospital system would identify all fractures. |
| Incomplete outcome data (attrition bias) Falls | Low risk | SeeAppendix 3 for method of assessment |
| Incomplete outcome data (attrition bias) Fallers | Low risk | SeeAppendix 3 for method of assessment |
| Risk of bias in recall of falls | Low risk | Quote: "Data on falls were recorded monthly using a diary. Participants were sent a diary by post each month with a stamped addressed envelope to return the completed previous month's diary." |
Logghe 2009.
| Study characteristics | ||
| Methods | RCT | |
| Participants | Setting: 2 industrial towns in the western Netherlands N = 269 Sample: registered with participating 23 general practices (71% women) Age (years): mean 77 (SD 4.6) Inclusion criteria: aged ≥ 70; community‐dwelling; high falls risk (1 or more falls in previous year or 2 or more risk factors for falling (disturbed balance, mobility problems, dizziness, using benzodiazepines or diuretics) Exclusion criteria: none described | |
| Interventions | 1. Tai Chi Chuan training (1 hour, 2 x per wk for 13 wks) + fall prevention brochure 2. Control: fall prevention brochure | |
| Outcomes | 1. Rate of falls 2. Number of people falling Other outcomes reported but not included in this review |
|
| Duration of the study | 1 year | |
| Notes | ||
| Risk of bias | ||
| Bias | Authors' judgement | Support for judgement |
| Random sequence generation (selection bias) | Low risk | Quote: "An independent research assistant performed a prestratified block randomization using a computer‐generated randomization list" |
| Allocation concealment (selection bias) | Low risk | Quote: "An independent research assistant performed a prestratified block randomization using a computer‐generated randomization list" |
| Blinding of participants and personnel (performance bias) All outcomes | High risk | Participants and/or intervention delivery personnel were not blind to group allocation, and the outcomes (falls and fractures) are likely to be influenced by lack of blinding |
| Blinding of outcome assessment (detection bias) Falls and fallers | Low risk | Falls self reported but "The blinded research assistant contacted the participant when forms were missing or incomplete, and they then completed the forms together over the telephone" |
| Incomplete outcome data (attrition bias) Falls | Unclear risk | SeeAppendix 3 for method of assessment. Insufficient information to permit judgement. |
| Incomplete outcome data (attrition bias) Fallers | Low risk | SeeAppendix 3 for method of assessment |
| Risk of bias in recall of falls | Low risk | Quote: "At baseline, the participants received a falls calendar and the instruction to fill it out on a daily basis for 1 year ... The fall calendars were collected monthly by mail. The blinded research assistant contacted the participant when forms were missing or incomplete, and they then completed the forms together over the telephone" |
Lord 1995.
| Study characteristics | ||
| Methods | RCT. Pre‐randomisation prior to consent, from a schedule of participants in a previous study | |
| Participants | Setting: Australia N = 197 Sample: women recruited from a schedule from a previous epidemiologic study. Fitness level not defined. Age (years): mean 71.6 (SD 5.4), range 60 to 85 Inclusion criteria: living independently in the community Exclusion criteria: unable to use English | |
| Interventions | 1. Intervention: exercise classes (warm‐up, conditioning, stretching, relaxation) 1 hour, 2 x per wk for 52 wks 2. Control: no intervention | |
| Outcomes | 1. Rate of falls 2. Number of people falling | |
| Duration of the study | 1 year | |
| Notes | ||
| Risk of bias | ||
| Bias | Authors' judgement | Support for judgement |
| Random sequence generation (selection bias) | Unclear risk | Quote: "randomly assigned" |
| Allocation concealment (selection bias) | Unclear risk | Insufficient information to permit judgement |
| Blinding of participants and personnel (performance bias) All outcomes | Unclear risk | Participants and personnel not blind to allocated group but impact of non‐blinding unclear |
| Blinding of outcome assessment (detection bias) Falls and fallers | High risk | Falls reported by participants who were aware of their group allocation. Assessors not blind to treatment status. |
| Incomplete outcome data (attrition bias) Falls | Low risk | SeeAppendix 3 for method of assessment |
| Incomplete outcome data (attrition bias) Fallers | Low risk | SeeAppendix 3 for method of assessment |
| Risk of bias in recall of falls | Unclear risk | Interval recall. Fall ascertainment questionnaires sent out every 2 months. Telephone call if questionnaire not returned. |
Lord 2003.
| Study characteristics | ||
| Methods | RCT. Cluster‐randomised by village. Stratified by accommodation (self care or intermediate care) and by cluster size (< 75 or at least 75 residents) | |
| Participants | Setting: retirement villages, Sydney, Australia N = 551 (N = 20 clusters) Sample: recruited from self care apartment villages (78%) and intermediate‐care hostels (22%) (86% women) Age (years): mean 79.5 (SD 6.4), range 62 to 95 Inclusion criteria: resident in one of 20 retirement villages Exclusion criteria: MMSE < 20; already attending exercise classes of equivalent intensity; medical conditions that precluded participation as determined by nurse or physician (neuromuscular, skeletal, cardiovascular); in hospital or away at recruitment time | |
| Interventions | 1. Group exercise classes (1 hour, 2 x per wk for 52 wks). Designed to improve strength, speed, co‐ordination, balance and gait, and to improve performance in ADLs (turning and reaching, rising from chair, stair climbing, standing and walking balance). 35 to 40‐minute conditioning period. Aerobic exercises, strengthening exercises, activities for balance and hand‐eye and foot‐eye co‐ordination, and flexibility (mostly weight bearing) 2. Control: seated flexibility and relaxation activities by yoga instructors (1 hour, 2 x per wk for 52 wks) 3. Control: no group activity | |
| Outcomes | 1. Rate of falls | |
| Duration of the study | 1 year | |
| Notes | ||
| Risk of bias | ||
| Bias | Authors' judgement | Support for judgement |
| Random sequence generation (selection bias) | Unclear risk | Method of randomisation not described |
| Allocation concealment (selection bias) | Unclear risk | Insufficient information to permit judgement |
| Blinding of participants and personnel (performance bias) All outcomes | Unclear risk | Participants and personnel not blind to allocated group but impact of non‐blinding unclear |
| Blinding of outcome assessment (detection bias) Falls and fallers | High risk | Falls reported by completion of questionnaire monthly by all participants; if not returned telephone calls were made. No mention of blinding of personnel carrying out phone calls, but in intermediate‐care sites, falls record book was kept by nursing staff (unblinded). |
| Incomplete outcome data (attrition bias) Falls | Low risk | SeeAppendix 3 for method of assessment |
| Risk of bias in recall of falls | Unclear risk | Retrospective. Falls ascertained by questionnaires given to residents every month, with follow‐up phone calls or home visit for none responders. In addition nurses recorded falls in falls record book in intermediate‐care hostels. |
Lord 2005.
| Study characteristics | ||
| Methods | RCT | |
| Participants | Setting: Sydney, Australia N = 620 Sample: health insurance membership database (66% women) Age (years): mean 80.4 (SD 4.5) Inclusion criteria: low score on PPA test; community‐dwelling; ≥ 75 years Exclusion criteria: minimal English language skills; blind; Parkinson's disease; cognitive impairment | |
| Interventions | All participants assessed for risk factors prior to randomisation 1. Extensive intervention comprising individualised exercise intervention (2 x per wk for 12 months), visual intervention, peripheral sensation counselling intervention 2. Minimal intervention. Participants received a report outlining their falls risk, a profile of their test results, and specific recommendations on preventing falls based on their test performances 3. Control: no intervention (received minimal intervention after 12‐month follow‐up) |
|
| Outcomes | 1. Rate of falls 2. Number of people falling Other outcomes reported but not included in this review | |
| Duration of the study | 1 year | |
| Notes | ||
| Risk of bias | ||
| Bias | Authors' judgement | Support for judgement |
| Random sequence generation (selection bias) | Low risk | Quote: "randomised in matched blocks N = 20 ... using concealed allocation (drawing lots)". |
| Allocation concealment (selection bias) | Low risk | Quote: "concealed allocation" |
| Blinding of participants and personnel (performance bias) All outcomes | Unclear risk | Blinding of participants and treatment personnel not mentioned in report, but unlikely. Insufficient evidence to make judgement on impact of lack of blinding. |
| Blinding of outcome assessment (detection bias) Falls and fallers | Unclear risk | Falls reported by completion of monthly falls calendar by all participants; if not returned telephone calls were made. Blinding of assessors not described. |
| Incomplete outcome data (attrition bias) Falls | Low risk | SeeAppendix 3 for method of assessment |
| Incomplete outcome data (attrition bias) Fallers | Low risk | SeeAppendix 3 for method of assessment |
| Risk of bias in recall of falls | Low risk | Prospective. Monthly fall calendars. Telephoned at end of month if not returned. |
Luukinen 2007.
| Study characteristics | ||
| Methods | RCT | |
| Participants | Setting: Oulu, Finland N = 486 Sample: identified from population and geriatric registers of Oulu (78% women) Age (years): mean 88 (SD 3) Inclusion criteria: age ≥ 85; home dwelling; ≥ 1 risk factor for falling (≥ 2 falls in previous year, loneliness, poor self rated health, poor visual acuity/hearing, depression, poor cognition, impaired balance, chair rise, slow walking speed, difficulty with at least 1 ADL, able to walk outdoors, up or down stairs) Exclusion criteria: none described | |
| Interventions | 1. Intervention plans developed by OT and physiotherapist at home visit, based on nurse's assessment pre‐randomisation. Feasibility of plan assessed by GP. Plan included home exercise or group exercise, walking exercises, self care exercises (duration and frequency not described). Interventions carried out by OT and/or physiotherapist 2. Control: asked to visit GP without written intervention form | |
| Outcomes | 1. Rate of falls 2. Number of people falling | |
| Duration of the study | 24 months (falls monitored for median 16 months) | |
| Notes | ||
| Risk of bias | ||
| Bias | Authors' judgement | Support for judgement |
| Random sequence generation (selection bias) | Low risk | Quote: "Randomization was done by the study statistician using a random numbers table". |
| Allocation concealment (selection bias) | Unclear risk | Insufficient information to permit judgement |
| Blinding of participants and personnel (performance bias) All outcomes | Unclear risk | Participants and personnel not blind to allocated group but impact of non‐blinding unclear |
| Blinding of outcome assessment (detection bias) Falls and fallers | Low risk | Quote: "Fall recording was based on regular phone calls to all participants made every second month by a research nurse ... unaware of the randomization and the interventions." |
| Incomplete outcome data (attrition bias) Falls | Low risk | SeeAppendix 3 for method of assessment |
| Incomplete outcome data (attrition bias) Fallers | Low risk | SeeAppendix 3 for method of assessment |
| Risk of bias in recall of falls | High risk | Interval recall. Quote: "Fall recording was based on regular telephone interviews once in 2 months, but did not include diary reporting." |
Madureira 2010.
| Study characteristics | ||
| Methods | RCT | |
| Participants | Setting: Sao Paulo, Brazil N = 66 Sample: women attending osteometabolic disease outpatient clinic Age (years): mean 74 (SD 4.7) Inclusion criteria: aged > 65; with osteoporosis Exclusion criteria: secondary osteoporosis, visual deficiency, hearing deficiency, vestibular alteration, unable to walk more than 10 m independently, contraindications for exercise training; planning to be out of town for > 4 wks during study | |
| Interventions | Intervention: balance training programme 1 hour per wk for 40 wks (classes held in an athletics club so probably mostly community‐dwelling) preceded by 15 min warm‐up. Encouraged to continue same exercises at home, 30 min 3 x per wk. Control: osteoporosis treatment, "instructions to prevent falls", and 3‐monthly clinic visits | |
| Outcomes | 1. Mean number of falls per person. No poolable data. Falls a secondary outcome Other outcomes reported but not included in this review |
|
| Duration of the study | 1 year | |
| Notes | ||
| Risk of bias | ||
| Bias | Authors' judgement | Support for judgement |
| Random sequence generation (selection bias) | Unclear risk | Quote: "The patients were randomized consecutively into two groups." |
| Allocation concealment (selection bias) | Unclear risk | Quote: "The patients were randomized consecutively into two groups." Insufficient information to permit judgement. |
| Blinding of participants and personnel (performance bias) All outcomes | High risk | No blinding of participants and personnel and the control group got "orientation to prevent falls" |
| Blinding of outcome assessment (detection bias) Falls and fallers | Low risk | Falls self reported but recorded in medical record every 3 months by "the Osteometabolic Outpatient Clinic physician blinded to the group assignment." |
| Incomplete outcome data (attrition bias) Falls | Unclear risk | SeeAppendix 3 for method of assessment. Insufficient information to permit judgement. |
| Risk of bias in recall of falls | Unclear risk | Quote: "During the study, patients in both groups received a calendar and were instructed to write down falls, which were included in the same electronic medical record every 3 months by the Osteometabolic Outpatient Clinic physician blinded to the group assignment." No mention of more frequent telephone follow‐up. |
Mahoney 2007.
| Study characteristics | ||
| Methods | RCT | |
| Participants | Setting: USA N = 349 Sample: recruited from seniors centres, meal sites, senior apartment buildings, other senior congregate sites, by referral (79% women) Age (years): mean 80 (SD 7.5) Inclusion criteria: aged ≥ 65; living independently; ≥ 2 falls in previous year or 1 injurious fall in previous 2 years or gait and balance problems Exclusion criteria: unable to give informed consent and no related caregiver; in hospice or assisted‐living facility; expected to move away from area | |
| Interventions | 1. Fall risk assessment by nurse or physiotherapist (2 home visits) followed by recommendations and referrals to primary physician, physiotherapist, OT, ophthalmologist, podiatrist etc. All participants given exercise plan for long‐term exercise (walking programme, standing balance exercises in group setting etc), monthly exercise calendar and 11 monthly phone calls to promote adherence to exercises and other recommendations 2. Control: 1 in‐home assessment by OT "limited to home safety recommendations and advice to see their doctor about falls" | |
| Outcomes | 1. Rate of falls | |
| Duration of the study | 1 year | |
| Notes | ||
| Risk of bias | ||
| Bias | Authors' judgement | Support for judgement |
| Random sequence generation (selection bias) | Low risk | Randomised using computer‐generated randomisation table |
| Allocation concealment (selection bias) | Unclear risk | Sealed envelopes used but no mention of numbering or how they were used |
| Blinding of participants and personnel (performance bias) All outcomes | Unclear risk | Participants and personnel implementing the intervention not blind to allocated group, but impact of non‐blinding unclear |
| Blinding of outcome assessment (detection bias) Falls and fallers | Low risk | Falls reported by all participants using monthly calendars. Quote: "The study researcher, blinded to treatment assignment, called subjects who did not return calendars. When a fall was reported, the researcher interviewed the subject or caregiver to verify the fall." |
| Incomplete outcome data (attrition bias) Falls | Low risk | SeeAppendix 3 for method of assessment |
| Risk of bias in recall of falls | Low risk | Falls ascertained using monthly calendars, telephone call if calendar not returned or if fall reported |
Markle‐Reid 2010.
| Study characteristics | ||
| Methods | RCT | |
| Participants | Setting: Ontario, Canada N = 109 Sample: newly referred to, and eligible for, home support services (72% women) Age: range 75 to 84 Inclusion criteria: aged ≥ 75; community‐dwelling (not in nursing home or long‐term care facility); "at risk of falls" (fallen in past 12 month, fear of falling, unsteady on feet) Exclusion criteria: not mentally competent; not competent in English or with a translator available | |
| Interventions | 1. Standard home services + home visits by health professionals 2. Control: standard home services | |
| Outcomes | 1. Rate of falls 2. Number of people falling |
|
| Duration of the study | 6 months | |
| Notes | Cost analysis reported in primary reference | |
| Risk of bias | ||
| Bias | Authors' judgement | Support for judgement |
| Random sequence generation (selection bias) | Low risk | Quote: "randomly generated numbers constructed by a biostatistician who was not involved in the recruitment process" |
| Allocation concealment (selection bias) | Low risk | Quote: "Randomization was achieved using consecutively numbered, sealed, opaque envelopes containing randomly generated numbers constructed by a biostatistician who was not involved in the recruitment process." |
| Blinding of participants and personnel (performance bias) All outcomes | Unclear risk | Participants and personnel implementing the intervention not blind to allocated group, but impact of non‐blinding unclear |
| Blinding of outcome assessment (detection bias) Falls and fallers | Low risk | Quote: "Trained interviewers, blinded to the purpose of the study and group assignment, assessed participants at baseline and six months" |
| Blinding of outcome assessment (detection bias) Fractures | Unclear risk | Insufficient information to permit judgement |
| Incomplete outcome data (attrition bias) Falls | Low risk | SeeAppendix 3 for method of assessment |
| Incomplete outcome data (attrition bias) Fallers | Low risk | SeeAppendix 3 for method of assessment |
| Risk of bias in recall of falls | Low risk | Quote: "All participants kept a calendar to record daily any slip, trip, or fall and returned it at the end of each month. Interviewers blinded to treatment assignment telephoned participants monthly to obtain additional information" |
McKiernan 2005.
| Study characteristics | ||
| Methods | RCT | |
| Participants | Setting: Wisconsin, USA N = 113 Sample: recruited from fall registry and by single media release (60% women) Age (years): mean 74.2, range 65 to 96 Inclusion criteria: aged ≥ 65 years; community‐dwelling; ≥ 1 falls in previous year; independently ambulatory Exclusion criteria: not capable of applying Yaktrax walker correctly or discerning correct outdoor conditions to wear them | |
| Interventions | 1. Yaktrax walker (netting applied over usual footwear with wire coils to increase grip in winter outdoor conditions) 2. Control: usual winter footwear | |
| Outcomes | 1. Rate of falls | |
| Duration of the study | 3 months ("one winter") | |
| Notes | ||
| Risk of bias | ||
| Bias | Authors' judgement | Support for judgement |
| Random sequence generation (selection bias) | Unclear risk | Quote: "randomized" |
| Allocation concealment (selection bias) | Unclear risk | Insufficient information to permit judgement |
| Blinding of participants and personnel (performance bias) All outcomes | High risk | Consent to participate included awareness of the intervention, and the absence of intervention. 19% of individuals in control group used the intervention device. |
| Blinding of outcome assessment (detection bias) Falls and fallers | Unclear risk | Falls reported by participants who were aware of their group allocation, using monthly calendars. Blinding of research staff not described. |
| Incomplete outcome data (attrition bias) Falls | Low risk | SeeAppendix 3 for method of assessment |
| Risk of bias in recall of falls | Low risk | Prospective. Fall diary returned by post. |
McMurdo 1997.
| Study characteristics | ||
| Methods | RCT | |
| Participants | Setting: Dundee, United Kingdom N = 118 Sample: women recruited by advertisement Age (years): mean 64.5, range 60 to 73 Inclusion criteria: community‐dwelling; post‐menopausal Exclusion criteria: conditions or drug treatment likely to affect bone | |
| Interventions | 1. Exercise programme of weight bearing exercise to music, 45 min, 3 x per wk, 30 wks per year, over 2 years, plus 1000 mg calcium carbonate daily 2. Control: 1000 mg calcium carbonate daily | |
| Outcomes | 1. Rate of falls
2. Number of people falling Other outcomes reported but not included in this review |
|
| Duration of the study | 24 months | |
| Notes | ||
| Risk of bias | ||
| Bias | Authors' judgement | Support for judgement |
| Random sequence generation (selection bias) | Unclear risk | Method of randomisation not described |
| Allocation concealment (selection bias) | Unclear risk | Insufficient information to permit judgement |
| Blinding of participants and personnel (performance bias) All outcomes | Unclear risk | Participants and personnel implementing the intervention not blind to allocated group, but impact of non‐blinding unclear |
| Blinding of outcome assessment (detection bias) Falls and fallers | Unclear risk | Falls reported by participants who were aware of their group allocation. Insufficient information to permit judgement. |
| Blinding of outcome assessment (detection bias) Fractures | Unclear risk | Insufficient information to permit judgement |
| Incomplete outcome data (attrition bias) Falls | High risk | |
| Incomplete outcome data (attrition bias) Fallers | High risk | SeeAppendix 3 for method of assessment |
| Risk of bias in recall of falls | Unclear risk | No description about ascertainment |
McMurdo 2009.
| Study characteristics | ||
| Methods | RCT (2 centres) | |
| Participants | Setting: Dundee and Glasgow, Scotland, United Kingdom N = 253 Sample: people admitted to hospital with acute illness who appeared undernourished (61% women) Age (years): mean 82 (SD 62) Inclusion criteria: consenting; community‐dwelling; aged ≥ 70; admitted to the hospital with an acute illness; BMI < 24.0 kg/m2 and mid‐arm muscle circumference below the 10th centile or weight loss of 5% or more during the hospital stay Exclusion criteria: Barthel Index > 8, chronic liver disease or renal failure (serum creatinine 43.39 mg/dL); residence in a care home; cognitive impairment precluding informed consent; dysphagia; metastatic carcinoma or other terminal illness; acute inflammatory arthritis; stroke affecting both hands; major surgery within the preceding month |
|
| Interventions | 1. Oral nutritional supplementation (400 mL/day of Fresubin, Fresenius Kabi Ltd, Runcorn, Cheshire, UK: 600 kcal, 2520 kJ, 40 g protein, a nutritionally complete liquid protein and energy supplement) 2. Control: matching control supplement (based on skim milk containing minimal energy: 200 kcal, 840 kJ, 12.4 g protein content) in identical packaging |
|
| Outcomes | 1. Number of people falling Falls are a secondary outcome in this study. Other outcomes reported but not included in this review | |
| Duration of the study | 4 months | |
| Notes | ||
| Risk of bias | ||
| Bias | Authors' judgement | Support for judgement |
| Random sequence generation (selection bias) | Low risk | Quote: "Randomization was stratified according to site, in random permuted blocks of 4. An individual not involved in the study prepared the randomization schedule from computer‐generated random number tables." |
| Allocation concealment (selection bias) | Low risk | Quote: "Participants were allocated to oral nutritional supplementation ... or to a matching control supplement ... Both preparations were packaged in identical 200‐mL plain white rectangular cartons and labeled using one of two randomization codes." |
| Blinding of participants and personnel (performance bias) All outcomes | Low risk | Quote: "Both preparations were packaged in identical 200‐mL plain white rectangular cartons and labeled using one of two randomization codes." |
| Blinding of outcome assessment (detection bias) Falls and fallers | Low risk | Likely to be low given that the participants were blinded to contents of supplement and "... observations were recorded blind to treatment allocation" |
| Incomplete outcome data (attrition bias) Falls | Unclear risk | SeeAppendix 3 for method of assessment |
| Incomplete outcome data (attrition bias) Fallers | Low risk | SeeAppendix 3 for method of assessment |
| Risk of bias in recall of falls | Unclear risk | Quote: "Falls were recorded prospectively using the validated daily diary method." But no mention of telephone contact or frequency of return. |
Means 2005.
| Study characteristics | ||
| Methods | RCT | |
| Participants | Setting: Arkansaw, USA N = 338 Sample: volunteers from 17 senior citizen's centres (57% women) Age (years): mean 73.5 Inclusion criteria: aged ≥ 65 years; able to walk at least 30 feet without assistance from others; able to follow instructions and give consent Exclusion criteria: resident in a nursing home; acute medical problems; cognitive impairment | |
| Interventions | 1. Balance rehabilitation intervention. Active stretching, postural control, endurance walking, and repetitive muscle co‐ordination exercises. Group sessions 90 min, 3 x per wk for 6 wks 2. Control: group seminars on non health‐related topics of interest to senior citizens. Same time and frequency as intervention group | |
| Outcomes | 1. Rate of falls 2. Number of people falling | |
| Duration of the study | 6 months | |
| Notes | ||
| Risk of bias | ||
| Bias | Authors' judgement | Support for judgement |
| Random sequence generation (selection bias) | Low risk | Randomised by coin flip |
| Allocation concealment (selection bias) | Unclear risk | Insufficient information to permit judgement |
| Blinding of participants and personnel (performance bias) All outcomes | Unclear risk | Blinding of participants and treatment personnel not mentioned in report, but unlikely. Insufficient information to make judgement on impact of lack of blinding. |
| Blinding of outcome assessment (detection bias) Falls and fallers | Low risk | Falls reported by participants who were aware of their group allocation. Assessor blind to group allocation. |
| Incomplete outcome data (attrition bias) Falls | High risk | SeeAppendix 3 for method of assessment |
| Incomplete outcome data (attrition bias) Fallers | High risk | SeeAppendix 3 for method of assessment |
| Risk of bias in recall of falls | Low risk | Prospective. Recorded on pre‐printed postcards weekly with telephone calls to non correspondents to optimise compliance. |
Meredith 2002.
| Study characteristics | ||
| Methods | RCT | |
| Participants | Setting: New York and Los Angeles, USA N = 317 Sample: participants enrolled from home health care agencies client lists if agency office agreed to participate (75% women) Age (years): mean 80 (SD 8) Inclusion criteria: Medicare patients; aged ≥ 65; registered with home health care offices in defined period; having one of 4 study medication problems; having an identifiable physician; expected home health care for at least 4 wks Exclusion criteria: not expected to survive through follow‐up; unable to understand spoken English; resident in an unsafe area that requires an escort for visits | |
| Interventions | 1. Medication review by pharmacist and participant's nurse based on reported problems relating to medication use (including falls). Targetted therapeutic duplication, cardiovascular, psychotropic, and NSAID use. A plan to reduce medication problem presented to physician in person by nurse or pharmacist. Nurse assisted participant with the medication changes and monitored effect 2. Control: usual care, which might include review of medications and adverse effects if relevant | |
| Outcomes | 1. Number of people falling | |
| Duration of the study | Follow‐up interview as close to 6 wks as possible, but up to 90 days after randomisation | |
| Notes | ||
| Risk of bias | ||
| Bias | Authors' judgement | Support for judgement |
| Random sequence generation (selection bias) | Low risk | Assigment generated by computer random number generator (SAS v 6.10). Balanced block randomisation, stratified by the 2 areas. |
| Allocation concealment (selection bias) | Unclear risk | Randomised off site but insufficient information to permit judgement |
| Blinding of participants and personnel (performance bias) All outcomes | Unclear risk | Participants and personnel implementing the intervention not blind to allocated group, but impact of non‐blinding unclear |
| Blinding of outcome assessment (detection bias) Falls and fallers | Low risk | Falls data collected at 6 weeks by study research assistants, who "supervised by the data coordinator, collected the data; all were masked as to patient group assignment" |
| Incomplete outcome data (attrition bias) Fallers | Low risk | SeeAppendix 3 for method of assessment |
| Risk of bias in recall of falls | High risk | No description of how falls ascertained; presumably retrospectively at follow‐up interview |
Morgan 2004.
| Study characteristics | ||
| Methods | RCT | |
| Participants | Setting: community and assisted‐living facilities Florida, USA N = 294 Sample: recruited from Miami Department of Veterans Affairs Medical Centre, 9 assisted‐living facilities, private physical therapy clinic (71% women) Age (years): mean 80.5 (SD 7.5) Inclusion criteria: aged ≥ 60; hospital admission or bedrest for ≥ 2 days in previous month Exclusion criteria: medical conditions precluding exercise programme (angina, severe osteoporosis etc); MMSE < 23 (unable to follow instructions); using oxygen therapy at home; planned inpatient treatment or evaluation in 2 months following recruitment; requiring human assistance, wheelchair or artificial limbs to walk | |
| Interventions | 1. Low‐intensity group exercise: seated and standing exercises to improve muscle strength, joint flexibility, balance and gait, 5 people per group. 45 min, 3 x per wk for 8 wks 2. Control: usual activities | |
| Outcomes | 1. Number of people falling | |
| Duration of the study | 1 year | |
| Notes | SAFE‐GRIP (Study to Assess Falls among Elderly Geriatric Rehabilitation Intensive Program) | |
| Risk of bias | ||
| Bias | Authors' judgement | Support for judgement |
| Random sequence generation (selection bias) | Unclear risk | Randomisation stratified by sex, age (< 75 and ≥ 75), falls history in previous month (fall/no fall). Method of randomisation not described. |
| Allocation concealment (selection bias) | Unclear risk | Insufficient information to permit judgement |
| Blinding of participants and personnel (performance bias) All outcomes | Unclear risk | Participants and personnel implementing the intervention not blind to allocated group, but impact of non‐blinding unclear |
| Blinding of outcome assessment (detection bias) Falls and fallers | Unclear risk | Blinding not described. Insufficient information to permit judgement. |
| Incomplete outcome data (attrition bias) Fallers | Unclear risk | SeeAppendix 3 for method of assessment. Insufficient information to permit judgement. Number randomised not stated. |
| Risk of bias in recall of falls | Low risk | Prospective. Pre‐dated postcard diaries returned every 2 weeks. |
Newbury 2001.
| Study characteristics | ||
| Methods | RCT | |
| Participants | Setting: Adelaide, Australia N = 100 Sample: every 20th name in an age‐sex register of community‐dwelling patients registered with 6 general practices (63% women) Age: median (intervention group) 78.5, (control group) 80, range 75‐91 Inclusion criteria: aged ≥ 75; independently community‐dwelling Exclusion criteria: none | |
| Interventions | 1. Health assessment of people aged 75 years or older by nurse (75+HA). Problems identified were counted and reported to patient's GP. No reminders or other intervention for 12 months 2. No 75+HA until 12 months after randomisation | |
| Outcomes | 1. Number of people falling Other outcomes reported but not included in this review | |
| Duration of the study | 1 year | |
| Notes | 75+HA introduced in Australia November 1999 as part of Enhanced Primary Care package. Similar to "health check" for patients in this age group in the United Kingdom. | |
| Risk of bias | ||
| Bias | Authors' judgement | Support for judgement |
| Random sequence generation (selection bias) | Low risk | Randomisation by random numbers |
| Allocation concealment (selection bias) | Low risk | Sequentially numbered sealed envelopes |
| Blinding of participants and personnel (performance bias) All outcomes | Unclear risk | Participants and personnel implementing the intervention not blind to allocated group, but impact of non‐blinding unclear |
| Blinding of outcome assessment (detection bias) Falls and fallers | Unclear risk | Blinding not described. Insufficient information to permit judgement. |
| Incomplete outcome data (attrition bias) Fallers | Low risk | SeeAppendix 3 for method of assessment |
| Risk of bias in recall of falls | High risk | Falls identified retrospectively at follow‐up visit at 1 year |
Nikolaus 2003.
| Study characteristics | ||
| Methods | RCT | |
| Participants | Setting: enrolled in hospital but community‐based intervention, Germany N = 360 Sample: frail "older people" admitted to a geriatric clinic who normally lived at home (73% women) Age (years): mean 81.5 (SD 6.4) Inclusion criteria: lived at home before admission and able to be discharged home; with at least 2 chronic conditions (e.g. osteoarthritis or chronic cardiac failure, stroke, hip fracture, parkinsonism, chronic pain, urinary incontinence, malnutrition) or functional decline (unable to reach normal range on at least 1 assessment test of ADL or mobility) Exclusion criteria: terminal illness; severe cognitive decline; living > 15 km from clinic | |
| Interventions | 1. At least 2 home visits (from interdisciplinary home intervention team (HIT). 1 home visit prior to discharge to identify home hazards and prescribe technical aids if necessary. At least 1 more visit (mean 2.6, range 1 to 8) to inform about possible fall risks in home, advice on changes to home environment, facilitate changes, and teach use of technical and mobility aids. Comprehensive geriatric assessment in hospital.
2. Control: no home visit until final assessment at 1 year. Comprehensive geriatric assessment as for intervention group. Usual post discharge management by GPs |
|
| Outcomes | 1. Rate of falls 2. Number sustaining a fracture | |
| Duration of the study | 1 year | |
| Notes | Home intervention team consisted of 3 nurses, physiotherapist, occupational therapist, social worker, and secretary. Usually 2 members at first home visit (OT + nurse or OT + physiotherapist depending on anticipated needs and functional limitations). Methods paper described a third arm receiving usual hospital and home care. | |
| Risk of bias | ||
| Bias | Authors' judgement | Support for judgement |
| Random sequence generation (selection bias) | Low risk | Quote: "sealed envelopes containing group assignments using a random number sequence" |
| Allocation concealment (selection bias) | Unclear risk | Quote: "sealed envelopes containing group assignments" |
| Blinding of participants and personnel (performance bias) All outcomes | Low risk | Participants and personnel implementing the intervention not blind to allocated group, but as both groups received an intervention performance bias is unlikely |
| Blinding of outcome assessment (detection bias) Falls and fallers | Low risk | Quote: "the participants were contacted monthly by telephone to obtain information on falls, fall‐related injuries, and their circumstances. The interviewer was blinded to group allocation." |
| Blinding of outcome assessment (detection bias) Fractures | High risk | Self report only and no mention of confirmation by the results of radiological examination or from primary care case records |
| Incomplete outcome data (attrition bias) Falls | Low risk | SeeAppendix 3 for method of assessment |
| Risk of bias in recall of falls | Low risk | Prospective. Falls recorded in falls diary and by monthly telephone interview. |
Nitz 2004.
| Study characteristics | ||
| Methods | RCT | |
| Participants | Setting: Queensland, Australia N = 73 Sample: volunteers recruited through advertising and fliers (92% women) Age (years): mean 75.8 (SD 7.8) Inclusion criteria: aged over 60; living independently in the community; at least 1 fall in previous year Exclusion criteria: unstable cardiac condition, living too far from exercise class site, unable to guarantee regular attendance | |
| Interventions | 1. Balance training in small groups using workstation (circuit training) format, 1 hour per wk for 10 wks. Up to 6 people per group, with physiotherapist instructor 2. Control: gentle exercise and stretching, 1 hour per wk for 10 wks | |
| Outcomes | 1. Rate of falls | |
| Duration of the study | 3 months post intervention | |
| Notes | ||
| Risk of bias | ||
| Bias | Authors' judgement | Support for judgement |
| Random sequence generation (selection bias) | Low risk | Computer‐generated random numbers |
| Allocation concealment (selection bias) | Unclear risk | Insufficient information to permit judgement |
| Blinding of participants and personnel (performance bias) All outcomes | Unclear risk | Participants and personnel implementing the intervention not blind to allocated group, but impact of non‐blinding unclear |
| Blinding of outcome assessment (detection bias) Falls and fallers | Low risk | Quote: "Partipants used a calendar on which each day was marked for a fall ... or incident free day" Quote: "The physiotherapists who undertook all assessments of the participants were blinded to the intervention group allocation" |
| Incomplete outcome data (attrition bias) Falls | High risk | SeeAppendix 3 for method of assessment |
| Risk of bias in recall of falls | Low risk | Falls ascertained by marked calendar returned monthly |
Pardessus 2002.
| Study characteristics | ||
| Methods | RCT | |
| Participants | Setting: France N = 60 Sample: individuals hospitalised for a fall (78% women) Age (years): mean 83.2 (SD 7.7) Inclusion criteria: aged ≥ 65; hospitalised for falling; able to return home; able to give consent Exclusion criteria: cognitive impairment (MMSE < 24); falls due to cardiac, neurologic, vascular or therapeutic problems; without a phone; lived > 30 km from hospital | |
| Interventions | 1. Comprehensive 2‐hour home visit prior to discharge with "physical medicine and rehabilitation doctor" and OT. Assessment of ADLs, IADLs, transfers, mobility inside and outside, use of stairs. Environmental hazards identified and modified where possible. If not, advice given. Discussion of social support. Referrals for social assistance 2. Control: usual care | |
| Outcomes | 1. Number of people falling Mean number of falls per person reported but unable to calculate a rate of falls |
|
| Duration of the study | 1 year | |
| Notes | ||
| Risk of bias | ||
| Bias | Authors' judgement | Support for judgement |
| Random sequence generation (selection bias) | Low risk | Randomised using random numbers table |
| Allocation concealment (selection bias) | Unclear risk | Insufficient information to permit judgement |
| Blinding of participants and personnel (performance bias) All outcomes | Unclear risk | Participants and personnel implementing the intervention not blind to allocated group, but impact of non‐blinding unclear |
| Blinding of outcome assessment (detection bias) Falls and fallers | Unclear risk | Blinding not described. Quote: "Follow up was provided by one of us contacting each patient by phone, for the intervention or control group, every month during six month, and at twelve months" |
| Incomplete outcome data (attrition bias) Fallers | Low risk | SeeAppendix 3 for method of assessment |
| Risk of bias in recall of falls | Unclear risk | Interval recall, but short interval. Falls identified by monthly telephone calls. |
Parry 2009.
| Study characteristics | ||
| Methods | RCT (within participants cross‐over design) | |
| Participants | Setting: specialist falls and syncope facility, Newcastle upon Tyne, United Kingdom N = 34 Sample: consecutive patients presenting to A&E or syncope service (79% women) Age (years): mean 76.8 (SD 9.0) Inclusion criteria: aged over 55; carotid sinus hypersensitivity as sole attributable cause of ≥ 3 falls in preceding 6 months Exclusion criteria: moderate to severe cognitive impairment; stroke or myocardial infarction within 3 months; any history of syncope | |
| Interventions | 1. Dual chamber permanent pacemaker switched on 2. Control: dual chamber permanent pacemaker switched off | |
| Outcomes | 1. Rate of falls 2. Number of fallers | |
| Duration of the study | 6 months in each mode | |
| Notes | ||
| Risk of bias | ||
| Bias | Authors' judgement | Support for judgement |
| Random sequence generation (selection bias) | Low risk | Quote: "At 1 month, subjects were randomised (by table of random numbers) in double‐blind fashion to either continue in DDD/RDR mode, or for the pacing to be turned off (ODO mode). Six months later, patients crossed over to the opposite mode for the remaining 6 months of the study." |
| Allocation concealment (selection bias) | Low risk | Quote: "At 1 month, subjects were randomised (by table of random numbers) in double‐blind fashion to either continue in DDD/RDR mode, or for the pacing to be turned off (ODO mode)." |
| Blinding of participants and personnel (performance bias) All outcomes | Low risk | Placebo‐controlled. Quote: "Following pacemaker implantation, all subjects' pacemakers were programmed to on (ie, in DDD/RDR mode) for a 1‐month run‐in period in order to ensure that they were unaware of pacing intervention. At 1 month, subjects were randomised (by table of random numbers) in double‐blind fashion to either continue in DDD/RDR mode,or for the pacing to be turned off (ODO mode). Six months later, patients crossed over to the opposite mode for the remaining 6 months of the study." |
| Blinding of outcome assessment (detection bias) Falls and fallers | Unclear risk | Insufficient information to judge whether person phoning participants was blind to pacemaker status (on or off) |
| Blinding of outcome assessment (detection bias) Fractures | Unclear risk | Fractures recorded in events diary throughout, but no mention of blinded radiology assessment |
| Incomplete outcome data (attrition bias) Falls | Low risk | SeeAppendix 3 for method of assessment |
| Incomplete outcome data (attrition bias) Fallers | Low risk | SeeAppendix 3 for method of assessment |
| Risk of bias in recall of falls | Low risk | Quote: "All subjects completed daily fall diaries returned at weekly intervals using prepaid postage to avoid confounding due to inaccurate recall of falls. Information from the falls diaries was held at a central database; failure of diary return initiated a telephone prompt to keep diary returns contemporaneous" |
Pereira 1998.
| Study characteristics | ||
| Methods | RCT in 1982‐85. Reporting 10‐year follow‐up. | |
| Participants | Setting: Pittsburgh, USA N = 229 randomised, 198 available for 10‐year follow‐up Sample: healthy post‐menopausal women (volunteers) Age (years): at randomisation mean 57; at follow‐up mean 70 (SD 4) Inclusion criteria: 1 year post menopause; aged 50 and 65 Exclusion criteria: on HRT; unable to walk | |
| Interventions | 1. 8‐week training period with organised group walking scheme 2 x per wk. Also encouraged to walk 1 x per wk on their own. Building up to 7 miles per wk total 2. Control: no intervention | |
| Outcomes | 1. Number of people falling Other outcomes reported but not included in this review | |
| Duration of the study | Reporting 10‐year follow‐up | |
| Notes | ||
| Risk of bias | ||
| Bias | Authors' judgement | Support for judgement |
| Random sequence generation (selection bias) | Unclear risk | Method of randomisation not described |
| Allocation concealment (selection bias) | Unclear risk | Insufficient information to permit judgement |
| Blinding of participants and personnel (performance bias) All outcomes | Unclear risk | Participants and personnel implementing the intervention not blind to allocated group, but impact of non‐blinding unclear |
| Blinding of outcome assessment (detection bias) Falls and fallers | Low risk | Quote: "... telephone interviewers remained masked to the original group assignment of the participants until the end of the interview." |
| Incomplete outcome data (attrition bias) Fallers | Low risk | SeeAppendix 3 for method of assessment |
| Risk of bias in recall of falls | High risk | Falls in the previous 12 months ascertained by telephone interview |
Perry 2008.
| Study characteristics | ||
| Methods | RCT | |
| Participants | Setting: Ontario, Canada N = 46 Sample: healthy volunteers (19/40 women (48%) completed the study) Age (years): mean 69 (SD 3.4); range 65 to 75 Inclusion criteria: moderate insensitivity of the foot soles, as compared to published norms for young adults Exclusion criteria: a clinical diagnosis of diabetes or peripheral neuropathy |
|
| Interventions | 1. Intervention: balance‐enhancing insole ("Sole‐Sensor") for 12 wks
2. Control: normal insole for 12 wks All participants fitted with standard pattern shoe |
|
| Outcomes | 1. Number of people falling Other outcomes reported but not included in this review |
|
| Duration of the study | 12 wks | |
| Notes | Falls are a secondary outcome in this study | |
| Risk of bias | ||
| Bias | Authors' judgement | Support for judgement |
| Random sequence generation (selection bias) | Unclear risk | Quote: "Each participant performed the gait‐perturbation protocol … with both types of insoles, and was then randomly assigned to either the test or control group". Insufficient information to permit judgement. |
| Allocation concealment (selection bias) | Unclear risk | Insufficient information to permit judgement |
| Blinding of participants and personnel (performance bias) All outcomes | Low risk | Participants and researchers were not blinded to which allocated group they were in, facilitatory or conventional insole, however this is unlikely to have introduced performance bias |
| Blinding of outcome assessment (detection bias) Falls and fallers | Unclear risk | Falls reported by participants who were aware of their group allocation. Does not state whether outcome assessors were blind to allocation. |
| Incomplete outcome data (attrition bias) Fallers | Unclear risk | SeeAppendix 3 for method of assessment |
| Risk of bias in recall of falls | Low risk | Quote: "During the 12‐week period, participants sent in postcards weekly with information pertaining to insole comfort, hours of wear, and falls." "There was 100% compliance in completing the weekly reports." |
Pfeifer 2000.
| Study characteristics | ||
| Methods | RCT | |
| Participants | Setting: Germany N = 148 Sample: healthy ambulatory community‐living women recruited through advertisement Age (years): ≥ 70 Inclusion criterion: 25‐hydroxycholecalciferol serum level below 50 nmol/litre Exclusion criteria: hypercalcaemia, primary hyperparathyroidism, osteoporotic extremity fracture, treatment with bisphosphonate, calcitonin, vitamin D or metabolites, oestrogen, tamoxifen in past 6 months; fluoride in last 2 years; anticonvulsants or medications possibly interfering with postural stability or balance; intolerance to vitamin D or calcium; chronic renal failure; drug, alcohol, caffeine, or nicotine abuse; diabetes mellitus; holiday at different latitude | |
| Interventions | An 8‐week supplementation at the end of winter 1. 400 IU vitamin D plus 600 mg elemental calcium (calcium carbonate) 2. Control: 600 mg calcium carbonate | |
| Outcomes | 1. Rate of falls 2. Number of people falling 3. Number sustaining a fracture Other outcomes reported but not included in this review | |
| Duration of the study | 1 year | |
| Notes | ||
| Risk of bias | ||
| Bias | Authors' judgement | Support for judgement |
| Random sequence generation (selection bias) | Unclear risk | Quote: "randomly assigned" |
| Allocation concealment (selection bias) | Unclear risk | Insufficient information to permit judgement |
| Blinding of participants and personnel (performance bias) All outcomes | Low risk | Double‐blind, controlled trial |
| Blinding of outcome assessment (detection bias) Falls and fallers | Low risk | Both assessors and participants blinded. Quote: "The number of falls was recorded by questionnaire." |
| Blinding of outcome assessment (detection bias) Fractures | Low risk | Quote: "All fractures were the result of falls and were verified by X‐ray and medical reports." |
| Incomplete outcome data (attrition bias) Falls | Low risk | SeeAppendix 3 for method of assessment |
| Incomplete outcome data (attrition bias) Fallers | Low risk | SeeAppendix 3 for method of assessment |
| Risk of bias in recall of falls | High risk | Retrospective. Falls and fractures monitored retrospectively by questionnaire at 1 year. |
Pfeifer 2009.
| Study characteristics | ||
| Methods | RCT (2 centres) | |
| Participants | Setting: Bad Pyrmont, Germany, and Graz, Austria N = 242 Sample: healthy community‐dwelling people recruited by advertisements and mailing lists (79% women) Age (years): mean 74 (SD 4) Inclusion criteria: ambulatory; aged ≥ 70; serum 25‐hydroxyvitamin D below 78 nmol/litre) Exclusion criteria: hypercalcaemia or primary hyperparathyroidism; fractures of the extremities due to osteoporosis; therapy with a thiazide, bisphosphonate, calcitonin, vitamin D and vitamin D metabolites, oestrogen, or anti‐oestrogen in the past 6 months or fluoride treatment in the past 2 years; known intolerance to study medication; chronic renal failure (serum creatinine above 20% of the upper limit of the reference range); history of drug or alcohol abuse; nicotine abuse (more than 20 cigarettes per day); > 7 cups of coffee per day; scheduled holidays along the geographic longitude during the study period; diabetes mellitus; severe cardiovascular disease |
|
| Interventions | 1. Intervention: 1000 mg calcium plus 800 IU of cholecalciferol (vitamin D)/day (1 tablet) in 2 divided doses for 12 months 2. Control: 1000 mg calcium/day (1 tablet) in 2 divided doses for 12 months |
|
| Outcomes | 1. Number of people falling 2. Number sustaining a fracture |
|
| Duration of the study | 12 months (for fallers outcome) 20 months (for fractures) | |
| Notes | ||
| Risk of bias | ||
| Bias | Authors' judgement | Support for judgement |
| Random sequence generation (selection bias) | Unclear risk | Detail of randomisation is not described. Quote: "subjects were randomly assigned to either the calcium mono or the calcium plus vitamin D group." |
| Allocation concealment (selection bias) | Unclear risk | Insufficient information to permit judgement |
| Blinding of participants and personnel (performance bias) All outcomes | Low risk | Quote: "Individuals received in a double blinded fashion either 1000 mg of calcium or 1000 mg of calcium plus 800 IU of vitamin D per day over a treatment period of 12 months, which was followed by a treatment‐free but still blinded observation period of 8 months" |
| Blinding of outcome assessment (detection bias) Falls and fallers | Low risk | Blinding of outcome assessors is not specifically described. However, double‐blinding throughout the 20 months is asserted. |
| Blinding of outcome assessment (detection bias) Fractures | Low risk | Blinding of outcome assessors is not specifically described. However, double‐blinding throughout the 20 months is asserted. Quote: "All fractures were the result of falls and were verified by x‐rays and medical reports." |
| Incomplete outcome data (attrition bias) Falls | Unclear risk | SeeAppendix 3 for method of assessment |
| Incomplete outcome data (attrition bias) Fallers | Unclear risk | SeeAppendix 3 for method of assessment. Insufficient information to permit judgement. |
| Risk of bias in recall of falls | Low risk | Quote: "The number of falls was recorded by fall diaries. Each day the participants had to make a cross depending on whether a fall had occurred or not." However, telephone contact only every 2 months (not monthly or more frequent) but unlikely to seriously affect recall. |
Pighills 2011.
| Study characteristics | ||
| Methods | RCT | |
| Participants | Setting: affluent rural and deprived urban areas, Yorkshire, United Kingdom
N = 238
Sample: recruited from 13 GP lists in the Airedale NHS Trust (67% women)
Age (years): mean 79 (SD 6)
Inclusion criteria: community‐dwelling; aged ≥ 70; history of ≥ 1 fall in previous 12 months Exclusion criteria: living in nursing or residential care homes; receiving OT services; had fall‐specific OT intervention in past year |
|
| Interventions | 1. Environmental assessment provided by OT, recommendations sent to participant and referrals made for equipment and other input 2. As above, but provided by a trained non‐professionally qualified domiciliary support worker 3. Control: usual care from GP |
|
| Outcomes | 1. Rate of falls 2. Number of people falling Other outcomes reported but not included in this review | |
| Duration of the study | 12 months | |
| Notes | ||
| Risk of bias | ||
| Bias | Authors' judgement | Support for judgement |
| Random sequence generation (selection bias) | Low risk | Quote: "The computer‐generated outcome of randomization was automatically e‐mailed to an independent person" |
| Allocation concealment (selection bias) | Low risk | Quote: "The York Trials Unit independently and remotely conducted simple Web‐based randomization ... The computer‐generated outcome of randomization was automatically e‐mailed to an independent person who passed the participant's case notes on to the contact person for the group to which they had been randomized." |
| Blinding of participants and personnel (performance bias) All outcomes | High risk | Participants and personnel carrying out the intervention were aware of group allocation |
| Blinding of outcome assessment (detection bias) Falls and fallers | Low risk | Quote: "Calendars that were not returned within 2 weeks of the end of the month prompted a telephone contact from an independent, blinded interviewer to ascertain whether the participant had fallen." "All reported falls were followed up with a blinded, structured telephone interview to investigate the circumstances and consequences." "Staff of the York Trials Unit inputted questionnaire data which was checked twice for accuracy." |
| Incomplete outcome data (attrition bias) Falls | Unclear risk | SeeAppendix 3 for method of assessment |
| Incomplete outcome data (attrition bias) Fallers | Low risk | SeeAppendix 3 for method of assessment |
| Risk of bias in recall of falls | Low risk | Used postcard diary, mailed monthly. Followed up in 2 weeks if did not send. Participants also provided with toll‐free telephone number so that they could report falls contemporaneously of they sustained multiple falls or had difficulty recalling falls. |
Pit 2007.
| Study characteristics | ||
| Methods | RCT (cluster‐randomised by general practice) | |
| Participants | Setting: general practices in Hunter Region, New South Wales, Australia N = 849 participants (17 practices, 23 GPs) Sample: attending general practices and invited by practice staff (59% women) Age (years): ≥ 65 Inclusion criteria: GPs: based at their current practice for at least 12 months; working ≥ 10 hours per wk; member of a randomly selected network of practices. Patients: aged ≥ 65; community‐dwelling Exclusion criterion: confused patients not accompanied by a caregiver | |
| Interventions | 1. GPs: education (academic detailing (2 visits from pharmacist), provision of prescribing information and feedback); completion of medication review checklist; financial rewards. Patients: completed medication risk assessment form 2. Control: GPs: no academic detailing but received feedback on number of medication reviews completed and medication risk factors. Patients: completed medication risk assessment form but not passed on to GP for action | |
| Outcomes | 1. Number of people falling | |
| Duration of the study | 1 year | |
| Notes | ||
| Risk of bias | ||
| Bias | Authors' judgement | Support for judgement |
| Random sequence generation (selection bias) | Low risk | Assignment undertaken "using computer‐generated random number allocation in SAS software" |
| Allocation concealment (selection bias) | Low risk | Randomisation carried out by off‐site statistician |
| Blinding of participants and personnel (performance bias) All outcomes | Unclear risk | Quote: "The sequence was not concealed from ... the doctors who needed to conduct the intervention. However, participants, practice staff, data collectors, outcome assessors and data managers were unaware of the treatment allocation." |
| Blinding of outcome assessment (detection bias) Falls and fallers | Low risk | Falls reported by participants who were unaware of their group allocation. Data collectors also blind to allocation. |
| Incomplete outcome data (attrition bias) Fallers | High risk | SeeAppendix 3 for method of assessment |
| Risk of bias in recall of falls | High risk | Retrospective interval recall. Falls ascertained by phone at 4 and 12 months. |
Porthouse 2005.
| Study characteristics | ||
| Methods | RCT (multicentre) | |
| Participants | Setting: United Kingdom N = 3314 Sample: community‐dwelling women registered with 107 general practices in England Age (years): mean 76.9 (SD 5.1) Inclusion criteria: age ≥ 70; female; community‐dwelling; ≥ 1 risk factors for fracture Exclusion criteria: cognitive impairment; life expectancy < 6 months; unable to give written consent; taking more than 500 mg calcium supplementation per day; history of kidney or bladder stones, renal failure or hypercalcaemia | |
| Interventions | 1. Oral vitamin D3 800 IU (Calcichew D3 Forte) + oral 1000 mg calcium (calcium carbonate) daily for 6 months plus session with practice nurse, life‐style advice on how to reduce risk of fracture + leaflet on dietary sources of vitamin D 2. Control: no supplementation. Sent same leaflet as intervention group received | |
| Outcomes | 1. Rate of falls 2. Number of people falling 3. Number sustaining a fracture Falls are a secondary outcome in this study. Other outcomes reported but not included in this review | |
| Duration of the study | 1 year | |
| Notes | ||
| Risk of bias | ||
| Bias | Authors' judgement | Support for judgement |
| Random sequence generation (selection bias) | Low risk | Randomised (stratified by GP practice), by computer. Initially 2:1 ratio in favour of the control group to achieve most statistical power within budget. Changed to 1:1 towards end of study after re‐analysis of trial's cost profile. |
| Allocation concealment (selection bias) | Low risk | Quote: "Randomised at the York Trials Unit, by an independent person who had no knowledge of the baseline characteristics of participants." |
| Blinding of participants and personnel (performance bias) All outcomes | Unclear risk | Pharmaceutical open randomised trial. Quote: "Fewer than 6% of control participants had started calcium and vitamin D by 18 months". |
| Blinding of outcome assessment (detection bias) Falls and fallers | High risk | Outcome data collected by 6‐monthly postal questionnaires. Neither participants nor research staff blinded. |
| Blinding of outcome assessment (detection bias) Fractures | Low risk | Quote: "GPs of women who reported having a fracture were asked to confirm a fracture ... where participants had not completed the final follow‐up questionnaire, but had not withdrawn from the study, fracture information was collected from their GP." |
| Incomplete outcome data (attrition bias) Falls | Low risk | SeeAppendix 3 for method of assessment |
| Incomplete outcome data (attrition bias) Fallers | Low risk | SeeAppendix 3 for method of assessment |
| Risk of bias in recall of falls | High risk | Retrospective. Falls reported in 6‐monthly postal questionnaires. |
Prince 2008.
| Study characteristics | ||
| Methods | RCT | |
| Participants | Setting: Perth, Australia N = 302 Sample: women attending A&E; receiving home nursing management of falls; from electoral roll Age (years): mean 77.2 (SD 3.6) Inclusion criteria: aged 70 to 90 years; history of falling in last 12 months; plasma 25OHD < 24 ng/ml Exclusion criteria: current consumption of vitamin D or bone or mineral active agents other than calcium; BMD z score at total hip site <‐2.0; medical conditions or disorders affecting bone metabolism; fracture in last 6 months; MMSE < 24; neurological conditions affecting balance, e.g. stroke or Parkinson's disease | |
| Interventions | 1. 1000 IU/day ergocalciferol (vitamin D2) with evening meal + 1000 mg/day calcium citrate (two 250 mg tablets with breakfast and evening meal) for 1 year 2. Control: placebo + 1000 mg/day calcium citrate (two 250 mg tablets with breakfast and evening meal) for 1 year | |
| Outcomes | 1. Number of people falling 2. Proportion of people with adverse effects | |
| Duration of the study | 1 year | |
| Notes | ||
| Risk of bias | ||
| Bias | Authors' judgement | Support for judgement |
| Random sequence generation (selection bias) | Low risk | Used random number generator with block size of 10 to randomise in a ratio of 1:1 |
| Allocation concealment (selection bias) | Low risk | Randomisation schedule generated by "independent research scientist". Schedule kept in pharmacy department of hospital where bottles were labelled and dispensed to participants. |
| Blinding of participants and personnel (performance bias) All outcomes | Low risk | Double‐blind, placebo‐controlled study |
| Blinding of outcome assessment (detection bias) Falls and fallers | Low risk | Falls reported by participants who were blind to their group allocation (placebo‐controlled trial) |
| Blinding of outcome assessment (detection bias) Fractures | Unclear risk | Self reported adverse events (including fractures) requiring contact with physician. Participants blind to allocated group but fractures not confirmed from records. |
| Incomplete outcome data (attrition bias) Fallers | Low risk | SeeAppendix 3 for method of assessment |
| Risk of bias in recall of falls | High risk | Retrospective. Interviewed by study staff every 6 weeks by phone or at a clinic visit. |
Ralston 2011.
| Study characteristics | ||
| Methods | RCT (international multicentre) | |
| Participants | Setting: 24 countries N = 515 Sample: women with postmenopausal osteoporosis recruited from 77 centres Age (years): mean 73 Inclusion criteria: aged ≥ 65; osteoporotic (low BMD T scores or previous fragility fracture); vitamin D insufficiency (serum 25[OH]D 8 to 20 ng/ml); increased risk of falls (≥ 1 fall in previous 12 months + reduced lower extremity physical function) Exclusion criteria: using specified drugs affecting bone metabolism; receiving chemotherapy or heparin; unable to stand or walk independently; abnormal electrocardiogram or laboratory safety screening tests; malignancy within previous 5 years; malabsorption syndrome; uncontrolled upper gastrointestinal or cardiovascular disorders; hyperparathyroidism; renal disease |
|
| Interventions | 1. Intervention: weekly alendronate 70 mg + vitamin D3 5600 IU in 1 tablet 2. Control: referred for standard care for osteoporosis from personal physician |
|
| Outcomes | 1. Risk of falling (based on time to first fall) | |
| Duration of the study | 1 year | |
| Notes | ||
| Risk of bias | ||
| Bias | Authors' judgement | Support for judgement |
| Random sequence generation (selection bias) | Low risk | Quote: "Participants were randomized—using a computer‐generated allocation schedule generated by the study sponsor" |
| Allocation concealment (selection bias) | Unclear risk | Allocation is not clearly reported. Quote: "Participants were randomized—using a computer‐generated allocation schedule generated by the study sponsor" "Due to the referred‐care nature of the trial, it was an open‐label design. However, participants, investigators, site staff, and the sponsor's clinical team were blinded to postbaseline concentrations of serum 25(OH)D and BTMs…" |
| Blinding of participants and personnel (performance bias) All outcomes | High risk | Open label study. Quote: "Due to the referred‐care nature of the trial, it was an open‐label design. However, participants, investigators, site staff, and the sponsor's clinical team were blinded to postbaseline concentrations of serum 25(OH)D and BTMs…". |
| Blinding of outcome assessment (detection bias) Falls and fallers | High risk | Self reported falls and likely the study personnel ascertaining falls were aware of allocated group as only blinding to "postbaseline concentrations of serum 25(OH)D and BTMs…" is mentioned. Fall events were also reviewed at office visits where staff were not blind to allocated groups. |
| Incomplete outcome data (attrition bias) Fallers | Low risk | SeeAppendix 3 for method of assessment |
| Risk of bias in recall of falls | Low risk | Quote: "Participants were asked to record falls on a study calendar and to notify the study site of falls by telephone or prestamped postcard. After notification, study‐site personnel telephoned women reporting falls to obtain details about the event, including a description of the fall, the location, contributing factors (e.g., tripping, poor vision), the immediate aftermath, longer‐term consequences, and the medical attention that was required. All participants were also routinely contacted on a monthly basis to survey fall incidences (except when an office visit was scheduled in the same month, where fall events were reviewed). Falls were adjudicated by an independent committee". |
Reid 2006.
| Study characteristics | ||
| Methods | RCT | |
| Participants | Setting: Auckland, New Zealand N = 1471 Sample: women recruited by advertisement and mail‐outs using electoral rolls Age (years): mean 74.2 (SD 4.3) Inclusion criteria: consenting; aged > 55; more than 5 yr postmenopausal Exclusion criteria: free of major ongoing disease including serum creatinine > 1.8 mg/dl (0.2 mmol/litre), untreated hypo‐ or hyperthyroidism, liver disease, serum 25‐hydroxyvitamin D < 10 µg /litre (25 nmol/litre), malignancy, or metabolic bone disease; regular user in the previous year of hormone replacement therapy, anabolic steroids, glucocorticoids, or bisphosphonates; lumbar spine bone density below the age‐appropriate normal range (i.e. z‐score greater than ‐2) |
|
| Interventions | 1. Intervention: calcium citrate 1 g/day in 2 divided doses 2. Control: identical placebo |
|
| Outcomes | 1. Falls per person year reported 2. Number sustaining a fracture Other outcomes reported but not included in this review. Falls are a secondary outcome in this study |
|
| Duration of the study | 5 years | |
| Notes | ||
| Risk of bias | ||
| Bias | Authors' judgement | Support for judgement |
| Random sequence generation (selection bias) | Low risk | Quote: "Treatments were allocated randomly using a minimization algorithm balancing for current thiazide use, age, and the occurrence of fractures resulting from minimal trauma after the age of 40 yr." |
| Allocation concealment (selection bias) | Low risk | Quote: "Subject numbers were allocated and medication was dispensed by staff who had no direct contact with the other study staff or the subjects." |
| Blinding of participants and personnel (performance bias) All outcomes | Low risk | States "double blind" and "medication was dispensed by staff who had no direct contact with the other study staff or the subjects" |
| Blinding of outcome assessment (detection bias) Falls and fallers | Unclear risk | Insufficient information about ascertainment of falls to permit judgement |
| Blinding of outcome assessment (detection bias) Fractures | Low risk | States "double blind" and "medication was dispensed by staff who had no direct contact with the other study staff or the subjects". Subjects were asked at each 6‐month visit about fractures. If reported, the relevant radiograph or report was obtained. |
| Incomplete outcome data (attrition bias) Falls | Low risk | SeeAppendix 3 for method of assessment |
| Risk of bias in recall of falls | Unclear risk | "Subjects kept a diary of falls." Details unclear. |
Reinsch 1992.
| Study characteristics | ||
| Methods | RCT (cluster‐randomised by senior centre. 2 x 2 factorial design) | |
| Participants | Setting: Los Angeles County and Orange County, California, USA N = 230 Sample: recruited from 16 senior centres (80% women) Age (years): mean 74.2 (SD 6.0) Inclusion criteria: aged over 60 Exclusion criteria: none listed | |
| Interventions | 1. "Stand up/step up" exercise programme, with preliminary stretching exercise (1 hour, 3 x per wk for 52 wks) 2. Cognitive‐behavioural intervention consisting of relaxation training, reaction time training and health and safety curriculum (1 hour, 1 x per wk for 52 wks) 3. Exercise (2 x per wk) and cognitive intervention (1 x per wk) for 52 wks 4. Discussion control group (1 hour, 1 x per wk for 52 wks) | |
| Outcomes | 1. Number of people falling | |
| Duration of the study | 1 year | |
| Notes | MacRae paper includes a subset of results for only 2 arms of the study, in Los Angeles county only | |
| Risk of bias | ||
| Bias | Authors' judgement | Support for judgement |
| Random sequence generation (selection bias) | Unclear risk | Quote: "randomly assigned to treatments" |
| Allocation concealment (selection bias) | High risk | Cluster‐randomised |
| Blinding of participants and personnel (performance bias) All outcomes | Unclear risk | Participants and personnel implementing the intervention not blind to allocated group, but impact of non‐blinding unclear |
| Blinding of outcome assessment (detection bias) Falls and fallers | Unclear risk | Falls reported by participants who were aware of their group allocation. Blinding of research assistant not described. |
| Incomplete outcome data (attrition bias) Fallers | Low risk | SeeAppendix 3 for method of assessment |
| Risk of bias in recall of falls | Low risk | Prospective. Monthly diaries plus weekly phone calls or visits. |
Resnick 2002.
| Study characteristics | ||
| Methods | RCT | |
| Participants | Setting: Baltimore, Maryland, USA N = 20 Sample: women in a continuing care retirement community Age (years): mean 88 (SD 3.7) Inclusion criteria: able to walk 50 feet with or without assistive device; sedentary lifestyle Exclusion criteria: cognitive impairment (MMSE > 20); terminal illness; medical condition precluding participation in aerobic exercise | |
| Interventions | 1. WALK intervention: walk (join group or walk alone 20 min per wk); address pain fear fatigue during exercise; learn about exercise; cue by self modelling 2. Control: no intervention | |
| Outcomes | 1. Number of falls (mean), but not rate. Insufficient data to include in analysis | |
| Duration of the study | 6 months (during intervention only) | |
| Notes | Participants lived independently in apartments, and could ambulate independently. (Personal correspondence). Pilot study with no usable data | |
| Risk of bias | ||
| Bias | Authors' judgement | Support for judgement |
| Random sequence generation (selection bias) | Low risk | Randomised by coin flip (personal communication) |
| Allocation concealment (selection bias) | Unclear risk | Insufficient information to permit judgement |
| Blinding of participants and personnel (performance bias) All outcomes | Unclear risk | Participants and personnel implementing the intervention not blind to allocated group, but impact of non‐blinding unclear |
| Blinding of outcome assessment (detection bias) Falls and fallers | Unclear risk | Falls reported by participants who were aware of their group allocation. Blinding of research assistant not described. |
| Incomplete outcome data (attrition bias) Falls | Low risk | SeeAppendix 3 for method of assessment |
| Risk of bias in recall of falls | Unclear risk | Quote: "based on self‐report". No additional information. |
Robertson 2001a.
| Study characteristics | ||
| Methods | RCT | |
| Participants | Setting: West Auckland, New Zealand
N = 240
Sample: identified from computerised registers at 17 general practices (68% women) Age (years): mean 80.9 (SD 4.2), range 75 to 95 Inclusion criteria: aged ≥ 75; living at home Exclusion criteria: unable to walk around own residence; already receiving physiotherapy; unable to understand trial requirements |
|
| Interventions | 1. Home exercise programme, individually prescribed by district nurse in conjunction with her district nursing duties (see Notes) Visit from nurse at 1 wk (1 hour) and at 2, 4, 8 wks, and 6 months (half hour) plus monthly telephone call to maintain motivation Progressively difficult strength and balance retraining exercises plus walking plan. Participants expected to exercise 3 x per wk and walk 2 x per wk for 1 year 2. Control: usual care | |
| Outcomes | 1. Rate of falls
2. Number of people falling 3. Number sustaining a fracture |
|
| Duration of the study | 1 year | |
| Notes | District nurse had no previous experience in exercise prescription. Received 1 weeks' training from research group's physiotherapist, who also made site visits and phone calls to monitor quality. Otago Exercise Programme manual can be obtained from www.cdc.gov/HomeandRecreationalSafety/Falls/compendium/1.2_otago.html. Cost‐effectiveness analysis reported in primary reference. | |
| Risk of bias | ||
| Bias | Authors' judgement | Support for judgement |
| Random sequence generation (selection bias) | Low risk | Randomised using allocation schedule developed using computer‐generated numbers |
| Allocation concealment (selection bias) | Low risk | Assignment by independent person off site |
| Blinding of participants and personnel (performance bias) All outcomes | Unclear risk | Participants and personnel implementing the intervention not blind to allocated group, but impact of non‐blinding unclear |
| Blinding of outcome assessment (detection bias) Falls and fallers | Low risk | Falls reported by participants who were aware of their group allocation. Phoned by independent assessor blind to allocation. Person classifying fall events also blind to allocation. |
| Blinding of outcome assessment (detection bias) Fractures | Low risk | Quote: "... “serious” injuries [including fractures] were confirmed from hospital and general practice records. The investigator classifying fall events remained blind to group allocation." |
| Incomplete outcome data (attrition bias) Falls | Low risk | SeeAppendix 3 for method of assessment |
| Incomplete outcome data (attrition bias) Fallers | Low risk | SeeAppendix 3 for method of assessment |
| Risk of bias in recall of falls | Low risk | Active fall registration with daily postcard calendars returned monthly + telephone calls |
Robson 2003.
| Study characteristics | ||
| Methods | RCT | |
| Participants | Setting: Edmonton area and 2 rural communities in Alberta, Canada N = 660 Sample: healthy volunteers (81% women) Age (years): mean 73.0 (SD 6.7) Inclusion criteria: able to walk unassisted for 20 min; to get down and up off the floor unassisted Exclusion criteria: dizzy spells or "other health problems that made it difficult for them to function" | |
| Interventions | 1. Two 90‐minute group sessions 1 month apart taken by lay senior facilitators. Session 1) Given Client Handbook (self assessed risk and risk reduction strategies relating to balance, strength, shoes, vision, medications, environmental hazards, paying attention). Instructed to complete assessment and implement strategies to reduce risk by session 2. Given fitness video (Tai Chi movements for balance and leg strength). Used video in Session 1 and instructed to use daily for 20 min or get involved in community exercise programme for 45 min 3 x per wk. Asked to identify and report community hazards. Session 2) no details of this session provided in paper. 2. Control: received no intervention until after 4 months | |
| Outcomes | 1. Number of people falling | |
| Duration of the study | 4 months | |
| Notes | SAYGO (Steady As You Go) program | |
| Risk of bias | ||
| Bias | Authors' judgement | Support for judgement |
| Random sequence generation (selection bias) | Unclear risk | Quote: "Randomly assigned by phone". Insufficient information to permit judgement. |
| Allocation concealment (selection bias) | Unclear risk | Quote: "Randomly assigned by phone". Insufficient information to permit judgement. |
| Blinding of participants and personnel (performance bias) All outcomes | Unclear risk | Participants and personnel implementing the intervention not blind to allocated group, but impact of non‐blinding unclear |
| Blinding of outcome assessment (detection bias) Falls and fallers | Unclear risk | Falls reported by participants who were aware of their group allocation. Unclear whether people phoning were blind to allocation. |
| Incomplete outcome data (attrition bias) Fallers | Unclear risk | SeeAppendix 3 for method of assessment. Insufficient information to permit judgement (number randomised to each group not stated). |
| Risk of bias in recall of falls | Low risk | Falls ascertained by mail‐in calendars returned monthly with telephone follow‐up |
Rubenstein 2000.
| Study characteristics | ||
| Methods | RCT | |
| Participants | Setting: California, USA N = 59 Sample: men recruited from Veterans Administration ambulatory care centre (volunteers) Age (years): mean 74 Inclusion criteria: aged ≥ 70; ambulatory; ≥ 1 fall risk factor: lower limb weakness, impaired gait, impaired balance, more than 1 fall in previous 6 months Exclusion criteria: exercised regularly; severe cardiac or pulmonary disease; terminal illness; severe joint pain; dementia; medically unresponsive depression; progressive neurological disease | |
| Interventions | 1. Exercise sessions (strength, endurance, and balance training) in groups of 16 to 20, 90 min, 3 x per wk for 12 wks 2. Control: usual activities | |
| Outcomes | 1. Rate of falls 2. Number of people falling | |
| Duration of the study | 3 months | |
| Notes | ||
| Risk of bias | ||
| Bias | Authors' judgement | Support for judgement |
| Random sequence generation (selection bias) | Low risk | Randomised in blocks of 16 to 20 at 3 to 6‐month intervals, using randomly generated sequence cards in sealed envelopes |
| Allocation concealment (selection bias) | Unclear risk | Cards in sealed envelopes |
| Blinding of participants and personnel (performance bias) All outcomes | Unclear risk | Participants and personnel implementing the intervention not blind to allocated group, but impact of non‐blinding unclear |
| Blinding of outcome assessment (detection bias) Falls and fallers | High risk | Falls reported by participants who were aware of their group allocation. Person ascertaining falls was aware of group allocation. |
| Incomplete outcome data (attrition bias) Falls | Low risk | SeeAppendix 3 for method of assessment |
| Incomplete outcome data (attrition bias) Fallers | Low risk | SeeAppendix 3 for method of assessment |
| Risk of bias in recall of falls | High risk | No active fall registration. Fall ascertainment for intervention group at weekly classes. Controls phoned every 2 weeks. |
Rubenstein 2007.
| Study characteristics | ||
| Methods | CCT (cluster‐randomised) | |
| Participants | Setting: Sepulveda Ambulatory Care Center, California (USA) N = 792 Sample: patients receiving care at ambulatory care centre (only 3% women) Age (years): mean 74.5 (SD 6) Inclusion criteria: aged ≥ 65; previously randomised to either of the 2 practice groups involved in the trial; ≥ 1 clinic visit in previous 18 months; scoring ≥ 4 on GPSS Exclusion criteria: living over 30 miles from care centre; already enrolled in outpatient geriatric services at care centre; living in long‐term care facility; scoring less than 4 GPSS | |
| Interventions | 1. Structured risk and needs assessment and referral algorithm implemented by case manager (physician assistant). Targetting 5 geriatric conditions including falls. Assessment followed by referrals and recommendations for further assessment or treatment. 3‐monthly telephone contact with case manager 2. Control: usual care | |
| Outcomes | 1. Rate of falls 2. Number of people falling |
|
| Duration of the study | 3 years | |
| Notes | ||
| Risk of bias | ||
| Bias | Authors' judgement | Support for judgement |
| Random sequence generation (selection bias) | High risk | Participants "previously" randomised to one of 3 primary care practice groups using last 2 digits of Social Security number. 2 practice groups then randomised to intervention or control. Third group not included as used in prior pilot study. (personal communication) |
| Allocation concealment (selection bias) | High risk | 2 groups therefore alternation |
| Blinding of participants and personnel (performance bias) All outcomes | Unclear risk | Participants and personnel implementing the intervention not blind to allocated group, but impact of non‐blinding unclear |
| Blinding of outcome assessment (detection bias) Falls and fallers | Low risk | Falls reported by participants who were aware of their group allocation. Assessment research staff blind to allocation. |
| Incomplete outcome data (attrition bias) Falls | Low risk | SeeAppendix 3 for method of assessment |
| Incomplete outcome data (attrition bias) Fallers | Low risk | SeeAppendix 3 for method of assessment |
| Risk of bias in recall of falls | High risk | Retrospective recall. Annual telephone follow‐up each year for 3 years. Text states participants asked "about incidence of falls in the previous year" but table 2 reports one or more falls in the preceding 3 months. |
Russell 2010.
| Study characteristics | ||
| Methods | RCT | |
| Participants | Setting: 7 emergency departments, Melbourne, Australia N = 712 Sample: people presenting to ED after a fall (70% women) Age (years): 13% 60 to 64; 17% 65 to 70; 19% 70 to 74; 19% 75 to 79; 32% ≥ 80 Inclusion criteria: age ≥ 60; community‐dwelling; presenting to ED after a fall and discharged straight home Exclusion criteria: unable to comply with simple instructions; unable to walk independently indoors (with or without a walking aids) | |
| Interventions | 1. Intervention: standard care in ED + assessed (FROP‐Com) and offered multifactorial falls prevention programme consisting of referrals to existing community services and health promotion recommendations. Participants at high risk of falls (FROP‐Com score ≥ 25) referred to falls clinic for comprehensive multidisciplinary assessment 2. Control: standard care in ED + letter to participants informing them of level of falls risk (FROP‐Com), recommendation to speak to GP about this | |
| Outcomes | 1. Rate of falls 2. Number of people falling 3. Number sustaining a fracture Other outcomes reported but not included in this review |
|
| Duration of the study | 1 year | |
| Notes | ||
| Risk of bias | ||
| Bias | Authors' judgement | Support for judgement |
| Random sequence generation (selection bias) | Low risk | Quote: "Randomization was performed using a computer‐generated randomization list." |
| Allocation concealment (selection bias) | Low risk | Quote: "A researcher otherwise not involved in the project generated and held the randomization sequence." |
| Blinding of participants and personnel (performance bias) All outcomes | High risk | Participants and personnel aware of group intervention. Quote: "Participants allocated to the standard care group received standard care arranged by ED staff and a letter informing them of their FROP‐Com falls risk (low, moderate, or high). The letter advised participants to speak to their family physician about their risk of falling". The control group could have received fall prevention interventions which were not part of the study. |
| Blinding of outcome assessment (detection bias) Falls and fallers | Low risk | Quote: "The intervention and standard care groups received the same contact with the research team over the 12‐month monitoring period". Quote: "A research staff member unaware of group allocation telephoned participants who did not return their falls calendars" |
| Blinding of outcome assessment (detection bias) Fractures | Unclear risk | Falls and injuries self reported in falls diaries. Quote: "After each participant's 12‐month follow‐up period, his or her hospital medical record was reviewed to verify ED presentations, days in the hospital, and when available, falls and fall injuries." Not clear who extracted data from medical record and whether they were blind to treatment allocation. |
| Incomplete outcome data (attrition bias) Falls | Low risk | SeeAppendix 3 for method of assessment |
| Incomplete outcome data (attrition bias) Fallers | Low risk | SeeAppendix 3 for method of assessment |
| Risk of bias in recall of falls | Low risk | Quote: "Participants recorded falls and injuries on a falls calendar, which they were asked to return monthly using a postage‐paid mail." |
Ryan 1996.
| Study characteristics | ||
| Methods | RCT | |
| Participants | Setting: Baltimore, Maryland, USA N = 45 Sample: rural and urban dwelling women. Volunteers from senior meal sites Age (years): mean 78; range 67 to 90 Inclusion criteria: aged ≥ 65; living alone in own home; ambulatory with or without assistive devices; with telephone for follow‐up | |
| Interventions | Interview and physical assessment by nurse prior to randomisation 1. 1‐hour fall prevention education programme discussing personal (intrinsic) and environmental (extrinsic) risk modification in small groups of 7 to 8 women (nurse led) 2. Same educational programme but individual sessions with nurse 3. Controls received health promotion presentation (no fall prevention component) in small groups of 7 to 8 |
|
| Outcomes | 1. Rate of falls 2. Number of people falling | |
| Duration of the study | 3 months | |
| Notes | Pilot research. Primarily to test methodology of a fall prevention education programme and resulting changes in fall prevention behaviour. 2 intervention arms combined in analysis in the review | |
| Risk of bias | ||
| Bias | Authors' judgement | Support for judgement |
| Random sequence generation (selection bias) | Unclear risk | Method of randomisation not described |
| Allocation concealment (selection bias) | Unclear risk | Insufficient information to permit judgement |
| Blinding of participants and personnel (performance bias) All outcomes | Unclear risk | Participants and personnel implementing the intervention not blind to allocated group, but impact of non‐blinding unclear |
| Blinding of outcome assessment (detection bias) Falls and fallers | High risk | Falls reported by participants who were aware of their group allocation. Telephone contact (only method of ascertaining falls) was not blinded (both groups asked about falls but intervention groups asked about recollection of intervention). |
| Incomplete outcome data (attrition bias) Falls | Low risk | SeeAppendix 3 for method of assessment |
| Incomplete outcome data (attrition bias) Fallers | Low risk | SeeAppendix 3 for method of assessment |
| Risk of bias in recall of falls | High risk | Retrospective recall by monthly phone call for 3 months |
Ryan 2010.
| Study characteristics | ||
| Methods | RCT (multicentre) | |
| Participants | Setting: 22 centres across the United Kingdom, Europe and North America (5 countries) N = 141 Sample: patients with cardioinhibitory CSH identified in A&E, geriatric medicine, general medicine, and orthopaedic facilities (62% women) Age (years): mean 78 (SD 7) Inclusion criteria: aged > 50 years, ≥ 2 unexplained falls and/or 1 unexplained syncopal event in previous 12 months, cardioinhibitory response (> 3 seconds asystole) to carotid sinus massage Exclusion criteria: cognitive impairment (MMSE < 20), atrial fibrillation | |
| Interventions | 1. Pacemaker: Medtronic Kappa 700 (Europe) or Kappa 400 (North America) pacemaker 2. Control: implantable loop recorder (Medtronic Reveal) | |
| Outcomes | 1. Rate of falls 2. Number of people falling |
|
| Duration of the study | Mean 24 months | |
| Notes | ||
| Risk of bias | ||
| Bias | Authors' judgement | Support for judgement |
| Random sequence generation (selection bias) | Low risk | Quote: "Participants were randomised to receive an implantable loop recorder or dual‐chamber pacemaker according to a computer‐generated randomisation. The sample was stratified by centre." |
| Allocation concealment (selection bias) | Unclear risk | Insufficient information to permit judgement. Quote: "Randomisation, data collation and diary card interpretation were carried out by researchers blind to the number of diaries returned by each subject." |
| Blinding of participants and personnel (performance bias) All outcomes | Low risk | Pacemaker or loop recorder – patients unaware of allocation and unlikely to introduce performance bias in personnel |
| Blinding of outcome assessment (detection bias) Falls and fallers | Unclear risk | Self reported falls. Quote: "Randomisation, data collation and diary card interpretation were carried out by researchers blind to the number of diaries returned by each subject." Unclear whether people collating data or interpreting diary cards were blind to allocated group. |
| Incomplete outcome data (attrition bias) Falls | Low risk | SeeAppendix 3 for method of assessment |
| Incomplete outcome data (attrition bias) Fallers | Low risk | SeeAppendix 3 for method of assessment |
| Risk of bias in recall of falls | Low risk | Quote: "participants completed falls diaries at the end of each week and received monthly telephone interviews, a process that had already been piloted with compliance rates >80%" |
Salminen 2009.
| Study characteristics | ||
| Methods | RCT | |
| Participants | Setting: Pori, Finland N = 591 Sample: volunteers identified through advertising etc. (84% women) Age (years): 62% aged 65 to 74, 38% aged ≥ 75 Inclusion criteria: aged ≥ 65 years; fallen in last year; MMSE ≥ 17; able to walk 10 m independently; living at home or sheltered housing Exclusion criteria: none described | |
| Interventions | 1. Intervention: geriatric assessment, individually tailored intervention targeting muscle strength and balance (advised to carry out physical exercises 3 x per wk at home), exercise in groups (3 levels according to physical performance), vision (referral), nutritional guidance or referral, medications, depression, treatment and prevention of osteoporosis, home hazard modification. All received calcium and vitamin D 2. Control: counselling and guidance after comprehensive assessments | |
| Outcomes | 1. Rate of falls
2. Number of fallers Number of fractures (not number sustaining a fracture) |
|
| Duration of the study | 1 year | |
| Notes | ||
| Risk of bias | ||
| Bias | Authors' judgement | Support for judgement |
| Random sequence generation (selection bias) | Unclear risk | Quote: "Randomized". No description of sequence generation. |
| Allocation concealment (selection bias) | Low risk | Quote: "using consecutively numbered, sealed envelopes" |
| Blinding of participants and personnel (performance bias) All outcomes | Unclear risk | Quote: "Participants and those administering the intervention were not blinded to group assignment." Insufficient evidence to make judgement on impact of lack of blinding. |
| Blinding of outcome assessment (detection bias) Falls and fallers | Low risk | Quote: "The research assistants who interviewed the participants by telephone during the follow‐up period were blinded to group assignment." |
| Incomplete outcome data (attrition bias) Falls | Low risk | SeeAppendix 3 for method of assessment |
| Incomplete outcome data (attrition bias) Fallers | Low risk | SeeAppendix 3 for method of assessment |
| Risk of bias in recall of falls | Low risk | Quote: "recorded by fall diaries that subjects were asked to mail to the research assistants monthly." |
Sanders 2010.
| Study characteristics | ||
| Methods | RCT | |
| Participants | Setting: South Victoria, Australia N = 2258 Sample: mail outs to age‐eligible women on electoral roles and other strategies Age (years): median (IQR) 76.0 (70.0 to 93.9) Inclusion criteria: aged ≥ 70; community‐dwelling; high risk of hip fracture, e.g. maternal hip fracture, past hip fracture, self reported faller Exclusion criteria: resident in high‐level care facility; unable to give informed consent or information about falls or fracture history; hypercalcaemia; vit D supplement > 400 IU/day; antifracture therapy; calcitriol; renal disease (creatinine > 150 umol/L); sarcoidosis, TB or lymphoma | |
| Interventions | 1. Intervention: annual oral dose of 500,000 IU cholecalciferol every autumn for 5 years 2. Control: annual oral placebo dose | |
| Outcomes | 1. Rate of falls 2. Number of people falling 3. Number sustaining a fracture 4. Adverse effects Other outcomes reported but not included in this review |
|
| Duration of the study | 5 years | |
| Notes | Vital D Study | |
| Risk of bias | ||
| Bias | Authors' judgement | Support for judgement |
| Random sequence generation (selection bias) | Low risk | Quote: "An independent statistician carried out computer randomisation of participants using their unique study identification numbers and the statistical software Minitab™ (version 13)." |
| Allocation concealment (selection bias) | Low risk | Quote: "The randomization lists of 'active' and 'placebo' status were then directly emailed to the hospital's clinical trials pharmacist who was responsible for all dispensing of study medication throughout the trial." |
| Blinding of participants and personnel (performance bias) All outcomes | Low risk | Quote: "The Vital D Study was designed as a double blind, placebo‐controlled trial" "The participants and study staff were blinded to intervention group" |
| Blinding of outcome assessment (detection bias) Falls and fallers | Low risk | Quote: "When a fall or fracture was indicated, a standardized questionnaire recording details was administered by telephone." "The participants and study staff were blinded to intervention group" |
| Blinding of outcome assessment (detection bias) Fractures | Low risk | Quote: "When a fall or fracture was indicated, a standardized questionnaire recording details was administered by telephone. Only fractures radiologically confirmed were included in the analyses" |
| Incomplete outcome data (attrition bias) Falls | Low risk | SeeAppendix 3 for method of assessment |
| Incomplete outcome data (attrition bias) Fallers | Low risk | SeeAppendix 3 for method of assessment |
| Risk of bias in recall of falls | Low risk | Quote: "Falls and fractures were recorded using postcard calendars completed daily by writing F if they had a fall, fracture, or both and N if they did not and were returned monthly by prepaid post. Participants unable to send postcards were telephoned monthly. When a fall or fracture was indicated, a standardized questionnaire recording details was administered by telephone." |
Sato 2005a (Retracted).
| Study characteristics | ||
| Methods | RCT | |
| Participants | Setting: Iizuka, Japan
N = 200
Sample: women recruited from hospital outpatient clinic Age (years): mean 78.1 (SD 5.6) Inclusion criteria: aged > 70; ambulatory; with "probable Alzheimer's Disease" Exclusion criteria: impaired renal, cardiac, or thyroid function; known cause for osteoporosis, e.g. hyperparathyroidism, renal osteodystrophy; history of treatment with corticosteroids, oestrogens, calcitonin, bisphosphonate, calcium or vitamins D or K for ≥ 3 months in past 12 months, at all in 3 months prior to study; history of nonvertebral fracture |
|
| Interventions | Intervention: menatetrenone (vitamin K2) and vitamin D2 and calcium Control: no treatment | |
| Outcomes | 1. Mean number of falls 2. Number sustaining a fracture |
|
| Duration of the study | 2 years | |
| Notes | Published feedback from Alison Avenell notified of the retraction of this study in September 2020. Excerpt from the retraction notice published in 2018: "This article was retracted at the request of the Corresponding Author, Yoshihiro Sato, and the co‐authors have been informed. Dr. Sato wishes to retract this article on the grounds that it contains fabricated clinical trial data, which he was responsible for producing. In addition, Dr. Sato claims he listed all of the named co‐authors without their consent. The co‐authors were therefore unaware of the presence of fabricated data in this publication and their participation in the publication. This retraction was initiated by Dr. Sato, and the Editor‐in‐Chief of Bone was informed by the author directly." | |
| Risk of bias | ||
| Bias | Authors' judgement | Support for judgement |
| Random sequence generation (selection bias) | Low risk | Quote: "Computer assisted random numbering" |
| Allocation concealment (selection bias) | Unclear risk | Insufficient information to permit judgement |
| Blinding of participants and personnel (performance bias) All outcomes | High risk | No placebo control – blinding not mentioned but presumably there was none |
| Blinding of outcome assessment (detection bias) Falls and fallers | Unclear risk | Insufficient information to permit judgement |
| Blinding of outcome assessment (detection bias) Fractures | Unclear risk | Quote: "Follow‐up assessment of patients' condition was performed by physicians who did not participate in the initial randomization." – not clear from this that outcome assessment was blinded, though this is probably what it means. "... all of them were followed up every 4 weeks in the outpatient clinic; and nonvertebral fractures, if any, were recorded. " Not clear whether they were confirmed from medical records or X‐ray. |
| Incomplete outcome data (attrition bias) Falls | Unclear risk | SeeAppendix 3 for method of assessment |
| Risk of bias in recall of falls | Unclear risk | Quote: "The number of falls per a subject was also recorded during the 2‐year follow‐up period". No information on method of recording falls given. Fractures were recorded by follow‐up every 4 weeks in outpatient clinic but it doesn't say falls were recorded in the same way. |
Schrijnemaekers 1995.
| Study characteristics | ||
| Methods | RCT | |
| Participants | Setting: Sittard, The Netherlands N = 222 Sample: people living at home (N = 146) or in residential homes (N = 76) (70% women) Age (years): 70% aged 77 to 84, 30% ≥ 85 Inclusion criteria: aged ≥ 75; living at home or in one of 2 residential homes; having problems with ≥ 1 of the following: IADL, ADL, toileting, mobility or fallen in last 6 months, serious agitation or confusion; informed consent from participant and their GP Exclusion criteria: living in nursing home; received outpatient or inpatient care from geriatric unit in previous 2 years | |
| Interventions | 1. Comprehensive assessment in outpatient geriatric unit (geriatrician, psychologist, social worker); advice to participant and GP about treatment and support 2. Control: usual care | |
| Outcomes | 1. Number of people falling Other outcomes reported but not included in this review | |
| Duration of the study | Follow‐up for 3 years but this paper reports results at 6 months | |
| Notes | Included in this review as the majority of participants were living at home (N = 146) | |
| Risk of bias | ||
| Bias | Authors' judgement | Support for judgement |
| Random sequence generation (selection bias) | Unclear risk | Stratified by living condition (home versus home for the elderly) then "randomly allocated" by researcher in blocks of 10 |
| Allocation concealment (selection bias) | Unclear risk | Insufficient information to permit judgement |
| Blinding of participants and personnel (performance bias) All outcomes | Unclear risk | Participants and personnel implementing the intervention not blind to allocated group, but impact of non‐blinding unclear |
| Blinding of outcome assessment (detection bias) Falls and fallers | Unclear risk | Falls reported by participants who were aware of their group allocation. Unclear whether data collectors were blind to allocation. |
| Incomplete outcome data (attrition bias) Fallers | Low risk | SeeAppendix 3 for method of assessment |
| Risk of bias in recall of falls | High risk | Retrospective recall. Falls ascertained retrospectively at interview. Presume asked about falls in previous 6 months. |
Sherrington 2004.
| Study characteristics | ||
| Methods | RCT | |
| Participants | Setting: Sydney, Australia N = 120 Sample: identified through 6 hospitals in Sydney following hip fracture (79% women) Age (years): mean 79 (SD 9), range 57 to 95 Inclusion criteria: community‐dwelling; recent hip fracture Exclusion criteria: severe cognitive impairment; medical conditions; complications from fracture resulting in delayed healing | |
| Interventions | 1. Weight‐bearing home exercise group 2. Non weight‐bearing home exercise group 3. Control: no intervention | |
| Outcomes | 1. Number of people falling | |
| Duration of the study | 4 months | |
| Notes | Data obtained from authors | |
| Risk of bias | ||
| Bias | Authors' judgement | Support for judgement |
| Random sequence generation (selection bias) | Low risk | Quote: "the randomisation schedule was produced with a random numbers table in blocks of six" |
| Allocation concealment (selection bias) | Low risk | Quote: "Sealed in opaque envelopes" Comment: probably done as research group has described "concealed allocation" in previous study |
| Blinding of participants and personnel (performance bias) All outcomes | Unclear risk | Participants and personnel implementing the intervention not blind to allocated group, but impact of non‐blinding unclear |
| Blinding of outcome assessment (detection bias) Falls and fallers | High risk | Falls reported by participants who were aware of their group allocation. Assessors not blind to group allocation. |
| Incomplete outcome data (attrition bias) Fallers | Low risk | SeeAppendix 3 for method of assessment |
| Risk of bias in recall of falls | High risk | Retrospective recall. Falls data collected at home visits at 1 and 4 months. |
Shigematsu 2008.
| Study characteristics | ||
| Methods | RCT | |
| Participants | Setting: Kawage, Mie, Japan N = 68 Sample: randomly selected people meeting inclusion criteria (63% women) Age (years): mean 69 (SD 3) Inclusion criteria: 65 to 74 years old; community‐dwelling Exclusion criteria: severe neurological or cardiovascular disease; mobility‐limiting orthopaedic conditions | |
| Interventions | 1. Exercise intervention: square‐stepping exercises (forward, backward, lateral and oblique steps on a marked mat 250 cm long); supervised group sessions 70 min (30 warm up and cool down) 2 x per wk for 12 wks. Group "further divided" at end of 12 wks, and half (N = 16) continued with sessions "from December 2004 through February 2005", i.e. a further 12 wks 2. Exercise intervention: outdoor supervised walking session 40 min, 1 x per wk for 12 wks. As above, half (N = 18) continued walking for a further 12 wks | |
| Outcomes | 1. Rate of falls 2. Number of people falling 3. Number of people with adverse effects Other outcomes reported but not included in this review | |
| Duration of the study | 1 year with 8 months follow‐up after the intervention | |
| Notes | ||
| Risk of bias | ||
| Bias | Authors' judgement | Support for judgement |
| Random sequence generation (selection bias) | Low risk | Quote: "Randomly allocated.. by a public health nurse who used a computerized random number generation program in which the numbers 0 and 1 corresponded to the two groups, respectively". |
| Allocation concealment (selection bias) | Unclear risk | Insufficient information to permit judgement |
| Blinding of participants and personnel (performance bias) All outcomes | Low risk | Study described as "single‐blind", presumably meaning that participants were blind to whether they were in the intervention or control groups as both groups received an exercise intervention. Treatment personnel presumably unblinded but judge that lack of blinding unlikely to introduce bias. |
| Blinding of outcome assessment (detection bias) Falls and fallers | High risk | Study described as "single‐blind" because both groups received an exercise intervention. Assessors presumably unblinded. |
| Incomplete outcome data (attrition bias) Falls | Low risk | SeeAppendix 3 for method of assessment |
| Incomplete outcome data (attrition bias) Fallers | Low risk | SeeAppendix 3 for method of assessment |
| Risk of bias in recall of falls | Low risk | Quote: "All the persons received a pre‐paid postcard at the beginning of each month, which they returned at the beginning of the next month". Instructed to record falls on a daily basis. Phoned or face‐to‐face interview if falls reported. |
Shumway‐Cook 2007.
| Study characteristics | ||
| Methods | RCT | |
| Participants | Setting: USA N = 453 Sample: volunteers recruited by advertising etc (77% women) Age (years): mean 75.6 (SD 6.3), range 65 to 96 Inclusion criteria: aged ≥ 65, community‐dwelling, able to speak English, have a primary care physician they had seen in last 3 years, able to ambulate independently (with or without cane or walker), willing to attend exercise classes for at least 6 months, have access to transportation. Exclusion criteria: more than minimal hearing or visual problems, regular exercise in previous 3 months, unable to complete 10 ft 'Timed up and Go' test in < 30 seconds, 5 or more errors on Pfeiffer Short Portable Mental Status Questionnaire | |
| Interventions | Both groups completed health history questionnaire at randomisation 1. Intervention: group exercise class (1 hour, 3 x per wk for up to 52 wks), 6 hours of fall prevention classes, fall assessment summary (based on initial questionnaire) sent to participants' primary care physician plus copy of fall prevention guideline (AGS/BGS 2001) 2. Control: usual care plus 2 fall prevention brochures | |
| Outcomes | 1. Rate of falls 2. Number of people falling Other outcomes reported but not included in this review | |
| Duration of the study | 1 year | |
| Notes | ||
| Risk of bias | ||
| Bias | Authors' judgement | Support for judgement |
| Random sequence generation (selection bias) | Low risk | Computer random number generator used to generate sequence |
| Allocation concealment (selection bias) | Low risk | Randomised using centralised randomisation scheme, accessed by telephone |
| Blinding of participants and personnel (performance bias) All outcomes | Unclear risk | Participants and personnel implementing the intervention not blind to allocated group, but impact of non‐blinding unclear |
| Blinding of outcome assessment (detection bias) Falls and fallers | Unclear risk | Falls reported by participants who were aware of their group allocation. Unclear whether staff who confirmed falls by telephone were blinded. |
| Incomplete outcome data (attrition bias) Falls | Low risk | SeeAppendix 3 for method of assessment |
| Incomplete outcome data (attrition bias) Fallers | Low risk | SeeAppendix 3 for method of assessment |
| Risk of bias in recall of falls | Low risk | Prospective. Falling ascertained by 12‐monthly calendars with telephone follow‐up. |
Shyu 2010.
| Study characteristics | ||
| Methods | RCT | |
| Participants | Setting: medical centre, northern Taiwan N = 162 Sample: admitted to hospital for an accidental single side hip fracture (69% women) Age (years): mean 78.2 (SD 7.8) Inclusion criteria: aged ≥ 60; received hip arthroplasty or internal fixation; able to perform full range of motion; prefracture Chinese Barthel Index > 70 Exclusion criteria: severely cognitively impaired; terminally ill | |
| Interventions | 1. Multidisciplinary programme (geriatric consultation services, a continuous rehabilitation programme, discharge planning services) 2. Control: usual care | |
| Outcomes | 1. Number of fallers | |
| Duration of the study | 2 years | |
| Notes | ||
| Risk of bias | ||
| Bias | Authors' judgement | Support for judgement |
| Random sequence generation (selection bias) | Low risk | Quote: "The randomization was conducted using flip of coin by a neutral third party who was not involved in delivering the intervention or assessing outcomes". |
| Allocation concealment (selection bias) | Unclear risk | Insufficient detail to allow a definite judgement. Quote: "Those persons who agreed to participate were randomly assigned to an experimental or control group at the time of admission. The randomization was conducted using flip of coin by a neutral third party who was not involved in delivering the intervention or assessing outcomes". |
| Blinding of participants and personnel (performance bias) All outcomes | Unclear risk | Insufficient information to permit judgement |
| Blinding of outcome assessment (detection bias) Falls and fallers | High risk | Ascertained by self report from the participant to an unblinded evaluator |
| Incomplete outcome data (attrition bias) Fallers | Unclear risk | SeeAppendix 3 for method of assessment. Insufficient information to permit judgement. |
| Risk of bias in recall of falls | High risk | Quote: "Occurrence of falls and mortality were assessed by self report of patients and family caregivers." "All subjects were assessed at 1, 3, 6, 12, 18, and 24 months after discharge". No mention of concurrent collection of data and recall appears to be over periods longer than 1 month. |
Skelton 2005.
| Study characteristics | ||
| Methods | RCT | |
| Participants | Setting: United Kingdom N = 100 Sample: women recruited using posters, newspapers and radio stations Age (years): mean 72.8 (SD 5.9) Inclusion criteria: aged ≥ 65; living independently in own home; ≥ 3 falls in previous year Exclusion criteria: acute rheumatoid arthritis; uncontrolled heart failure or hypertension; significant cognitive impairment; significant neurological disease or impairment; previously diagnosed osteoporosis | |
| Interventions | 1. FAME exercise class 1 hour, 1 x per wk for 36 wks plus home exercises 30 min 2 x per wk 2. Control: no exercise class. Home‐based seated exercises 2 x per wk | |
| Outcomes | 1. Rate of falls 2. Number of people falling |
|
| Duration of the study | 36 wks | |
| Notes | ||
| Risk of bias | ||
| Bias | Authors' judgement | Support for judgement |
| Random sequence generation (selection bias) | Unclear risk | Quote: "randomly allocated (blind)" |
| Allocation concealment (selection bias) | Unclear risk | Insufficient information to permit judgement |
| Blinding of participants and personnel (performance bias) All outcomes | Unclear risk | Participants and personnel implementing the intervention not blind to allocated group, but impact of non‐blinding unclear |
| Blinding of outcome assessment (detection bias) Falls and fallers | Low risk | Falls reported by participants who were aware of their group allocation. Quote: "The information from the diaries was recorded by an observer blinded to the subject’s group who also contacted subjects if diaries had not been returned for two weeks or more." |
| Incomplete outcome data (attrition bias) Falls | Unclear risk | SeeAppendix 3 for method of assessment. Insufficient information to permit judgement. |
| Incomplete outcome data (attrition bias) Fallers | Low risk | SeeAppendix 3 for method of assessment |
| Risk of bias in recall of falls | Low risk | Quote: "Both groups completed daily falls diaries... Diaries were returned every 2 weeks by post to the investigator..." Telephone contact if dairies not returned for 2 weeks or more. |
Smith 2007.
| Study characteristics | ||
| Methods | RCT | |
| Participants | Setting: Wessex, United Kingdom N = 9440 Sample: recruited from 111 general practice registers (54% women). Mainly community‐dwelling (98%) Age (years): mean (IQR) 79.1 (76.9 to 82.6) Inclusion criteria: aged ≥ 75 Exclusion criteria: current cancer; history of treated osteoporosis; bilateral total hip replacement; renal failure; renal stones; hypercalcaemia; sarcoidosis; taking at least 400 IU of vitamin D supplements already | |
| Interventions | 1. 300,000 IU ergocalciferol (vitamin D2) by intramuscular injection every autumn for 3 years 2. Placebo | |
| Outcomes | 1. Number of people falling 2. Number sustaining a fracture Falls a secondary outcome of the study. Other outcomes reported but not included in this review | |
| Duration of the study | 3 years | |
| Notes | ||
| Risk of bias | ||
| Bias | Authors' judgement | Support for judgement |
| Random sequence generation (selection bias) | Low risk | Individual randomisation within blocks at each practice by allocation of consecutively numbered ampoules |
| Allocation concealment (selection bias) | Low risk | Individual randomisation within blocks at each practice by allocation of consecutively numbered ampoules |
| Blinding of participants and personnel (performance bias) All outcomes | Low risk | Placebo‐controlled randomised trial |
| Blinding of outcome assessment (detection bias) Falls and fallers | Low risk | Falls reported by participants who were blind to their group allocation (placebo‐controlled trial) |
| Blinding of outcome assessment (detection bias) Fractures | Low risk | Fractures reported by participants who were blind to their group allocation (placebo‐controlled trial). Quote: "A fracture was treated as confirmed if it met two of the three criteria: report by study subject; report by practice; and confirmation from hospital records." |
| Incomplete outcome data (attrition bias) Fallers | Low risk | SeeAppendix 3 for method of assessment |
| Risk of bias in recall of falls | High risk | Retrospective. Quote: "Information on falls ... was obtained at annual review (12, 24 and 36 months) by the practice nurse and on incident fractures by postal questionnaire at 6, 12, 18, 24, 30 and 36 months." |
Smulders 2010.
| Study characteristics | ||
| Methods | RCT | |
| Participants | Setting: Nijmegan, Netherlands N = 96 Sample: identified from databases of DXA scans, mail out to members of Dutch Osteoporosis Patient Council; advertising (94% women) Age (years): mean 71.0 (SD 4.7) Inclusion criteria: community‐dwelling; aged > 65; osteoporosis (DXA; femoral neck or lower back T score ≤ ‐2.5); ≥ 1 falls in previous year; able to walk 15 min without walking device Exclusion criteria: severe cardiac, pulmonary, or musculoskeletal disorders or disorders associated with higher fall risk (e.g. neurologic disorders) | |
| Interventions | 1. Nijmegen Falls Prevention Program (NFPP): 1 education session then 10 exercise sessions during 5.5 wks (obstacle course, walking exercises, weight‐bearing exercises, correction of gait abnormalities, and training in fall techniques). Delivered by PTs and OTs 2. Control: usual care | |
| Outcomes | 1. Rate of falls 2. Number of people falling 3. Number sustaining a fracture Other outcomes not included in this review |
|
| Duration of the study | 1 year | |
| Notes | ||
| Risk of bias | ||
| Bias | Authors' judgement | Support for judgement |
| Random sequence generation (selection bias) | Unclear risk | Quote: "After a baseline assessment M1, the researcher performed block randomization using non–see‐through envelopes. The probability of allocation to the exercise group was independent of recruitment method." |
| Allocation concealment (selection bias) | Unclear risk | Non‐see‐through envelopes but not sequentially numbered |
| Blinding of participants and personnel (performance bias) All outcomes | High risk | Participants and personnel aware of allocated groups |
| Blinding of outcome assessment (detection bias) Falls and fallers | Low risk | Quote: "Fall calendars were scored by an independent researcher who was blinded to group allocation." |
| Blinding of outcome assessment (detection bias) Fractures | High risk | Fractures self reported and no mention of confirmation by radiological examination or from primary care case records |
| Incomplete outcome data (attrition bias) Falls | Low risk | SeeAppendix 3 for method of assessment |
| Incomplete outcome data (attrition bias) Fallers | Low risk | SeeAppendix 3 for method of assessment |
| Risk of bias in recall of falls | Low risk | Quote: "After the intervention had ended, participants registered their falls for 1 year on fall calendars that had to be returned every month… When no fall calendar was received within 2 weeks after the start of the month, the participant was reminded by telephone." |
Spice 2009.
| Study characteristics | ||
| Methods | RCT (cluster‐randomised, 18 general practices) | |
| Participants | Setting: Winchester, United Kingdom N = 516 Sample: patients in 18 general practices (proportion of women not stated) Age (years): mean 82 Inclusion criteria: aged ≥ 65; community‐dwelling; history of at least 2 falls in previous year; not presenting to A&E with index fall Exclusion criteria: none described | |
| Interventions | 1. Secondary care intervention: multidisciplinary day hospital assessment by physician, OT, and physiotherapist 2. Primary care intervention: health visitor/practice nurse falls risk assessment/referral 3. Control: usual care | |
| Outcomes | 1. Number of fallers | |
| Duration of the study | 1 year | |
| Notes | ||
| Risk of bias | ||
| Bias | Authors' judgement | Support for judgement |
| Random sequence generation (selection bias) | Low risk | Cluster‐randomised. Quote: "Practices were stratified into urban (three) and rural (fifteen) and randomly allocated to the three arms, in blocks of three, using a random number generator on a Hewlett Packard 21S pocket calculator". |
| Allocation concealment (selection bias) | Unclear risk | Insufficient information to permit judgement |
| Blinding of participants and personnel (performance bias) All outcomes | Unclear risk | Participants and personnel not blind to allocated group but impact of non‐blinding unclear |
| Blinding of outcome assessment (detection bias) Falls and fallers | High risk | Participants and personnel not blind to group allocation. Quote: "Blinding to the intervention group of those collecting and analysing data was impractical." |
| Incomplete outcome data (attrition bias) Fallers | Low risk | SeeAppendix 3 for method of assessment |
| Risk of bias in recall of falls | Low risk | Follow‐up monthly using postcards, with a phone call if a card not returned |
Spink 2011.
| Study characteristics | ||
| Methods | RCT | |
| Participants | Setting: La Trobe University Health Sciences Clinic, Bundoora, Victoria, Australia N = 305 Sample: podiatry services patient database, and advertising (69% women) Age (years): mean 73.9 (SD 5.9) Inclusion criteria: aged ≥ 65; community‐dwelling; ≥ 1 falls in past year or score > 1 on physiological profile assessment tool; disabling foot pain Exclusion criteria: lower limb amputation; Parkinson's disease; active plantar ulceration; cognitive impairment; unable to walk 10 m without a walking aid; limited English language skills; leg surgery or planned leg surgery within 3 months of initial assessment |
|
| Interventions | 1. Intervention: "multifaceted podiatry": outdoor footwear assessment and advice (AUD 100 voucher towards purchasing more appropriate footwear); orthoses (customised insoles to accommodate plantar lesions) if not already wearing customised orthoses; home‐based foot and ankle exercises (30 min 3 x per wk for 6 months); a falls prevention education booklet; plus "routine podiatry care" (see below)
2. Control: "routine podiatry care" (see below) Both groups continued with any podiatry treatment they were already receiving, and were offered free routine podiatry care, i.e. nail trimming, callus, and corn reduction for 1 year |
|
| Outcomes | 1. Rate of falls 2. Number of people falling 3. Number sustaining a fracture Other outcomes not reported in this review |
|
| Duration of the study | 1 year | |
| Notes | ||
| Risk of bias | ||
| Bias | Authors' judgement | Support for judgement |
| Random sequence generation (selection bias) | Low risk | Quote: "Permuted block randomisation will be undertaken" using an interactive voice response telephone service provided by the National Health and Medical Research Council Clinical Trials Centre at the University of Sydney |
| Allocation concealment (selection bias) | Unclear risk | Quote: "One investigator (MJS, who administered the intervention) used an interactive voice response telephone service provided by the National Health and Medical Research Council Clinical Trials Centre at the University of Sydney to carry out permuted block randomisation with mixed block lengths of four and six participants." |
| Blinding of participants and personnel (performance bias) All outcomes | Unclear risk | Neither participants nor personnel were blind to intervention group. Unclear whether this would have introduced bias. |
| Blinding of outcome assessment (detection bias) Falls and fallers | Low risk | Quote: "When a fall occurs, specific details about fall injuries will be obtained through structured telephone interviews. If falls calendars are not returned at the end of each month, research staff will contact the participants by telephone to obtain the missing data." For secondary outcomes "All participants will be assessed at baseline and at six months by an assessor blinded to group allocation." So presume also true for falls (primary outcome). |
| Blinding of outcome assessment (detection bias) Fractures | Unclear risk | Quote: "When a fall occurs, specific details about fall injuries will be obtained through structured telephone interviews." Assessors might have been blinded to group allocation (see above) but no mention of confirmation of fractures. |
| Incomplete outcome data (attrition bias) Falls | Low risk | |
| Incomplete outcome data (attrition bias) Fallers | Low risk | SeeAppendix 3 for method of assessment |
| Risk of bias in recall of falls | Low risk | Quote: "Falls … will be monitored using monthly mail‐out calendars. When a fall occurs, specific details about fall injuries will be obtained through structured telephone interviews. If falls calendars are not returned at the end of each month, research staff will contact the participants by telephone to obtain the missing data." |
Steadman 2003.
| Study characteristics | ||
| Methods | RCT. | |
| Participants | Setting: London, United Kingdom
N = 198 Sample: attendees at a hospital multidisciplinary falls clinic (80% women) Age (years): mean 82.7 (SD 5.6) Inclusion criteria: ≥ 60 years; Berg Balance Scale < 45 after "adequate management of potential risk factors" Exclusion criteria: amputation; unable to walk 10 metres; recent stroke; progressive neurological disorder; unstable medical condition; severe cognitive impairment |
|
| Interventions | 1. Enhanced balance training. Conventional physiotherapy plus balance training 45 min, 2 x per wk for 6 wks 1. Control: conventional physiotherapy alone | |
| Outcomes | 1. Rate of falls Other outcomes reported but not included in this review | |
| Duration of the study | 24 wks, but falls data collected for previous month at 6, 12 and 24 wks after randomisation. Data from 24 wks used in analysis in the review. | |
| Notes | ||
| Risk of bias | ||
| Bias | Authors' judgement | Support for judgement |
| Random sequence generation (selection bias) | Low risk | Quote: "computer generated random numbers" |
| Allocation concealment (selection bias) | Unclear risk | Insufficient information to permit judgement |
| Blinding of participants and personnel (performance bias) All outcomes | Unclear risk | Participants and personnel not blind to allocated group but impact of non‐blinding unclear |
| Blinding of outcome assessment (detection bias) Falls and fallers | Low risk | Study described as "single‐blind" ‐ both groups received an intervention. Quote: "A therapist who was not involved with randomization or delivering the interventions completed baseline and outcome assessments" |
| Incomplete outcome data (attrition bias) Falls | Low risk | SeeAppendix 3 for method of assessment |
| Risk of bias in recall of falls | High risk | Interval recall. Falls data collected for previous month at 6 weeks, 12 weeks and 24 weeks. |
Steinberg 2000.
| Study characteristics | ||
| Methods | RCT (cluster‐randomised). 4 groups with approximately equal numbers formed from 2 or 3 National Seniors Branches. Groups randomly allocated to 1 of 4 interventions | |
| Participants | Setting: Brisbane, Queensland, Australia N = 252 Sample: volunteers from branches of National Seniors Association clubs (79% women) Age (years): mean 69; range 51 to 87 Inclusion criteria: aged ≥ 50; National Seniors Club member; with capacity to understand and comply with the project Exclusion criteria: none stated | |
| Interventions | Cumulative intervention 1. Control: oral presentation; video on home safety; pamphlet on fall risk factors and prevention 2. Intervention 1. plus exercise classes designed to improve strength and balance, 1 hour per month, for 17 months; exercise handouts; gentle exercise video to encourage exercise between classes 3. Intervention 2. plus home safety assessment and financial and practical assistance to make modifications 4. Intervention 3. plus clinical assessment and advice on medical risk factors for falls | |
| Outcomes | 1. Rate of falls 2. Number of people falling | |
| Duration of the study | Follow‐up commenced after start of all components for each intervention. 17 months but varied between groups | |
| Notes | Younger, healthier and more active sample than elderly population as a whole | |
| Risk of bias | ||
| Bias | Authors' judgement | Support for judgement |
| Random sequence generation (selection bias) | Unclear risk | Quote: "Groups were randomly allocated to receive the four interventions" |
| Allocation concealment (selection bias) | High risk | Cluster‐randomised. Possibility of participants joining group after randomisation. |
| Blinding of participants and personnel (performance bias) All outcomes | Unclear risk | 4 intervention groups. Blinding of participants and treatment personnel not mentioned in report, but unlikely. Insufficient evidence to make judgement on impact of lack of blinding. |
| Blinding of outcome assessment (detection bias) Falls and fallers | Unclear risk | Falls reported by participants who were aware of their group allocation. Blinding of assessors analysing data and making telephone contact not described. |
| Incomplete outcome data (attrition bias) Falls | Low risk | SeeAppendix 3 for method of assessment |
| Incomplete outcome data (attrition bias) Fallers | Low risk | SeeAppendix 3 for method of assessment |
| Risk of bias in recall of falls | Low risk | Quote: "Falls were monitored prospectively using a daily calendar diary to minimise bias." Diary returned monthly. Telephone follow‐up of reported falls and no monthly returns. |
Stevens 2001.
| Study characteristics | ||
| Methods | RCT. Some clusters. Study population stratified by age (< 80 years and > 80 years) and sex. Within strata index recruits allocated in 2:1 ratio to control or intervention. Coinhabitants assigned to same group as index recruit. | |
| Participants | Setting: Perth, Australia N = 1737 Sample: randomly selected from State Electoral Roll and telephone directory (52% women) Age (years): mean 76 Inclusion criteria: aged ≥ 70; living independently; cognitively intact and able to speak and write in English; anticipated living at home for 10/12 coming months; could make environmental changes inside the home; had not fitting of ramps and grab rails etc Exclusion criteria: if living with more than 2 other older people | |
| Interventions | 1. Intervention: 1 home visit by nurse to confirm consent, educate about how to recognise a fall, and complete the daily calendar. Sent information on the intervention and fall reduction strategies to be offered. Intervention: home hazard assessment, installation of free safety devices, and an educational strategy to empower seniors to remove and modify home hazards (see 'Notes'). 2. Control: 1 home visit by nurse to confirm consent, educate about how to recognise a fall, and complete the daily calendar | |
| Outcomes | 1. Rate of falls 2. Number of people falling | |
| Duration of the study | 1 year | |
| Notes | Hazard list designed with OT input to include factors identified from literature and existing check lists. 11 hazards included. All identified hazards discussed with subjects but only the 3 most conspicuous or remediable selected to give specific advice on their removal or modification. Safety devices offered at no cost and installed by tradesman within 2 wks of visit. | |
| Risk of bias | ||
| Bias | Authors' judgement | Support for judgement |
| Random sequence generation (selection bias) | Unclear risk | Study population divided into 4 strata defined by age (< 80 years and > 80 years) and sex. Within these strata index recruits allocated in 2:1 ratio to control or intervention. Coinhabitants assigned to same group as index recruit. |
| Allocation concealment (selection bias) | Unclear risk | Insufficient information to permit judgement |
| Blinding of participants and personnel (performance bias) All outcomes | Unclear risk | Participants and personnel not blind to allocated group but impact of non‐blinding unclear |
| Blinding of outcome assessment (detection bias) Falls and fallers | Unclear risk | Falls reported by participants who were aware of their group allocation. Blinding of assessors analysing data and making telephone contact not described. |
| Incomplete outcome data (attrition bias) Falls | Low risk | SeeAppendix 3 for method of assessment |
| Incomplete outcome data (attrition bias) Fallers | Unclear risk | SeeAppendix 3 for method of assessment. Insufficient information to permit judgement. |
| Risk of bias in recall of falls | Low risk | Falls recorded on daily calendar |
Suman 2011.
| Study characteristics | ||
| Methods | RCT | |
| Participants | Setting: rural Suffolk, United Kingdom N = 369 Sample: recruited by post using GP's age and sex register (62% women) Age (years): mean 75.8 Inclusion criteria: community‐dwelling; aged ≥ 65 years; high risk of falling (based on 5‐item screening tool) Exclusion criteria: none described | |
| Interventions | 1. Intervention: community‐based assessment (20 to 25 min) at GP surgery using tool developed for study plus referral to community PT or OT, own GP, or hospital‐based specialist fall service as appropriate 2. Control: comprehensive hospital‐based assessment (30 to 45 min) at "falls clinic" by consultant geriatrician with special interest in falls. Some advice plus referred to PT or OT and seen that day |
|
| Outcomes | 1. Rate of falls 2. Number of people falling 3. Number sustaining a fracture |
|
| Duration of the study | 1 year | |
| Notes | ||
| Risk of bias | ||
| Bias | Authors' judgement | Support for judgement |
| Random sequence generation (selection bias) | Unclear risk | Insufficient information to allow judgement. Quote: "randomly allocated" |
| Allocation concealment (selection bias) | Unclear risk | Insufficient information to allow judgement. Quote: "The randomisation process was carried out by asking an independent third party to open the returned sealed envelopes in a numbered sequence" |
| Blinding of participants and personnel (performance bias) All outcomes | High risk | Participants and personnel aware of the intervention and that it was a fall prevention intervention |
| Blinding of outcome assessment (detection bias) Falls and fallers | Unclear risk | Falls diaries and telephone follow‐up but unclear who made the phone calls and whether they were blind to allocated groups |
| Blinding of outcome assessment (detection bias) Fractures | High risk | Self reported via telephone to personnel who may or may not have been blinded, and no mention of confirmation from X‐ray or medical notes |
| Incomplete outcome data (attrition bias) Falls | Unclear risk | SeeAppendix 3 for method of assessment |
| Incomplete outcome data (attrition bias) Fallers | Low risk | SeeAppendix 3 for method of assessment |
| Risk of bias in recall of falls | Unclear risk | Quote: "… both arms … were provided with a "falls diary" and asked to record any falls, injury related to a fall.." Only 3‐monthly telephone follow‐up and does not state how often diaries were returned to researchers. |
Suzuki 2004.
| Study characteristics | ||
| Methods | RCT | |
| Participants | Setting: Tokyo, Japan
N = 52
Age (years): mean 78 (SD 3.9), range 73 to 90 Sample and inclusion criteria: women in the Tokyo Metropolitan Institute of Gerontology Longitudinal Interdisciplinary Study on Aging attending a comprehensive geriatric health examination; living at home Exclusion criteria: unable to measure muscle strength, poor mobility due to hemiplegia, poorly controlled blood pressure, communication difficulties due to impaired hearing |
|
| Interventions | 1. Intervention: exercise‐centred fall prevention programme + home‐based exercise programme aimed at enhancing muscle strength, balance, and walking ability. 10 1‐hour classes (every 2 wks for 6 months) plus individual home‐based exercises for 30 min 3 x per wk 2. Control: pamphlet and advice on prevention of falls | |
| Outcomes | 1. Rate of falls 2. Number of people falling Other outcomes reported but not included in this review | |
| Duration of the study | 20 months | |
| Notes | ||
| Risk of bias | ||
| Bias | Authors' judgement | Support for judgement |
| Random sequence generation (selection bias) | Unclear risk | States "randomized" but method of randomisation not described |
| Allocation concealment (selection bias) | Unclear risk | Insufficient information to permit judgement |
| Blinding of participants and personnel (performance bias) All outcomes | Unclear risk | Participants and personnel not blind to allocated group but impact of non‐blinding unclear |
| Blinding of outcome assessment (detection bias) Falls and fallers | Unclear risk | Falls reported by participants who were aware of their group allocation. Does not state whether outcome assessors were blind to allocation. |
| Incomplete outcome data (attrition bias) Falls | High risk | SeeAppendix 3 for method of assessment |
| Incomplete outcome data (attrition bias) Fallers | High risk | SeeAppendix 3 for method of assessment |
| Risk of bias in recall of falls | High risk | Retrospective recall. Falls and fractures recorded retrospectively at interview at 8 months and 20 months after intervention. |
Swanenburg 2007.
| Study characteristics | ||
| Methods | RCT | |
| Participants | Setting: Zurich, Switzerland N = 24 Sample: probably female patients in Center for Osteoporosis of the Department of Rheumatology Age (years): mean 71.2 (SD 6.8) Inclusion criteria: aged ≥ 65; living independently; with osteoporosis or osteopenia Exclusion criteria: severe peripheral or central neurological disease known to influence gait, balance or muscle strength; medical contraindications for exercise | |
| Interventions | 1. Intervention: vitamin 400 to 800 IU cholecalciferol and calcium 500 to 1000 mg/day according to physician assessment at baseline plus 12 wk training programme to improve balance, and a daily nutritional supplement enriched with proteins for 3 months 2. Control: vitamin 400 to 800 IU cholecalciferol and calcium 500 to 1000 mg/day according to physician assessment at baseline plus leaflet on home exercises | |
| Outcomes | 1. Rate of falls Other outcomes reported but not included in this review | |
| Duration of the study | 1 year | |
| Notes | Pilot study | |
| Risk of bias | ||
| Bias | Authors' judgement | Support for judgement |
| Random sequence generation (selection bias) | Unclear risk | Quote: "Random assignment ... with a stratified randomisation procedure." |
| Allocation concealment (selection bias) | Unclear risk | Insufficient information to permit judgement |
| Blinding of participants and personnel (performance bias) All outcomes | Unclear risk | Blinding of participants and treatment personnel not mentioned in report, but unlikely. Insufficient evidence to make judgement on impact of lack of blinding. |
| Blinding of outcome assessment (detection bias) Falls and fallers | Low risk | Falls reported by participants who were aware of their group allocation. Outcome assessors were blind to allocation. |
| Incomplete outcome data (attrition bias) Falls | Unclear risk | SeeAppendix 3 for method of assessment |
| Risk of bias in recall of falls | High risk | Quote: "Falls were assessed by interview at each assessment" post intervention, 6, 9, and 12 months. Interval recall of 3‐month period. |
Tinetti 1994.
| Study characteristics | ||
| Methods | RCT (cluster‐randomised). 16 treating physicians, matched in 4 groups of 4, into 2 control and 2 intervention in each group; enrolled subjects assigned to same group as their physician | |
| Participants | Setting: Southern Connecticut, USA N = 301 Sample: people enrolled with participating physicians (69% women) Age (years): mean 77.9 (SD 5.3) Inclusion criteria: aged > 70; community‐dwelling; independently ambulant; at least 1 targeted risk factor for falling (postural hypotension, sedative/hypnotic use, use of > 4 medications, inability to transfer, gait impairment, strength or range of motion loss, domestic environmental hazards) Exclusion criteria: enrolment in another study; MMSE < 20; current (within last month) participation in vigorous activity | |
| Interventions | 1. Interventions targeted to individual risk factors, according to decision rules and priority lists. 3‐month programme duration 2. Control: visits by social work students over same period | |
| Outcomes | 1. Rate of falls 2. Number of people falling 3. Number sustaining a fracture | |
| Duration of the study | 1 year | |
| Notes | Yale (New Haven) FICSIT trial. Cost‐effectiveness analysis reported in Rizzo 1996. | |
| Risk of bias | ||
| Bias | Authors' judgement | Support for judgement |
| Random sequence generation (selection bias) | Low risk | Quote: "Computerised randomization program" |
| Allocation concealment (selection bias) | Unclear risk | Insufficient information to permit judgement |
| Blinding of participants and personnel (performance bias) All outcomes | Unclear risk | Blinding of participants and treatment personnel not mentioned in report, but unlikely. Insufficient evidence to make judgement on impact of lack of blinding. |
| Blinding of outcome assessment (detection bias) Falls and fallers | Low risk | Falls reported by participants who were aware of their group allocation. Outcome assessors blinded to assignment. |
| Blinding of outcome assessment (detection bias) Fractures | Unclear risk | Fractures reported by participants who were aware of their group allocation. Outcome assessors blinded to assignment. Unclear whether medical records or radiology reports were used to confirm fractures. |
| Incomplete outcome data (attrition bias) Falls | Low risk | SeeAppendix 3 for method of assessment |
| Incomplete outcome data (attrition bias) Fallers | Low risk | SeeAppendix 3 for method of assessment |
| Risk of bias in recall of falls | Low risk | Prospective. Falls "recorded on a calendar that subjects mailed to the research staff monthly." Followed by personal or telephone contact if no calendar returned or a fall reported. |
Trivedi 2003.
| Study characteristics | ||
| Methods | RCT. Stratified by age and sex | |
| Participants | Setting: Suffolk, United Kingdom N = 2686 Sample: recruited from British doctors study register and 1 GP patient register (24% women) Age (years): mean 75 (SD 5), range 65 to 85 Inclusion criteria: aged 65 to 85 years Exclusion criteria: already taking vitamin D supplements; conditions with contraindications for vitamin D supplementation, e.g. renal stones, sarcoidosis, or malignancy | |
| Interventions | 1. Oral vitamin D3 supplementation (100,000 IU cholecalciferol) 1 capsule every 4 months for 5 years 2. Control: matching placebo 1 capsule every 4 months for 5 years | |
| Outcomes | 1. Number of people falling
2. Number sustaining a fracture 3. Adverse events Other outcomes reported but not included in this review |
|
| Duration of the study | 5 years | |
| Notes | Although fracture and major illness data collected every 4 months after capsules sent out, falls data not collected until end of study. Falls not mentioned in statistical analysis section of methods. | |
| Risk of bias | ||
| Bias | Authors' judgement | Support for judgement |
| Random sequence generation (selection bias) | Low risk | Quote: "randomised after stratification by age and sex" Comment: probably done since earlier reports from the same investigators clearly describe use of random sequences. |
| Allocation concealment (selection bias) | Low risk | Quote: "Ipswich pharmacy revealed the coding" at the end of the study. So assume randomised centrally. |
| Blinding of participants and personnel (performance bias) All outcomes | Low risk | Placebo‐controlled randomised trial |
| Blinding of outcome assessment (detection bias) Falls and fallers | Low risk | Falls reported by participants who were blind to their group allocation (placebo‐controlled trial) |
| Blinding of outcome assessment (detection bias) Fractures | Unclear risk | Fractures reported by participants who were blind to their group allocation (placebo‐controlled trial). Confirmation of fracture outcomes appears to have occurred only in participants who died, and the fracture was recorded on the death certificate. |
| Incomplete outcome data (attrition bias) Fallers | Low risk | SeeAppendix 3 for method of assessment |
| Risk of bias in recall of falls | High risk | Retrospecive recall over 12‐month period at the end of 5 years |
Trombetti 2011.
| Study characteristics | ||
| Methods | RCT (cross‐over at 6 months) | |
| Participants | Setting: Geneva, Switzerland N = 134 Sample: volunteers recruited by advertising etc (96% women) Age (years): 75.5 (SD 6.9) Inclusion criteria: aged ≥ 65; community‐dwelling; no previous experience of Jaques‐Dalcroze eurhythmics (except during childhood); high risk of falling (≥ 1 falls after the age of 65, impaired balance, or physically frail) Exclusion criteria: neurological or orthopaedic disease seriously affecting gait and balance; progressive or unstable medical conditions limiting participation; dependent on walking aids, e.g. canes and walkers | |
| Interventions | 1. Intervention: music‐based multitask exercise programme (Jaques‐Dalcroze eurhythmics) 1 h per wk for 6 months. Group exercises performed to improvised piano music (walking to music, responding to changes in rhythmic patterns etc), sometimes with manipulation of objects (e.g. percussion instruments, balls), gradually increasing in difficulty to challenge balance control 2. Control: received intervention after 6 months |
|
| Outcomes | 1. Rate of falls 2. Number of people falling Falls a secondary outcome. Other outcomes not included in this review |
|
| Duration of the study | 1 year | |
| Notes | Falls data from 6 months (before cross‐over) used for analysis in the review | |
| Risk of bias | ||
| Bias | Authors' judgement | Support for judgement |
| Random sequence generation (selection bias) | Low risk | Quote: "subjects were randomized … according to a computer‐generated list … using a permuted block randomization design" |
| Allocation concealment (selection bias) | Low risk | Quote: "subjects were randomized … according to a computer‐generated list prepared by an independent statistician" |
| Blinding of participants and personnel (performance bias) All outcomes | High risk | Participants and personnel carrying out the intervention were aware of group allocation |
| Blinding of outcome assessment (detection bias) Falls and fallers | Unclear risk | Participants self reported falls. Quote: "Participants who failed to return the diary or provided incomplete data were contacted by telephone." Not clear whether this assessor was blind to group allocation. |
| Incomplete outcome data (attrition bias) Falls | High risk | SeeAppendix 3 for method of assessment |
| Incomplete outcome data (attrition bias) Fallers | High risk | SeeAppendix 3 for method of assessment |
| Risk of bias in recall of falls | Low risk | Quote: "Falls were prospectively monitored for 12 months and recorded daily using a diary mailed monthly to the study coordinator. Participants who failed to return the diary or provided incomplete data were contacted by telephone." |
Van Haastregt 2000.
| Study characteristics | ||
| Methods | RCT | |
| Participants | Setting: Hoensbroek, The Netherlands N = 316 Sample: people registered with 6 general medical practices (66% women) Age (years): mean 77.2 (SD 5.1) Inclusion criteria: aged ≥ 70; community‐dwelling; 2 or more falls in previous 6 months or score 3 or more on mobility scale of Sickness Impact Profile Exclusion criteria: bed ridden; fully wheelchair dependent; terminally ill; awaiting nursing home placement; receiving regular care from community nurse | |
| Interventions | 1. 5 home visits from community nurse over 1 year. Screened for medical, environmental, and behavioural risk factors for falls and mobility impairment; advice, referrals, and "other actions" 2. Control: usual care | |
| Outcomes | 1. Number of people falling | |
| Duration of the study | 18 months (12‐month data used in analyses in the review) | |
| Notes | ||
| Risk of bias | ||
| Bias | Authors' judgement | Support for judgement |
| Random sequence generation (selection bias) | Low risk | Randomisation by computer‐generated random numbers |
| Allocation concealment (selection bias) | Unclear risk | Insufficient information to permit judgement |
| Blinding of participants and personnel (performance bias) All outcomes | Unclear risk | Participants and nurses conducting home visits in intervention group were not blinded. Partial blinding of other health professionals. Quote: "The doctors and healthcare staff dealing with the participants were not told which patients were allocated to the usual care group". Insufficient evidence to make judgement on impact of lack of blinding. |
| Blinding of outcome assessment (detection bias) Falls and fallers | Unclear risk | Falls reported by participants who were aware of their group allocation. Quote: "During follow up participants recorded falls in a weekly diary." No mention of blinding of study personnel collecting data. |
| Incomplete outcome data (attrition bias) Fallers | Low risk | SeeAppendix 3 for method of assessment |
| Risk of bias in recall of falls | Low risk | Quote: "During follow up participants recorded falls in a weekly diary." |
Van Rossum 1993.
| Study characteristics | ||
| Methods | RCT (some clusters as people living together allocated to same group) | |
| Participants | Setting: Weert, The Netherlands N = 580 Sample: general population sampled, not volunteers (58% women) Age (years): range 75 to 84 Inclusion criteria: aged 75 to 84; living at home Exclusion criteria: subject or partner already receiving regular home nursing care | |
| Interventions | 1. Preventive home visits by public health nurse 4 x per year for 3 years. Extra visits/telephone contact as required. Check list of health topics to discuss. Advice given and referrals to other services 2. Control: no home visits | |
| Outcomes | 1. "Falls" Other outcomes reported but not included in this review | |
| Duration of the study | Follow‐up at 1½ years and 3 years | |
| Notes | Cost analysis reported in primary reference | |
| Risk of bias | ||
| Bias | Authors' judgement | Support for judgement |
| Random sequence generation (selection bias) | Low risk | Stratified by sex, self rated health, composition of household and social class then randomised by computer generated random numbers. Participants in intervention group then randomised to nurses. |
| Allocation concealment (selection bias) | Unclear risk | Insufficient information to permit judgement |
| Blinding of participants and personnel (performance bias) All outcomes | Unclear risk | Participants and nurses conducting home visits in intervention group were not blinded. Insufficient evidence to make judgement on impact of lack of blinding. |
| Blinding of outcome assessment (detection bias) Falls and fallers | Low risk | Falls reported by participants who were aware of their group allocation. The interviewers who collected data on falls in the previous 6 months at the end of the study were blinded. Quote: "The interviews were conducted by trained interviewers who were unaware of whether a participant had been regularly visited by a nurse or not." |
| Incomplete outcome data (attrition bias) Falls | Unclear risk | SeeAppendix 3 for method of assessment. Insufficient information to permit judgement. |
| Risk of bias in recall of falls | High risk | Retrospective. Follow‐up at 1½ years and 3 years by postal survey and interview. Falls in previous 6 months recorded. |
Vellas 1991.
| Study characteristics | ||
| Methods | RCT | |
| Participants | Setting: Toulouse, France N = 95 Sample: people presenting to their GP after a fall (65% women) Age (years): mean 78 Inclusion criteria: community‐dwelling; no biological cause for the fall; fallen less than 7 days previously Exclusion criteria: hospitalised for more than 7 days after the fall; demented; sustaining major trauma, e.g. hip fracture or other fracture; unable to mobilise or be evaluated within 7 days of the fall | |
| Interventions | 1. Iskédyl® (combination of raubasine and dihydroergocristine) 2 droppers morning and evening for 180 days 2. Control: placebo for 180 days | |
| Outcomes | 1. "Falls" | |
| Duration of the study | 180 days | |
| Notes | ||
| Risk of bias | ||
| Bias | Authors' judgement | Support for judgement |
| Random sequence generation (selection bias) | Unclear risk | Quote: "Randomised". Method of randomisation not described. |
| Allocation concealment (selection bias) | Unclear risk | Insufficient information to permit judgement |
| Blinding of participants and personnel (performance bias) All outcomes | Low risk | Placebo‐controlled randomised trial |
| Blinding of outcome assessment (detection bias) Falls and fallers | Low risk | Falls reported by participants who were blind to their group allocation (placebo‐controlled trial). "Double blind" so assessors also blind to group allocation. |
| Incomplete outcome data (attrition bias) Falls | Unclear risk | SeeAppendix 3 for method of assessment. Insufficient information to permit judgement. |
| Risk of bias in recall of falls | Unclear risk | Retrospective recall at 30, 60, 120, 180 days |
Vetter 1992.
| Study characteristics | ||
| Methods | RCT (cluster‐randomised by household) | |
| Participants | Setting: Wales, United Kingdom N = 674 Sample: people on 1 GP's patient list (% women not described) Age (years): > 70 Inclusion criteria: aged > 70 Exclusion criteria: none listed |
|
| Interventions | 1. Health visitor visits, minimum yearly, for 4 years, with advice on nutrition, environmental modification, concomitant medical conditions, and availability of physiotherapy classes if desired 2. Control: usual care | |
| Outcomes | 1. Number of people falling 2. Number sustaining a fracture | |
| Duration of the study | 4 years | |
| Notes | ||
| Risk of bias | ||
| Bias | Authors' judgement | Support for judgement |
| Random sequence generation (selection bias) | Low risk | Cluster‐randomised by household "using random number tables with subjects' study numbers and without direct contact with the subjects" |
| Allocation concealment (selection bias) | Low risk | Randomised "using random number tables with subjects' study numbers and without direct contact with the subjects". Introduction of bias unlikely. |
| Blinding of participants and personnel (performance bias) All outcomes | Unclear risk | Participants and health visitor conducting home visits in intervention group were not blinded. Insufficient evidence to make judgement on impact of lack of blinding. |
| Blinding of outcome assessment (detection bias) Falls and fallers | Unclear risk | Falls reported by participants who were aware of their group allocation. Research assistant who collected data had interviewed all participants before randomisation; unclear whether she had remained blinded. |
| Blinding of outcome assessment (detection bias) Fractures | Unclear risk | Fractures reported by participants who were aware of their group allocation. Research assistant who collected data had interviewed all participants before randomisation; unclear whether she had remained blinded. For reported fractures, "the case notes were referred to if clear answers were not obtained." |
| Incomplete outcome data (attrition bias) Fallers | Low risk | SeeAppendix 3 for method of assessment |
| Risk of bias in recall of falls | High risk | Falling status and fractures ascertained by interview at end of study period |
Vind 2009.
| Study characteristics | ||
| Methods | RCT | |
| Participants | Setting: Glostrup, Denmark N = 392 Sample: contacted by post after ED treatment or hospital discharge (74% women) Age (years): mean 74 (SD 6) Inclusion criteria: aged ≥ 65; treated in ED or admitted to hospital because of a fall Exclusion criteria: fall caused by external force or alcohol intoxication; not living locally; institutionalised; unable to walk; terminally ill; impaired communication; described as suffering from dementia in hospital notes or by staff; having a planned geriatric intervention | |
| Interventions | 1. Intervention: comprehensive multifactorial intervention. Assessed by doctor (1 h), and nurse and PT (1.5 h), during 2 visits to geriatric outpatient clinic. Team discussion with senior geriatrician, interventions planned and offered to participants. Carried out in clinic or referred to specialists. Included progressive, individualised exercise, drug modification, treatment of untreated disease, advice or referral to ophthalmologist, etc. (see Table 1 in Vind 2009 for details) 2. Control: usual care as planned in ED or during admission |
|
| Outcomes | 1. Rate of falls 2. Number of people falling 3. Number of fractures (not number of people with fractures therefore no usable data) |
|
| Duration of the study | 1 year | |
| Notes | ||
| Risk of bias | ||
| Bias | Authors' judgement | Support for judgement |
| Random sequence generation (selection bias) | Low risk | Quote: "Participants were randomized by simple method, 1:1, using a computer‐generated random list and sealed envelopes; a secretary not involved in the intervention performed randomization." |
| Allocation concealment (selection bias) | Low risk | Quote: "… using a computer‐generated random list and sealed envelopes; a secretary not involved in the intervention performed randomization." |
| Blinding of participants and personnel (performance bias) All outcomes | Unclear risk | Participants and/or intervention delivery personnel were not blind to group allocation. There is insufficient information to judge whether participants were blinded, or whether the outcomes were likely to be affected by lack of blinding. |
| Blinding of outcome assessment (detection bias) Falls and fallers | Low risk | Quote: "Research assistants who were not aware of group allocation followed all participants for 12 months. All participants kept a falls diary and were instructed to record falls daily ... Participants were telephoned monthly for collection of falls data." |
| Blinding of outcome assessment (detection bias) Fractures | Low risk | Self reported fractures confirmed from hospital records |
| Incomplete outcome data (attrition bias) Falls | Unclear risk | SeeAppendix 3 for method of assessment |
| Incomplete outcome data (attrition bias) Fallers | Low risk | SeeAppendix 3 for method of assessment |
| Risk of bias in recall of falls | Low risk | Quote: "All participants kept a falls diary and were instructed to record falls daily and whether falls had caused injury resulting in contact with a general practitioner or emergency department or admission to the hospital. Participants were telephoned monthly for collection of falls data." |
Von Stengel 2011.
| Study characteristics | ||
| Methods | RCT | |
| Participants | Setting: Erlangen‐Nürnberg, Germany N = 101 (see Notes) Sample: women recruited by mail using health insurance company database Age (years): mean 68.5 (SD 3.1), range 65 to 76 Inclusion criteria: postmenopausal; aged ≥ 65; independently community‐dwelling Exclusion criteria: diseases or medication affecting bone metabolism, neuromuscular performance or falls; implants of the lower extremity or spine; eye diseases affecting the retina; low physical capacity (< 50 W) | |
| Interventions | 1. Multifunctional training + whole body vibration: group training sessions (60 min, 2 x per week) + home training sessions (20 min, 2 x per week) for 1 year. Group sessions: dancing aerobics, balance training, functional strength training + leg strength exercises on vibration platform for last 15 min (platforms vibrated at frequencies from 25 to 35 Hz, amplitude 1.7 to 2.0 mm) 2. Control: light physical exercise and relaxation programme 1 x per wk 10 wks with breaks of 10 wks between the blocks Both groups received calcium and vitamin D supplements to ensure 1500 mg calcium and 400 IE vitamin D per day, based on normal intake |
|
| Outcomes | 1. Rate of falls 2. Number sustaining a fracture |
|
| Duration of the study | 18 months | |
| Notes | Randomised into 3 groups: training group (TG N = 50), training + whole body vibration (TGV N = 50), and control group (CG N = 51). Only TGV and CG included in the analysis as 50 members of the TG group are also included in the larger TG group in Kemmler 2010. | |
| Risk of bias | ||
| Bias | Authors' judgement | Support for judgement |
| Random sequence generation (selection bias) | Low risk | Randomised by computer‐generated age‐stratified randomization list |
| Allocation concealment (selection bias) | Low risk | Quote: "The randomization ... was performed by an independent statistician using a computer‐generated age‐stratified randomization list." Same procedure as Kemmler 2010 where randomisation was carried out by a University department. |
| Blinding of participants and personnel (performance bias) All outcomes | Low risk | Quote: "In contrast to other exercise studies, we tried to blind the study on the participant level by the implementation of sham exercise for the control group. Participants were not informed on the hypothesis and were unaware if they were in the real or control group. Groups were trained separately in order to prevent contact between the cohorts." |
| Blinding of outcome assessment (detection bias) Falls and fallers | Low risk | Falls self reported but "outcome assessors and research assistants were not allowed to ask subjects about their allocated intervention during the measurements." |
| Blinding of outcome assessment (detection bias) Fractures | Unclear risk | Participants and outcome assessors were blind to treatment group. It is unclear whether in this study radiographic confirmation was conducted. Quote: "Injurious falls, defined as falls associated with a trauma (contusion, sprain, luxation, or fracture) leading to an ailment of more than 2 days, were assessed separately", i.e. not exclusively by diary. |
| Incomplete outcome data (attrition bias) Falls | Low risk | SeeAppendix 3 for method of assessment |
| Risk of bias in recall of falls | Low risk | Quote: "Fall data were collected according to the PROFANE recommendation ... by a prospective reporting method via calendar." |
Voukelatos 2007.
| Study characteristics | ||
| Methods | RCT | |
| Participants | Setting: Sydney, Australia N = 702 Sample: volunteers recruited through advertising (84% women) Age (years): mean 69 (SD 6.5), range 69 to 70 Inclusion criteria: aged over 60; community‐dwelling Exclusion criteria: degenerative neurological disease; severely debilitating stroke; metastatic cancer; severe arthritis; unable to walk across a room independently; unable to use English | |
| Interventions | 1. Tai Chi classes 1 hour per wk for 16 wks (8 to 15 participants per class) at 24 community venues. Style of Tai Chi differed between classes: majority (83%) involved Sun style, 2 classes (3%) Yang style, remainder (14%) involved a mixture of styles 2. Control: placed on 24 wk waiting list, then offered Tai Chi programme | |
| Outcomes | 1. Rate of falls 2. Number of people falling | |
| Duration of the study | 24 wks | |
| Notes | Cost‐effectiveness analysis reported in Haas 2006 | |
| Risk of bias | ||
| Bias | Authors' judgement | Support for judgement |
| Random sequence generation (selection bias) | Low risk | Quote: "Randomization list ... was prepared for each venue using randomly permuted blocks of four or six". |
| Allocation concealment (selection bias) | Unclear risk | Insufficient information to permit judgement |
| Blinding of participants and personnel (performance bias) All outcomes | Unclear risk | Participants and instructors conducting classes in intervention group were not blinded. Control participants were asked not to take classes during the study period, but may have accessed other fall prevention interventions. Insufficient evidence to make judgement on impact of lack of blinding. |
| Blinding of outcome assessment (detection bias) Falls and fallers | Low risk | Falls reported by participants who were aware of their group allocation. Outcome assessors blinded to assignment. |
| Incomplete outcome data (attrition bias) Falls | Low risk | SeeAppendix 3 for method of assessment |
| Incomplete outcome data (attrition bias) Fallers | Low risk | SeeAppendix 3 for method of assessment |
| Risk of bias in recall of falls | Low risk | Quote: "Participants were given falls calendars and were instructed to record on the calendar each day for 24 weeks whether they had had a fall." Pre‐paid postage calendars returned at the end of each month, with telephone call if not returned within 2 weeks. |
Wagner 1994.
| Study characteristics | ||
| Methods | RCT | |
| Participants | Setting: Seattle, USA N = 1559 Sample: 'healthy elderly' people, HMO enrollees (59% women) Age (years): mean 72 Inclusion criteria: aged ≥ 65; HMO members; ambulatory and independent Exclusion criteria: too ill to participate as defined by primary care physician | |
| Interventions | 1. 60 to 90‐minute interview with nurse, including review of risk factors, audiometry and blood pressure measurement, development of tailored intervention, motivation to increase physical and social activity 2. Chronic disease prevention nurse visit 3. Control: usual care | |
| Outcomes | 1. Number of people falling Other outcomes reported but not included in this review | |
| Duration of the study | 2 years (1‐year data used in analyses in the review) | |
| Notes | Risk factors identified: inadequate exercise, high‐risk alcohol use, environmental hazards if increased fall risk, high‐risk prescription drug use, impaired vision, impaired hearing | |
| Risk of bias | ||
| Bias | Authors' judgement | Support for judgement |
| Random sequence generation (selection bias) | Unclear risk | Quote: "Randomized into three groups in a ratio of 2:1:2." |
| Allocation concealment (selection bias) | Unclear risk | Insufficient information to permit judgement |
| Blinding of participants and personnel (performance bias) All outcomes | Unclear risk | Participants and personnel implementing the intervention not blind to allocated group, but impact of non‐blinding unclear |
| Blinding of outcome assessment (detection bias) Falls and fallers | Unclear risk | Falls were self reported at 1 year and 2 years by questionnaire, with telephone interview if questionnaire was not returned. Blinding of interviewers and data assessors not described. |
| Incomplete outcome data (attrition bias) Falls | Unclear risk | SeeAppendix 3 for method of assessment |
| Incomplete outcome data (attrition bias) Fallers | Low risk | SeeAppendix 3 for method of assessment |
| Risk of bias in recall of falls | High risk | Falls retrospectively measured at 1 and 2 years by mailed questionnaire. Interviewed by phone if questionnaire not returned. Data supplemented by computerised hospital discharge files. |
Weber 2008.
| Study characteristics | ||
| Methods | RCT (cluster‐randomised 15:3 ratio). Clusters were clinics with > 20 patients meeting inclusion criteria | |
| Participants | Setting: rural Pennsylvania, USA
N = 620
Sample: patients in EPICCare database for Geisinger Health System (79% women)
Age (years): mean 76.8
Inclusion criteria: aged ≥ 70; community‐dwelling; ≥ 4 active prescription medicines and ≥ 1 psychoactive medication prescribed within last year Exclusion criteria: none described. |
|
| Interventions | 1. Intervention: standardised medication review by pharmacist or geriatrician using electronic medical record (EMR) system focusing on psychoactive medications, polypharmacy, and inappropriate dosages. Recommendations sent to primary physician via EMR (only once). Primary physician could access guidelines via EMR system 2. Control: usual care with no access to EMR |
|
| Outcomes | Falls but no useable data and no results that can be reported in the text. Cost analysis reported. | |
| Duration of the study | 15 months | |
| Notes | Cost analysis reported in primary reference | |
| Risk of bias | ||
| Bias | Authors' judgement | Support for judgement |
| Random sequence generation (selection bias) | Unclear risk | Quote: "We then randomized clinic sites to receive either the intervention or usual care." Insufficient information to permit judgement. |
| Allocation concealment (selection bias) | Unclear risk | Insufficient information to permit judgement |
| Blinding of participants and personnel (performance bias) All outcomes | High risk | No mention of any blinding; unlikely that participants and study personnel could be blinded |
| Blinding of outcome assessment (detection bias) Falls and fallers | Unclear risk | Quote: "... patients were contacted by telephone by a study nurse at months 1, 3, 6, 9, 12, and 15, who collected data on self reported falls" Quote: "To identify falls, we obtained data on all medical encounters (inpatient hospitalizations, emergency department encounters, and outpatient visits". No mention of blinding for either of these sources of data. |
| Incomplete outcome data (attrition bias) Falls | Unclear risk | SeeAppendix 3 for method of assessment |
| Incomplete outcome data (attrition bias) Fallers | Unclear risk | SeeAppendix 3 for method of assessment |
| Risk of bias in recall of falls | High risk | Recall at 3‐month intervals. Quote: "To obtain direct information from patients regarding self‐reported fall rates, patients were contacted by telephone by a study nurse at months 1, 3, 6, 9, 12, and 15, who collected data on self reported falls". These were combined in analysis with falls records from routinely collected data. |
Weerdesteyn 2006.
| Study characteristics | ||
| Methods | RCT | |
| Participants | Setting: Nijmegan, The Netherlands N = 58 Sample: recruited using newspaper advertisements (72% women) Age (years): mean 74 (SD 6) Inclusion criteria: ≥ 65 years; community‐dwelling; ≥ 1 fall in previous year; able to walk 15 min without a walking aid Exclusion criteria: severe cardiac, pulmonary, or musculoskeletal disorders; pathologies associated with increased falls risk, e.g. Parkinson's disease; osteoporosis; using psychotropic drugs | |
| Interventions | 3 arms described, but 1 not randomised 1. Low‐intensity exercise programme: 1.5 hour, 2 x per wk for 5 wks. First weekly session included gait, balance, and co‐ordination training including obstacle avoidance. Second session, walking exercises with changes of speed and direction, and practice of fall techniques derived from martial arts 2. Control: no training | |
| Outcomes | 1. Rate of falls 2. Number of people falling Other outcomes reported but not included in this review |
|
| Duration of the study | 7 months | |
| Notes | ||
| Risk of bias | ||
| Bias | Authors' judgement | Support for judgement |
| Random sequence generation (selection bias) | Unclear risk | Quote: "Block randomization (3 blocks of 20) with gender stratification with equal probability for either exercise or control group assignment." |
| Allocation concealment (selection bias) | Unclear risk | Quote: "The group allocation sequence was concealed (to both researchers and participants) until assignment of interventions". "We had participants draw a sealed envelope with group allocation ticket from a box containing all remaining envelopes in the block" (personal communication). |
| Blinding of participants and personnel (performance bias) All outcomes | Unclear risk | Participants and personnel implementing the intervention not blind to allocated group, but impact of non‐blinding unclear |
| Blinding of outcome assessment (detection bias) Falls and fallers | High risk | Falls reported by participants who were aware of their group allocation. Outcome assessors were not blinded to assignment (personal communication from Dr Weeredesteyn) |
| Incomplete outcome data (attrition bias) Falls | Low risk | SeeAppendix 3 for method of assessment |
| Incomplete outcome data (attrition bias) Fallers | Low risk | SeeAppendix 3 for method of assessment |
| Risk of bias in recall of falls | Low risk | Quote: "Falls were monitored monthly using pre‐addressed, reply‐paid fall registration cards." Asked asked whether a fall had occurred in the past month. Sent a reminder if no registration card received. |
Whitehead 2003.
| Study characteristics | ||
| Methods | RCT | |
| Participants | Setting: community or low care residential care (hostel accommodation), Adelaide, Australia N = 140 Sample: patients presenting with a fall to A&E (71% women) Age (years): mean 77.8 (SD 7.0) Inclusion criteria: aged ≥ 65; fall‐related attendance at A&E; community‐dwelling or in low care residential care (hostel accommodation) Exclusion criteria: resident in nursing home; presenting fall related to a stroke, seizure, cardiac or respiratory arrest, major infection, haemorrhage, motor vehicle accident, or being knocked to the ground by another person; MMSE < 25; no resident carer; not English speaking; living out of catchment area; terminal illness | |
| Interventions | 1. Home visit and questionnaire. "Fall risk profile" developed and participant given written care plan itemising elements of intervention. Letter to GP informing him of participant's fall, inviting them to review participant, highlighting identified risk factors, suggesting possible strategies (evidence based). GP also given 1‐page evidence summary 2. Home visit. No intervention. Standard medical care from GP | |
| Outcomes | 1. Number of people falling Primary outcome was uptake of prevention strategies, rather than falls | |
| Duration of the study | 6 months | |
| Notes | Potential strategies: review of medication use especially psychotropic drugs, home assessment | |
| Risk of bias | ||
| Bias | Authors' judgement | Support for judgement |
| Random sequence generation (selection bias) | Low risk | Randomisation and allocation schedules created by a researcher external to the trial |
| Allocation concealment (selection bias) | Low risk | Randomised by a researcher external to the trial using numbered, sealed, opaque envelopes |
| Blinding of participants and personnel (performance bias) All outcomes | Unclear risk | Participants and personnel implementing the intervention not blind to allocated group, but impact of non‐blinding unclear |
| Blinding of outcome assessment (detection bias) Falls and fallers | Low risk | Falls reported by participants who were aware of their group allocation. Outcome assessors blinded to assignment. |
| Incomplete outcome data (attrition bias) Fallers | High risk | SeeAppendix 3 for method of assessment |
| Risk of bias in recall of falls | Low risk | Falls ascertained by falls diary and phone calls monthly to encourage use of the diary |
Wilder 2001.
| Study characteristics | ||
| Methods | RCT | |
| Participants | Setting: Wisconsin, USA N = 60 Sample: "frail elderly" (proportion of women not stated) Age (years): no description Inclusion criteria: aged ≥ 75 years, living at home, using home services (i.e. Meals on Wheels, Telecare or Lifeline) Exclusion criteria: none described | |
| Interventions | 1. Home modifications plus home exercise programme monitored by a "trained volunteer buddy" 2. Simple home modifications 3. Control: no intervention | |
| Outcomes | 1. "Falls" | |
| Duration of the study | 1 year | |
| Notes | Abstract only | |
| Risk of bias | ||
| Bias | Authors' judgement | Support for judgement |
| Random sequence generation (selection bias) | Unclear risk | Quote: "randomly assigned" to 3 arms. Method not described. |
| Allocation concealment (selection bias) | Unclear risk | Insufficient information to permit judgement |
| Blinding of participants and personnel (performance bias) All outcomes | Unclear risk | Participants and personnel implementing the intervention not blind to allocated group, but impact of non‐blinding unclear |
| Blinding of outcome assessment (detection bias) Falls and fallers | Unclear risk | Falls reported by participants who were aware of their group allocation. Does not state whether outcome assessors were blind to allocation. |
| Incomplete outcome data (attrition bias) Falls | Unclear risk | SeeAppendix 3 for method of assessment. Insufficient information to permit judgement. |
| Risk of bias in recall of falls | Unclear risk | Falls monitored by weekly telephone calls. Interval recall over a short period. |
Wolf 1996.
| Study characteristics | ||
| Methods | RCT | |
| Participants | Setting: Atlanta, USA N = 200 Sample: residing in an independent living facility, recruited by advertising and direct contact (81% women) Age (years): mean 76.2 (SD 4.7) Inclusion criteria: aged > 70; ambulatory; living in unsupervised environment; agreeing to participate weekly for 15 wks with 4‐month follow‐up Exclusion criteria: debilitating conditions, e.g. cognitive impairment, metastatic cancer, crippling arthritis, Parkinson's disease, major stroke, profound visual defects | |
| Interventions | 3 arms: 1. Tai Chi Quan (balance enhancing exercise). Group sessions 2 x per wk for 15 wks. (Individual contact with instructor approximately 45 min per wk) 2. Computerised balance training on force platform. Individual sessions 1 x per wk for 15 wks. (Individual contact with instructor approximately 45 min per wk) 3. Control: group discussions of topics of interest to older people with gerontological nurse, 1 hour per week for 15 wks | |
| Outcomes | Used modified definition of a fall rather than agreed definition for FICSIT trials described in Buchner 1993 1. Rate of falls |
|
| Duration of the study | 8 months (range 7 to 20) | |
| Notes | Atlanta FICSIT trial (Province 1995). 1997 paper included under this Study ID reports on a subgroup of the trial, reporting on outcomes other than falls | |
| Risk of bias | ||
| Bias | Authors' judgement | Support for judgement |
| Random sequence generation (selection bias) | Low risk | Randomised using "computer‐generated fixed randomization procedure". |
| Allocation concealment (selection bias) | Unclear risk | Insufficient information to permit judgement. |
| Blinding of participants and personnel (performance bias) All outcomes | Unclear risk | Participants and personnel implementing the intervention not blind to allocated group, but impact of non‐blinding unclear |
| Blinding of outcome assessment (detection bias) Falls and fallers | Unclear risk | Falls reported by participants who were aware of their group allocation. Does not state whether outcome assessors were blind to allocation. |
| Incomplete outcome data (attrition bias) Falls | Unclear risk | SeeAppendix 3 for method of assessment. Insufficient information to permit judgement. |
| Risk of bias in recall of falls | Low risk | Falls ascertained by monthly calendar, or by monthly phone call from project staff |
Wolf 2003.
| Study characteristics | ||
| Methods | RCT (cluster‐randomised by living facility) | |
| Participants | Setting: Atlanta, USA N = 311 (N = 20 clusters) Sample: congregate living facilities (independent living facilities) recruited in pairs by whether Housing and Urban Development (N = 14) or private (N = 6). At least 15 participants recruited per site (94% women) Age (years): mean 80.9 (SD 6.2), range 70 to 97 Inclusion criteria: aged ≥ 70; ≥ 1 fall in previous year; transitioning to frailty Exclusion criteria: frail or vigorous elderly; major cardiopulmonary disease; cognitive impairment (MMSE < 24); contraindications for exercise, e.g. major orthopaedic conditions; mobility restricted to wheelchair; terminal cancer; evidence of other progressive or unstable neurological or medical conditions | |
| Interventions | 1. Intense Tai Chi (TC): 6 out of 24 simplified TC forms. 1 hour progressing to 90 min, 2 x per wk (10 to 50 min of TC) for 48 wks. Progressing from using upright support to 2 min of TC without support 2. Wellness education programme: 1 hour per wk for 48 wks. Instruction on fall prevention, exercise and balance, diet and nutrition, pharmacological management, legal issues, changes in body function, mental health issues. Interactive material provided but no formal instruction in exercise | |
| Outcomes | 1. Rate of falls 2. Number of people falling | |
| Duration of the study | 48 wks of intervention. Methods paper (Wolf SL et al. Controlled Clinical Trials 2001;22:689‐704) describes follow‐up for 1 year post intervention by weekly phone calls but not reported in Wolf 2003 or subsequently. | |
| Notes | "Transitioning to frailty" if not vigorous or frail; based on age, gait/balance, walking activity for exercise, other physical activity for exercise, depression, use of sedatives, vision, muscle strength, lower extremity disability (Speechley M et al. J Am Geriatr Soc 1991;39:46‐52) | |
| Risk of bias | ||
| Bias | Authors' judgement | Support for judgement |
| Random sequence generation (selection bias) | Unclear risk | Facilities stratified by socioeconomic status and randomised in pairs. Quote: "First site in the pair was randomized to an intervention. The second site received the other intervention." |
| Allocation concealment (selection bias) | Unclear risk | Insufficient information to permit judgement, although allocation of second site in the pair could be predicted after the first site was randomised. |
| Blinding of participants and personnel (performance bias) All outcomes | Unclear risk | Participants and personnel implementing the intervention not blind to allocated group, but impact of non‐blinding unclear |
| Blinding of outcome assessment (detection bias) Falls and fallers | Low risk | Falls reported by participants who were aware of their group allocation. Outcome assessors blinded to assignment. |
| Incomplete outcome data (attrition bias) Falls | Unclear risk | SeeAppendix 3 for method of assessment |
| Incomplete outcome data (attrition bias) Fallers | Low risk | SeeAppendix 3 for method of assessment |
| Risk of bias in recall of falls | Low risk | Prospective. Falls recorded on forms and submitted to instructor weekly + phone call. |
Woo 2007.
| Study characteristics | ||
| Methods | RCT | |
| Participants | Setting: Hong Kong, China N =180 Sample: recruited by notices posted in 4 community centres in Shatin township (50% women) Age (years): mean 69 (SD 2.6), range 65 to 74 Inclusion criteria: able to walk > 8 m without assistance Exclusion criteria: neurological disease which impaired mobility; shortness of breath or angina on walking up 1 flight of stairs; dementia; already performing Tai Chi or resistance training exercise | |
| Interventions | 1. Tai Chi using Hang style with 24 forms 3 x per wk for 52 wks 2. Resistance training exercises 3 x per wk using a Theraband, for 52 wks 3. Control: no exercise prescribed | |
| Outcomes | 1. Number of people falling Falls a secondary outcome of this study. Other outcomes reported but not included in this review | |
| Duration of the study | 1 year | |
| Notes | ||
| Risk of bias | ||
| Bias | Authors' judgement | Support for judgement |
| Random sequence generation (selection bias) | Low risk | Quote: "Computer generated blocked randomisation." |
| Allocation concealment (selection bias) | Unclear risk | Insufficient information to permit judgement |
| Blinding of participants and personnel (performance bias) All outcomes | Unclear risk | Participants and personnel implementing the intervention not blind to allocated group, but impact of non‐blinding unclear |
| Blinding of outcome assessment (detection bias) Falls and fallers | High risk | Participants and personnel not blind to allocated group. Quote: "Falls were ascertained by diary and reported to the staff running the interventions." (personal communication) |
| Incomplete outcome data (attrition bias) Fallers | Low risk | SeeAppendix 3 for method of assessment |
| Risk of bias in recall of falls | High risk | Quote: "Falls were ascertained by diary and reported to the staff running the interventions." (personal communication) but this could not apply to the control group. |
Wu 2010.
| Study characteristics | ||
| Methods | RCT | |
| Participants | Setting: Burlington, Vermont, USA N = 64 Sample: volunteers recruited by advertising, referrals, flyers etc (84% women) Age (years): mean 75.4 (SD 7) Inclusion criteria: age ≥ 65; community‐dwelling; at risk of falling (≥ 1 fall in past year or ≤ 50% on ABC Scale); able to walk and do weight‐bearing exercises with or without assistive devices; no plans to be away > 2 wks during study period; sufficient cognition and attention to follow directions; have a television (TV) and Internet access; sufficient visual acuity to mimic instructor's movements on TV screen; consenting; with primary care physician approval to participate Exclusion criteria: unable to ambulate/exercise independently; unable to travel to community centre; having certain exercise‐limiting conditions including musculoskeletal, cardiac, neurological, pulmonary etc | |
| Interventions | 24‐form, Yang‐style Tai Chi for 1 h/day, 3 days/wk for 15 wks Delivered via 3 methods with same content and same instructor: 1. Telecommunication‐based exercise (Tele‐ex). Home‐based, interactive via TV screen, allowing group and their instructor to "meet" 2. Traditional community centre‐based exercise (Comm‐ex) 3. Home video‐based exercise (Home‐ex). DVD with 45 1‐hour sessions + written documentation |
|
| Outcomes | 1. Falls (mean reduction in falls) No poolable data. Other outcomes not included in this review |
|
| Duration of the study | 15 wks | |
| Notes | ||
| Risk of bias | ||
| Bias | Authors' judgement | Support for judgement |
| Random sequence generation (selection bias) | Unclear risk | Quote: "Those who consented were enrolled in the study and were randomly assigned into the Tele‐ex, Commex, and Home‐ex groups. To ensure balance among the 3 groups on important potential confounders, randomization was stratified by sex, age (65–74y vs 75y), and time expected to be away during the study period (1 wk vs 1–2 wk). Blocked randomization was used within strata." |
| Allocation concealment (selection bias) | Unclear risk | Insufficient information to permit judgement |
| Blinding of participants and personnel (performance bias) All outcomes | Unclear risk | All 3 groups received a fall prevention intervention (Tai Chi). Unclear whether there is potential for performance bias. |
| Blinding of outcome assessment (detection bias) Falls and fallers | Unclear risk | Insufficient information to permit judgement |
| Incomplete outcome data (attrition bias) Falls | Unclear risk | SeeAppendix 3 for method of assessment |
| Risk of bias in recall of falls | High risk | Quote: "Fall incidents were assessed by a Fall History Form that recorded the number of falls in the past 12 months (at pretest) and the past 15 weeks (at posttest)" |
Wyman 2005.
| Study characteristics | ||
| Methods | RCT | |
| Participants | Setting: Minnesota, USA N = 272 Sample: female Medicare beneficiaries in Twin Cities Metropolitan Area Age (years): mean 79 (SD 6), range 70 to 99 Inclusion criteria: > 70 years; community‐dwelling; mentally intact; ambulatory; ≥ 2 risk factors for falls; medically stable Exclusion criteria: currently involved in regular exercise | |
| Interventions | 1. Multifactorial intervention: comprehensive fall risk assessment by nurse practitioner, exercise (walking with weighted balance and co‐ordination exercises), fall prevention education, provision of 2 night lights, individualised risk reduction counselling. 12‐week intervention of alternating home visits and telephone calls, followed by tapered 16‐week computerised telephone monitoring and support 2. Control: health education on topics other than fall prevention. 12‐week intervention of alternating home visits and telephone calls. 12‐week intervention of alternating home visits and telephone calls, followed by tapered 16‐week computerised telephone monitoring and support. | |
| Outcomes | 1. Rate of falls 2. Number of people falling |
|
| Duration of the study | 2 years (1‐year data used for rate of falls in the review analysis, 2‐year data for risk of falling as 1‐year data unavailable) | |
| Notes | Cost description reported in Findorff 2007 | |
| Risk of bias | ||
| Bias | Authors' judgement | Support for judgement |
| Random sequence generation (selection bias) | Low risk | Quote: "Participants were stratified according to age group ... and randomized using a permutated block design with varying block sizes of four and six to assure that the number of participants was balanced in each treatment group." |
| Allocation concealment (selection bias) | Unclear risk | Insufficient information to permit judgement |
| Blinding of participants and personnel (performance bias) All outcomes | Unclear risk | Participants and personnel implementing the intervention not blind to allocated group, but impact of non‐blinding unclear |
| Blinding of outcome assessment (detection bias) Falls and fallers | Unclear risk | Falls reported by participants who were aware of their group allocation. Does not state whether outcome assessors were blind to allocation. |
| Incomplete outcome data (attrition bias) Falls | Low risk | SeeAppendix 3 for method of assessment |
| Incomplete outcome data (attrition bias) Fallers | Low risk | SeeAppendix 3 for method of assessment |
| Risk of bias in recall of falls | Low risk | Quote: "Falls were measured daily on a calendar that was mailed in monthly." |
Yamada 2010.
| Study characteristics | ||
| Methods | RCT | |
| Participants | Setting: Kyoto, Japan N = 60 Sample: people recruited using advertising in local press (% women not stated) Age (years): not stated Inclusion criteria: aged ≥ 65; community‐dwelling; visited primary care physician in previous 3 yrs; MMSE ≥ 24; able to walk independently (with or without a cane): willing to participate in group exercise classes lasting ≥ 6 months; access to transportation; minimal hearing and visual impairments; no regular exercise in previous 12 months Exclusion criteria: severe cardiac pulmonary, or musculoskeletal disorders; neurological conditions associated with falling (stroke, Parkinson's disease); osteoporosis; use of psychotropic drugs | |
| Interventions | 1. Exercise class + trail‐walking exercise: numbered flags at random positions in a 5 m x 5 m area. Participants walk as quickly and correctly from flag 1 to 15 in wk 1 to 8, from flags 15 to 1 in wk 9 to 16. Flag positions changed for each session. 2. Exercise class + indoor walking: instructed to attend supervised indoor walking session (up to 30 min on 300‐foot loop) Standardised group exercise class: 20 min moderate‐intensity aerobic exercise, 20 min progressive strength training, 10 min flexibility + balance exercises, 10 min cool‐down, + "exercises known to decrease fall risk". 90 min, 1 x per wk for 16 wks |
|
| Outcomes | 1. Rate of falls 2. Number of people falling Other outcomes not included in this review |
|
| Duration of the study | 16 months | |
| Notes | ||
| Risk of bias | ||
| Bias | Authors' judgement | Support for judgement |
| Random sequence generation (selection bias) | Unclear risk | Quote: "Participants were block randomized in blocks of four" |
| Allocation concealment (selection bias) | Low risk | Quote: "Using this sequence, opaque envelopes bearing group names were numbered and the 60 participants were then randomly as signed to the TWE (n = 30) or walking (W) group (n = 30)" |
| Blinding of participants and personnel (performance bias) All outcomes | Unclear risk | Both groups received an exercise intervention. Unclear whether there was any risk of performance bias. |
| Blinding of outcome assessment (detection bias) Falls and fallers | Unclear risk | Unclear whether person ascertaining falls was blind to allocated group |
| Incomplete outcome data (attrition bias) Falls | Unclear risk | SeeAppendix 3 for method of assessment |
| Incomplete outcome data (attrition bias) Fallers | Low risk | SeeAppendix 3 for method of assessment |
| Risk of bias in recall of falls | Low risk | Quote: "The participants were asked to record any falls in fall diaries that were mailed to the research assistants every month." |
A&E: hospital accident and emergency department ABC Scale: Activities‐specific Balance Confidence Scale ADL: activities of daily living AMT: abbreviated mental test BMD: bone mineral density BMI: body mass index CCT: controlled clinical trial (quasi‐randomised) CSH: carotid sinus hypersensitivity CSM: carotid sinus massage DXA: dual‐energy X‐ray absorptiometry (a means to measure bone density) ECG: electrocardiogram ERT: estrogen replacement therapy ED: emergency department FAME: Falls Management Exercise FICSIT: frailty and injuries: co‐operative studies of intervention techniques FROP‐Com: Falls Risk for Older People in the Community assessment GP: general practitioner GPSS: Geriatric Postal Screening Survey HMO: health maintenance organisation HRT: hormone replacement therapy IADL: instrumental activities of daily living. More complex than ADL, e.g. handling personal finances, preparing meals, shopping etc IQR: interquartile range m: metres µg: microgram MET: Melbourne Edge Test MMSE: Mini Mental State Examination NHS: National Health Service (United Kingdom) NSAID: nonsteroidal anti‐inflammatory drugs ng: nanogram (multiply by 2.496 to convert to nanomoles/L) nmol: nanomole OT: occupational therapist PT: physical therapist/physiotherapist RCT: randomised controlled trial SD: standard deviation TUG: Timed Up and Go test wk: week x: times 25(OH)D: 25‐hydroxy‐vitamin D <: less than >: more than
Characteristics of excluded studies [ordered by study ID]
| Study | Reason for exclusion |
|---|---|
| Aisen 2011 | Multicentre RCT. Intervention: tramiprosate 100 mg or tramiprosate 150 mg bd versus placebo in people with mild‐to‐moderate Alzheimer's disease. Falls reported as adverse events. |
| Alexander 2003 | Controlled trial. Not strictly randomised. Intervention: multifactorial fall risk assessment in day care centres. Falls outcomes. |
| Alp 2007 | RCT. Intervention: self management classes for osteoporotic women (post‐menopausal or idiopathic osteoporosis). Falls outcomes for outdoor falls only. Not just older women (mean age minus 1 SD is < 60). |
| Armstrong 1996 | RCT. Intervention: hormone replacement therapy in post menopausal women. Falls outcomes. Not just older women: range 45 to 70, mean age minus 1 SD is < 60. |
| Ashburn 2007 | RCT. Intervention: exercise in people with Parkinson's disease. Falls outcomes. |
| Barr 2005 | Controlled trial. 171 non‐responders added to intervention group after randomisation. Intervention: screening for fracture risk and GPs advised to prescribe calcium and vitamin D. Falls outcomes. |
| Bea 2011 | RCT. Intervention: hormone treatment (2 arms) versus control in postmenopausal women. Falls outcomes. Not just older women (mean age minus 1 SD is < 60). |
| Berggren 2008 | RCT. Intervention: multifactorial intervention in hospital after hip fracture. Reports falls 1 year after randomisation. Excluded as a large proportion were not community‐dwelling. Only 63% living independently prior to admission, and 52% by 1 year. |
| Chapuy 2002 | RCT. Intervention: vitamin D plus calcium. Falls outcomes. Not community (intermediate nursing care facilities). |
| Crotty 2002 | RCT. Intervention: accelerated discharge and home‐based rehabilitation after hip fracture. Falls reported as adverse events. |
| De Deyn 2005 | RCT. Intervention: antipsychotic (aripiprazole) versus placebo in patients with Alzheimer's disease. Only falls caused by the medication (adverse events). |
| Dubbert 2002 | RCT. Intervention: nurse counselling to begin a programme of walking. Injurious falls reported as adverse events. |
| Dubbert 2008 | RCT. Intervention: counselling to increase walking and carry out home‐based strength and flexibility exercise. Injurious falls reported as adverse events. |
| Ebrahim 1997 | RCT. Intervention: brisk walking in post menopausal women. Falls outcomes. Not just older women (mean minus 1 SD is < 60). |
| Edwards | Ongoing multifactorial trial described in Edwards N, Cere M, Leblond D. A community‐based intervention to prevent falls among seniors. Family and Community Health 1993;15(4):57‐65. No paper reporting results identified. No reply to emailed enquiry. |
| Elley 2003 | RCT (cluster‐randomised). Intervention: activity counselling and Green Prescription to increase physical activity in older people. Falls reported as adverse events. |
| Faber 2006 | RCT. Interventions: functional walking, Tai Chi. Not community (low and high‐level nursing care facilities). |
| Gill 2002 | RCT. Intervention: home‐based intervention to prevent functional decline. Falls reported as adverse events. |
| Graafmans 1996 | Not RCT. An epidemiological study of risk factors for falls in a self selected subgroup from an RCT. |
| Green 2002 | RCT. Intervention: community physiotherapy programme for people with mobility problems at least 1 year post stroke. Falls outcomes. |
| Inokuchi 2007 | Not RCT. Study design changed to non‐randomised controlled trial. Intervention: nurse‐led community exercise programme. Falls outcomes. |
| Iwamoto 2005 | RCT. Intervention: whole body vibration (WBV) plus alendronate versus alendronate. Aim to investigate whether WBV enhanced effect of alendronate on BMD, bone turnover, and chronic back pain in people with osteoporosis. Falls reported but only one person fell during 1‐year follow‐up in intervention group versus 2 in control group. |
| Jee 2004 | RCT (pilot). Intervention: incorporating vision and hearing tests into aged care assessment. No falls outcomes. |
| Kerschan‐Schindl 2000 | Not RCT. Sample selected from controlled trial of home exercise programme. Falls outcomes. |
| Kerse 2010 | RCT. Intervention: home‐based physical activity programme in people aged over 75 years with depression. Falls reported as adverse events. |
| Kiehn 2009 | RCT. Intervention: exercise. Letter to the editor published 2009, with no falls outcomes. Unable to obtain results from authors. |
| Kruse 2010 | RCT. Intervention: weight‐bearing exercise in people with diabetic peripheral neuropathy. Falls outcomes. Not just older people (mean age minus SD is = < 60). |
| Larsen 2005 | RCT. 3 interventions: vitamin D plus calcium versus same plus home safety versus home safety alone. Outcome: only 'severe' falls leading to acute hospital admission. |
| Lawton 2008 | RCT. Intervention: exercise prescription for relatively inactive women. Not just older women (range 40 to 74, mean age minus 1 SD is < 60), and falls reported as adverse events. |
| Lehtola 2000 | RCT. Intervention: exercise. Translated from Finnish. Excluded because of apparent discrepancies in reporting of data. Clarification sought from authors but no response. |
| McMurdo 2010 | RCT. Intervention to increase physical activity in sedentary older people. Falls reported as adverse events. |
| Means 1996 | RCT (pilot). Intervention to test a performance measure. Both groups received the same exercise intervention, with or without exposure to the functional obstacle course. Falls outcomes. |
| N0025078568 | RCT of vestibular rehabilitation with falls outcomes due for completion 2001. Completed "a few years ago" but yet to be written up (personal communication). |
| N0084162084 | RCT with falls outcome completed in 2008. No paper published. |
| N0105009461 | RCT due for completion 2001 but no paper identified. Study incomplete in 2006 (personal communication), no response to subsequent emails. |
| N0582105006 | RCT due for completion in 2002 but no paper published |
| Orwig 2011 | RCT. Intervention: progressive aerobic and resistance exercises to improve BMD in community‐dwelling older people after hip fracture. Falls recorded as adverse events. |
| Peterson 2004 | RCT. Intervention: muscle strength training in hip fracture patients post discharge. No falls outcomes. Insufficient falls data to carry out reliable analysis (personal communication). |
| Reid 2008 | RCT. Intervention: calcium supplementation. Falls outcomes. Not just older men (40 years and over, mean age 57). |
| Ringe 2007 | Possibly CCT ("alternate allocation" of "matched triplets" to one of 3 intervention groups). Intervention: alendronate + alfacalcidol; alendronate and plain vitamin D; alfacalcidol alone. Not just older people (mean age minus 1 SD is < 60) (all with osteoporosis). |
| Robertson 2001b | Not RCT. Controlled trial in multiple centres. Intervention: home‐based exercise. Same programme as in Campbell 1997, Campbell 1999, and Robertson 2001a. Falls outcomes. |
| Rosie 2007 | RCT. Intervention: functional home exercise. Falls reported as adverse events. |
| Rucker 2006 | Not RCT. Non‐randomised "on‐off" time series scheme. Intervention: educational intervention. Falls outcomes. |
| Sakamoto 2006 | RCT. Intervention: balance exercise. Residents of nursing care facilities and special nursing homes for the aged, and the users of outpatient rehabilitation centres. |
| Sambrook 2012 | RCT (cluster‐randomised). Intervention: increased sunlight. Falls outcomes. Participants are in intermediate care facilities, i.e. not community‐dwelling. |
| Sato 2005b | RCT. Intervention: risedronate, vitamin D2, and calcium in women with dementia and probable Alzheimer's disease. Control: placebo risedronate, vitamin D2, and calcium. Not a comparison of fall prevention interventions as both groups received vitamin D and calcium. Fractures primary outcome. Paper reports change in number of fallers pre‐post intervention in both groups. |
| Sato 2006 | RCT. Intervention: alendronate plus vitamin D for prevention of fractures in people with Parkinson's disease. |
| Shaw 2003 | RCT. Intervention: multifactorial intervention in cognitively impaired people. Falls outcomes. Majority of participants not community‐dwelling (79% of participants lived in high and intermediate nursing care facilities). |
| Shimada 2003 | RCT. Interventions: balance training, gait re‐education. Falls data obtained from authors but not available by source population (62% community‐dwelling and 38% institutionalised). |
| Singh 2005 | RCT. Intervention: high versus low‐intensity weight training versus GP care for depression. Falls reported as adverse events. |
| Sohng 2003 | RCT. Intervention: community‐based "fall prevention exercise programme" with no falls outcome. |
| Stineman 2011 | RCT. Intervention: exercise for African Americans with fall history. No falls outcome. |
| Sumukadas 2007 | RCT. Intervention: perindopril (ACE inhibitor) to improve muscle function. Falls reported as adverse events. |
| Teixeira 2010 | RCT. Intervention: exercise plus medication in women with osteoporosis. Falls outcomes. Not just older women (mean age minus 1 SD is < 60). |
| Tennstedt 1998 | RCT. Intervention: to reduce fear of falling and increase activity levels. Falls reported as adverse events. |
| Tinetti 1999 | RCT. Intervention: home‐based rehabilitation after hip fracture. Falls reported as adverse events. |
| Vogler 2009 | RCT. Intervention: exercises in people recently discharged from hospital. Falls reported as adverse events. |
| Witham 2010 | RCT. Intervention: vitamin D in older people with heart failure. Falls reported as adverse events. |
| Wolfson 1996 | RCT. Intervention: exercise. FICSIT trial. No falls outcome. |
| Xia 2009 | RCT. Population‐based multifaceted intervention. Falls outcomes based on random sample from participating communities. |
| Yardley 2007 | RCT. Intervention: Internet provision of tailored advice on strength and balance training. No falls outcomes. |
| Yates 2001 | RCT. Multifactorial intervention to reduce fall risk. No falls outcomes. |
| Ytterstad 1996 | Not RCT. Non‐randomised controlled trial. Intervention: population‐based. Falls outcomes. |
| Zhang 2006 | RCT. Intervention: Tai Chi. Title states "intervention study to prevent falls" but no falls outcomes. |
| Zijlstra 2009 | RCT. Intervention: cognitive behavioural group intervention to reduce fear of falling and activity avoidance. Falls reported as adverse events. |
ACE: angiotensin‐converting‐enzyme bd: twice a day BMD: bone mineral density CCT: controlled clinical trial FICSIT: frailty and injuries: co‐operative studies of intervention techniques GP: general practitioner (family physician) RCT: randomised controlled trial SD: standard deviation
Characteristics of studies awaiting classification [ordered by study ID]
Adunsky 2011.
| Methods | RCT (multicentre) |
| Participants | Setting: 8 countries N = 123 Sample: hip fracture patients Inclusion criteria: aged ≥ 60; ambulatory; unilateral hip fracture; non‐complicated surgical repair; no more than 4 days after hip fracture; MMSE score ≥ 21 Exclusion criteria: hip fracture due to bone pathology other than osteoporosis, or major trauma, uncontrolled thyroid disease, uncontrolled diabetes, cancer, uncontrolled hypertension; currently receiving systemic corticosteroids (10 mg/day); medications known to affect growth hormone secretion; end organ disease; neuromuscular or neurologic disease causing muscle weakness; recent signs or symptoms of coronary heart disease (during 3 months prior to study); NYHA class‐III or IV coronary heart failure (CHF); stroke and carpel tunnel syndrome. |
| Interventions | 1. MK‐0677 (ibutamoren mesylate) 25 mg/day to stimulate secretion of growth hormone 2. Control: placebo All participants received vitamin D3 (400 IU/day) |
| Outcomes | 1. Number of falls |
| Duration of the study | Planned duration unclear. Terminated early (24 wks) due to adverse events (congestive heart failure) |
| Notes | No description of how falls were monitored |
Bighea 2011.
| Methods | RCT |
| Participants | Setting: Craiova, Romania
N = 80 Sample: women with osteoporosis Age: not stated Inclusion criteria: not stated Exclusion criteria: not stated |
| Interventions | 1. Home‐based exercise and balance training programme 2. Control: "just with antiosteoporotic medication and advice on fall prevention" |
| Outcomes | 1. Number of people falling Other outcomes not included in this review |
| Duration of the study | 10 months |
| Notes | Assume these 3 abstracts are interim reports of the same trial, possibly still ongoing. No full report identified and unable to contact authors. |
Clemson 2012.
| Methods | RCT |
| Participants | Setting: metropolitan Sydney, Australia
N = 317 Sample: invited from Veteran's Affairs databases and 3 GP databases Age (years): 83.4 Inclusion criteria: community‐dwelling people; aged ≥ 70; history of ≥ 2 falls or 1 injurious fall in past 12 months Exclusion criteria: moderate‐severe cognitive impairment; unable to walk independently; neurological condition severely influencing gait and mobility; resident in a nursing home or hostel; any unstable or terminal medical illness precluding planned exercises; no conversational English |
| Interventions | 1. LiFE (Lifestyle approach to reducing Falls through Exercise) programme (progressive balance and strength training embedded in daily life activities)
2. Structured programme: balance and lower limb strength exercises using ankle cuff weights, performed 3 times a week
3. Control: gentle/sham exercise All interventions taught at home: the 'LiFE' and 'Structured' programmes over 5 sessions with 2 booster visits and 2 phone calls; the control sham/gentle exercise group received 3 home visits and 6 phone calls |
| Outcomes | 1. Rate of falls 2. Number of people falling Other outcomes not included in this review. |
| Duration of the study | 1 year |
| Notes |
Freiberger 2012.
| Methods | RCT |
| Participants | Setting: Erlangen, Germany N = 280 Sample: recruited from health insurance company membership database (44% female) Age (years): 76.1 (SD 4.1) Inclusion criteria: community‐dwelling adults; aged 70 to 90; fallen in the past 6 months or reported fear of falling Exclusion criteria: unable to ambulate independently; cognitive impairment (< 25 on the Digit Symbol Substitution Test (DSST)) |
| Interventions | 1. "Strength and balance group": strength and balance exercises only 2. "Fitness group": strength and balance plus endurance training 3. "Multifaceted group": strength and balance plus fall risk education 4. Control group The interventions consisted of 32 1‐hour group sessions in 16 weeks |
| Outcomes | Falls and fallers (multiple fallers) |
| Duration of the study | 3 years |
| Notes | Previously excluded as 2007 paper was reported as an RCT but control group was not randomised. Number randomised less in 2012 paper which reports 12 to 24‐month data. |
Glendenning 2012.
| Methods | RCT |
| Participants | Setting: Perth, Western Australia
N = 686 Sample: women identified from GP lists and electoral rolls Age (years): 76.7 (SD 4.0) Inclusion criteria: aged > 70; registered with a GP; likely to attend 4 study visits over 9 months Exclusion criteria: taking vitamin D supplements; cognitive impairment (MMSE < 24); "in the investigators opinion would not be suitable for the study" |
| Interventions | 1. Oral vitamin D (cholecalciferol) 150,000 IU administered every 3 months for 9 months + lifestyle advice 2. Control: placebo + lifestyle advice Lifestyle advice: physical activity (optimally 30 min per day outside) and consuming 1300 mg calcium/d using diet and/or supplements |
| Outcomes | 1. Number of people falling Other outcomes not included in this review |
| Duration of the study | 9 months |
| Notes |
Neelemaat 2012.
| Methods | RCT |
| Participants | Setting: Amsterdam, The Netherlands
N = 210 Sample: malnourished older adults newly admitted to an acute hospital (general internal medicine, rheumatology, gastroenterology, dermatology, nephrology, orthopedics, traumatology, or vascular surgery) Age (years): 74.5 (SD 9.5) Inclusion criteria: aged ≥ 60; expected length of hospital stay > 2 days); malnourished (BMI ≤ 20.0 kg/m2, 5% or more self reported unintentional weight loss in the previous month, or 10% or more self reported unintentional weight loss in the previous 6 months) Exclusion criteria: dementia |
| Interventions | 1. Nutritional intervention (energy‐ and protein‐enriched diet, oral nutritional supplements, calcium‐vitamin D supplement, telephone counselling by a dietitian 2. Control: usual care |
| Outcomes | Falls monitored for 3 months after discharge |
| Duration of the study | 3 months post discharge |
| Notes | Not all community‐dwelling, but 88% were prior to admission |
Pérula 2012.
| Methods | RCT (cluster‐randomised) |
| Participants | Setting: 11 health centres in Córdoba, Spain N = 404 Sample: recruited consecutively when attending health centre Age (years): mean 76 (SD 4.2) Inclusion criteria: aged ≥ 70; community‐dwelling; able to walk independently; consenting Exclusion criteria: institutionalised; immobilised, or bedridden; terminally ill or severe psychiatric illness and have contraindications to physical exercise |
| Interventions | 1. Multifactorial intervention (individual advice, information leaflet, physical exercise classes for 3 weeks then home exercise, home visits) 2. Control: brief individual advice and information leaflet |
| Outcomes | 1. Rate of falls 2. Time to first fall 3. Number of people falling |
| Duration of the study | 12 months |
| Notes |
Sach 2012.
| Methods | Cost‐effectiveness and cost‐utility analysis alongside an included RCT (Logan 2010) |
| Participants | Setting: community, UK N = 204 (157 participants (82 interventions and 75 controls) used to perform the economic evaluation) Inclusion criteria: people > 60 years of age; living at home or in residential care; history of a fall and having called an emergency ambulance but were not taken to hospital |
| Interventions | 1. Referral to community fall prevention services 2. Control: usual health and social care |
| Outcomes | Incremental cost per fall prevented and incremental cost per QALY |
| Duration of the study | 1 year |
| Notes | Not added to Logan 2010 as identified too late for economic data to be included in review |
Taylor 2012.
| Methods | RCT |
| Participants | Setting: 11 sites throughout New Zealand N = 684 Sample: recruited through newspaper advertisements, local radio and television, posters and flyers in local community centres, doctors’ and physiotherapists’ offices, libraries, and churches (73% women) Age (years): mean 74.5 Inclusion criteria: community‐dwelling; aged ≥ 65 (≥ 55 if Maori or Pacific Islander); history of ≥ 1 fall in previous 12 mo or considered to be at risk of falling based on Falls Risk Assessment Tool (FRAT) score ≥ 1; medical clearance for low or moderate exercise programme Exclusion criteria: unable to ambulate independently (with or without walking aid); chronic medical condition limiting low‐ to moderate‐intensity exercising; cognitive impairment (telephone MMSE < 23); participated in Tai Chi within the last year; currently participating in an organised exercise programme aimed at improving strength and balance |
| Interventions | 1. Tai Chi (modified 10‐form Sun style): hour long class 1 x per week for 20 weeks 2. Tai Chi (modified 10‐form Sun style): hour long class 2 x per week for 20 weeks 3. Control: low‐level exercise class (mainly seated and not targeting strength and balance) 1 x per week for 20 weeks |
| Outcomes | 1. Rate of falls |
| Duration of the study | 17 months |
| Notes |
BMD: bone mineral density BMI: body mass index GP: general practitioner (family physician) MMSE: Mini Mental State Examination NYHA: New York Heart Association RCT: randomised controlled trial
Characteristics of ongoing studies [ordered by study ID]
ACTRN012606000023550.
| Study name | Healthy Steps: A trial of pedometer‐based Green Prescription to improve physical activity, health‐related quality of life, and health and physical functioning in low‐active older adults |
| Methods | RCT |
| Participants | Target sample size: 350 Inclusion criteria: aged ≥ 65; < 50 min of moderate physical activity over at least 5 days in a week; living in Auckland for next 12 months; sufficient understanding of English to permit physician and telephone counselling. Exclusion criteria: walking contraindicated due to health problem; visually impaired, i.e. unable to read step counts on a pedometer |
| Interventions | Intervention: pedometer‐based New Zealand Green Prescription (primary care physician counselling and telephone counselling using motivational interviewing and cognitive behavioural techniques incorporating step‐based physical activity goals for 3 months) Control intervention: conventional time‐based Green Prescription (as above, but incorporating conventional time‐based physical activity goals for 3 months) |
| Outcomes | Falls and injuries are secondary outcomes Cost‐effectiveness analysis |
| Starting date | 1 March 2006 |
| Contact information | Prof G Kolt School of Biomedical and Health Sciences University of Western Sydney Locked Bag 1797, Penrith South DC NSW 1797 Email: g.kolt@uws.edu.au |
| Notes |
ACTRN12607000017426.
| Study name | Individual nutrition therapy and exercise regime: A controlled trial of injured, vulnerable elderly (INTERACTIVE trial) |
| Methods | RCT |
| Participants | N = 460 Inclusion criteria: community‐dwelling, aged > 70, in hospital after a proximal femoral fracture, MMSE ≥ 18/30, body mass index between 18.5 kg/m2 and 35 kg/m2 Exclusion criteria: pathological fracture, unable to give consent, medically unstable 14 days after surgery |
| Interventions | 1. Intervention: 6‐month individualised exercise and nutrition programme commencing within 14 days post‐surgery. Weekly home visits. 2. Attention control. Weekly social visits. |
| Outcomes | Falls monitored at weekly visit for 6 months. 12‐month follow‐up in the community |
| Starting date | June 2007 to September 2009 |
| Contact information | Dr MD Miller Department of Nutrition and Dietetics Flinders University Adelaide South Australia Australia Email: michelle.miller@flinders.edu.au |
| Notes |
ACTRN12607000018415.
| Study name | An evaluation of the Accident Compensation Corporation (ACC) Tai Chi programme in older adults: does it reduce falls |
| Methods | RCT. Central randomisation using specialist computer program (see: http://www.randomization.com/), stratified by site and blocked to ensure balanced numbers over the 3 interventions. |
| Participants | Target sample size: 684 Inclusion criteria: men and women; over 65 years (55 years if Maori or Pacific Islander); history of at least 1 fall in the previous 12 months or have a falls risk factor according to the Falls Risk Assessment Tool (FRAT) Exclusion criteria: unable to walk independently (with or without walking aid), chronic medical condition that would limit participation in low‐moderate exercise, severe cognitive limitations (telephone Mini Mental State Examination score < 20), currently participating in an organised exercise programme of equivalent intensity as the study intervention |
| Interventions | All training sessions are of 1 hour duration for a 20‐week period 1. Intervention: Tai Chi training 1 x week 2. Intervention: Tai Chi training 2 x week 3. Control: flexibility training 1 x week |
| Outcomes | Falls at 20 wks, 6 months and 12 months |
| Starting date | 30 August 2006 (closed; follow‐up continuing) |
| Contact information | Dr Denise Taylor
Physical Rehabilitation Research Centre
School of Physiotherapy
Auckland University of Technology (AUT)
Akoranga Campus
Northcote
Auckland Telephone: +64 9 9219680 Email: denise.taylor@aut.ac.nz |
| Notes |
ACTRN12607000206426.
| Study name | Community Care and Hospital Based collaborative Falls Prevention Project |
| Methods | RCT |
| Participants | Target sample size: 200 Inclusion criteria: male or female, aged ≥ 65, presenting to A&E or falls clinic, community‐dwelling in Perth north Exclusion criteria: functional cognitive impairment, unable to speak or read English |
| Interventions | 1. Intervention: community follow‐up by support worker (8 hours over 2 to 3 wks) to review risk factors in the home, strategies to reduce risk factors, assistance to implement Falls Action Plan provided by A&E or clinic (see ANZCTR website for further details). 2. Control: no community follow‐up after discharge |
| Outcomes | Number of falls (falls calendar) |
| Starting date | April 2007 |
| Contact information | J Johnson Perth Home Care Services 30 Hasler Road PO Box 1597 Osborne Park Western Australia 6017 Australia |
| Notes | Emailed author 3 August 2011 as still listed as "Not yet recruiting". Email bounced. |
ACTRN12607000563460.
| Study name | Minimising disability and falls in older people through a post‐hospital individualised exercise programme |
| Methods | RCT |
| Participants | N = 340 Sample: people recently discharged from hospital Inclusion criteria: aged > 60 Exclusion criteria: medically unfit for exercise; progressive neurological condition; cognitive impairment; nursing home resident |
| Interventions | 1. Home‐based exercise programme: based on the Weight‐bearing Exercise for Better Balance programme, 10 1‐hour visits from a physiotherapist over 12 months. Individually prescribed exercises targeting postural control (balance) and lower limb muscle strength (30 min 6 times a week for 12 months). 2. Control: usual care |
| Outcomes | 1. Rate of falls |
| Starting date | 2007 |
| Contact information | C Sherrington The George Institute for Global Health PO Box M201 Missenden Road NSW 2050 Australia |
| Notes | Data analysis in progress |
ACTRN12610000576022.
| Study name | Frails' Fall Efficacy by Comparing Treatments (EFFECT) |
| Methods | RCT |
| Participants | N = 80 Sample: people recruited via SGH geriatric medicine department, SGH Lifestyle Improvement Fitness Enhancement Centre Osteoporosis and Bone Metabolism unit, SGH Physiotherapy Falls Clinic and public volunteers Inclusion criteria: aged 60 to 85; community‐dwelling; ambulating independently; with fear of falling; able to commit to 12‐week intervention; moderately frail (SPPB score 5 to 9): speak or understand English, Mandarin, or local dialects Exclusion criteria: cognitively impaired; untreated medical conditions; life expectancy < 1 year; unstable cerebral haemorrhage, pulmonary embolism, deep vein thrombosis or surgery in the past 3 months; a healing fracture |
| Interventions | 1. Intervention: Nintendo Wii Active (small group with PT supervision): 1 hr, 1 x per wk for 12 wks (10 min stretching, 20 min WiiActive game play including resistance band training, balance and co‐ordination training, calisthenics, and cardiovascular training, 15 min home exercise education, 15 min participant‐specific management) + home exercises 0.5 to 1 h 2 x per wk for 24 wks (progressive resistance training with exercise bands) + home safety handout and advice 2. Control: traditional exercise group: as above but 20 min cardiovascular training instead of WiiActive game + home exercises as above + home safety handout and advice as above |
| Outcomes | 1. Number of falls 2. Economic analysis Other outcomes not included in this review |
| Starting date | June 2010 |
| Contact information | BC Kwok Block 3 Level 1 Dept of Physiotherapy Singapore General Hospital Outram Road Singapore 169608 Email: kwok.boon.chong@sgh.com.sg |
| Notes | Falls efficacy the primary outcome. Falls not mentioned in trial registration form. Kwok 2011 states falls monitored but no description of how they will be analysed. |
ACTRN12610000805077.
| Study name | RESTORE: Recovery exercises and Stepping On after fracture |
| Methods | RCT |
| Participants | Target sample size: 350 Inclusion criteria: people with a fall‐related lower limb or pelvic fracture who have completed active physiotherapy and/or rehabilitation and who are living at home or in a hostel Exclusion criteria: residing in nursing home; Mini Mental State Examination (MMSE) < 24; insufficient English language skills; inability to walk 10 metres despite assistance from another person or walking aid; progressive neurological disease; a medical condition precluding exercise |
| Interventions | 1. Home visits from a physiotherapist to prescribe an individualised exercise programme and use motivational interviewing and goal setting to encourage behaviour change with regard to exercise, also offered the Stepping On programme as implemented by the NSW Department of Health: weekly 2‐hour group discussion sessions for 7 weeks plus an additional booster session at 3 months 2. Usual care control |
| Outcomes | 12‐month follow‐up. Rate of falls and the proportion of fallers in intervention and control groups |
| Starting date | 2010 |
| Contact information | C Sherrington The George Institute for Global Health PO Box M201 Missenden Rd NSW 2050 Australia |
| Notes |
ACTRN12610000838011.
| Study name | CONFABS study (Concord Falls and Bone Service) |
| Methods | RCT |
| Participants | N = 400 Sample: men and women Inclusion criteria: aged ≥ 65; ≥ 1 fall in preceding 12 months; community‐dwelling (house, flat, retirement village, hostel); independently mobile with or without walking aids; resident in the study area for the following 12 months Exclusion criteria: cognitive impairment MMSE < 20/30; terminal illness with life expectancy less than 12 months; Parkinson's disease or other neurodegenerative conditions; unable to understand English; had comprehensive Geriatric Assessment in the preceding 12 m; has not attended a General Practitioner in the preceding 12 months; no usual General Practitioner |
| Interventions | Testing a service model for delivery of a fall prevention programme 1. Specialist Falls and Bone service ‐ co‐ordinated targeted multifactorial falls prevention interventions and adequate assessment and treatment of osteoporosis. Initial nurse assessment, geriatrician assessment at wk 2, wk 6, 4 months, 12 months. Treatment of osteoporosis (calcium and vitamin D), fall prevention co‐ordinated and arranged by the geriatrician (community‐based physiotherapists, occupational therapists, and podiatrists) etc. 2. General Practice (GP) co‐ordinated use of targeted multifactorial falls prevention interventions. Enhanced GP service model with falls risk assessment and generic advice provided by the research team for co‐ordination by the GP. The GP is the usual practitioner caring for the participant. There will be no specific GP education, but there exists ongoing education sessions given by the Principal Investigator to the local GP network as part of continuing medical education. |
| Outcomes | 1. Rate of falls
2. Number of fallers 3. Number of injurious falls |
| Starting date | 13 September 2010 |
| Contact information | Dr Nichola Boyle Centre for Education and Research on Ageing Building 18, Concord Hospital Hospital Road Concord, NSW 2139, Australia Telephone: +61 2 9767 8356 Email: nichola.boyle@sydney.edu.au |
| Notes |
Ferrer 2010.
| Study name | The OCTABAIX study |
| Methods | RCT |
| Participants | N = 328 Aged ≥ 85 Inclusion criteria: community‐dwelling |
| Interventions | 1. Multifactorial intervention. 3 home visits annually from trained nurse or physician. "Two face‐to‐face interventions will be carried out". Telephone calls to promote adherence. Control: routine primary care |
| Outcomes | Falls and malnutrition |
| Starting date | Not stated |
| Contact information | A Ferrer Centro de Atencion Primaria El Pla Sant Feliu de Llobregat Barcelona Spain Emaik: aferrer.cp.ics@gencat.cat |
| Notes |
ISRCTN10538608.
| Study name | SAFER (Support and Assessment for Fall Emergency Referrals) Trial |
| Methods | RCT (cluster‐randomised) |
| Participants | Setting: 3 ambulance services in England and Wales, United Kingdom N = 72 paramedics Sample: paramedics and their patients meeting the following inclusion criteria Inclusion criteria: (patients) aged ≥ 65 years; living in study area but not in residential care, have called emergency services as a result of a fall Exclusion criteria: none |
| Interventions | Intervention testing service delivery 1. Paramedic training in use of hand‐held computerised clinical decision support (CCDS) to help decide who needs hospital attendance, and who can be safely left at home with referral to community falls services 2. Control: usual emergency ambulance service care at each study site, i.e. a paper‐based decision support system in the form of a structured questionnaire |
| Outcomes | 1. Time to first fall (identified by ED attendance or call for emergency services) 2. Number of falls (self reported) |
| Starting date | 1 August 2006 (completed) |
| Contact information | Prof H Snooks School of Medicine, Swansea University Singleton Park Swansea SA2 8PP United Kingdom Email H.A.Snooks@swansea.ac.uk |
| Notes |
ISRCTN11861569.
| Study name | ISRCTN11861569 |
| Methods | RCT |
| Participants | Setting: Quebec, Canada
N = 152
Sample: admitted to a geriatric day hospital programme Age (years): mean (SD) Inclusion criteria: aged > 65 yrs; high risk of falling (Berg balance scale score ≤ 49/56 and at least 1 accidental fall in the previous 6 months); multiple disabilities; not cognitively impaired (> 65 at the 3MS test) Exclusion criteria: unfit for physical activities following a medical assessment; presenting a mental or physical condition incompatible with physical activities |
| Interventions | 1. Intervention: Tai Chi: 1 hour, 2 x per day for 15 wks in groups of 4 to 6 subjects 2. Control: conventional physiotherapy balance training for 1 hour, 2 x per day for 15 wks |
| Outcomes | 1. Falls per person year 2. Time to first fall 3. Cost‐effectiveness |
| Starting date | 1 October 2002 to 30 June 2007 (Completed) |
| Contact information | Dr Michel Tousignant Centre de recherche sur le vieillissement I.U.G.S. ‐ Pavillon D'Youville 1036, rue Belvédère Sud Sherbrooke J1H 4C4 Canada Email: Michel.Tousignant@USherbrooke.ca |
| Notes | One paper published but this doesn't contain falls results or planned economic evaluation. Additional paper submitted for publication 2011, but not yet accepted. |
ISRCTN43453770.
| Study name | Promoting physical activity in people aged 65+ (ProAct65+) |
| Methods | RCT (cluster‐randomised, multicentre) |
| Participants | Target sample size: 1200 Inclusion criteria: aged 65+; able to ambulate independently indoors and outdoors (with or without a walking aid); able to take part in a group exercise class; living independently (i.e. not in residential or nursing care); not receiving long‐term physiotherapy Exclusion criteria: ≥ 3 falls in the previous year; resting BP > 180/100 mmHg, tachycardia > 100 bpm, uncontrolled hypertension, significant drop in BP during exercise recorded in the medical records or found at initial assessment; psychiatric conditions which would prevent participation in an exercise class; medical problems which the GP considers a contraindication to exercising, e.g. acute systemic illness, poorly controlled angina; conditions requiring a specialist exercise programme, e.g. uncontrolled epilepsy, significant neurological disease or impairment; significant cognitive impairment |
| Interventions | 24 wk intervention Arm 1: home‐based exercise programme (OEP) (N = 400) Progressive leg muscle strengthening and balance retraining exercises at home (30 min, ≥ 3 times per week), advised to walk ≥ 2 times per week for ≥ 30 min at a moderate pace, for 24 weeks. Trained peer mentors will contact and visit the patients at their home at start. 3 more home visits/exercise sessions as required. Arm 2: community‐based exercise programme (FaME) (N = 400) Hour long PSI‐delivered group exercise class in a local community centre for a maximum of 15 participants, and 2 30‐minute home exercise sessions (based on the OEP) per week, for 24 weeks. Participants will also be advised to walk at least twice per week for up to 30 min at a moderate pace. Arm 3: 'treatment as usual' group (n = 400) 24‐month follow‐up |
| Outcomes | 1. Rate of falls 2. Number of people falling Other outcomes not included in this review |
| Starting date | Anticipated 1 June 2008 to 31 May 2013 |
| Contact information | Prof S Iliffe Department of Primary Care & Population Health University College London Rowland Hill Street London NW3 2PF United Kingdom |
| Notes |
ISRCTN48015966.
| Study name | The Chaos Clinic for prevention of falls and related injuries: a randomised, controlled trial |
| Methods | Pragmatic randomised controlled trial |
| Participants | Target sample size: 3200 Inclusion criteria: home‐dwelling; aged ≥ 70; high risk for falling and fall‐induced injuries and fractures |
| Interventions | 1. Intervention: baseline assessment and general injury prevention brochure plus individual preventive measures by Chaos Clinic staff based on baseline assessment: physical activity prescription, nutritional advice, individually tailored or group exercises, treatment of conditions, medication review, alcohol reduction, smoking cessation, hip protectors, osteoporosis treatment, home hazard assessment and modification 2. Control: baseline assessment and general injury prevention brochure alone |
| Outcomes | Falls and fall‐related injuries, especially fractures Measured by phone calls at 3 and 9 months, and on follow‐up visits at 6 and 12 months from the beginning |
| Starting date | January 2005 (completed) |
| Contact information | Dr M Palvanen The Urho Kaleva Kekkonen (UKK) Institute for Health Promotion Research PO Box 30 Tampere FIN‐33501 Finland |
| Notes |
ISRCTN57066881.
| Study name | The Home‐Based Older People's Exercise (HOPE) trial |
| Methods | RCT (pilot study) |
| Participants | Setting: Bradford, United Kingdom Target sample size: 100 Sample: frail older people identified through case management service for community‐dwelling, via GP registers (housebound), day care centres, respite care, on discharge from intermediate care hospitals, elderly medicine outpatient departments Inclusion criteria: long‐term chronic illness; housebound; no age limits Exclusion criteria: unable to stand or walk independently; participating in an exercise programme; registered blind; poorly controlled angina; severe dementia; receiving palliative care |
| Interventions | 1. The HOPE programme: 12 wk progressive exercise intervention to improve strength, mobility, balance, or aerobic capacity (5 repetitions progressing to 10 and 15, 3 x per day, 5 days per wk). Training manual + weekly support from community PT. 2. Control: usual care |
| Outcomes | Falls a secondary outcome in trial registration form but not in paper, which just states that falls will be recorded. Not clear whether as an outcome or adverse events. Primary outcomes not included in this review. |
| Starting date | 15 July 2010 |
| Contact information | Dr AP Clegg Institute for Health Research Duckworth Lane Bradford BD9 6RJ United Kingdom |
| Notes |
ISRCTN60481756.
| Study name | SAFER 2: Support and Assessment for Fall Emergency Referrals |
| Methods | Cluster‐randomised trial |
| Participants | Setting: ambulance stations in 3 participating ambulance services (London, Wales, and East Midlands)
Sample: men and women making a 999 call for emergency services after a fall Target sample size: 6548 Inclusion criteria: aged ≥ 65 Exclusion criteria: not living within study area |
| Interventions | 7‐month intervention Intervention: emergency ambulance paramedics in randomised stations implement a protocol for older people who have fallen which allows them to assess and refer appropriate patients to a community‐based falls service Control: continue to provide care according to their standard practice |
| Outcomes | 1. Further emergency health care contacts (999 call or ED attendance) for fall per recruited faller and time to first contact 2. Costs of care Other outcomes not included in this review |
| Starting date | April 2009 |
| Contact information | Prof Helen Snooks Swansea University Singleton Park Swansea SA2 8PP United Kingdom Email: h.a.snooks@swansea.ac.uk |
| Notes | Estimated date of publication late 2013. Protocol available at www.hta.ac.uk/protocols/200700010021.pdf |
ISRCTN68240461.
| Study name | Randomised trial of a multifaceted podiatry intervention for fall prevention in patients over 70 years of age |
| Methods | RCT |
| Participants | Target sample size: 890 Inclusion criteria: people aged > 70 years; history of 2 falls within the past 12 months or 1 fall which required hospital attention; complete baseline or run‐in data collection instruments adequately Exclusion criteria: neuropathy; neurodegenerative disorder; dementia; unable to walk household distances (10 m); lower limb amputee; already have adapted footwear which would not allow an orthotic to be fitted; unable to read or speak English |
| Interventions | 1. Multifaceted podiatry intervention consisting of footwear assessment and advice and financial assistance in purchasing more appropriate footwear if required; routine podiatry care; foot orthoses; home‐based foot and ankle exercises; falls prevention leaflet based on National Institute for Health and Clinical Excellence (NICE) guidance 2. Control: falls prevention leaflet based on NICE guidance |
| Outcomes | 1. Rate of falls 2. Number of people falling Other outcomes not included in this review. |
| Starting date | 1 October 2011 |
| Contact information | David Torgerson University of York, Department of Health Sciences York Trials Unit, ARRC Building Heslington YO10 5 DD York, UK Email: david.torgerson@york.ac.uk |
| Notes |
ISRCTN71002650.
| Study name | Pre‐FIT: Prevention of Fall Injuries Trial |
| Methods | A 3‐arm, cluster‐randomised controlled trial with economic evaluation |
| Participants | Target sample size: 9000 Inclusion criteria: people aged over 70 years living in the community, including people in sheltered accommodation Exclusion criteria: living in nursing or residential care homes |
| Interventions | 1. Advice: based on best practice guidelines and evidence for positive framing of information, e.g. improving mobility 2. Exercise: based on the Otago Exercise Programme and delivered over at least 12 wks either on a group basis or at home 3. Multi‐Factorial Fall Prevention: based on the Tinetti programme and updated in a consensus building exercise |
| Outcomes | Primary outcome is peripheral fracture, expressed as number of people with any peripheral fracture, and peripheral fracture rate per person years of observation Secondary outcomes include health‐related quality of life, fall rate per person years, time to first fracture, resource use, and mortality |
| Starting date | 1 April 2011 |
| Contact information | Pre‐FIT Trial Co‐ordinator Warwick Clinical Trials Unit Warwick University Coventry CV4 7AL Tel: +33 24 765 74656 Email: prefit@warwick.ac.uk |
| Notes |
NCT00413933.
| Study name | Comprehensive interventions for falls prevention in the elderly |
| Methods | RCT |
| Participants | Target sample size: 200 Inclusion criteria: aged ≥ 65; ≥ 1 falls in past 12 months; belonging to Clalit HMO; mobile outdoors without wheelchair.Exclusion criteria: seriously ill, e.g. dyspnoea with light exercise, unstable heart disease; MMSE < 18 |
| Interventions | 1. Intervention: multidisciplinary assessment by geriatrician, physiotherapist, and OT (home hazard assessment) plus at least 1 of the following: recommend medication adjustment or referral to optometrist or ophthalmologist to family physician; exercise sessions with physiotherapist; OT advice to change unsafe home hazards 2. Control: usual care |
| Outcomes | Primary outcome: fall rates (falls self reported by phone) Secondary outcomes: safety, cost of healthcare utilisation and rate of hospitalisation |
| Starting date | January 2008 |
| Contact information | Dr Yan Press Ben‐Gurion University of the Negev, Israel Email: yanp@zahav.net.il |
| Notes |
NCT00483275.
| Study name | Fall prevention by alfacalcidol and training |
| Methods | RCT |
| Participants | Target sample size: 484 men and women Inclusion criteria: aged ≥ 65; ≥ 1 fall in past year or earlier if increased fall risk; creatinine clearance 30 to 60 ml/min (i.e. moderately impaired kidney function); community‐dwelling Exclusion criteria: hypercalcaemia, taking vitamin D; dementia; fracture or stroke in preceding 3 months etc (see ClinicalTrials.gov for details) |
| Interventions | 1. Intervention: 1 µg alfacalcidol and 500 mg calcium daily; mobility programme (strength, balance, and gait training (1 hour, 2 x per wk); patient education (single meeting with teaching lessons on risk factors for falling and modes of fall prevention followed by an evaluation of the individual fall risk and corresponding recommendations to reduce it) 2. Control: usual care |
| Outcomes | Follow‐up for 1 year. Number of fallers, number of falls, number of fractures, fear of falling, balance performance, hypercalcaemia |
| Starting date | June 2007 to September 2009 |
| Contact information | Dr J Schumacher Klinik für Altersmedizin und Frührehabilitation, Marienhospital, Ruhr‐Universität Bochum, Herne, NRW, Germany, 44627 Telephone: +49 2323 499 0 ext 5918 Email: jochen.schumacher@rub.de |
| Notes | Open label trial sponsored by Teva Pharmaceutical Industries |
NCT00934531.
| Study name | Donepezil and the risk of falls in seniors with cognitive impairment |
| Methods | RCT |
| Participants | Target sample size: 140 Source: people with mild cognitive impairment recruited from Aging Brain and Memory Clinic, Parkwood Hospital Inclusion criteria: age 65 to 100; mild cognitive impairment; BMI 18 to 30; acceptable blood pressure; about to walk 10 m independently without any gait aid; able to travel to clinic for assessments Exclusion criteria: unable to understand English; low body weight; possible Alzheimer's disease; taking herbal preparations such as St. John's Wort and Gingko biloba; history of drug or alcohol abuse/dependence; history of psychiatric illness within the last 2 years, including depression; Parkinsonism or any neurological disorder with residual motor deficit; musculoskeletal disorder affecting gait performance; active osteoarthritis affecting the lower limbs; use of psychotropic medication, an anticholinergic agent (benztropines), other acetylcholinesterase inhibitors or cholinergic agents (bethanechol); comorbidities which may contradict use of ChEIs; history of chronic bradycardia or sick sinus syndrome; severe COPD and/or asthma; history of seizure disorders |
| Interventions | 1. Intervention: 5 mg/day of donepezil (Aricept) p.o. for 4 wks, then 10 mg/day of donepezil p.o. for a period of 5 months 2. Control: matched placebo p.o. for 4 wks, then a new matched placebo p.o. for the next 5 months |
| Outcomes | Number of falls (over 6 months follow‐up) Other outcomes not included in this review |
| Starting date | September 2009 to June 2012 |
| Contact information | Dr M Montero Odasso Dept. of Medicine, Div. of Geriatric Medicine Parkwood Hospital The University of Western Ontario London, Ontario Canada |
| Notes |
NCT00946062.
| Study name | Evaluation of a standardised orientation and mobility training in older adults with low vision |
| Methods | RCT |
| Participants | N = 190 Inclusion criteria: aged ≥ 55; low vision; living independently in the community or home for older people; able to see large obstacles, able to go outside for a short walk; one of the following: experiencing difficulties with safely crossing a street or difficulties recognising acquaintances outdoors, willing to become recognisable as being partially sighted by using the identification cane Exclusion criteria: cognitive impairment (< 4 on Abbreviated Mental Test); language or hearing problems impeding telephone interview; bed ridden; possible nursing home admission; using a walking aid incompatible with the use of an identification cane; recently received an O&M‐training in the use of an identification cane and permanent use of this cane |
| Interventions | 1. Intervention: standardised orientation and mobility training (O&M‐training) in use of identification cane 2. Control group: usual care, i.e. regular O&M‐training |
| Outcomes | Number of falls (indoors and outdoors) over 6 months (described in paper, but not in trial registration) Other outcomes not included in this review |
| Starting date | November 2007 to July 2010 |
| Contact information | GAR Zijlstra Maastricht University Department of Health Care and Nursing Science Maastricht the Netherlands Email: R.Zijlstra@zw.unimaas.nl |
| Notes |
NCT00986466.
| Study name | Vitamin D and exercise in falls prevention (DEX) |
| Methods | RCT (factorial design) |
| Participants | Target sample size: 400
Inclusion criteria: women; aged 70 to 80 years; independently community‐dwelling; history of at least 1 fall in previous year; no contraindication to exercise; giving informed consent Exclusion criteria: undertaking moderate‐to‐vigorous exercise more than 2 hours per wk; regular user of vitamin D, or calcium + vitamin D supplements; recent fracture (during preceding 12 months); contraindication or inability to exercise; marked decline in the basic activities of daily living (ADL‐test); cognitively impaired (MMSE < 18); chronic conditions, e.g. Parkinson's disease |
| Interventions | 1. Exercise with vitamin D: 20 µg of vitamin D per day for 2 years supervised training (2 x per wk for 52 wks), and 1 x per wk for next 52 wks 2. Exercise with placebo: as above 3. No exercise with vitamin D: 20 µg of vitamin D per day for 2 years, no supervised training (maintenance of their current level of physical activity) 4. No exercise with placebo: placebo per day for 2 years, no supervised training (maintenance of their current level of physical activity) |
| Outcomes | 1. Rate of falls 2. Number of people falling 3. Number sustaining a fracture Other outcomes not included in this review |
| Starting date | September 2009 (completion date December 2014) |
| Contact information | Dr K Uusi‐Rasi, PhD UKK Institute for Health Promotion Research Tampere, Finland |
| Notes |
NCT01029171.
| Study name | Action Seniors! Exercise to prevent falls |
| Methods | RCT |
| Participants | Target sample size: 344 Source: people attending a Falls Prevention Clinic Service Inclusion criteria: aged > 70 years; proficient English speaker; MMSE > 24/30; history of 1 non‐syncopal fall in the last 12 months and one of the following: a) PPA score of at least 1 SD above normal; OR 2) Timed Up and Go Test (TUG) > 15 seconds; OR 3) 1 additional documented non‐syncopal fall in the previous 12 months; expected to live > 12 months; community‐dwelling; able to walk 3 m with or without an assistive device; consenting Exclusion criteria: history of neurodegenerative disease, dementia, stroke, peripheral neuropathy or severe musculoskeletal or joint disease, or history indicative of carotid sinus sensitivity |
| Interventions | 1. 12‐month home‐based balance and strength restraining programme (Otago Exercise Programme) delivered by a physical therapist 2. Control: usual care as prescribed by geriatrician |
| Outcomes | Falls over a 12‐month period |
| Starting date | November 2009 |
| Contact information | Jenna Homer Centre for Hip Health and Mobility Vancouver, BC Canada Email: mailto:jenna.homer%40hiphealth.ca?subject=NCT01029171, H04‐70171, Action Seniors! Exercise to Prevent Falls |
| Notes |
NCT01032252.
| Study name | Prevent Falls (PreFalls) |
| Methods | RCT (cluster‐randomised) |
| Participants | N = 382 Sample: community‐dwelling people registered with general practices Inclusion criteria: aged 65 and older; with at least 1 of the following: fall within last 12 mo; fear of falling; chair‐stand‐ups > 10 sec; Timed‐up‐and‐go‐Test > 10 sec; impaired balance; self reported balance deficits Exclusion criteria: not living independently; with physical or mental restrictions which don't allow exercising or participating in falls risk assessments |
| Interventions | 1. Intervention: group and home‐based exercises (progressive strength and flexibility training; challenging balance; gait and motor co‐ordination training; progressive endurance training). Fear of falling cognitive behavioural intervention (Matter of Balance programme). 60 min, 1 x per wk for 16 wks 2. Control: no intervention |
| Outcomes | Number of falls per person per year Monthly falls diary for 24 months Also assessed but not included in this review: Other risk and balance outcomes |
| Starting date | April 2009 to April 2012 |
| Contact information | Dr. med. Wolfgang Blank Institute of General Practice Klinikum rechts der Isar, Technische Universitaet Muenchen Orleanstr. 47 81667 Muenchen Germany Telephone: +49 89 614658913 Email: blank@lrz.tum.de |
| Notes |
NCT01080196.
| Study name | Reducing falls with RENEW in older adults who have fallen |
| Methods | RCT |
| Participants | Target sample size: 100 Sample: men and women between 65 and 95 years Inclusion criteria: 2 or more self reported co‐morbid conditions; history of ≥ 1 fall in last 12 mo; ambulatory; community‐dwelling; gait speed 25 m/min to 80 m/min; with permission from physician to participate in a 60‐minute (with rests) exercise programme; capable of performing RENEW on the ergometer Exclusion criteria: dementia; progressive neurologic disease or disease affecting muscle, e.g. Parkinson's, muscular dystrophy: participated in a regular (3 x per wk) aerobic or resistance exercise programme in past 12 months; any contraindication to having magnetic resonance imaging |
| Interventions | 1. High‐intensity (lower body) Resistance Exercise via Negative, Eccentrically‐induced Work (RENEW) 2. Traditional lower body resistance exercise Both "as part of a multi‐component exercise and fall‐reduction program" (not described) |
| Outcomes | 1. Incidence of falls and near falls Other outcomes not included in this review |
| Starting date | April 2008 to February 2013 |
| Contact information | Sheldon B Smith Department of Physical Therapy University of Utah Salt Lake City Utah United States Email: mailto:sheldon.smith%40hsc.utah.edu?subject=NCT01080196, 26292, Reducing Falls With RENEW in Older Adults Who Have Fallen |
| Notes | Principal Investigator: Paul C LaStayo |
NCT01358032.
| Study name | A Matter of Balance at Home (AMB‐Home) |
| Methods | RCT |
| Participants | N = 389 Sample: random sample from municipal registry offices registers Inclusion criteria: reported some concern about falls; at least some associated avoidance of activity; general health as fair or poor; community‐dwelling; aged 70 years or older; gave informed consent. Exclusion criteria: confined to bed; restricted by the permanent use of a wheelchair; waiting for a nursing home admission; substantial hearing or vision impairment; cognitively impaired. |
| Interventions | 1. In‐home multicomponent cognitive behavioural programme 2. Control |
| Outcomes | Number of falls Other outcomes not included in this review |
| Starting date | March 2009. Final results due 2012 |
| Contact information | GIJM Kempen, PhD Maastricht University CAPHRI School for Public Health and Primary Care |
| Notes |
NCT01452243.
| Study name | Prevention of Falls and Fractures in Old People by Administration of Calcium and Vitamin D. Randomized Clinical Trial (ANVITAD) |
| Methods | RCT |
| Participants | N = 704 Sample: non‐institutionalised people aged 65 years or older |
| Interventions | 1. 800 IU of vitamin D and 1000 mg of calcium will be administered daily 2. Placebo |
| Outcomes | Number of falls Adverse events Other outcomes not included in this review |
| Starting date | November 2008 to April 2012 |
| Contact information | Research Unit Primary Care Head Office of Albacete Albacete, Spain, 02001 |
| Notes |
NTR1593.
| Study name | IMPROveFALL |
| Methods | RCT (multicentre) |
| Participants | N = 620 Sample: people aged ≥ 65 years who visit the Emergency Department due to a fall Inclusion criteria: history of a fall; using at least 1 fall‐risk increasing drug; community‐dwelling; aged ≥ 65 years; independently ambulant; informed consent Exclusion criteria: cognitively impaired (MMSE < 21 points) |
| Interventions | 1. Structured medication assessment including withdrawal of fall‐risk increasing drugs 2. Usual care All patients receive a full geriatric assessment at the research outpatient clinic |
| Outcomes | Number of falls Economic evaluation |
| Starting date | October 2008. Planned closing date October 2011 |
| Contact information | Dr TJM Van der Cammen Department of Internal Medicine ‐ Section Geriatric Medicine Erasmus Medical Centre P.O. Box 2040 3000 CA Rotterdam The Netherlands Email: t.vandercammen@erasmusmc.nl |
| Notes |
3MS: modified mini‐mental state examination (cognitive assessment) A&E: accident and emergency department ADL: activities of daily living ANZCTR: Australian New Zealand Clinical Trials Registry BMI: body mass index BP: blood pressure bpm: beats per minute ChEI: cholinesterase inhibitors COPD: chronic obstructive pulmonary disease ED: emergency department GP: general practitioner IADL: instrumental activities of daily living, e.g. use of telephone, shopping, housework, managing finances MMSE: mini‐mental state examination (cognitive assessment) O&M: orientation and mobility OT: occupational therapy p.o.: orally PPA: Physiological Profile Assessment RCT: randomised controlled trial SPPB: Short Physical Performance Battery
Differences between protocol and review
Criteria for considering studies for this review
Trials including only participants with Parkinson's disease or post stroke have been excluded from this version of the review. In Gillespie 2009, data from these studies were not pooled with studies recruiting more representative samples of older people as it was thought that interventions specifically targeting people with neurological conditions such as Parkinson's disease or post stroke were not generalisable to older people as a whole. A protocol for a Cochrane review on fall prevention interventions post stroke has been published (Verheyden 2010).
'Risk of bias' assessment
The protocol was completed and submitted for publication prior to the general release of Review Manager Version 5 and the supporting version of the Cochrane Handbook for Systematic Reviews of Interventions (Version 5.0) in February 2008. In the protocol we stated that we would assess methodological quality using the 11‐item tool used in Gillespie 2003. Rather than use that tool, in Gillespie 2009 we made a post hoc decision to convert a number of these items for use in the new Cochrane Collaboration tool for assessing risk of bias (Higgins 2011a). For this update we have used two additional 'Risk of bias' items: 'Random sequence generation' and 'Incomplete outcome data'.
Subgroup analysis
We carried out a post hoc subgroup analysis based on whether home safety interventions were carried out by an occupational therapist (OT), or by other personnel. We did this because Pighills 2011 randomised participants to two intervention groups to explore the effect of using differently trained personnel to deliver the intervention.
Contributions of authors
LD Gillespie, the guarantor for this review, conceived, designed, and co‐ordinated the review, developed the search strategy and carried out the searches, screened search results and obtained papers, screened retrieved papers against inclusion criteria, carried out 'Risk of bias' assessment and data extraction, entered data into RevMan, and wrote the review.
MC Robertson contributed to the 'Risk of bias' assessment, extracted data from papers, managed data and carried out statistical calculations, wrote the economic evaluation section and Appendix 11, and wrote the review. In addition she provided additional data about papers, and a methodological perspective for measurement of outcomes and statistical analyses used in the papers and the economic evaluations.
WJ Gillespie conceived and designed the review, screened retrieved papers against inclusion criteria, carried out 'Risk of bias' assessment and data extraction, entered data into RevMan, and commented on drafts of the review.
C Sherrington carried out 'Risk of bias' assessment and data extraction, and commented on drafts of the review.
S Gates carried out 'Risk of bias' assessment and data extraction, and commented on drafts of the review.
LM Clemson carried out 'Risk of bias' assessment and data extraction, and commented on drafts of the review.
SE Lamb conceived and led the design of the ProFaNE taxonomy that provided the framework for the structure of the review, carried out 'Risk of bias' assessment and data extraction, and commented on drafts of the review.
Sources of support
Internal sources
-
University of Otago, Dunedin, New Zealand
Computing, administration, and library services (LDG, MCR)
-
University of Sydney, Australia
Salary (LC)
-
University of Warwick, Coventry, UK
Salary (SG)
External sources
-
National Health and Medical Research Council, Australia
Salary (CS, LC)
-
National Institute for Health Research, UK
Department of Health Cochrane Review Incentive Scheme
Declarations of interest
Four review authors were investigators for 10 included studies: LM Clemson (Clemson 2004; Clemson 2010), WJ Gillespie (Carter 1997), MC Robertson (Campbell 1997; Campbell 1999c; Campbell 2005; Davis 2011a; Elley 2008; Robertson 2001a) and C Sherrington (Sherrington 2004). Investigators did not carry out 'Risk of bias' assessment on their own studies. No other conflicts are declared.
Edited (no change to conclusions)
References
References to studies included in this review
Assantachai 2002 {published and unpublished data}
- Assantachai P, Chatthanawaree W, Thamlikitkul V, Praditsuwan R, Pisalsarakij D. Strategy to prevent falls in the Thai elderly: a controlled study integrated health research program for the Thai elderly. Journal of the Medical Association of Thailand 2002;85(2):215-22. [MEDLINE: ] [PubMed] [Google Scholar]
- Assantachai P. personal communication June 11 2007.
Ballard 2004 {published data only}
- Ballard JE, McFarland C, Wallace LS, Holiday DB, Roberson G. The effect of 15 weeks of exercise on balance, leg strength, and reduction in falls in 40 women aged 65 to 89 years. Journal of the American Medical Women's Association 2004;59(4):255-61. [MEDLINE: ] [PubMed] [Google Scholar]
Barnett 2003 {published data only}
- Barnett A, Smith B, Lord SR, Williams M, Baumand A. Community-based group exercise improves balance and reduces falls in at-risk older people: a randomised controlled trial. Age and Ageing 2003;32(4):407-14. [MEDLINE: ] [DOI] [PubMed] [Google Scholar]
Beling 2009 {published data only}
- Beling J, Roller M. Multifactorial intervention with balance training as a core component among fall-prone older adults. Journal of Geriatric Physical Therapy 2009;32(3):125-33. [MEDLINE: ] [DOI] [PubMed] [Google Scholar]
Beyer 2007 {published data only}
- Beyer N, Simonsen L, Bulow J, Lorenzen T, Jensen DV, Larsen L, et al. Old women with a recent fall history show improved muscle strength and function sustained for six months after finishing training. Aging-Clinical & Experimental Research 2007;19(4):300-9. [MEDLINE: ] [DOI] [PubMed] [Google Scholar]
Bischoff‐Ferrari 2006 {published data only}
- Bischoff-Ferrari HA, Orav EJ, Dawson-Hughes B. Additive benefit of higher testosterone levels and vitamin D plus calcium supplementation in regard to fall risk reduction among older men and women. Osteoporosis International 2008;19(9):1307-14. [MEDLINE: ] [DOI] [PMC free article] [PubMed] [Google Scholar]
- Bischoff-Ferrari HA, Orav EJ, Dawson-Hughes B. Effect of cholecalciferol plus calcium on falling in ambulatory older men and women: a 3-year randomized controlled trial. Archives of Internal Medicine 2006;166(4):424-30. [MEDLINE: ] [DOI] [PubMed] [Google Scholar]
- Bischoff-Ferrari HA, Orav EJ, Dawson-Hughes B. Effect of vitamin D3 plus calcium on fall risk in older men and women: a 3-year randomized controlled trial [abstract]. Journal of Bone and Mineral Research 2004;19(Suppl 1):S57. [Google Scholar]
- Dawson-Hughes B, Harris SS, Krall EA, Dallal GE. Effect of calcium and vitamin D supplementation on bone density in men and women 65 years of age or older. New England Journal of Medicine 1997;337(10):670-6. [MEDLINE: ] [DOI] [PubMed] [Google Scholar]
Bischoff‐Ferrari 2010 {published data only}
- Bischoff-Ferrari HA, Dawson-Hughes B, Platz A, Orav EJ, Stahelin HB, Willett WC, et al. Effect of high-dosage cholecalciferol and extended physiotherapy on complications after hip fracture: a randomized controlled trial. Archives of Internal Medicine 2010;170(9):813-20. [MEDLINE: ] [DOI] [PubMed] [Google Scholar]
- NCT00133640. Early rehabilitation after hip fracture. clinicaltrials.gov/show/NCT00133640 (accessed 31 August 2011).
Blalock 2010 {published data only}
- Blalock SJ, Casteel C, Roth MT, Ferreri S, Demby KB, Shankar V. Impact of enhanced pharmacologic care on the prevention of falls: A randomized controlled trial. American Journal of Geriatric Pharmacotherapy 2010;8(5):428-40. [MEDLINE: ] [DOI] [PubMed] [Google Scholar]
- Casteel C, Blalock SJ, Ferreri S, Roth MT, Demby KB. Implementation of a community pharmacy-based falls prevention program. American Journal of Geriatric Pharmacotherapy 2011;9(5):310-9. [DOI] [PubMed] [Google Scholar]
- Ferreri S, Roth MT, Casteel C, Demby KB, Blalock SJ. Methodology of an ongoing, randomized controlled trial to prevent falls through enhanced pharmaceutical care. American Journal of Geriatric Pharmacotherapy 2008;6(2):61-81. [MEDLINE: ] [DOI] [PubMed] [Google Scholar]
- NCT00618800. Preventing falls through enhanced pharmaceutical care. clinicaltrials.gov/show/NCT00618800 (accessed 23 February 2011).
Brown 2002 {published data only}
- Brown AI. Functional Adaptation to Exercise in Elderly Subjects [thesis] http://adt.curtin.edu.au/theses/available/adt-WCU20030423.094914. Perth (Australia): Curtin Univ. of Technology, 2002 (accessed 30 November 2011). [Google Scholar]
- Brown AP. Reducing falls in elderly people: a review of exercise interventions. Physiotherapy Theory and Practice 1999;15(2):59-68. [EMBASE: 1999232158] [Google Scholar]
- Piotrowski A, Cole J, Allison G. The influence of functional ability and physical and social intervention on falls in elderly subjects [abstract]. XVIth Congress of the International Association of Gerontology; 1997;Aug 19-23; Adelaide, Australia.
Buchner 1997a {published data only}
- Buchner DM, Cress ME, Lateur BJ, Esselman PC, Margherita AJ, Price R, et al. The effect of strength and endurance training on gait, balance, fall risk, and health services use in community-living older adults. Journals of Gerontology. Series A, Biological Sciences and Medical Sciences 1997;52(4):M218-24. [MEDLINE: ] [DOI] [PubMed] [Google Scholar]
- Buchner DM, Cress ME, Wagner EH, Lateur BJ, Price R, Abrass IB. The Seattle FICSIT/MoveIt study: the effect of exercise on gait and balance in older adults. Journal of the American Geriatrics Society 1993;41:321-5. [MEDLINE: ] [DOI] [PubMed] [Google Scholar]
- Buchner DM, Cress ME, Wagner EH, Lateur BJ. The role of exercise in fall prevention: Developing targeting criteria for exercise programs. In: Vellas B, Toupet M, Rubenstein L, Albarede JL, Christen Y, editors(s). Falls, balance and gait disorders in the elderly. Amsterdam: Elsevier, 1992:55-68. [Google Scholar]
Bunout 2005 {published and unpublished data}
- Bunout D, Barrera G, Avendano M, la Maza P, Gattas V, Leiva L, et al. Results of a community-based weight-bearing resistance training programme for healthy Chilean elderly subjects. Age and Ageing 2005;34(1):80-3. [MEDLINE: ] [DOI] [PubMed] [Google Scholar]
- Bunout D. personal communication Feb 1 2005.
Campbell 1997 {published and unpublished data}
- Campbell AJ, Robertson MC, Gardner MM, Norton RN, Buchner DM. Falls prevention over 2 years: a randomized controlled trial in women 80 years and older. Age and Ageing 1999;28:513-8. [MEDLINE: ] [DOI] [PubMed] [Google Scholar]
- Campbell AJ, Robertson MC, Gardner MM, Norton RN, Tilyard MW, Buchner DM. Randomised controlled trial of a general practice programme of home based exercise to prevent falls in elderly women. BMJ 1997;315:1065-9. [MEDLINE: ] [DOI] [PMC free article] [PubMed] [Google Scholar]
- Gardner M. Home-based exercises to prevent falls in elderly women. New Zealand Journal of Physiotherapy 1998;26(3):6. [CINAHL: 1999044632] [Google Scholar]
- Gardner MM, Buchner DM, Robertson MC, Campbell AJ. Practical implementation of an exercise-based falls prevention programme. Age and Ageing 2001;30(1):77-83. [MEDLINE: ] [DOI] [PubMed] [Google Scholar]
- Robertson MC, Campbell AJ, Gardner MM, Devlin N. Preventing injuries in older people by preventing falls: a meta-analysis of individual-level data. Journal of the American Geriatrics Society 2002;50:905-11. [MEDLINE: ] [DOI] [PubMed] [Google Scholar]
- Robertson MC, Devlin N, Scuffham P, Gardner MM, Buchner DM, Campbell AJ. Economic evaluation of a community based exercise programme to prevent falls. Journal of Epidemiology and Community Health 2001;55(8):600-6. [MEDLINE: ] [DOI] [PMC free article] [PubMed] [Google Scholar]
- Robertson MC. Development of a falls prevention programme for elderly people: evaluation of efficacy, effectiveness, and efficiency [thesis]. Dunedin (NZ): Univ. of Otago, 2001. [Google Scholar]
Campbell 1999 {published and unpublished data}
- Campbell AJ, Robertson MC, Gardner MM, Norton RN, Buchner DM. Psychotropic medication withdrawal and a home-based exercise program to prevent falls: a randomized, controlled trial. Journal of the American Geriatrics Society 1999;47(7):850-3. [MEDLINE: ] [DOI] [PubMed] [Google Scholar]
- Gardner MM, Buchner DM, Robertson MC, Campbell AJ. Practical implementation of an exercise-based falls prevention programme. Age and Ageing 2001;30(1):77-83. [MEDLINE: ] [DOI] [PubMed] [Google Scholar]
- Robertson MC, Campbell AJ, Gardner MM, Devlin N. Preventing injuries in older people by preventing falls: a meta-analysis of individual-level data. Journal of the American Geriatrics Society 2002;50:905-11. [MEDLINE: ] [DOI] [PubMed] [Google Scholar]
- Robertson MC. Development of a falls prevention programme for elderly people: evaluation of efficacy, effectiveness, and efficiency [thesis]. Dunedin (NZ): Univ. of Otago, 2001. [Google Scholar]
Campbell 2005 {published data only}
- Campbell AJ, Robertson MC, La Grow SJ, Kerse NM, Sanderson GF, Jacobs RJ, et al. Randomised controlled trial of prevention of falls in people aged > or =75 with severe visual impairment: the VIP trial. BMJ 2005;331(7520):817. [MEDLINE: ] [DOI] [PMC free article] [PubMed] [Google Scholar]
- Jacobs R, Campbell AJ, Robertson MC. Randomized controlled trial of falls prevention in people 75 years and older with severe visual impairment [abstract]. American Academy of Optometry Meeting 2005 Dec 8-12; San Diego (CA). [CENTRAL: CN-00634854]
- Kiata L, Kerse NM, Hughes WE, Hayman KJ, Robertson MC, La Grow SJ, et al. Agreement and compliance with advice on removing mats or rugs by older people with visual impairments. Journal of Visual Impairment & Blindness 2008;102(3):167-72. [Google Scholar]
- La Grow SJ, Robertson MC, Campbell AJ, Clarke GA, Kerse NM. Reducing hazard related falls in people 75 years and older with significant visual impairment: how did a successful program work? Injury Prevention 2006;12(5):296-301. [MEDLINE: ] [DOI] [PMC free article] [PubMed] [Google Scholar]
Carpenter 1990 {published data only}
- Carpenter GI, Demopoulos GR. Screening the elderly in the community: controlled trial of dependency surveillance using a questionnaire administered by volunteers. BMJ 1990;300(6734):1253-6. [MEDLINE: ] [DOI] [PMC free article] [PubMed] [Google Scholar]
Carter 1997 {unpublished data only}
- Carter S, Campbell E, Sanson-Fisher R, Tiller K, Gillespie WJ. Trial data (as supplied 1997). Data on file.
Carter 2002 {published data only}
- Carter ND, Khan KM, McKay HA, Petit MA, Waterman C, Heinonen A, et al. Community-based exercise program reduces risk factors for falls in 65- to 75-year-old women with osteoporosis: Randomized controlled trial. CMAJ: Canadian Medical Association Journal 2002;167(9):997-1004. [MEDLINE: ] [PMC free article] [PubMed] [Google Scholar]
- Carter ND, Khan KM, Petit MA, Heinonen A, Waterman C, Donaldson MG, et al. Results of a 10 week community based strength and balance training programme to reduce fall risk factors: a randomised controlled trial in 65-75 year old women with osteoporosis. British Journal of Sports Medicine 2001;35(5):348-51. [MEDLINE: ] [DOI] [PMC free article] [PubMed] [Google Scholar]
Cerny 1998 {published and unpublished data}
- Cerny K, Blanks R, Mohamed O, Schwab D, Robinson B, Russo A, Zizz C. The effect of a multidimensional exercise program on strength, range of motion, balance and gait in the well elderly [abstract]. Gait and Posture 1998;7(2):185-6. [Google Scholar]
- Cerny K. personal communication October 22 2002.
Ciaschini 2009 {published data only}
- Ciaschini PM, Straus SE, Dolovich LR, Goeree RA, Leung KM, Woods CR, et al. Community-based intervention to optimise falls risk management: a randomised controlled trial. Age and Ageing 2009;38(6):724-30. [MEDLINE: ] [DOI] [PubMed] [Google Scholar]
- Ciaschini PM, Straus SE, Dolovich LR, Goeree RA, Leung KM, Woods CR, et al. Community-based randomised controlled trial evaluating falls and osteoporosis risk management strategies. Trials [Electronic Resource] 2008;9:62. [MEDLINE: ] [DOI] [PMC free article] [PubMed] [Google Scholar]
- NCT00465387. FORCE (Falls, Fracture, and Osteoporosis Risk Control Evaluation) study. clinicaltrials.gov/show/NCT00465387 (accessed 31 August 2011).
Clemson 2004 {published data only}
- Clemson L, Cumming RG, Kendig H, Swann M, Heard R, Taylor K. The effectiveness of a community-based program for reducing the incidence of falls in the elderly: a randomized trial. Journal of the American Geriatrics Society 2004;52(9):1487-94. [MEDLINE: ] [DOI] [PubMed] [Google Scholar]
- Clemson L, Taylor K, Kendig H, Cumming RG, Swann M. Recruiting older participants to a randomised trial of a community-based fall prevention program. Australasian Journal on Ageing 2007;26(1):35-9. [CINAHL: 2009512824] [Google Scholar]
- Clemson L. Stepping On, reducing falls and building confidence: a practical program that works [abstract]. In: Lord SR , editors(s). Falls prevention in older people: from research to practice. Proceedings of the 1st Australian falls prevention conference; 2004 Nov 21-23; Sydney (AU). Randwick, NSW, Australia: Prince of Wales Medical Research Institute, 2004:68.
- Swann M, Clemson L. Evaluating falls efficacy following a community based falls prevention program for older people [abstract]. In: Lord SR , editors(s). Falls prevention in older people: from research to practice. Proceedings of the 1st Australian falls prevention conference; 2004 Nov 21-23; Sydney (AU). Randwick, NSW, Australia: Prince of Wales Medical Research Institute, 2004:34.
Clemson 2010 {published data only}
- Clemson L, Singh MF, Bundy A, Cumming RG, Weissel E, Munro J, et al. LiFE Pilot Study: A randomised trial of balance and strength training embedded in daily life activity to reduce falls in older adults. Australian Occupational Therapy Journal 2010;57(1):42-50. [MEDLINE: ] [DOI] [PubMed] [Google Scholar]
Close 1999 {published and unpublished data}
- Close J, Ellis M, Hooper R, Glucksman E, Jackson S, Swift C. Prevention of falls in the elderly trial (PROFET): a randomised controlled trial. Lancet 1999;353(9147):93-7. [MEDLINE: ] [DOI] [PubMed] [Google Scholar]
- Close J, Hooper R, Glucksman E, Jackson S, Swift C. Predictors of falls in a high risk population - results from the prevention of falls in the elderly trial (PROFET) [abstract]. Journal of the American Geriatrics Society 2000;48(8):S79. [DOI] [PMC free article] [PubMed] [Google Scholar]
- Close J. personal communication Dec 9 2008.
- Close JCT, Ellis M, Hooper R, Glucksman E, Jackson SHD, Swift CG. Predictors of falls - results from prevention of falls in the elderly trial (PROFET) [abstract]. Age and Ageing 1999;28(Suppl 1):14. [Google Scholar]
- Close JCT, Ellis M, Jackson SHD, Glucksman E, Swift CG. Interdisciplinary assessment of elderly people presenting to A&E with a fall [abstract]. Age and Ageing 1998;27(Suppl 1):20. [Google Scholar]
- Close JCT, Patel A, Hooper R, Glucksman E, Jackson SHD, Swift CG. PROFET - Improved clinical outcomes at no additional cost [abstract]. Age and Ageing 2000;29(Suppl 1):48. [Google Scholar]
- F0300115. Can the incidence of falls in the elderly be reduced by a secondary prevention protocol? National Research Register (NRR) Archive. www.nihr.ac.uk/Pages/NRRArchiveSearch.aspx (accessed 23 February 2011). [NRR Publication ID: F0300115]
Coleman 1999 {published data only}
- Coleman EA, Grothaus LC, Sandhu N, Wagner EH. Chronic care clinics: a randomized controlled trial of a new model of primary care for frail older adults. Journal of the American Geriatrics Society 1999;47(7):775-83. [MEDLINE: ] [DOI] [PubMed] [Google Scholar]
Comans 2010 {published data only}
- ACTRN12605000056695. Domiciliary versus centre-based rehabilitation of older community dwellers: Randomised trial with economic evaluation. www.anzctr.org.au/trial_view.aspx?ID=52 (accessed 30 November 2011).
- Comans TA, Brauer S, Haines T. Domiciliary vs centre-based rehabilitation of older community dwellers: randomised trial with economic evaluation. Open Geriatric Medicine Journal 2008;1(6):62-7. [Google Scholar]
- Comans TA, Brauer SG, Haines TP. Randomized trial of domiciliary versus center-based rehabilitation: which is more effective in reducing falls and improving quality of life in older fallers? Journals of Gerontology Series A-Biological Sciences & Medical Sciences 2010;65(6):672-9. [DOI] [PubMed] [Google Scholar]
- Comans TA, Currin ML, Brauer SG, Haines TP. Factors associated with quality of life and caregiver strain amongst frail older adults referred to a community rehabilitation service: implications for service delivery. Disability & Rehabilitation 2011;33(13-14):1215-21. [DOI] [PubMed] [Google Scholar]
Conroy 2010 {published data only}46584556
- Conroy S, Kendrick D, Harwood R, Gladman J, Coupland C, Sach T, et al. A multicentre randomised controlled trial of day hospital-based falls prevention programme for a screened population of community-dwelling older people at high risk of falls. Age and Ageing 2010;39(6):704-10. [DOI] [PMC free article] [PubMed] [Google Scholar]
- Conroy S, Morris R, Masud T. Multifactorial day hospital intervention to reduce falls in high risk older people in primary care: a multi-centre randomised controlled trial. ProFaNE (Prevention of Falls Network Europe) meeting; 2004 June 11-13; Manchester (UK). [DOI] [PMC free article] [PubMed]
- Irvine L, Conroy SP, Sach T, Gladman JR, Harwood RH, Kendrick D, et al. Cost-effectiveness of a day hospital falls prevention programme for screened community-dwelling older people at high risk of falls. Age and Ageing 2010;39(6):710-6. [DOI] [PMC free article] [PubMed] [Google Scholar]
- ISRCTN46584556. Multifactorial day hospital intervention to reduce falls in high risk older people in primary care: a multi-centre randomised controlled trial. controlled-trials.com/ISRCTN46584556 (accessed 14 September 2011). [DOI] [PMC free article] [PubMed]
- Masud T, Coupland C, Drummond A, Gladman J, Kendrick D, Sach T, et al. Multifactorial day hospital intervention to reduce falls in high risk older people in primary care: a multi-centre randomised controlled trial [ISRCTN46584556]. Trials 2006;7:5-10. [DOI] [PMC free article] [PubMed] [Google Scholar]
Cornillon 2002 {published data only}
- Cornillon E, Blanchon MA, Ramboatsisetraina P, Braize C, Beauchet O, Dubost V, et al. Effectiveness of falls prevention strategies for elderly subjects who live in the community with performance assessment of physical activities (before-after) [Impact d'un programme de prevention multidisciplinaire de la chute chez le sujet age autonome vivant a domicile, avec analyse avant-apres des performances physiques]. Annales de Readaptation et de Medecine Physique 2002;45(9):493-504. [MEDLINE: ] [DOI] [PubMed] [Google Scholar]
Cumming 1999 {published data only}
- Cumming RG, Thomas M, Szonyi G, Frampton G, Salkeld G, Clemson L. Adherence to occupational therapist recommendations for home modifications for falls prevention. American Journal of Occupational Therapy 2001;55(6):641-8. [MEDLINE: ] [DOI] [PubMed] [Google Scholar]
- Cumming RG, Thomas M, Szonyi G, Salkeld G, O'Neill E, Westbury C, et al. Home visits by an occupational therapist for assessment and modification of environmental hazards: a randomized trial of falls prevention. Journal of the American Geriatrics Society 1999;47(12):1397-1402. [MEDLINE: ] [DOI] [PubMed] [Google Scholar]
- Salkeld G, Cumming RG, O'Neill E, Thomas M, Szonyi G, Westbury C. The cost effectiveness of a home hazard reduction program to reduce falls among older persons. Australian and New Zealand Journal of Public Health 2000;24(3):265-71. [MEDLINE: ] [DOI] [PubMed] [Google Scholar]
Cumming 2007 {published data only}
- Cumming RG, Ivers R, Clemson L, Cullen J, Hayes MF, Tanzer M, et al. Improving vision to prevent falls in frail older people: A randomized trial. Journal of the American Geriatrics Society 2007;55(2):175-81. [MEDLINE: ] [DOI] [PubMed] [Google Scholar]
Dangour 2011 {published data only}48153354
- Dangour AD, Albala C, Aedo C, Elbourne D, Grundy E, Walker D, et al. A factorial-design cluster randomised controlled trial investigating the cost-effectiveness of a nutrition supplement and an exercise programme on pneumonia incidence, walking capacity and body mass index in older people living in Santiago, Chile: the CENEX study protocol. Nutrition Journal 2007;6:14. [MEDLINE: ] [DOI] [PMC free article] [PubMed] [Google Scholar]
- Dangour AD, Albala C, Allen E, Grundy E, Walker DG, Aedo C, et al. Effect of a nutrition supplement and physical activity program on pneumonia and walking capacity in Chilean older people: a factorial cluster randomized trial. PLoS Medicine / Public Library of Science 2011;8(4):e1001023. [MEDLINE: ] [DOI] [PMC free article] [PubMed] [Google Scholar]
- ISRCTN48153354. Cost-effectiveness of nutritional supplementation and exercise programme among older people in Santiago, Chile. controlled-trials.com/ISRCTN48153354 (accessed 30 November 2011).
- Walker DG, Aedo C, Albala C, Allen E, Dangour AD, Elbourne D, et al. Methods for economic evaluation of a factorial-design cluster randomised controlled trial of a nutrition supplement and an exercise programme among healthy older people living in Santiago, Chile: the CENEX study. BMC Health Services Research 2009;9:85. [MEDLINE: ] [DOI] [PMC free article] [PubMed] [Google Scholar]
Dapp 2011 {published and unpublished data}
- Dapp U, Anders J, Renteln-Kruse W, Meier-Baumgartner HP. Active health promotion in old age: Methodology of a preventive intervention programme provided by an interdisciplinary health advisory team for independent older people. Journal of Public Health 2005;13(3):122-7. [EMBASE: 2005287059] [Google Scholar]
- Dapp U, Anders JA, Renteln-Kruse W, Minder CE, Meier-Baumgartner HP, Swift CG, et al. A randomized trial of effects of health risk appraisal combined with group sessions or home visits on preventive behaviors in older adults. Journals of Gerontology. Series A, Biological Sciences and Medical Sciences 2011;66(5):591-8. [MEDLINE: ] [DOI] [PubMed] [Google Scholar]
- Dapp U. personal communication April 11 2011.
- Stuck AE, Kharicha K, Dapp U, Anders J, Renteln-Kruse W, Meier-Baumgartner HP, et al. The PRO-AGE study: an international randomised controlled study of health risk appraisal for older persons based in general practice. BMC Medical Research Methodology 2007;7:2. [DOI] [PMC free article] [PubMed] [Google Scholar]
Davis 2011a {published data only}
- Davis JC, Marra CA, Beattie BL, Robertson MC, Najafzadeh M, Graf P, et al. Sustained cognitive and economic benefits of resistance training among community-dwelling senior women: a 1-year follow-up study of the Brain Power study. Archives of Internal Medicine 2010;170(22):2036-8. [DOI] [PMC free article] [PubMed] [Google Scholar]
- Davis JC, Marra CA, Liu-Ambrose TY. Falls-related self-efficacy is independently associated with quality-adjusted life years in older women. Age & Ageing 2011;40(3):340-6. [DOI] [PMC free article] [PubMed] [Google Scholar]
- Davis JC, Marra CA, Robertson MC, Khan KM, Najafzadeh M, Ashe MC, et al. Economic evaluation of dose-response resistance training in older women: a cost-effectiveness and cost-utility analysis. Osteoporosis International 2011;22(5):1355-66. [DOI] [PMC free article] [PubMed] [Google Scholar]
- Davis JC, Marra CA, Robertson MC, Najafzadeh M, Liu-Ambrose T. Sustained economic benefits of resistance training in community-dwelling senior women. Journal of the American Geriatrics Society 2011;59(7):1232-7. [MEDLINE: ] [DOI] [PMC free article] [PubMed]
- Liu-Ambrose T, Davis JC, Nagamatsu LS, Hsu CL, Katarynych LA, Khan KM. Changes in executive functions and self-efficacy are independently associated with improved usual gait speed in older women. BMC Geriatrics 2010;10:25. [DOI] [PMC free article] [PubMed] [Google Scholar]
- Liu-Ambrose T, Nagamatsu LS, Graf P, Beattie BL, Ashe MC, Handy TC. Resistance training and executive functions: a 12-month randomized controlled trial. Archives of Internal Medicine 2010;170(2):170-8. [DOI] [PMC free article] [PubMed] [Google Scholar]
Davison 2005 {published data only}
- Davison J, Bond J, Dawson P, Steen IN, Kenny RA. Patients with recurrent falls attending Accident & Emergency benefit from multifactorial intervention - a randomised controlled trial. Age and Ageing 2005;34(2):162-8. [MEDLINE: ] [DOI] [PubMed] [Google Scholar]
- Kenny R. Syncope and Falls in the Emergency Room (SAFER 2) - A multidisciplinary post-fall assessment and intervention strategy for elderly recurrent fallers attending casualty (RRCC53R). The Research Findings Register. Summary number 1174. www.ReFeR.nhs.uk/ViewRecord.asp?ID=1174 (accessed 24 August 2006).
- N0009027144. SAFER2 - Syncope and falls in the emergency room - an explanatory randomised controlled trial of a multidisciplinary post-fall assessment and intervention strategy in elderly recurrent fallers attending casualty. National Research Register (NRR) Archive. www.nihr.ac.uk/Pages/NRRArchiveSearch.aspx (accessed 23 February 2011). [NRR Publication ID: N0009027144]
- N0116069489. Can the incidence of falls in the elderly be reduced by a secondary falls prevention protocol. National Research Register (NRR) Archive. www.nihr.ac.uk/Pages/NRRArchiveSearch.aspx (accessed 23 February 2011). [NRR Publication ID: N0116069489]
- N0145036249. A post-fall intervention strategy after presentation to casualty. National Research Register (NRR) Archive. www.nihr.ac.uk/Pages/NRRArchiveSearch.aspx (accessed 23 February 2011). [NRR Publication ID: N0145036249]
- N0145049230. A post-fall intervention strategy after presentation to casualty - Safer 2. National Research Register (NRR) Archive. www.nihr.ac.uk/Pages/NRRArchiveSearch.aspx (accessed 23 February 2011). [NRR Publication ID: N0145049230]
- N0503055776. SAFER 2 - Syncope and falls in the emergency room - The Tyneside casualty falls intervention project. National Research Register (NRR) Archive. www.nihr.ac.uk/Pages/NRRArchiveSearch.aspx (accessed 23 February 2011). [NRR Publication ID: N0503055776]
Day 2002 {published and unpublished data}
- Day L, Fildes B, Gordon I, Fitzharris M, Flamer H, Lord S. Randomised factorial trial of falls prevention among older people living in their own homes. BMJ 2002;325(7356):128-31. [MEDLINE: ] [DOI] [PMC free article] [PubMed] [Google Scholar]
- Fitzharris MP, Day L, Lord SR, Gordon I, Fildes B. The Whitehorse NoFalls trial: effects on fall rates and injurious fall rates. Age & Ageing 2010;39(6):728-33. [MEDLINE: ] [DOI] [PubMed] [Google Scholar]
De Vries 2010 {published data only}11546541
- De Vries OJ, Peeters GM, Elders PJ, Muller M, Knol DL, Danner SA, et al. Multifactorial intervention to reduce falls in older people at high risk of recurrent falls: a randomized controlled trial. Archives of Internal Medicine 2010;170(13):1110-7. [MEDLINE: ] [DOI] [PubMed] [Google Scholar]
- ISRCTN11546541. Prevention of fall incidents in patients with a high risk of falling; a multidisciplinary study on the effects of transmural health care compared to usual care. controlled-trials.com/ISRCTN11546541 (accessed 14 September 2011).
- Peeters GM, Vries OJ, Elders PJ, Pluijm SM, Bouter LM, Lips P. Prevention of fall incidents in patients with a high risk of falling: design of a randomised controlled trial with an economic evaluation of the effect of multidisciplinary transmural care. BMC Geriatrics 2007;7:15. [MEDLINE: ] [DOI] [PMC free article] [PubMed] [Google Scholar]
- Peeters GM, Heymans MW, Vries OJ, Bouter LM, Lips P, Tulder MW. Multifactorial evaluation and treatment of persons with a high risk of recurrent falling was not cost-effective. Osteoporosis International 2011;22(7):2187-96. [DOI] [PMC free article] [PubMed] [Google Scholar]
Dhesi 2004 {published data only}
- Dhesi JK, Bearne L, Jackson SH, Moniz C, Hurley M, Swift CG, et al. Vitamin D supplementation improves the balance and functional performance of older people who fall [abstract]. Journal of the American Geriatrics Society 2002;50(4 Suppl):S5. [Google Scholar]
- Dhesi JK, Jackson SH, Bearne LM, Moniz C, Hurley MV, Swift CG, et al. Vitamin D supplementation improves neuromuscular function in older people who fall. Age and Ageing 2004;33(6):589-95. [MEDLINE: ] [DOI] [PubMed] [Google Scholar]
- N0116016083. A controlled intervention study of vitamin D supplementation on neuromuscular and psychomotor function in elderly people who fall. National Research Register (NRR) Archive. www.nihr.ac.uk/Pages/NRRArchiveSearch.aspx (accessed 23 February 2011). [NRR Publication ID: N0116016083]
Di Monaco 2008 {published data only}
- Di Monaco M, Vallero F, De Toma E, De Lauso L, Tappero R, Cavanna A. A single home visit by an occupational therapist reduces the risk of falling after hip fracture in elderly women: a quasi-randomized controlled trial. Journal of Rehabilitation Medicine 2008;40(6):446-50. [MEDLINE: ] [DOI] [PubMed] [Google Scholar]
Dukas 2004 {published data only}
- Bock O, Boerst H, Runge M, Beller G, Touby F, Tuerk J, et al. Effect of alfacalcidol on volumetric bone mineral density measured by pQCT in alendronate-treated postmenopausal women with osteopenia or osteoporosis: 1 year interim analysis of the ALFA study [abstract]. Journal of Bone and Mineral Research 2007;22(Suppl 1):S215. [Google Scholar]
- Bock O, Boerst H, Runge M, Schacht E, Martus P, Felsenberg D. Effect of alfacalcidol on biochemical bone markers in alendronate-treated postmenopausal women with osteopenia or osteoporosis: 1 year interim analysis of the ALFA study [abstract]. Journal of Bone and Mineral Research 2006;21(Suppl 1):S306. [Google Scholar]
- Boerst H, Bock O, Runge M, Degner C, Stephan-Oelkers M, Umrath F, et al. Effects of alfacalcidol on bone markers and bone mineral density in alendronate-treated postmenopausal women with osteopenia or osteoporosis: one year interim analysis of the ALFA study [abstract]. Osteoporosis International 2007;18(Suppl 1):S90-1. [Google Scholar]
- Dukas L, Bischoff HA, Lindpaintner LS, Schacht E, Birkner-Binder D, Damm TN, et al. Alfacalcidol reduces the number of fallers in a community-dwelling elderly population with a minimum calcium intake of more than 500 mg daily. Journal of the American Geriatrics Society 2004;52(2):230-6. [MEDLINE: ] [DOI] [PubMed] [Google Scholar]
- Dukas L, Bischoff HA, Lindpaintner LS, Schacht E, Birkner-Binder D, Thalmann B, et al. Alfacalcidol reduces the number of fallers and falls in community-dwelling elderly provided a mainimum total daily intake of 500mg calcium [abstract]. Calcified Tissue International 2003;72:371. [Google Scholar]
- Dukas L, Schacht E, Mazor Z, Stahelin HB. Treatment with alfacalcidol in elderly people significantly decreases the high risk of falls associated with a low creatinine clearance of <65 ml/min. Osteoporosis International 2005;16(2):198-203. [MEDLINE: ] [DOI] [PubMed] [Google Scholar]
- Dukas L, Schacht E, Stahelin HB. High risk of falls related to low d-hormone syndrome and its treatment with alfacalcidol. Osteoporosis International 2004;14(Suppl 1):S8-9. [Google Scholar]
- Dukas LC, Schacht E, Mazor Z, Stahelin HB. A new significant and independent risk factor for falls in elderly men and women: a low creatinine clearance of less than 65 ml/min. Osteoporosis International 2005;16(3):332-8. [MEDLINE: ] [DOI] [PubMed] [Google Scholar]
- NCT00168909. Influence of alfacalcidol on falls in osteopenic/osteoporotic postmenopausal women (ALFA Study). clincialtrials.gov/show/NCT00168909 (accessed 31 August 2011).
Elley 2008 {published data only}
- ACTRN12605000054617. Falls Assessment Clinical Trial: randomised controlled trial of a multi-component intervention in primary health care to reduce falls amongst over 75 year old adults with a history of falling. www.anzctr.org.au/trial_view.aspx?ID=85 (accessed 30 November 2011).
- Elley CR, Robertson MC, Garrett S, Kerse NM, MacKinlay E, Lawton B, et al. Effectiveness of a falls-and-fracture nurse coordinator to reduce falls: a randomized, controlled trial of at-risk older adults. Journal of the American Geriatrics Society 2008;56(8):1383-9. [MEDLINE: ] [DOI] [PubMed] [Google Scholar]
- Elley CR, Robertson MC, Kerse NM, Garrett S, McKinlay E, Lawton B, et al. Falls Assessment Clinical Trial (FACT): design, interventions, recruitment strategies and participant characteristics. BMC Public Health 2007;7:185. [MEDLINE: ] [DOI] [PMC free article] [PubMed] [Google Scholar]
Fabacher 1994 {published data only}
- Fabacher D, Josephson K, Pietruszka F, Linderborn K, Morley JE, Rubenstein LZ. An in-home preventive assessment program for independent older adults: a randomized controlled trial. Journal of the American Geriatrics Society 1994;42(6):630-8. [MEDLINE: ] [DOI] [PubMed] [Google Scholar]
Faes 2011 {published data only}
- Faes MC, Reelick MF, Esselink RA, Rikkert MG. Developing and evaluating complex healthcare interventions in geriatrics: the use of the medical research council framework exemplified on a complex fall prevention intervention. Journal of the American Geriatrics Society 2010;58(11):2212-21. [MEDLINE: ] [DOI] [PubMed] [Google Scholar]
- Faes MC, Reelick MF, Melis RJ, Borm GF, Esselink RA, Olde Rikkert MG. Multifactorial fall prevention for pairs of frail community-dwelling older fallers and their informal caregivers: a dead end for complex interventions in the frailest fallers. Journal of the American Medical Directors Association 2011;12(6):451-8. [DOI] [PubMed]
- NCT00512655. Trial to reduce falls incidence rate in frail elderly (CP). clinicaltrials.gov/show/NCT00512655 (accessed 31 August 2011).
- Reelick MF, Faes MC, Esselink RA, Kessels RP, Olde Rikkert MG. How to perform a preplanned process evaluation for complex interventions in geriatric medicine: exemplified with the process evaluation of a complex falls-prevention program for community-dwelling frail older fallers. Journal of the American Medical Directors Association 2011;12(5):331-6. [DOI] [PubMed] [Google Scholar]
Fiatarone 1997 {published data only}
- Fiatarone MA, O'Neill EF, Doyle RN, Clements K. Efficacy of home-based resistance training in frail elders (Abstract 985). In: Andrews GR , editors(s). Abstracts of the 16th Congress of the International Association of Gerontology. Bedford Park, South Australia: World Congress of Gerontology Inc, 1997:323. [CENTRAL: CN-00405155]
Foss 2006 {published data only}
- Foss AJ, Harwood RH, Osborn F, Gregson RM, Zaman A, Masud T. Falls and health status in elderly women following second eye cataract surgery: a randomised controlled trial. Age and Ageing 2006;35(1):66-71. [MEDLINE: ] [DOI] [PubMed] [Google Scholar]
- N0192080923. Randomised controlled trial of second eye cataract extraction to prevent falls in elderly women. National Research Register (NRR) Archive. www.nihr.ac.uk/Pages/NRRArchiveSearch.aspx (accessed 30 November 2011). [NRR Publication ID: N0192080923]
- Sach TH, Foss AJ, Gregson RM, Zaman A, Osborn F, Masud T, et al. Second-eye cataract surgery in elderly women: a cost-utility analysis conducted alongside a randomized controlled trial. Eye 2010;24(2):276-83. [MEDLINE: ] [DOI] [PubMed] [Google Scholar]
Fox 2010 {published data only}
- Fox PJ, Vazquez L, Tonner C, Stevens JA, Fineman N, Ross LK. A randomized trial of a multifaceted intervention to reduce falls among community-dwelling adults. Health Education and Behavior 2010;37(6):831-48. [DOI] [PubMed] [Google Scholar]
Gallagher 1996 {published data only}
- Gallagher EM, Brunt H. Head over heels: impact of a health promotion program to reduce falls in the elderly. Canadian Journal on Aging 1996;15(1):84-96. [EMBASE 1996164172] [Google Scholar]
Gallagher 2001 {published data only}
- Gallagher JC, Fowler S. Effect of estrogen, calcitriol and a combination of estrogen and calcitriol on bone mineral density and fractures in elderly women [abstract]. Journal of Bone and Mineral Research 1999;14(Suppl 1):S209. [Google Scholar]
- Gallagher JC, Fowler SE, Detter JR, Sherman SS. Combination treatment with estrogen and calcitriol in the prevention of age-related bone loss. Journal of Clinical Endocrinology and Metabolism 2001;86(8):3618-28. [MEDLINE: ] [DOI] [PubMed] [Google Scholar]
- Gallagher JC, Haynatski G, Fowler S. Calcitriol therapy reduces falls and fractures in elderly women [abstract]. Calcified Tissue International 2003;72:334. [Google Scholar]
- Gallagher JC, Haynatzki G, Fowler S. Effect of estrogen, calcitriol or the combination of both on falls and non vertebral fractures in elderly women [abstract]. Journal of Bone and Mineral Research 2002;17(Suppl 1):S210. [Google Scholar]
- Gallagher JC, Rapuri P, Smith L. Falls are associated with decreased renal function and insufficient calcitriol production by the kidney. Journal of Steroid Biochemistry and Molecular Biology 2007;103(3-5):610-3. [MEDLINE: ] [DOI] [PMC free article] [PubMed] [Google Scholar]
- Gallagher JC, Rapuri PB, Haynatzki G, Detter JR. Effect of discontinuation of estrogen, calcitriol, and the combination of both on bone density and bone markers. Journal of Clinical Endocrinology and Metabolism 2002;87(11):4914-23. [MEDLINE: ] [DOI] [PubMed] [Google Scholar]
- Gallagher JC, Rapuri PB, Smith LM. An age-related decrease in creatinine clearance is associated with an increase in number of falls in untreated women but not in women receiving calcitriol treatment. Journal of Clinical Endocrinology and Metabolism 2007;92(1):51-8. [MEDLINE: ] [DOI] [PMC free article] [PubMed] [Google Scholar]
- Gallagher JC. The effects of calcitriol on falls and fractures and physical performance tests. Journal of Steroid Biochemistry and Molecular Biology 2004;89-90(1-5):497-501. [MEDLINE: ] [DOI] [PubMed] [Google Scholar]
Gill 2008 {published and unpublished data}
- Gill DP, Zou GY, Jones GR, Speechley M. Injurious falls are associated with lower household but higher recreational physical activities in community-dwelling older male veterans. Gerontology 2008;54(2):106-15. [MEDLINE: ] [DOI] [PubMed] [Google Scholar]
- Speechley M. Falls data (as supplied 03 June 2008). Data on file.
Grahn Kronhed 2009 {published data only}
- Grahn Kronhed AC, Hallberg I, Odkvist L, Moller M. Effect of training on health-related quality of life, pain and falls in osteoporotic women. Advances in Physiotherapy 2009;11(3):154-65. [EMBASE: 2009642277] [Google Scholar]
Grant 2005 {published and unpublished data}51647438
- Anderson FH, Grant AM, Avenell A, Campbell MK, Cooper C, Donaldson C, et al. The RECORD Trial: an evaluation of calcium and/or vitamin D in the secondary prevention of osteoporotic fractures [abstract]. Bone 2005;36(Suppl 2):S122-3. [Google Scholar]
- Francis RM, Grant AM, RECORD Trial Group. The RECORD trial: a randomised double-blind study of calcium and/or vitamin D in the secondary prevention of low trauma fractures [abstract]. Age and Ageing 2005;34(Suppl 2):ii16. [Google Scholar]
- Grant AM, Anderson FH, . The RECORD trial: an evaluation of calcium and/or vitamin D in the secondary prevention of osteoporotic fractures [abstract]. Osteoporosis International 2005;16(Suppl 3):S4-5. [Google Scholar]
- Grant AM, Anderson FH. The Medical Research Council RECORD Trial: an evaluation of calcium and/or vitamin D in the secondary prevention of osteoporotic fractures [abstract]. Osteoporosis International 2004;15(Suppl 2):S13. [Google Scholar]
- Grant AM, Avenell A, Campbell MK, McDonald AM, MacLennan GS, McPherson GC, et al. Oral vitamin D3 and calcium for secondary prevention of low-trauma fractures in elderly people (Randomised Evaluation of Calcium Or vitamin D, RECORD): a randomised placebo-controlled trial. Lancet 2005;365(9471):1621-8. [MEDLINE: ] [DOI] [PubMed]
- N0217084004. Randomised placebo-controlled trial of daily oral vitamin D and calcium for the secondary prevention of osteoporosis related fractures in the elderly (RECORD). National Research Register (NRR) Archive. www.nihr.ac.uk/Pages/NRRArchiveSearch.aspx (accessed 23 February 2011). [NRR Publication ID: N0217084004]
Gray‐Donald 1995 {published data only}
- Gray-Donald K, Payette H, Boutier V. Randomized clinical trial of nutritional supplementation shows little effect on functional status among free-living frail elderly. Journal of Nutrition 1995;125(12):2965-71. [MEDLINE: ] [DOI] [PubMed] [Google Scholar]
Greenspan 2005 {published data only}
- Greenspan SL, Resnick NM, Parker RA. Combination therapy with hormone replacement and alendronate for prevention of bone loss in elderly women: a randomized controlled trial. JAMA 2003;289(19):2525-33. [MEDLINE: ] [DOI] [PubMed] [Google Scholar]
- Greenspan SL, Resnick NM, Parker RA. The effect of hormone replacement on physical performance in community-dwelling elderly women. American Journal of Medicine 2005;118(11):1232-9. [MEDLINE: ] [DOI] [PubMed] [Google Scholar]
Haines 2009 {published data only}
- ACTRN12607000180415. Assessment and prevention of falls, functional decline and hospital re-admission in older adults post-hospitalisation. www.anzctr.org.au/trial_view.aspx?ID=81910 (accessed 30 November 2011).
- Haines TP, Russell T, Brauer SG, Erwin S, Lane P, Urry S, et al. Effectiveness of a video-based exercise programme to reduce falls and improve health-related quality of life among older adults discharged from hospital: a pilot randomized controlled trial. Clinical Rehabilitation 2009;23(11):973-85. [DOI] [PubMed] [Google Scholar]
Haran 2010 {published data only}
- Haran MJ, Cameron ID, Ivers RQ, Simpson JM, Lee BB, Tanzer M, et al. Effect on falls of providing single lens distance vision glasses to multifocal glasses wearers: VISIBLE randomised controlled trial. BMJ 2010;340:c2265. [MEDLINE: ] [DOI] [PMC free article] [PubMed] [Google Scholar]
- Haran MJ, Lord SR, Cameron ID, Ivers RQ, Simpson JM, Lee BB, et al. Preventing falls in older multifocal glasses wearers by providing single-lens distance glasses: the protocol for the VISIBLE randomised controlled trial. BMC Geriatrics 2009;9:10. [MEDLINE: ] [DOI] [PMC free article] [PubMed] [Google Scholar]
- NCT00350389. VISIBLE study (Visual Intervention Strategy Incorporating Bifocal & Long-Distance Eyewear). clinicaltrials.gov/show/NCT00350389 (accessed 31 August 2001).
Harari 2008 {published and unpublished data}28458424
- Harari D, Iliffe S, Kharicha K, Egger M, Gillmann G, Renteln-Kruse W, et al. Promotion of health in older people: a randomised controlled trial of health risk appraisal in British general practice. Age and Ageing 2008;37(5):565-71. [MEDLINE: ] [DOI] [PubMed] [Google Scholar]
- Iliffe S, Kharicha K, Harari D, Swift C, Gillmann G, Stuck AE. Health risk appraisal in older people 2: the implications for clinicians and commissioners of social isolation risk in older people. British Journal of General Practice 2007;57(537):277-82. [MEDLINE: ] [PMC free article] [PubMed] [Google Scholar]
- ISRCTN28458424. Disability prevention in the older population: use of information technology for health risk appraisal and prevention of functional decline. controlled-trials.com/ISRCTN28458424 (accessed 14 September 2011).
- Kharicha K, Iliffe S, Harari D, Swift C, Gillmann G, Stuck AE. Health risk appraisal in older people 1: are older people living alone an "at-risk" group? British Journal of General Practice 2007;57(537):271-6. [MEDLINE: ] [PMC free article] [PubMed] [Google Scholar]
- Stuck A. personal communication Oct 20 2010.
- Stuck AE, Kharicha K, Dapp U, Anders J, Von Renteln-Kruse W, Meier-Baumgartner HP, et al. The PRO-AGE study: an international randomised controlled study of health risk appraisal for older persons based in general practice. BMC Medical Research Methodology 2007;7:2. [MEDLINE: ] [DOI] [PMC free article] [PubMed] [Google Scholar]
Harwood 2004 {published data only}
- Harwood RH, Sahota O, Gaynor K, Masud T, Hosking DJ. A randomised, controlled comparison of different calcium and vitamin D supplementation regimens in elderly women after hip fracture: The Nottingham Neck of Femur (NoNOF) study. Age and Ageing 2004;33(1):45-51. [MEDLINE: ] [DOI] [PubMed] [Google Scholar]
- The Nottingham Neck of Femur Study: the optimal role of vitamin D and calcium in elderly patients with established osteoporosis. National Research Register (NRR) Archive. www.nihr.ac.uk/Pages/NRRArchiveSearch.aspx (accessed 23 February 2011). [NRR Publication ID: N0192080773]
Harwood 2005 {published data only}
- 192080923. Randomised trial to assess the efficacy of expedited cataract extraction in the prevention of falls in elderly people awaiting cataract surgery. National Research Register (NRR) Archive. www.nihr.ac.uk/Pages/NRRArchiveSearch.aspx (accessed 30 November 2011). [NRR Publication ID: 192080923]
- Harwood RH, Foss A, Osborn F, Gregson R, Zaman A, Masud T. Falls and health status in elderly women following first eye cataract surgery: a randomised controlled trial [abstract]. Age and Ageing 2005;34(Suppl 1):i21. [DOI] [PubMed] [Google Scholar]
- Harwood RH, Foss AJ, Osborn F, Gregson RM, Zaman A, Masud T. Falls and health status in elderly women following first eye cataract surgery: a randomised controlled trial. British Journal of Ophthalmology 2005;89(1):53-9. [MEDLINE: ] [DOI] [PMC free article] [PubMed] [Google Scholar]
- N0497017851. Does expedited cataract extraction reduce the risk of falls in elderly people? - a randomised controlled trial. National Research Register (NRR) Archive. www.nihr.ac.uk/Pages/NRRArchiveSearch.aspx (accessed 30 November 2011). [NRR Publication ID: N0497017851]
- Sach TH, Foss AJ, Gregson RM, Zaman A, Osborn F, Masud T, et al. Falls and health status in elderly women following first eye cataract surgery: an economic evaluation conducted alongside a randomised controlled trial. British Journal of Ophthalmology 2007;91(12):1675-9. [MEDLINE: ] [DOI] [PMC free article] [PubMed] [Google Scholar]
Hauer 2001 {published and unpublished data}
- Hauer K, Pfisterer M, Schuler M, Bartsch P, Oster P. Two years later: A prospective long-term follow-up of a training intervention in geriatric patients with a history of severe falls. Archives of Physical Medicine and Rehabilitation 2003;84(10):1426-32. [MEDLINE: ] [DOI] [PubMed] [Google Scholar]
- Hauer K, Rost B, Rutschle K, Opitz H, Specht N, Bartsch P, et al. Exercise training for rehabilitation and secondary prevention of falls in geriatric patients with a history of injurious falls. Journal of the American Geriatrics Society 2001;49(1):10-20. [MEDLINE: ] [DOI] [PubMed] [Google Scholar]
- Hauer K, Specht N, Schuler M, Bartsch P, Oster P. Intensive physical training in geriatric patients after severe falls and hip surgery. Age and Ageing 2002;31(1):49-57. [MEDLINE: ] [DOI] [PubMed] [Google Scholar]
- Hauer K. personal communication October 6 2006.
- Oster P, Hauer K, Specht N, Rost B, Baertsch P, Schlierf G. Strength and coordination training for prevention of falls in the elderly [Kraft- und Koordinationstraining zur Sturzprävention im Alter]. Zeitschrift fur Gerontologie und Geriatrie 1997;30(4):289-92. [MEDLINE: ] [PubMed] [Google Scholar]
Helbostad 2004 {published data only}
- Helbostad JL, Moe-Nilssen R, Sletvold O. Comparison of two types of exercise regimes on selected functional abilities for community-dwelling elderly at risk of falling [abstract]. XVI Conference of the International Society for Postural Gait Research; 2003 March 23-27; Sydney (Australia).
- Helbostad JL, Sletvold O, Moe-Nilssen R. Effects of home exercises and group training on functional abilities in home-dwelling older persons with mobility and balance problems. A randomized study. Aging - Clinical and Experimental Research 2004;16(2):113-21. [MEDLINE: ] [DOI] [PubMed] [Google Scholar]
- Helbostad JL, Sletvold O, Moe-Nilssen R. Home training with and without additional group training in physically frail old people living at home: effect on health-related quality of life and ambulation. Clinical Rehabilitation 2004;18(5):498-508. [MEDLINE: ] [DOI] [PubMed]
Hendriks 2008 {published data only}64716113
- Bleijlevens MH, Hendriks MR, Haastregt JC, Crebolder HF, Eijk JT. Lessons learned from a multidisciplinary fall-prevention programme: the occupational-therapy element. Scandinavian Journal of Occupational Therapy 2010;17(4):319-25. [DOI] [PubMed] [Google Scholar]
- Bleijlevens MH, Hendriks MR, Haastregt JC, Rossum E, Kempen, GI, et al. Process factors explaining the ineffectiveness of a multidisciplinary fall prevention programme: a process evaluation. BMC Public Health 2008;8:332. [DOI] [PMC free article] [PubMed] [Google Scholar]
- Hendriks MR, Bleijlevens MH, Van Haastregt JC, Crebolder HF, Diederiks JP, Evers SM, et al. Lack of effectiveness of a multidisciplinary fall-prevention program in elderly people at risk: a randomized controlled trial. Journal of the American Geriatrics Society 2008;56(8):1390–7. [MEDLINE: ] [DOI] [PubMed] [Google Scholar]
- Hendriks MR, Bleijlevens MH, Van Haastregt JC, De Bruijn FH, Diederiks JP, Mulder WJ, et al. A multidisciplinary fall prevention program for elderly persons: a feasibility study. Geriatric Nursing 2008;29(3):186-96. [MEDLINE: ] [DOI] [PubMed] [Google Scholar]
- Hendriks MR, Evers SM, Bleijlevens MH, Van Haastregt JC, Crebolder HF, Van Eijk JT. Cost-effectiveness of a multidisciplinary fall prevention program in community-dwelling elderly people: A randomized controlled trial (ISRCTN 64716113). International Journal of Technology Assessment in Health Care 2008;24(2):193-202. [MEDLINE: ] [DOI] [PubMed] [Google Scholar]
- Hendriks MR, Van Haastregt JC, Diederiks JP, Evers SM, Crebolder HF, Van Eijk JT. Effectiveness and cost-effectiveness of a multidisciplinary intervention programme to prevent new falls and functional decline among elderly persons at risk: design of a replicated randomised controlled trial [ISRCTN64716113]. BMC Public Health 2005;5:6. [MEDLINE: ] [DOI] [PMC free article] [PubMed] [Google Scholar]
- ISRCTN64716113. Preventing further falls and functional decline among elderly persons presented to the Accident and Emergency (A&E) department with a fall: randomised controlled trial. controlled-trials.com/ISRCTN64716113 (accessed 30 November 2011).
Hill 2000 {published data only}
- Crome P, Hill S, Mossman J, Stockdale P. A randomised controlled trial of a nurse led falls prevention clinic [abstract]. Journal of the American Geriatrics Society 2000;48(8):S78. [Google Scholar]
- Crome P. personal communication August 29 2006.
- Hill S, Mossman J, Stockdale P, Crome P. A randomised controlled trial of a nurse-led falls prevention clinic [abstract]. Age and Ageing 2000;29(Suppl 2):20. [Google Scholar]
Hogan 2001 {published data only}
- Hogan DB, MacDonald FA, Betts J, Bricker S, Ebly EM, Delarue B, et al. A randomized controlled trial of a community-based consultation service to prevent falls. CMAJ: Canadian Medical Association Journal 2001;165(5):537-43. [MEDLINE: ] [PMC free article] [PubMed] [Google Scholar]
Hornbrook 1994 {published data only}
- Hornbrook MC, Stevens VJ, Wingfield DJ, Hollis JF, Greenlick MR, Ory MG. Preventing falls among community-dwelling older persons: results from a randomized trial. Gerontologist 1994;34(1):16-23. [MEDLINE: ] [DOI] [PubMed] [Google Scholar]
- Hornbrook MC, Stevens VJ, Wingfield DJ. Seniors' program for injury control and education. Journal of the American Geriatrics Society 1993;41(3):309-14. [MEDLINE: ] [DOI] [PubMed] [Google Scholar]
- Stevens VJ, Hornbrook MC, Wingfield DJ, Hollis JF, Greenlick MR, Ory MG. Design and implementation of a falls prevention intervention for community-dwelling older persons. Behavior, Health, and Aging 1991/92;2(1):57-73. [Google Scholar]
Huang 2004 {published data only}
- Huang TT, Acton GJ. Effectiveness of home visit falls prevention strategy for Taiwanese community-dwelling elders: randomized trial. Public Health Nursing 2004;21(3):247-56. [MEDLINE: ] [DOI] [PubMed] [Google Scholar]
Huang 2005 {published data only}
- Huang TT, Liang SH. A randomized clinical trial of the effectiveness of a discharge planning intervention in hospitalized elders with hip fracture due to falling. Journal of Clinical Nursing 2005;14(10):1193-201. [MEDLINE: ] [DOI] [PubMed] [Google Scholar]
Huang 2010 {published data only}
- Huang HC, Liu CY, Huang YT, Kernohan WG. Community-based interventions to reduce falls among older adults in Taiwan - long time follow-up randomised controlled study. Journal of Clinical Nursing 2010;19(7-8):959-68. [DOI] [PubMed] [Google Scholar]
Huang 2011 {published data only}
- Huang TT, Wang WS. Comparison of three established measures of fear of falling in community-dwelling older adults: psychometric testing. International Journal of Nursing Studies 2009;46(10):1313-9. [DOI] [PubMed] [Google Scholar]
- Huang TT, Yang LH, Liu CY. Reducing the fear of falling among community-dwelling elderly adults through cognitive-behavioural strategies and intense Tai Chi exercise: a randomized controlled trial. Journal of Advanced Nursing 2011;67(5):961-71. [DOI] [PubMed]
Iwamoto 2009 {published data only}
- Iwamoto J, Suzuki H, Tanaka K, Kumakubo T, Hirabayashi H, Miyazaki Y, et al. Preventative effect of exercise against falls in the elderly: A randomized controlled trial. Osteoporosis International 2009;20(7):1233-40. [DOI] [PubMed] [Google Scholar]
Jitapunkul 1998 {published data only}
- Jitapunkul S. A randomised controlled trial of regular surveillance in Thai elderly using a simple questionnaire administered by non-professional personnel. Journal of the Medical Association of Thailand 1998;81(5):352-6. [MEDLINE: ] [PubMed] [Google Scholar]
Kamide 2009 {published data only}
- Kamide N, Shiba Y, Shibata H. Effects on balance, falls, and bone mineral density of a home-based exercise program without home visits in community-dwelling elderly women: a randomized controlled trial. Journal of Physiological Anthropology 2009;28(3):115-22. [MEDLINE: ] [DOI] [PubMed] [Google Scholar]
Kärkkäinen 2010 {published data only}
- Kärkkäinen M, Tuppurainen M, Salovaara K, Sandini L, Rikkonen T, Sirola J, et al. Effect of calcium and vitamin D supplementation on bone mineral density in women aged 65-71 years: A 3-year randomized population-based trial (OSTPRE-FPS). Osteoporosis International 2010;21(12):2047-55. [DOI] [PubMed] [Google Scholar]
- Kärkkäinen M. Physical Capacity and Supplementation of Vitamin D and Calcium in Postmenopausal Women [thesis]. Kuopio: Univ. of Eastern Finland, 2011. Available from epublications.uef.fi/pub/urn_isbn_978-952-61-0310-5/urn_isbn_978-952-61-0310-5.pdf.
- Kärkkäinen MK, Tuppurainen M, Salovaara K, Sandini L, Rikkonen T, Sirola J, et al. Does daily vitamin D 800 IU and calcium 1000 mg supplementation decrease the risk of falling in ambulatory women aged 65-71 years? A 3-year randomized population-based trial (OSTPRE-FPS). Maturitas 2010;65(4):359-65. [MEDLINE: ] [DOI] [PubMed] [Google Scholar]
- Salovaara K, Tuppurainen M, Kärkkäinen M, Rikkonen T, Sandini L, Sirola J, et al. Effect of vitamin D(3) and calcium on fracture risk in 65- to 71-year-old women: a population-based 3-year randomized, controlled trial--the OSTPRE-FPS. Journal of Bone & Mineral Research 2010;25(7):1487-95. [DOI] [PubMed] [Google Scholar]
Kemmler 2010 {published and unpublished data}
- Kemmler W, Stengel S, Engelke K, Haberle L, Kalender WA. Exercise effects on bone mineral density, falls, coronary risk factors, and health care costs in older women: the randomized controlled senior fitness and prevention (SEFIP) study. Archives of Internal Medicine 2010;170(2):179-85. [DOI] [PubMed] [Google Scholar]
- Kemmler W, Stengel S, Engelke K, Haberle L, Mayhew JL, Kalender WA. Exercise, body composition, and functional ability: a randomized controlled trial. American Journal of Preventive Medicine 2010;38(3):279-87. [DOI] [PubMed] [Google Scholar]
- Kemmler W, Stengel S, Engelke K, Kalender WA. Exercise decreases the risk of metabolic syndrome in elderly females. Medicine & Science in Sports & Exercise 2009;41(2):297-305. [DOI] [PubMed] [Google Scholar]
- NCT00267839. Effect of exercise on risk-factors of elderly women. clinicaltrials.gov/show/NCT00267839 (accessed 30 November 2011).
Kenny 2001 {published data only}
- Kenny RA, Richardson DA, Steen N, Bexton RS, Shaw FE, Bond J. Carotid sinus syndrome: a modifiable risk factor for nonaccidental falls in older adults (SAFE PACE). Journal of the American College of Cardiology 2001;38(5):1491-6. [MEDLINE: ] [DOI] [PubMed] [Google Scholar]
- Kenny RA, Richardson DA. Carotid sinus syndrome and falls in older adults. American Journal of Geriatric Cardiology 2001;10(2):97-9. [MEDLINE: ] [DOI] [PubMed] [Google Scholar]
- Kenny RA, Seifer CM. SAFE PACE - Syncope and falls in the elderly - pacing and carotid sinus evaluation: a randomised controlled trial of cardiac pacing in older patients with falls and carotid sinus hypersensitivity. American Journal of Geriatric Cardiology 1999;8(2):87-90. [PubMed] [Google Scholar]
- Richardson DA, Steen N, Bond J, Bexton R, Kenny RA. Cardiac pacing reduces falls in carotid sinus hypersensitivity [abstract]. Age and Ageing 2000;29(Suppl 1):46. [Google Scholar]
Kingston 2001 {published data only}
- Kingston P, Jones M, Crome P. A RCT of health visitor (HV) intervention in falls [abstract]. Age and Ageing 2001;30(Suppl 1):40. [Google Scholar]
- Kingston P, Jones M, Lally F, Crome P. Older people and falls: A randomized controlled trial of a health visitor (HV) intervention. Reviews in Clinical Gerontology 2001;11(3):209-14. [EMBASE: 2002061828] [Google Scholar]
- Kingston PA. Older people and 'falls' a randomised control trial of health visitor intervention [thesis]. Stoke-on-Trent (UK): Keele University, 1998. [Google Scholar]
- N0498009612. Elderly people and accidents: a prospective analysis of accidental causation among elderly populations and their post discharge requirements. National Research Register (NRR) Archive. www.nihr.ac.uk/Pages/NRRArchiveSearch.aspx (accessed 23 February 2011). [NRR Publication ID: N0498009612]
Korpelainen 2006 {published data only}
- Korpelainen R, Keinanen-Kiukaanniemi S, Heikkinen J, Vaananen K, Korpelainen J. Effect of exercise on extraskeletal risk factors for hip fractures in elderly women with low BMD: a population-based randomized controlled trial. Journal of Bone & Mineral Research 2006;21(5):772-9. [MEDLINE: ] [DOI] [PubMed] [Google Scholar]
- Korpelainen R, Keinanen-Kiukaanniemi S, Heikkinen J, Vaananen K, Korpelainen J. Effect of impact exercise on bone mineral density in elderly women with low BMD: a population-based randomized controlled 30-month intervention. Osteoporosis International 2006;17(1):109-18. [MEDLINE: ] [DOI] [PubMed] [Google Scholar]
- Korpelainen R, Keinanen-Kiukaanniemi S, Nieminen P, Heikkinen J, Vaananen K, Korpelainen J. Long-term outcomes of exercise: follow-up of a randomized trial in older women with osteopenia. Archives of Internal Medicine 2010;170(17):1548-56. [MEDLINE: ] [DOI] [PubMed] [Google Scholar]
- NCT00655577. Exercise and prevention of hip fractures. clinicaltrials.gov/show/NCT00655577 (accessed 31 August 2011).
Lannin 2007 {published data only}
- Lannin NA, Clemson L, McCluskey A, Lin CW, Cameron ID, Barras S. Feasibility and results of a randomised pilot-study of pre-discharge occupational therapy home visits. BMC Health Services Research 2007;7:42. [MEDLINE: ] [DOI] [PMC free article] [PubMed] [Google Scholar]
Latham 2003 {published data only}
- Latham NK, Anderson CS, Lee A, Bennett DA, Moseley A, Cameron ID. A randomized, controlled trial of quadriceps resistance exercise and vitamin D in frail older people: The Frailty Interventions Trial in Elderly Subjects (FITNESS). Journal of the American Geriatrics Society 2003;51:291-9. [MEDLINE: ] [DOI] [PubMed] [Google Scholar]
Li 2005 {published data only}
- Li F, Harmer P, Fisher KJ, McAuley E, Chaumeton N, Eckstrom E, et al. Tai Chi and fall reductions in older adults: a randomized controlled trial. The Journals of Gerontology. Series A, Biological Sciences and Medical Sciences 2005;60(2):187-94. [MEDLINE: ] [DOI] [PubMed] [Google Scholar]
- Li F, Harmer P, Fisher KJ, McAuley E. Tai Chi: improving functional balance and predicting subsequent falls in older persons. Medicine and Science in Sports and Exercise 2004;36(12):2046-52. [MEDLINE: ] [DOI] [PubMed] [Google Scholar]
Lightbody 2002 {published data only}
- Lightbody E, Watkins C, Leathley M, Sharma A, Lye M. Evaluation of a nurse-led falls prevention programme versus usual care: a randomized controlled trial. Age and Ageing 2002;31(3):203-10. [MEDLINE: ] [DOI] [PubMed] [Google Scholar]
- N0500000414. Fallers attending casualty. National Research Register (NRR) Archive. www.nihr.ac.uk/Pages/NRRArchiveSearch.aspx (accessed 23 February 2011). [NRR Publication ID: N0500000414]
Lin 2007 {published and unpublished data}
- Lin MR, Wolf SL, Hwang HF, Gong SY, Chen CY. A randomized, controlled trial of fall prevention programs and quality of life in older fallers. Journal of the American Geriatrics Society 2007;55(4):499-506. [MEDLINE: ] [DOI] [PubMed] [Google Scholar]
Liu‐Ambrose 2004 {published data only}
- Liu-Ambrose T, Khan KM, Eng JJ, Lord SR, McKay HA. Balance confidence improves with resistance or agility training: Increase is not correlated with objective changes in fall risk and physical abilities. Gerontology 2004;50(6):373-82. [MEDLINE: ] [DOI] [PMC free article] [PubMed] [Google Scholar]
- Liu-Ambrose T, Khan KM, Eng JJ, Lord SR, McKay HA. Strength or agility training significantly reduces fall risk compared to posture training in 75 to 85 year old women with low bone density: a six month RCT [abstract]. XVI th conference of the International Society for Postural and Gait Research; 2003 March 23-27;Sydney (Australia).
- Liu-Ambrose TY, Khan KM, Eng JJ, Gillies GL, Lord SR, McKay HA. The beneficial effects of group-based exercises on fall risk profile and physical activity persist 1 year postintervention in older women with low bone mass: follow-up after withdrawal of exercise. Journal of the American Geriatrics Society 2005;53(10):1767-73. [MEDLINE: ] [DOI] [PMC free article] [PubMed] [Google Scholar]
- Lui-Ambrose T, Khan KM, Eng JJ, Janssen PA, Lord SR, McKay HA. Resistance and agility training reduce fall risk in women aged 75 to 85 with low bone mass: a 6-month randomized, controlled trial. Journal of the American Geriatrics Society 2004;52(5):657-65. [MEDLINE: ] [DOI] [PMC free article] [PubMed] [Google Scholar]
Liu‐Ambrose 2008 {published data only}
- Davis J, Guy P, Liu-Ambrose T, Donaldson M, Robertson M, Khan K, et al. Cost-effectiveness analysis of the Otago home-based strength and balance retraining in senior fallers [abstract]. Journal of Nutrition, Health & Aging 2009;13(Suppl 1):S436. [DOI: 10.1007/s12603-009-0095-9] [DOI] [Google Scholar]
- Donaldson MG. Falls risk in frail seniors: clinical and methodological studies [thesis]. Vancouver (CA): Univ. of British Columbia, 2007. [Google Scholar]
- Liu-Ambrose T, Donaldson MG, Ahamed Y, Graf P, Cook WL, Close J, et al. Otago home-based strength and balance retraining improves executive functioning in older fallers: a randomized controlled trial. Journal of the American Geriatrics Society 2008;56(10):1821-30. [DOI] [PubMed] [Google Scholar]
- NCT00323596. Trial of a home based strength and balance retraining program in reducing falls risk factors. clinicaltrials.gov/show/NCT00323596 (accessed 31 August 2011).
Logan 2010 {published data only}10538608
- ISRCTN10538608. Evaluation of the costs and benefits of computerised on-scene decision support for emergency ambulance personnel to assess and plan appropriate care for older people who have fallen: a randomised controlled trial. controlled-trials.com/ISRCTN10538608 (accessed 23 September 2011).
- Logan PA, Coupland CA, Gladman JR, Sahota O, Stoner-Hobbs V, Robertson K, et al. Community falls prevention for people who call an emergency ambulance after a fall: randomised controlled trial. BMJ 2010;340:c2102. [MEDLINE: ] [DOI] [PMC free article] [PubMed] [Google Scholar]
- N0171168738. An evaluation of the Primary Care falls prevention services for older fallers presenting to the ambulance service. National Research Register (NRR) Archive. www.nihr.ac.uk/Pages/NRRArchiveSearch.aspx (accessed 30 November 2011). [NRR Publication ID: N0171168738]
Logghe 2009 {published data only}98840266
- Logghe IH, Verhagen AP, Rademaker AC, Zeeuwe PE, Bierma-Zeinstra SM, Rossum E, et al. Explaining the ineffectiveness of a Tai Chi fall prevention training for community-living older people: A process evaluation alongside a randomized clinical trial (RCT). Archives of Gerontology & Geriatrics 2011;52(3):357-62. [DOI] [PubMed] [Google Scholar]
- Logghe IH, Zeeuwe PE, Verhagen AP, Wijnen-Sponselee RM, Willemsen SP, Bierma-Zeinstra SM, et al. Lack of effect of Tai Chi Chuan in preventing falls in elderly people living at home: a randomized clinical trial. Journal of the American Geriatrics Society 2009;57(1):70-5. [DOI] [PubMed] [Google Scholar]
- Zeeuwe PE, Verhagen AP, Bierma-Zeinstra SM, Van Rossum E, Faber MJ, Koes BW. The effect of Tai Chi Chuan in reducing falls among elderly people: design of a randomized clinical trial in the Netherlands [ISRCTN98840266]. BMC Geriatrics 2006;6:6. [MEDLINE: ] [DOI] [PMC free article] [PubMed] [Google Scholar]
Lord 1995 {published data only}
- Lord SR, Ward JA, Williams P, Strudwick M. The effect of a 12-month exercise trial on balance, strength, and falls in older women: a randomized controlled trial. Journal of the American Geriatrics Society 1995;43:1198-206. [MEDLINE: ] [DOI] [PubMed] [Google Scholar]
- Lord SR, Ward JA, Williams P, Zivanovic E. The effects of a community exercise program on fracture risk factors in older women. Osteoporosis International 1996;6(5):361-7. [MEDLINE: ] [DOI] [PubMed] [Google Scholar]
Lord 2003 {published data only}
- Lord SR, Castell S, Corcoran J, Dayhew J, Matters B, Shan A, et al. The effect of group exercise on physical functioning and falls in frail older people living in retirement villages: a randomized, controlled trial. Journal of the American Geriatrics Society 2003;51(12):1685-92. [MEDLINE: ] [DOI] [PubMed] [Google Scholar]
Lord 2005 {published data only}
- Lord SR, Tiedemann A, Chapman K, Munro B, Murray SM, Gerontology M, et al. The effect of an individualized fall prevention program on fall risk and falls in older people: a randomized, controlled trial. Journal of the American Geriatrics Society 2005;53(8):1296-304. [MEDLINE: ] [DOI] [PubMed] [Google Scholar]
Luukinen 2007 {published data only}
- Luukinen H, Lehtola S, Jokelainen J, Vaananen-Sainio R, Lotvonen S, Koistinen P. Pragmatic exercise-oriented prevention of falls among the elderly: A population-based, randomized, controlled trial. Preventive Medicine 2007;44(3):265-71. [MEDLINE: ] [DOI] [PubMed] [Google Scholar]
- Luukinen H, Lehtola S, Jokelainen J, Vaananen-Sainio R, Lotvonen S, Koistinen P. Prevention of disability by exercise among the elderly: a population-based, randomized, controlled trial. Scandinavian Journal of Primary Health Care 2006;24(4):199-205. [MEDLINE: ] [DOI] [PubMed] [Google Scholar]
Madureira 2010 {published data only}
- Madureira MM, Bonfa E, Takayama L, Pereira RM. A 12-month randomized controlled trial of balance training in elderly women with osteoporosis: improvement of quality of life. Maturitas 2010;66(2):206-11. [MEDLINE: ] [DOI] [PubMed] [Google Scholar]
- Madureira MM, Pereira RMR. A 12-month randomized controlled trial of balance training in elderly women with osteoporosis: Improvement of quality of life and reduction of falls [abstract]. Arthritis and Rheumatism 2009;60(10 Suppl):1496. [EMBASE: 70372871] [DOI] [PubMed] [Google Scholar]
- Madureira MM, Takayama L, Gallinaro AL, Caparbo VF, Costa RA, Pereira RM. Balance training program is highly effective in improving functional status and reducing the risk of falls in elderly women with osteoporosis: a randomized controlled trial. Osteoporosis International 2007;18(4):419-25. [MEDLINE: ] [DOI] [PMC free article] [PubMed] [Google Scholar]
Mahoney 2007 {published data only}
- Gleason CE, Gangnon RE, Fischer BL, Mahoney JE. Increased risk for falling associated with subtle cognitive impairment: secondary analysis of a randomized clinical trial. Dementia & Geriatric Cognitive Disorders 2009;27(6):557-63. [MEDLINE: ] [DOI] [PMC free article] [PubMed] [Google Scholar]
- Mahoney JE, Shea TA, Przybelski R, Jaros L, Gangnon R, Cech S, et al. Kenosha County falls prevention study: a randomized, controlled trial of an intermediate-intensity, community-based multifactorial falls intervention. Journal of the American Geriatrics Society 2007;55(4):489-98. [MEDLINE: ] [DOI] [PubMed] [Google Scholar]
Markle‐Reid 2010 {published data only}
- Markle-Reid M, Browne G, Gafni A, Roberts J, Weir R, Thabane L, et al. The effects and costs of a multifactorial and interdisciplinary team approach to falls prevention for older home care clients 'at risk' for falling: a randomized controlled trial. Canadian Journal of Aging 2010;29(1):139-61. [DOI] [PubMed] [Google Scholar]
- Markle-Reid M, Miles M, Vaitonis V, Henderson S, Browne Weir R, et al. From Isolation to Integration: the Effects and Costs of a Multifactorial and Interdisciplinary Team Approach to Falls Prevention for Frail Older Home Care Clients. Final Research Report. Edmonton: Canadian Patient Safety Institute, 2008. [Google Scholar]
- NCT00463658. Interdisciplinary falls prevention for seniors. clinicaltrials.gov/show/NCT00463658 (accessed 31 August 2011).
McKiernan 2005 {published data only}
- McKiernan FE. A simple gait-stabilizing device reduces outdoor falls and nonserious injurious falls in fall-prone older people during the winter. Journal of the American Geriatrics Society 2005;53(6):943-7. [MEDLINE: ] [DOI] [PubMed] [Google Scholar]
McMurdo 1997 {published data only}
- McMurdo ME, Mole PA, Paterson CR. Controlled trial of weight bearing exercise in older women in relation to bone density and falls. BMJ 1997;314(7080):596. [MEDLINE: ] [DOI] [PMC free article] [PubMed] [Google Scholar]
McMurdo 2009 {published data only}
- McMurdo ME, Price RJ, Shields M, Potter J, Stott DJ. Should oral nutritional supplementation be given to undernourished older people upon hospital discharge? A controlled trial. Journal of the American Geriatrics Society 2009;57(12):2239-45. [DOI] [PubMed] [Google Scholar]
Means 2005 {published data only}
- Means KM, Rodell DE, O'Sullivan PS. Balance, mobility, and falls among community-dwelling elderly persons: effects of a rehabilitation exercise program. American Journal of Physical Medicine and Rehabilitation 2005;84(4):238-50. [MEDLINE: ] [DOI] [PubMed] [Google Scholar]
Meredith 2002 {published data only}
- Meredith S, Feldman P, Frey D, Giammarco L, Hall K, Arnold K, et al. Improving medication use in newly admitted home healthcare patients: a randomized controlled trial. Journal of the American Geriatrics Society 2002;50(9):1484-91. [MEDLINE: ] [DOI] [PubMed] [Google Scholar]
Morgan 2004 {published data only}
- DeVito CA, Morgan RO, Duque M, Abdel-Moty E, Virnig BA. Physical performance effects of low-intensity exercise among clinically defined high-risk elders. Gerontology 2003;49(3):146-54. [MEDLINE: ] [DOI] [PubMed] [Google Scholar]
- Morgan RO, Virnig BA, Duque M, Abdel-Moty E, DeVito CA. Low-intensity exercise and reduction of the risk for falls among at-risk elders. Journals of Gerontology. Series A, Biological Sciences and Medical Sciences 2004;59(10):1062-7. [MEDLINE: ] [DOI] [PubMed] [Google Scholar]
- NCT00013078. Safe-Grip fall/injuries intervention: a randomized controlled trial. clinicaltrials.gov/show/NCT00013078 (accessed 2 September 2011).
Newbury 2001 {published data only}
- Newbury J, Marley J. Preventive home visits to elderly people in the community. Visits are most useful for people aged >75 [letter]. BMJ 2000;321(7529):512. [PMC free article] [PubMed] [Google Scholar]
- Newbury JW, Marley JE, Beilby J. A randomised controlled trial of the outcome of health assessment of people aged 75 years and over. Medical Journal of Australia 2001;175(2):104-7. [MEDLINE: ] [DOI] [PubMed] [Google Scholar]
Nikolaus 2003 {published data only}
- Nikolaus T, Bach M. Preventing falls in community-dwelling frail older people using a home intervention team (HIT): Results from the randomized falls-HIT trial. Journal of the American Geriatrics Society 2003;51(3):300-5. [MEDLINE: ] [DOI] [PubMed] [Google Scholar]
- Nikolaus T, Specht-Leible N, Bach M, Wittmann-Jennewein C, Oster P, Schlierf G. Effectiveness of hospital-based geriatric evaluation and management and home intervention team (GEM-HIT). Rationale and design of a 5-year randomized trial. Zeitschrift fur Gerontologie und Geriatrie 1995;28(1):47-53. [MEDLINE: ] [PubMed] [Google Scholar]
Nitz 2004 {published and unpublished data}
- Nitz JC, Choy NL. The efficacy of a specific balance-strategy training programme for preventing falls among older people: a pilot randomised controlled trial. Age and Ageing 2004;33(1):52-8. [MEDLINE: ] [DOI] [PubMed] [Google Scholar]
- Nitz JC. personal communication May 6 2005.
Pardessus 2002 {published data only}
- Pardessus V, Puisieux F, Di P, Gaudefroy C, Thevenon A, Dewailly P. Benefits of home visits for falls and autonomy in the elderly: A randomized trial study. American Journal of Physical Medicine and Rehabilitation 2002;81(4):247-52. [MEDLINE: ] [DOI] [PubMed] [Google Scholar]
Parry 2009 {published data only}
- Parry SW, Steen N, Bexton RS, Tynan M, Kenny RA. Pacing in elderly recurrent fallers with carotid sinus hypersensitivity: a randomised, double-blind, placebo controlled crossover trial. Heart 2009;95(5):405-9. [MEDLINE: ] [DOI] [PubMed] [Google Scholar]
Pereira 1998 {published data only}
- Kriska AM, Bayles C, Cauley JA, LaPorte RE, Sandler RB, Pambianco G. A randomized exercise trial in older women: increased activity over two years and the factors associated with compliance. Medicine and Science in Sports and Exercise 1986;18(5):557-62. [EMBASE: 1987035259] [PubMed] [Google Scholar]
- Pereira MA, Kriska AM, Day RD, Cauley JA, LaPorte RE, Kuller LH. A randomized walking trial in postmenopausal women: effects on physical activity and health 10 years later. Archives of Internal Medicine 1998;158(15):1695-701. [MEDLINE: ] [DOI] [PubMed] [Google Scholar]
- Pereira MA. Ten year follow-up of a randomized exercise trial in post-menopausal women [thesis]. Pittsburgh (USA): Univ. of Pittsburgh, 1996. [Proquest Digital Dissertations Publication Number AAT 97 16627] [Google Scholar]
Perry 2008 {published data only}
- Perry SD, Radtke A, McIlroy WE, Fernie GR, Maki BE. Efficacy and effectiveness of a balance-enhancing insole. Journals of Gerontology Series A-Biological Sciences & Medical Sciences 2008;63(6):595-602. [DOI] [PubMed] [Google Scholar]
Pfeifer 2000 {published data only}
- Minne HW, Pfeifer M, Begerow B, Nachtigall D, Hansen C. Vitamin D and calcium supplementation reduces falls in elderly women via improvement of body sway and normalisation of blood pressure; a prospective, randomised, and double-blind study [abstract]. Osteoporosis International 2000;11(Suppl 2):S115. [Google Scholar]
- Pfeifer M, Begerow B, Minne HW, Abrams C, Nachtigall D, Hansen C. Effects of a short-term vitamin D and calcium supplementation on body sway and secondary hyperparathyroidism in elderly women. Journal of Bone and Mineral Research 2000;15(6):1113-8. [MEDLINE: ] [DOI] [PubMed] [Google Scholar]
- Pfeifer M, Begerow B, Nachtigall D, Hansen C. Prevention of falls-related fractures: vitamin D reduces body sway in the elderly - a prospective, randomized, double blind study [abstract]. Bone 1998;23(5 Suppl 1):1110. [Google Scholar]
Pfeifer 2009 {published data only}
- Minne HW, Dobnig H, Pfeifer M, Suppan K. Effects of vitamin D and calcium supplementation on falls and parameters of muscle function: a prospective, randomized, double-blind multicenter study [abstract]. Osteoporosis International 2006;17(Suppl 2):S212. [DOI] [PubMed] [Google Scholar]
- Minne HW, Dobnig H, Pfeifer M, Suppan K. Effects of vitamin D and calcium supplementation on falls and parameters of muscle-function - a prospective, randomized, double-blind multi-center study [abstract]. Osteoporosis International 2006;17(Suppl 1):S21. [DOI] [PubMed] [Google Scholar]
- Pfeifer M, Begerow B, Minne HW, Suppan K, Fahrleitner-Pammer A, Dobnig H. Effects of a long-term vitamin D and calcium supplementation on falls and parameters of muscle function in community-dwelling older individuals. Osteoporosis International 2009;20(2):315-22. [MEDLINE: ] [DOI] [PubMed] [Google Scholar]
- Pfeifer M, Dobnig H, Begerow B, Suppan K. Effects of vitamin D and calcium supplementation on falls and parameters of muscle function: a prospective randomized, double-blind multi-centre study [abstract]. Journal of Bone and Mineral Research 2004;19(Suppl 1):S58. [Google Scholar]
- Pfeifer M, Dobnig H, Minne HW, Suppan K. Effects of vitamin D and calcium supplementation on falls and parameters of muscle function - a prospective, randomized, double-blind multi-center study [abstract]. Osteoporosis International 2005;16(Suppl 3):S45. [DOI] [PubMed] [Google Scholar]
- Pfeifer M, Dobnig H, Minne HW, Suppan K. The effects of a supplementation with vitamin D and calcium on falls and muscle function parameters in older people - Results of a prospective, randomised, double-blind multi-centre study [abstract] [Die Wirkungen einer Vitamin-D- und Calcium-Supplementation auf Sturze und Parameter der Muskelfunktion beim alteren Menschen - Ergebnisse einer prospektiven, randomisierten, doppelblinden Multi-center-Studie]. Medizinische Klinik 2005;100:28. [Google Scholar]
Pighills 2011 {published data only}
- ISRCTN07575807. Reducing home hazards to prevent falls in older people. controlled-trials.com/ISRCTN07575807 (accessed 30 November 2011).
- Pighills A, Torgerson DJ, Sheldon T. Publicity does not increase recruitment to falls prevention trials: the results of two quasi-randomized trials. Journal of Clinical Epidemiology 2009;62(12):1332-5. [DOI] [PubMed] [Google Scholar]
- Pighills AC, Torgerson DJ, Sheldon TA, Drummond AE, Bland JM. Environmental assessment and modification to prevent falls in older people. Journal of the American Geriatrics Society 2011;59(1):26-33. [MEDLINE: ] [DOI] [PubMed] [Google Scholar]
Pit 2007 {published data only}
- Pit SW, Byles JE, Henry DA, Holt L, Hansen V, Bowman DA. A Quality Use of Medicines program for general practitioners and older people: a cluster randomised controlled trial. Medical Journal of Australia 2007;187(1):23-30. [MEDLINE: ] [DOI] [PubMed] [Google Scholar]
Porthouse 2005 {published and unpublished data}
- Cochayne S. personal communication August 16 2005.
- Porthouse J, Cochayne S, King C, Saxon L, Steele E, Aspray T, et al. Randomised controlled trial of calcium and supplementation with cholecalciferol (vitamin D3) for prevention of fractures in primary care. BMJ 2005;330(7498):1003. [MEDLINE: ] [DOI] [PMC free article] [PubMed]
- Porthouse J, Cockayne S, King C, Saxon L, Steele E, Aspray T. Randomised controlled trial of calcium and vitamin D supplementation for fracture prevention in primary care [abstract]. Osteoporosis.International. 2005;16(Suppl 3):S27. [DOI] [PMC free article] [PubMed] [Google Scholar]
- Porthouse J, Cockayne S, King C, Saxon L, Steele E, Aspray T. Randomised controlled trial of calcium and vitamin D supplementation for fracture prevention in primary care [abstract]. Osteoporosis International 2004;15(Suppl 2):S13. [Google Scholar]
- Puffer S. Calcium and vitamin D in primary care. Compliance results from a randomised controlled trial [abstract]. Osteoporosis International 2003;14(Suppl 4):S8. [Google Scholar]
Prince 2008 {published data only}
- ACTRN12606000331538. Effects of vitamin D and calcium on bone and falls in an elderly population of Australian women selected for their history of falling. www.anzctr.org.au/trial_view.aspx?ID=1486 (accessed 30 November 2011).
- Prince RL, Austin N, Devine A, Dick IM, Bruce D, Zhu K. Effects of ergocalciferol added to calcium on the risk of falls in elderly high-risk women. Archives of Internal Medicine 2008;168(1):103-8. [MEDLINE: ] [DOI] [PubMed] [Google Scholar]
Ralston 2011 {published data only}
- Ralston SH, Binkley N, Boonen S, Kiel DP, Reginster J-Y, Roux C, et al. Randomized trial of alendronate plus vitamin D3 versus standard care in osteoporotic postmenopausal women with vitamin D insufficiency. Calcified Tissue International 2011;88(6):485-94. [DOI] [PubMed] [Google Scholar]
Reid 2006 {published data only}
- Bolland MJ, Bacon CJ, Horne AM, Mason BH, Ames RW, Wang TK, et al. Vitamin D insufficiency and health outcomes over 5 y in older women. American Journal of Clinical Nutrition 2010;91(1):82-9. [DOI] [PubMed] [Google Scholar]
- Bolland MJ, Barber PA, Doughty RN, Mason B, Horne A, Ames R, et al. Vascular events in healthy older women receiving calcium supplementation: randomised controlled trial. BMJ 2008;336(7638):262-6. [DOI] [PMC free article] [PubMed] [Google Scholar]
- Reid IR, Bolland MJ. Calcium supplementation and vascular disease. Climacteric 2008;11(4):280-6. [DOI] [PubMed] [Google Scholar]
- Reid IR, Mason B, Horne A, Ames R, Reid HE, Bava U, et al. Randomized controlled trial of calcium in healthy older women. American Journal of Medicine 2006;119(9):777-85. [DOI] [PubMed] [Google Scholar]
Reinsch 1992 {published data only}
- El-Faizy M, Reinsch S. Home safety intervention for the prevention of falls. Physical & Occupational Therapy in Geriatrics 1994;12(3):33-49. [EMBASE: 1994365778] [Google Scholar]
- MacRae PG, Feltner ME, Reinsch S. A 1-year exercise program for older women: effects on falls, injuries, and physical performance. Journal of Aging and Physical Activity 1994;2:127-42. [Google Scholar]
- Reinsch S, MacRae P, Lachenbruch PA, Tobis JS. Attempts to prevent falls and injury: a prospective community study. Gerontologist 1992;32:450-6. [MEDLINE: ] [DOI] [PubMed] [Google Scholar]
- Tobis J, Reinsch S, McRae P, Lachenbruch T. Experimental intervention at senior centres for the prevention of falls [abstract]. Journal of the American Geriatrics Society 1990;38(8):A28. [Google Scholar]
Resnick 2002 {published data only}
- Resnick B. Testing the effect of the WALC intervention on exercise adherence in older adults. Journal of Gerontological Nursing 2002;28(6):40-9. [MEDLINE: ] [DOI] [PubMed] [Google Scholar]
Robertson 2001a {published and unpublished data}
- Gardner MM, Buchner DM, Robertson MC, Campbell AJ. Practical implementation of an exercise-based falls prevention programme. Age and Ageing 2001;30(1):77-83. [MEDLINE: ] [DOI] [PubMed] [Google Scholar]
- Robertson MC, Campbell AJ, Gardner MM, Devlin N. Preventing injuries in older people by preventing falls: a meta-analysis of individual-level data. Journal of the American Geriatrics Society 2002;50(5):905-11. [MEDLINE: ] [DOI] [PubMed] [Google Scholar]
- Robertson MC, Devlin N, Gardner MM, Campbell AJ. Effectiveness and economic evaluation of a nurse delivered home exercise programme to prevent falls. 1: Randomised controlled trial. BMJ 2001;322(7288):697-701. [MEDLINE: ] [DOI] [PMC free article] [PubMed] [Google Scholar]
- Robertson MC. Development of a falls prevention programme for elderly people: evaluation of efficacy, effectiveness, and efficiency [thesis]. Dunedin (NZ): Univ. of Otago, 2001. [Google Scholar]
Robson 2003 {published data only}
- Robson E, Edwards J, Gallagher E, Baker D. Steady as you go (SAYGO): A falls-prevention program for seniors living in the community. Canadian Journal on Aging 2003;22(2):207-16. [EMBASE: 2003344777] [Google Scholar]
Rubenstein 2000 {published data only}
- Rubenstein LZ, Josephson KR, Trueblood PR , Loy S, Harker JO, Pietruszka FM, et al. Effects of a group exercise program on strength, mobility, and falls among fall-prone elderly men. Journals of Gerontology. Series A, Biological Sciences and Medical Sciences 2000;55(6):M317-21. [MEDLINE: ] [DOI] [PubMed] [Google Scholar]
Rubenstein 2007 {published and unpublished data}
- Alessi C. personal communication June 10 2007.
- Josephson K. personal communication November 20 2007.
- Rubenstein LZ, Alessi CA, Josephson KR, Trinidad Hoyl M, Harker JO, Pietruszka FM. A randomized trial of a screening, case finding, and referral system for older veterans in primary care. Journal of the American Geriatrics Society 2007;55(2):166-74. [MEDLINE: ] [DOI] [PubMed] [Google Scholar]
Russell 2010 {published data only}
- ACTRN12605000672651. A randomised controlled trial to reduce further falls and injuries for older fallers presenting to an Emergency Department. www.anzctr.org.au/trial_view.aspx?ID=849 (accessed 14 September 2011).
- Hill K, Womer M, Russell M, Blackberry I, McGann A. Fear of falling in older fallers presenting at emergency departments. Journal of Advanced Nursing 2010;66(8):1769-79. [DOI] [PubMed] [Google Scholar]
- NCT00217360. RCT to reduce further falls and injuries for older fallers presenting to an Emergency Department. clinicaltrials.gov/ct2/show/NCT00217360 (accessed 14 September 2011).
- Russell MA, Hill KD, Day LM, Blackberry I, Schwartz J, Giummarra MJ, et al. A randomized controlled trial of a multifactorial falls prevention intervention for older fallers presenting to Emergency Departments. Journal of the American Geriatrics Society 2010;58:2265–74. [DOI] [PubMed] [Google Scholar]
Ryan 1996 {published data only}
- Ryan JW, Spellbring AM. Implementing strategies to decrease risk of falls in older women. Journal of Gerontological Nursing 1996;22(12):25-31. [MEDLINE: ] [DOI] [PubMed] [Google Scholar]
Ryan 2010 {published data only}
- Kenny RA, Seifer C. SAFE PACE 2: Syncope and falls in the elderly pacing and carotid sinus evaluation: A randomized control trial of cardiac pacing in older patients with falls and carotid sinus hypersensitivity. American Journal of Geriatric Cardiology 1999;8(2):87. [EMBASE: 1999111785] [PubMed] [Google Scholar]
- Kenny RA. SAFE PACE 2: Syncope and falls in the elderly - Pacing and carotid sinus evaluation - A randomized controlled trial of cardiac pacing in older patients with falls and carotid sinus hypersensitivity. Europace 1999;1(1):69-72. [PMID: 11220545 ] [DOI] [PubMed] [Google Scholar]
- M0021042314. Syncope and falls in the elderly - Pacing and carotid sinus evaluation: a randomised control trial of cardiac pacing in older patients with falls and carotid sinus hypersensitivity. National Research Register (NRR) Archive. www.nihr.ac.uk/Pages/NRRArchiveSearch.aspx (accessed 23 February 2011). [NRR Publication ID: M0021042314]
- N0123090677. SAFE PACE 2 - Syncope and falls in the elderly - pacing and carotid sinus evaluation: a randomised control trial of cardiac pacing in older patients with falls and carotid sinus hypersensitivity. National Research Register (NRR) Archive. www.nihr.ac.uk/Pages/NRRArchiveSearch.aspx (accessed 23 February 2011). [NRR Publication ID: N0123090677 ]
- N0183041329. SAFE PACE 2 trial R&D ref 99/66 Syncope and falls in the elderly - pacing and carotid sinus evaluation randomised control trial of cardiac pacing in older patients with falls and carotid sinus hypersensitivity. National Research register (NRR) archive. www.nihr.ac.uk/Pages/NRRArchiveSearch.aspx (accessed 30 November 2011). [NRR Publication ID: N0183041329]
- N0232077535. Syncope and falls in the elderly - pacing and carotid sinus evaluation: a randomised controlled trial of cardiac pacing in older patients with falls and carotid sinus hypersensitivity Safe Pace 2. National Research Register (NRR) Archive. www.nihr.ac.uk/Pages/NRRArchiveSearch.aspx (accessed 23 February 2011). [NRR Publication ID: N0232077535]
- N0263052736. A randomised control trial of cardiac pacing in older patients with falls and carotid sinus hypersensitivity. National Research Register (NRR) Archive. www.nihr.ac.uk/Pages/NRRArchiveSearch.aspx (accessed 23 February 2011). [NRR Publication ID: N0263052736]
- N0277056223. SAFE PACE 2 - Syncope and falls in the elderly - pacing and carotid sinus evaluation: a randomised control trial of cardiac pacing in older patients with falls and carotid sinus hypersensitivity. National Research Register (NRR) Archive. www.nihr.ac.uk/Pages/NRRArchiveSearch.aspx (accessed 23 February 2011). [NRR Publication ID: N0277056223]
- N0504077783. SAFE PACE 2: Syncope and falls in the elderly - pacing and carotid sinus evaluation: A randomised controlled trial of cardiac pacing in older patients with falls and carotid sinus hypersensitivity. (SAFE PACE 2). National Research Register (NRR) Archive. www.nihr.ac.uk/Pages/NRRArchiveSearch.aspx (accessed 23 February 2011). [NRR Publication ID: N0504077783]
- Ryan DJ, Steen N, Seifer CM, Kenny RA. Carotid sinus syndrome, should we pace? A multicentre, randomised control trial (Safepace 2). Heart 2010;96(5):347-51. [DOI] [PubMed] [Google Scholar]
Salminen 2009 {published and unpublished data}
- Kivela S-L, Aarnio P, Asikainen E, Hyttinen H, Isoaho R, Karra E, et al. Prevention of injurious falls and fractures in ageing and aged population [abstract]. ProFaNE (Prevention of Falls Network Europe) meeting; 2004 June 11-13; Manchester (UK).
- NCT00247546. Prevention of falls and injurious falls among elderly people. clinicaltrials.gov/ct2/show/NCT00247546 (accessed 14 September 2011).
- Salminen M, Vahlberg T, Kivela SL. The long-term effect of a multifactorial fall prevention programme on the incidence of falls requiring medical treatment. Public Health 2009;123(12):809-13. [MEDLINE: ] [DOI] [PubMed] [Google Scholar]
- Salminen M, Vahlberg T, Sihvonen S, Piirtola M, Isoaho R, Aarnio P, et al. Effects of risk-based multifactorial fall prevention program on maximal isometric muscle strength in community-dwelling aged: a randomized controlled trial. Aging-Clinical & Experimental Research 2008;20(5):487-93. [MEDLINE: ] [DOI] [PubMed] [Google Scholar]
- Salminen M, Vahlberg T, Sihvonen S, Sjosten N, Piirtola M, Isoaho R, et al. Effects of risk-based multifactorial fall prevention on postural balance in the community-dwelling aged: a randomized controlled trial. Archives of Gerontology & Geriatrics 2009;48(1):22-7. [MEDLINE: ] [DOI] [PubMed] [Google Scholar]
- Salminen MJ, Vahlberg TJ, Salonoja MT, Aarnio PT, Kivelä S-L. Falls data (as supplied 20 May 2008). Data on file.
- Salminen MJ, Vahlberg TJ, Salonoja MT, Aarnio PT, Kivela SL. Effect of a risk-based multifactorial fall prevention program on the incidence of falls. Journal of the American Geriatrics Society 2009;57(4):612-9. [MEDLINE: ] [DOI] [PubMed] [Google Scholar]
- Salonoja M, Salminen M, Aarnio P, Vahlberg T, Kivela SL. One-time counselling decreases the use of benzodiazepines and related drugs among community-dwelling older persons. Age & Ageing 2010;39(3):313-9. [MEDLINE: ] [DOI] [PubMed] [Google Scholar]
- Salonoja M, Salminen M, Vahlberg T, Aarnio P, Kivela S-L. Withdrawal of psychotropic drugs decreases the risk of falls requiring treatment. Archives of Gerontology and Geriatrics 2011;54(1):160-7. [DOI] [PubMed] [Google Scholar]
- Sjosten NM, Salonoja M, Piirtola M, Vahlberg T, Isoaho R, Hyttinen H, et al. A multifactorial fall prevention programme in home-dwelling elderly people: A randomized-controlled trial. Public Health 2007;121(4):308-18. [MEDLINE: ] [DOI] [PubMed] [Google Scholar]
- Sjosten NM, Salonoja M, Piirtola M, Vahlberg TJ, Isoaho R, Hyttinen HK, et al. A multifactorial fall prevention programme in the community-dwelling aged: predictors of adherence. European Journal of Public Health 2007;17(5):464-70. [MEDLINE: 17208952 ] [DOI] [PubMed] [Google Scholar]
- Sjosten NM, Vahlberg TJ, Kivela S-L. The effects of multifactorial fall prevention on depressive symptoms among the aged at increased risk of falling. International Journal of Geriatric Psychiatry 2008;23(5):504-10. [EMBASE: 2008251008] [DOI] [PubMed] [Google Scholar]
- Vaapio S, Salminen M, Vahlberg T, Kivela SL. Increased muscle strength improves managing in activities of daily living in fall-prone community-dwelling older women. Aging-Clinical & Experimental Research 2011;23(1):42-8. [DOI] [PubMed] [Google Scholar]
- Vaapio S, Salminen M, Vahlberg T, Sjosten N, Isoaho R, Aarnio P, et al. Effects of risk-based multifactorial fall prevention on health-related quality of life among the community-dwelling aged: a randomized controlled trial. Health & Quality of Life Outcomes 2007;5:20. [MEDLINE: ] [DOI] [PMC free article] [PubMed] [Google Scholar]
Sanders 2010 {published data only}83409867
- ACTRN12605000658617. Vitamin D intervention to prevent falls and fractures and to promote mental well-being. www.anzctr.org.au/trial_view.aspx?ID=767 (accessed 30 November 2011).
- Sanders K, Stuart A, Williamson E, Simpson J, Kotowicz M, Nicholson G. The efficacy of high-dose oral vitamin D3 administered once a year: A randomised, double-blind, placebo-controlled trial (vital D study) for falls and fractures in older women [abstract]. Osteoporosis International 2011;22:S104-5. [Google Scholar]
- Sanders K. personal communication November 29 2007.
- Sanders KM, Stuart AL, Kotowicz MA, Nicholson GC. Annual feedback is an effective tool for a sustained increase in calcium intake among older women. Nutrients. 2010;2(9):1018-25. [DOI] [PMC free article] [PubMed] [Google Scholar]
- Sanders KM, Stuart AL, Merriman EN, Read ML, Kotowicz MA, Young D, et al. Trials and tribulations of recruiting 2,000 older women onto a clinical trial investigating falls and fractures: Vital D study. BMC Medical Research Methodology 2009;9:78. [MEDLINE: ] [DOI] [PMC free article] [PubMed] [Google Scholar]
- Sanders KM, Stuart AL, Williamson EJ, Simpson JA, Kotowicz MA, Nicholson GC. Annual high-dose oral vitamin D for falls and fractures in elderly women: A randomised, double-blind, placebo-controlled trial (Vital D Study) [abstract]. Osteoporosis International 2010;21(Suppl 1):S30. [Google Scholar]
- Sanders KM, Stuart AL, Williamson EJ, Simpson JA, Kotowicz MA, Young D, et al. Annual high-dose oral vitamin D and falls and fractures in older women: a randomized controlled trial. [Erratum appears in JAMA 2010;303(23):2357]. JAMA 2010;303(18):1815-22. [MEDLINE: ] [DOI] [PubMed] [Google Scholar]
Sato 2005a (Retracted) {published data only}
- Sato Y, Kanoko T, Satoh K, Iwamoto J. Menatetrenone and vitamin D2 with calcium supplements prevent nonvertebral fracture in elderly women with Alzheimer's disease. Bone 2005;36(1):61-8. [MEDLINE: ] [DOI] [PubMed] [Google Scholar]
- Sato Y, Kanoko T, Satoh K, Iwamoto J. RETRACTED: Menatetrenone and vitamin D2 with calcium supplements prevent nonvertebral fracture in elderly women with Alzheimer's disease. Bone 2018;106:213. [MEDLINE: ] [DOI] [PubMed] [Google Scholar]
Schrijnemaekers 1995 {published data only}
- Schrijnemaekers VJ, Haveman MJ. Effects of preventive outpatient geriatric assessment: short-term results of a randomized controlled study. Home Health Care Services Quarterly 1995;15(2):81-97. [MEDLINE: ] [DOI] [PubMed] [Google Scholar]
Sherrington 2004 {published and unpublished data}
- Sherrington C, Lord SR, Herbert RD. A randomised controlled trial of weight-bearing versus non-weight-bearing exercise for improving physical ability after hip fracture and completion of usual care [abstract]. XVI th conference of the International Society for Postural and Gait Research; 2003 March 23-27;Sydney (Australia).
- Sherrington C, Lord SR, Herbert RD. A randomised trial of weight-bearing versus non-weight-bearing exercise for improving physical ability in inpatients after hip fracture. Australian Journal of Physiotherapy 2003;49(1):15-22. [MEDLINE: ] [DOI] [PubMed] [Google Scholar]
- Sherrington C, Lord SR, Herbert RD. A randomized controlled trial of weight-bearing versus non-weight-bearing exercise for improving physical ability after usual care for hip fracture. Archives of Physical Medicine and Rehabilitation 2004;85(5):710-6. [MEDLINE: ] [DOI] [PubMed] [Google Scholar]
- Sherrington C. Personal communication October 30 2004.
- Sherrington C. The effects of exercise on physical ability following fall-related hip fracture [thesis]. Sydney (Australia): Univ. of New South Wales, 2001. [Google Scholar]
Shigematsu 2008 {published data only}
- Shigematsu R, Okura T, Nakagaichi M, Tanaka K, Sakai T, Kitazumi S, et al. Square-stepping exercise and fall risk factors in older adults: a single-blind, randomized controlled trial. Journals of Gerontology Series A-Biological Sciences & Medical Sciences 2008;63(1):76-82. [MEDLINE: ] [DOI] [PubMed] [Google Scholar]
- Shigematsu R, Okura T, Sakai T, Rantanen T. Square-stepping exercise versus strength and balance training for fall risk factors. Aging-Clinical & Experimental Research 2008;20(1):19-24. [MEDLINE: ] [DOI] [PubMed] [Google Scholar]
Shumway‐Cook 2007 {published data only}
- Shumway-Cook A, Silver I, Mary L, York S, Cummings P, Koepsell T. The effectiveness of a community-based multifactorial intervention on falls and fall risk factors in community living older adults: a randomized, controlled trial... CSM 2007 [abstract]. Journal of Geriatric Physical Therapy 2006;29(3):117. [DOI] [PubMed] [Google Scholar]
- Shumway-Cook A, Silver IF, LeMier M, York S, Cummings P, Koepsell TD. Effectiveness of a community-based multifactorial intervention on falls and fall risk factors in community-living older adults: a randomized, controlled trial. Journals of Gerontology. Series A, Biological Sciences and Medical Sciences 2007;62(12):1420-7. [MEDLINE: ] [DOI] [PubMed]
Shyu 2010 {published data only}
- Shyu YI, Liang J, Wu CC, Cheng HS, Chen MC. An interdisciplinary intervention for older Taiwanese patients after surgery for hip fracture improves health-related quality of life. BMC Musculoskeletal Disorders 2010;11:225. [MEDLINE: ] [DOI] [PMC free article] [PubMed] [Google Scholar]
- Shyu YI, Liang J, Wu CC, Su JY, Cheng HS, Chou SW, et al. Interdisciplinary intervention for hip fracture in older Taiwanese: benefits last for 1 year. Journals of Gerontology Series A-Biological Sciences & Medical Sciences 2008;63(1):92-7. [MEDLINE: ] [DOI] [PubMed] [Google Scholar]
- Shyu YI, Liang J, Wu CC, Su JY, Cheng HS, Chou SW, et al. Two-year effects of interdisciplinary intervention for hip fracture in older Taiwanese. Journal of the American Geriatrics Society 2010;58(6):1081-9. [MEDLINE: ] [DOI] [PubMed] [Google Scholar]
Skelton 2005 {published data only}
- Skelton D, Dinan S, Campbell M, Rutherford O. Tailored group exercise (Falls Management Exercise -- FaME) reduces falls in community-dwelling older frequent fallers (an RCT). Age and Ageing 2005;34(6):636-9. [EMBASE: 2005539610] [DOI] [PubMed] [Google Scholar]
- Skelton D. personal communication February 1 2005.
- Skelton DA, Dinan SM, Campbell M, Rutherford OM. FaME (Falls Management Exercise): An RCT on the effects of a 9-month group exercise programme in frequently falling community dwelling women aged 65 and over [abstract]. Journal of Aging and Physical Activity 2004;12(3):457-8. [Google Scholar]
- Skelton DA, Dinan SM. Exercise for falls management: Rationale for an exercise programme aimed at reducing postural instability. Physiotherapy Theory and Practice 1999;15(2):105-20. [EMBASE: 1999232161] [Google Scholar]
- Skelton DA, Stranzinger K, Dinan S, Rutherford OM. BMD improvements following FaME (Falls Management Exercise) in frequently falling women age 65 and over: an RCT... 7th World Congress on Aging and Physical Activity [abstract]. Journal of Aging and Physical Activity 2008;16 Suppl:S89-90. [Google Scholar]
Smith 2007 {published data only}
- Anderson FH, Smith HE, Raphael HM, Cooper C. Intramuscular vitamin D increased serum 1,25-dihydroxycholecalciferol but did not affect 25-hydroxy-cholecalciferol levels in healthy older adults [abstract]. Journal of Bone and Mineral Research 2000;15(Suppl 1):S315. [Google Scholar]
- Anderson FH, Smith HE, Raphael HM, Crozier SR, Cooper C. Effect of annual intramuscular vitamin D3 supplementation on fracture risk in 9440 community-living older people: the Wessex fracture prevention trial [abstract]. Journal of Bone and Mineral Research 2004;19(Suppl 1):S57. [Google Scholar]
- Arden NK, Crozier S, Smith H, Anderson F, Edwards C, Raphael H, et al. Knee pain, knee osteoarthritis, and the risk of fracture. Arthritis and Rheumatism 2006;55(4):610-5. [MEDLINE: ] [DOI] [PubMed] [Google Scholar]
- N0108081272. Primary prevention of fractures in the elderly: evaluating the effectiveness of annual vitamin D supplementation linked with primary care in influenza immunisation. National Research Register (NRR) Archive. www.nihr.ac.uk/Pages/NRRArchiveSearch.aspx (accessed 23 February 2011). [NRR Publication ID: N0108081272]
- N0187062321. Wessex fracture prevention study. National Research Register (NRR) Archive. www.nihr.ac.uk/Pages/NRRArchiveSearch.aspx (accessed 23 February 2011). [NRR Publication ID: N0187062321]
- Raphael H, Smith H, Anderson F, Cooper C. Tackling the problems of trial management in primary care - experience from the Wessex research network fracture prevention study of annual vitamin D injection in older people [abstract]. Osteoporosis International 2000;11(Suppl 1):S63-4. [Google Scholar]
- Smith H, Anderson F, Raphael H, Cooper C. The Wessex research network fracture prevention study - a large pragmatic trial of annual vitamin D injection in older people [abstract]. Osteoporosis International 2000;11(Suppl 1):S64. [Google Scholar]
- Smith H, Anderson F, Raphael H, Crozier S, Cooper C. Effect of annual intramuscular vitamin D supplementation on fracture risk: population-based, randomised, double-blind, placebo-controlled trial [abstract]. Osteoporosis International 2004;15(Suppl 1):S8. [DOI] [PubMed] [Google Scholar]
- Smith H, Anderson F, Raphael H, Maslin P, Crozier S, Cooper C. Effect of annual intramuscular vitamin D on fracture risk in elderly men and women - a population-based, randomised, double-blind, placebo-controlled trial. Rheumatology 2007;46(12):1852-7. [MEDLINE: ] [DOI] [PubMed] [Google Scholar]
Smulders 2010 {published data only}
- NCT00432692. Falls prevention in osteoporosis. clinicaltrials.gov/show/NCT00432692 (accessed 31 August 2011).
- Smulders E, Weerdesteyn V, Duysens J, Laan R, Lankveld W. Falls prevention in persons with osteoporosis: A randomized clinical trial [abstract]. Arthritis and Rheumatism 2009;60(10 Suppl):1883. [EMBASE: 70373615] [Google Scholar]
- Smulders E, Weerdesteyn V, Groen BE, Duysens J, Eijsbouts A, Laan R, et al. Efficacy of a short multidisciplinary falls prevention program for elderly persons with osteoporosis and a fall history: a randomized controlled trial. Archives of Physical Medicine and Rehabilitation 2010;91:1705-11. [DOI] [PubMed] [Google Scholar]
Spice 2009 {published and unpublished data}
- George S, Spice C, Morotti W, Rose J, Harris S, Gordon C. The Winchester Falls Project: a cluster randomised community intervention trial of secondary prevention of falls in community dwelling older people [abstract]. Journal of Epidemiology and Community Health 2006;60(Suppl 1):A17. [Google Scholar]
- N0278078805. The Winchester Falls Project: A randomised controlled trial of multidisciplinary assessment in the secondary prevention of falls. National Research Register (NRR) Archive. www.nihr.ac.uk/Pages/NRRArchiveSearch.aspx (accessed 23 February 2011). [NRR Publication ID: N0278078805]
- NCT00130624. The Winchester Falls Project: A cluster randomised community intervention trial of secondary prevention of falls in community-dwelling older people. clinicaltrials.gov/show/NCT00130624 (accessed 30 November 2011).
- Spice C, Morotti W, Dent T, George S, Rose J, Gordon C. The Winchester Falls Project: A randomised controlled trial of secondary falls prevention [abstract]. Age and Ageing 2005;34(Suppl 2):ii18. [DOI] [PubMed] [Google Scholar]
- Spice C, Morotti W, George S, Dent T, Rose J, Harris S, et al. The Winchester falls project: a randomised controlled trial of secondary prevention of falls in older people. Age and Ageing 2009;38(1):33-40. [MEDLINE: ] [DOI] [PubMed]
- Spice C. personal communication December 24 2006.
Spink 2011 {published data only}
- ACTRN12608000065392. Podiatry treatment to improve balance and prevent falls in older people. www.anzctr.org.au/trial_view.aspx?ID=82558 (accessed 30 November 2011).
- Spink MJ, Fotoohabadi MR, Wee E, Landorf KB, Hill KD, Lord SR, et al. Predictors of adherence to a multifaceted podiatry intervention for the prevention of falls in older people. BMC Geriatrics 2011;11:51. [DOI] [PMC free article] [PubMed] [Google Scholar]
- Spink MJ, Menz HB, Fotoohabadi MR, Wee E, Landorf KB, Hill KD, et al. Effectiveness of a multifaceted podiatry intervention to prevent falls in community dwelling older people with disabling foot pain: randomised controlled trial. BMJ 2011;342:d3411. [DOI] [PMC free article] [PubMed] [Google Scholar]
- Spink MJ, Menz HB, Lord SR. Efficacy of a multifaceted podiatry intervention to improve balance and prevent falls in older people: study protocol for a randomised trial. BMC Geriatrics 2008;8:30. [MEDLINE: ] [DOI] [PMC free article] [PubMed] [Google Scholar]
Steadman 2003 {published and unpublished data}
- Kalra L. personal communication March 27 2006.
- Steadman J, Donaldson N, Kalra L. A randomized controlled trial of an enhanced balance training program to improve mobility and reduce falls in elderly patients. Journal of the American Geriatrics Society 2003;51(6):847-52. [MEDLINE: ] [DOI] [PubMed] [Google Scholar]
Steinberg 2000 {published and unpublished data}
- Peel N, Cartwright C, Steinberg M. Monitoring slips, trips and falls in the older community: preliminary results. Health Promotion Journal of Australia 1998;8(2):148-50. [Google Scholar]
- Peel N, Steinberg M, Williams G. Home safety assessment in the prevention of falls among older people. Australian and New Zealand Journal of Public Health 2000;24(5):536-9. [MEDLINE: ] [DOI] [PubMed] [Google Scholar]
- Peel N. personal communication October 10 2007.
- Steinberg M, Cartwright C, Peel N, Williams G. A sustainable programme to prevent falls and near falls in community dwelling older people: results of a randomised trial. Journal of Epidemiology and Community Health 2000;54(3):227-32. [MEDLINE: ] [DOI] [PMC free article] [PubMed] [Google Scholar]
Stevens 2001 {published data only}
- Stevens M, Holman CD, Bennett N, De Klerk N. Preventing falls in older people: Outcome evaluation of a randomized controlled trial. Journal of the American Geriatrics Society 2001;49(11):1448-55. [MEDLINE: ] [DOI] [PubMed] [Google Scholar]
- Stevens M, Holman CD, Bennett N. Preventing falls in older people: Impact of an intervention to reduce environmental hazards in the home. Journal of the American Geriatrics Society 2001;49(11):1442-7. [MEDLINE: ] [DOI] [PubMed] [Google Scholar]
Suman 2011 {published data only}
- Suman S, Myint PK, Clark A, Das P, Ring L, Trepte NJ. Community-based fall assessment compared with hospital-based assessment in community-dwelling older people over 65 at high risk of falling: a randomized study. Aging-Clinical & Experimental Research 2011;23(1):35-41. [DOI] [PubMed] [Google Scholar]
Suzuki 2004 {published data only}
- Suzuki T, Kim H, Yoshida H, Ishizaki T. Randomized controlled trial of exercise intervention for the prevention of falls in community-dwelling elderly Japanese women. Journal of Bone and Mineral Metabolism 2004;22(6):602-11. [MEDLINE: ] [DOI] [PubMed] [Google Scholar]
Swanenburg 2007 {published data only}
- Swanenburg J, De Bruin ED, Stauffacher M, Mulder T, Uebelhart D. Effects of exercise and nutrition on postural balance and risk of falling in elderly people with decreased bone mineral density: randomized controlled trial pilot study. Clinical Rehabilitation 2007;21(6):523-34. [MEDLINE: ] [DOI] [PubMed] [Google Scholar]
Tinetti 1994 {published data only}
- King MB, Tinetti ME. A multifactorial approach to reducing injurious falls. Clinics in Geriatric Medicine 1996;12(4):745-59. [MEDLINE: ] [PubMed] [Google Scholar]
- Koch M, Gottschalk M, Baker DI, Palumbo S, Tinetti ME. An impairment and disability assessment and treatment protocol for community-living elderly persons. Physical Therapy 1994;74:286-94; discussion 295-8. [DOI] [PubMed] [Google Scholar]
- Rizzo JA, Baker DI, McAvay G, Tinetti ME. The cost-effectiveness of a multifactorial targeted prevention program for falls among community elderly persons. Medical Care 1996;34(9):954-69. [MEDLINE: ] [DOI] [PubMed] [Google Scholar]
- Tinetti ME, Baker DI, Garrett PA, Gottschalk M, Koch ML, Horwitz RI. Yale FICSIT: risk factor abatement strategy for fall prevention. Journal of the American Geriatrics Society 1993;41:315-20. [MEDLINE: ] [DOI] [PubMed] [Google Scholar]
- Tinetti ME, Baker DI, McAvay G, Claus EB, Garrett P, Gottschalk M, et al. A multifactorial intervention to reduce the risk of falling among elderly people living in the community. New England Journal of Medicine 1994;331(13):821-7. [MEDLINE: ] [DOI] [PubMed] [Google Scholar]
- Tinetti ME, McAvay G, Claus E. Does multiple risk factor reduction explain the reduction in fall rate in the Yale FICSIT Trial? Frailty and Injuries Cooperative Studies of Intervention Techniques. American Journal of Epidemiology 1996;144(4):389-99. [MEDLINE: ] [DOI] [PubMed] [Google Scholar]
- Tinetti ME. Prevention of falls and fall injuries in elderly persons: a research agenda. Preventive Medicine 1994;23(5):756-62. [MEDLINE: ] [DOI] [PubMed] [Google Scholar]
Trivedi 2003 {published data only}
- Trivedi DP, Doll R, Tee Khaw K. Effect of four monthly oral vitamin D3 (cholecalciferol) supplementation on fractures and mortality in men and women living in the community: randomised double blind controlled trial. BMJ 2003;326(7387):469-72. [MEDLINE: ] [DOI] [PMC free article] [PubMed] [Google Scholar]
Trombetti 2011 {published data only}
- NCT01107288. Effects of a music-based multitask exercises program on gait, balance and fall risk in the elderly. clinicaltrials.gov/show/NCT01107288 (accessed 31 August 2011).
- Trombetti A, Hars M, Herrmann F, Kressig R, Ferrari S, Rizzoli R. "Jaques-Dalcroze eurhythmics" improves gait and prevents falls in the elderly [Prevention des chutes par une methode d'exercice en musique (rythmique Jaques-Dalcroze)]. Revue Medicale Suisse 2011;7(299):1305-8. [PubMed] [Google Scholar]
- Trombetti A, Hars M, Herrmann F, Kressig R, Ferrari S, Rizzoli R. A randomized controlled trial of music-based multitask training on gait, balance and fall risk. Osteoporosis International 2011;22(Suppl 1):S119. [DOI] [PubMed] [Google Scholar]
- Trombetti A, Hars M, Herrmann FR, Kressig RW, Ferrari S, Rizzoli R. Effect of music-based multitask training on gait, balance, and fall risk in elderly people: a randomized controlled trial. Archives of Internal Medicine 2011;171(6):525-33. [DOI] [PubMed] [Google Scholar]
Van Haastregt 2000 {published data only}
- Van Haastregt JC, Diederiks JP, Van Rossum E, De Witte LP, Voorhoeve PM, Crebolder HF. Effects of a programme of multifactorial home visits on falls and mobility impairments in elderly people at risk: randomised controlled trial. BMJ 2000;321(7267):994-8. [MEDLINE: ] [DOI] [PMC free article] [PubMed] [Google Scholar]
- Van Haastregt JC, Van Rossum E, Diederiks JP, De Witte LP, Voorhoeve PM, Crebolder HF. Process-evaluation of a home visit programme to prevent falls and mobility impairments among elderly people at risk. Patient Education and Counseling 2002;47(4):301-9. [MEDLINE: ] [DOI] [PubMed] [Google Scholar]
- Van Haastregt JC, Van Rossum E, Diederiks JP, Voorhoeve PM, De Witte LP, Crebolder HF. Preventing falls and mobility problems in community-dwelling elders: the process of creating a new intervention. Geriatric Nursing 2000;21(6):309-14. [MEDLINE: ] [DOI] [PubMed] [Google Scholar]
Van Rossum 1993 {published data only}
- Van Rossum E, Frederiks CM, Philipsen H, Portengen K, Wiskerke J, Knipschild P. Effects of preventive home visits to elderly people. BMJ 1993;307(6895):27-32. [MEDLINE: ] [DOI] [PMC free article] [PubMed] [Google Scholar]
Vellas 1991 {published data only}
- Vellas B, Albarede JL. A randomized clinical trial on the value of raubasine-dihydroergocristine (Iskedyl(TM)) in the prevention of post fall syndrome [Effet de l'association raubasine-dihydroergocristine (Iskedyl(TM)) sur le syndrome post-chute et sur la prevention de la chute chez le sujet age]. Psychologie Medicale 1991;23(7):831-9. [EMBASE 1991275391] [Google Scholar]
Vetter 1992 {published data only}
- Vetter NJ, Lewis PA, Ford D. Can health visitors prevent fractures in elderly people? BMJ 1992;304(6831):888-90. [MEDLINE: ] [DOI] [PMC free article] [PubMed] [Google Scholar]
Vind 2009 {published data only}
- NCT00226486. Examination and treatment of elderly after a fall. clinicaltrials.gov/show/NCT00226486 (accessed 31 August 2011).
- Vind AB, Andersen HE, Pedersen KD, Joergensen T, Schwarz P. Effect of a program of multifactorial fall prevention on health-related quality of life, functional ability, fear of falling and psychological well-being. A randomized controlled trial. Aging-Clinical & Experimental Research 2010;22(3):249-54. [DOI] [PubMed] [Google Scholar]
- Vind AB, Andersen HE, Pedersen KD, Jorgensen T, Schwarz P. An outpatient multifactorial falls prevention intervention does not reduce falls in high-risk elderly Danes. Journal of the American Geriatrics Society 2009;57(6):971-7. [MEDLINE: ] [DOI] [PubMed] [Google Scholar]
- Vind AB, Andersen HE, Pedersen KD, Jorgensen T, Schwarz P. Baseline and follow-up characteristics of participants and nonparticipants in a randomized clinical trial of multifactorial fall prevention in Denmark. Journal of the American Geriatrics Society 2009;57(10):1844-9. [MEDLINE: ] [DOI] [PubMed] [Google Scholar]
- Vind AB. personal communication March 30 2006.
Von Stengel 2011 {published and unpublished data}
- Kemmler W, Stengel V, Mayer S, Niedermayer M, Hentschke C, Kalender WA. Effect of whole body vibration on the neuromuscular performance of females 65 years and older. One-year results of the controlled randomized ELVIS study [Effekte von Ganzkorpervibrationen auf die neuromuskulare Leistungsfahigkeit von Frauen uber dem 65. Lebensjahr. Einjahresergebnisse der kontrollierten randomisierten ELVIS-Studie]. Zeitschrift fur Gerontologie und Geriatrie 2010;43(2):125-32. [MEDLINE: ] [DOI] [PubMed] [Google Scholar]
- NCT00292916. Effect of whole body vibration on bone and fall related parameters. clinicaltrials.gov/show/NCT00292916 (accessed 31 August 2011).
- Stengel S, Kemmler W, Engelke K, Bebenek M, Mayhew JL, Kalender WA. Effects of whole body vibration training on the fracture risk of postmenopausal women: preliminary results of the Erlangen Longitudinal Vibration Study (ELVIS) [abstract]. Medicine & Science in Sports & Exercise 2008;40(5 Suppl 1):S313. [Google Scholar]
- Stengel S, Kemmler W, Engelke K, Kalender WA. Effect of whole-body vibration on neuromuscular performance and body composition for females 65 years and older: a randomized-controlled trial. Scandinavian Journal of Medicine & Science in Sports 2012;22(1):119-27. [MEDLINE: ] [DOI] [PubMed] [Google Scholar]
- Stengel S, Kemmler W, Engelke K, Kalender WA. Effects of whole body vibration on bone mineral density and falls: results of the randomized controlled ELVIS study with postmenopausal women. Osteoporosis International 2011;22(1):317-25. [MEDLINE: ] [DOI] [PubMed] [Google Scholar]
- Stengel S, Kemmler W, Mayer S, Engelke K, Klarner A, Kalender WA. Effect of whole body vibration exercise on osteoporotic risk factors [Effekte eines Ganzkorpervibrationstrainings auf Parameter des Frakturrisikos]. Deutsche Medizinische Wochenschrift 2009;134(30):1511-6. [MEDLINE: ] [DOI] [PubMed] [Google Scholar]
Voukelatos 2007 {published and unpublished data}
- Haas M. Economic analysis of tai chi as a means of preventing falls and related injuries among older adults. CHERE working paper 2006/4. Sydney, Australia: Centre for Health Economics Research and Evaluation, University of Technology. datasearch.uts.edu.au/chere/research/working_papers.cfm (accessed 30 November 2011).
- Rissel C, Voukelatos A, Cumming B, Lord S. Central Sydney Tai Chi Trial. Canberra: Australian Resource Centre for Health Care Innovations, 2005. [Google Scholar]
- Voukelatos A, Cumming RG, Lord SR, Rissel C. A randomized, controlled trial of tai chi for the prevention of falls: the Central Sydney Tai Chi trial. Journal of the American Geriatrics Society 2007;55(8):1185-91. [MEDLINE: ] [DOI] [PubMed] [Google Scholar]
- Voukelatos A, Metcalfe A. Central Sydney Tai Chi Trial: methodology. New South Wales Public Health Bulletin 2002;13(1-2):19. [DOI] [PubMed] [Google Scholar]
- Voukelatos A, Rissel C, Cumming R, Lord S. The Central Sydney Tai Chi Trial: a randomised controlled trial of the effectiveness of tai chi in reducing risk of falls in older people. Sydney: NSW Department of Health, 2006 www.health.nsw.gov.au/resources/publichealth/healthpromotion/grants/pdf/cs_tai_chi.pdf (accessed 30 November 2011). [Google Scholar]
- Voukelatos A. Central Sydney Tai Chi trial. personal communication July 25 2003.
Wagner 1994 {published data only}
- Wagner EH, LaCroix AZ, Grothaus L, Leveille SG, Hecht JA, Artz K, et al. Preventing disability and falls in older adults: a population-based randomized trial. American Journal of Public Health 1994;84(11):1800-6. [MEDLINE: ] [DOI] [PMC free article] [PubMed] [Google Scholar]
Weber 2008 {published data only}
- Weber V, White A, McIlvried R. An electronic medical record (EMR)-based intervention to reduce polypharmacy and falls in an ambulatory rural elderly population. Journal of General Internal Medicine 2008;23(4):399-404. [MEDLINE: ] [DOI] [PMC free article] [PubMed] [Google Scholar]
Weerdesteyn 2006 {published and unpublished data}
- Weerdesteyn V, Rijken H, Geurts AC, Smits-Engelsman BC, Mulder T, Duysens J. A five-week exercise program can reduce falls and improve obstacle avoidance in the elderly. Gerontology 2006;52(3):131-41. [MEDLINE: ] [DOI] [PubMed] [Google Scholar]
- Weerdesteyn V. personal communication September 06 2006.
Whitehead 2003 {published data only}
- Whitehead C, Wundke R, Crotty M, Finucane P. Evidence-based clinical practice in falls prevention: a randomised controlled trial of a falls prevention service. Australian Health Review 2003;26(3):88-96. [MEDLINE: ] [DOI] [PubMed] [Google Scholar]
Wilder 2001 {published data only}
- Wilder P. Seniors to seniors exercise program: a cost effective way to prevent falls in the frail elderly living at home [abstract]. Journal of Geriatric Physical Therapy 2001;24(3):13. [Google Scholar]
Wolf 1996 {published data only}
- Kutner NG, Barnhart H, Wolf SL, McNeely E, Xu T. Self-report benefits of Tai Chi practice by older adults. Journals of Gerontology. Series B, Psychological Sciences and Social Sciences 1997;52(5):242-6. [MEDLINE: ] [DOI] [PubMed] [Google Scholar]
- McNeely E, Clements SD, Wolf SL. A program to reduce frailty in the elderly. In: Funk SG, Tornquist EM, Champagne MT, Weise RA, editors(s). Key aspects of elder care: managing falls, incontinence, and cognitive impairment. New York: Springer, 1992:89-96. [Google Scholar]
- O'Grady M, Wolf SL, Barnhart HX, Kutner N, McNeely E. Tai Chi effect on falls in frail older adults [abstract]. Archives of Physical Medicine and Rehabilitation 1997;78:1028. [CENTRAL: CN-00507025] [Google Scholar]
- Wolf SL, Barnhart HX, Ellison GL, Coogler CE, Horak FB. The effect of Tai Chi Quan and computerized balance training on postural stability in older subjects. Physical Therapy 1997;77(4):371-84. [MEDLINE: ] [DOI] [PubMed] [Google Scholar]
- Wolf SL, Barnhart HX, Kutner NG, McNeely E, Coogler C, Xu T. Reducing frailty and falls in older persons: an investigation of Tai Chi and computerized balance training. Atlanta FICSIT Group. Frailty and Injuries: Cooperative Studies of Intervention Techniques. Journal of the American Geriatrics Society 1996;44(5):489-97. [MEDLINE: ] [DOI] [PubMed] [Google Scholar]
- Wolf SL, Kutner NG, Green RC, McNeely E. The Atlanta FICSIT study: two exercise interventions to reduce frailty in elders. Journal of the American Geriatrics Society 1993;41(3):329-32. [MEDLINE: ] [DOI] [PubMed] [Google Scholar]
Wolf 2003 {published data only}
- Greenspan AI, Wolf SL, Kelley ME, O'Grady M. Tai chi and perceived health status in older adults who are transitionally frail: a randomized controlled trial. Physical Therapy 2007;87(5):525-35. [MEDLINE: ] [DOI] [PubMed] [Google Scholar]
- Sattin RW, Easley KA, Wolf SL, Chen Y, Kutner MH. Reduction in fear of falling through intense tai chi exercise training in older, transitionally frail adults. Journal of the American Geriatrics Society 2005;53(7):1168-78. [MEDLINE: ] [DOI] [PubMed] [Google Scholar]
- Wolf SL, O'Grady M, Easley KA, Guo Y, Kressig RW, Kutner M. The influence of intense Tai Chi training on physical performance and hemodynamic outcomes in transitionally frail, older adults. Journals of Gerontology. Series A, Biological Sciences and Medical Sciences 2006;61(2):184-9. [MEDLINE: ] [DOI] [PubMed] [Google Scholar]
- Wolf SL, Sattin RW, Kutner M, O'Grady M, Greenspan AI, Gregor RJ. Intense Tai Chi exercise training and fall occurrences in older, transitionally frail adults: a randomized, controlled trial. Journal of the American Geriatrics Society 2003;51(12):1693-701. [MEDLINE: ] [DOI] [PubMed]
- Wolf SL, Sattin RW, O'Grady M, Freret N, Ricci L, Greenspan AI, et al. A study design to investigate the effect of intense Tai Chi in reducing falls among older adults transitioning to frailty. Controlled Clinical Trials 2001;22(6):689-704. [MEDLINE: ] [DOI] [PubMed] [Google Scholar]
Woo 2007 {published and unpublished data}
- Woo J, Hong A, Lau E, Lynn H. A randomised controlled trial of Tai Chi and resistance exercise on bone health, muscle strength and balance in community-living elderly people. Age and Ageing 2007;36(3):262-8. [MEDLINE: ] [DOI] [PubMed] [Google Scholar]
- Woo J. personal communication May 6 2008.
Wu 2010 {published data only}
- Wu G, Keyes L, Callas P, Ren X, Bookchin B. Comparison of telecommunication, community, and home-based Tai Chi exercise programs on compliance and effectiveness in elders at risk for falls. Archives of Physical Medicine & Rehabilitation 2010;91(6):849-56. [DOI] [PubMed] [Google Scholar]
Wyman 2005 {published and unpublished data}
- Findorff MJ, Stock HH, Gross CR, Wyman JF. Does the Transtheoretical Model (TTM) explain exercise behavior in a community-based sample of older women? Journal of Aging & Health 2007;19(6):985-1003. [MEDLINE: ] [DOI] [PubMed] [Google Scholar]
- Findorff MJ, Wyman JF, Nyman JA, Croghan CF. Measuring the direct healthcare costs of a fall injury event. Nursing Research 2007;56(4):283-7. [MEDLINE: ] [DOI] [PubMed] [Google Scholar]
- Lindquist R, Wyman JF, Talley KM, Findorff M, Gross CR. Design of control-group conditions in clinical trials of behavioral interventions. Journal of Nursing Scholarship 2007;39(3):214-21. [MEDLINE: ] [DOI] [PubMed] [Google Scholar]
- Nachreiner NM, Findorff MJ, Wyman JF, McCarthy TC. Circumstances and consequences of falls in community-dwelling older women. Journal of Women's Health 2007;16(10):1437-46. [MEDLINE: ] [DOI] [PubMed] [Google Scholar]
- Wyman J, Gross C, DiFabio R, Nyman J, Lindquist R, McCarthy T, et al. A randomized trial of exercise, education, and risk reduction counseling to prevent falls in population-based sample of older women [abstract]. Gerontologist 2005;45(Special Issue II):297. [Google Scholar]
- Wyman J, Gross C, DiFabio R, Nyman J, Lindquist R, McCarthy T, et al. Efficacy of exercise, education, and tailored counseling in reducing falls at 1- and 2-years in older women [abstract]. Gerontologist 2006;46(Special Issue I):141. [Google Scholar]
- Wyman J. A home-based fall prevention intervention for high risk older women. www.dhs.state.mn.us/main/groups/aging/documents/pub/dhs16_137823.pdf (accessed 14/10/07).
- Wyman J. Design of the Fall Evaluation and Prevention Program (FEPP): a randomized trial of exercise and risk reduction education in high-risk older women [abstract]. ICADI: International conference on aging,disability and independence; 2003 Dec 4-6; Washington (DC). www.icadi.phhp.ufl.edu/2003/presentation.php?PresID=151 (accessed 30 November 2011).
- Wyman JF, Croghan CF, Nachreiner NM, Gross CR, Stock HH, Talley K, et al. Effectiveness of education and individualized counseling in reducing environmental hazards in the homes of community-dwelling older women. Journal of the American Geriatrics Society 2007;55(10):1548-56. [MEDLINE: ] [DOI] [PubMed] [Google Scholar]
- Wyman JF. personal communication November 10 2007.
Yamada 2010 {published data only}
- Yamada M, Tanaka B, Nagai K, Aoyama T, Ichihashi N. Trail-walking exercise and fall risk factors in community-dwelling older adults: preliminary results of a randomized controlled trial. Journal of the American Geriatrics Society 2010;58(10):1946-51. [MEDLINE: ] [DOI] [PubMed] [Google Scholar]
References to studies excluded from this review
Aisen 2011 {published data only}
- Aisen PS, Gauthier S, Ferris SH, Saumier D, Haine D, Garceau D, et al. Tramiprosate in mild-to-moderate Alzheimer's disease - A randomized, double-blind, placebo-controlled, multi-centre study (the alphase study). Archives of Medical Science. 2011;7(1):102-11. [DOI] [PMC free article] [PubMed] [Google Scholar]
Alexander 2003 {published data only}
- Alexander N. personal communication August 23 2006.
- Alexander NB, Bentur N, Strasburg D, Nyquist LV. Fall risk reduction in Israeli day care center attendees using exercise and behavior strategies [abstract]. Journal of the American Geriatrics Society 2003;51(Suppl 4):S117. [Google Scholar]
Alp 2007 {published data only}
- Alp A, Kanat E, Yurtkuran M. Efficacy of a self-management program for osteoporotic subjects. American Journal of Physical Medicine and Rehabilitation 2007;86(8):633-40. [DOI] [PubMed] [Google Scholar]
Armstrong 1996 {published data only}
- Armstrong AL, Coupland CAC, Pye DW, Wallace WA. A study of the effects of hormone replacement therapy (HRT) on bone density, strength and balance in post-menopausal women [abstract]. Journal of Bone and Joint Surgery. British Volume 1994;76 Suppl 1:42. [Google Scholar]
- Armstrong AL, Oborne J, Coupland CAC, Macpherson MB, Bassey EJ, Wallace WA. Effects of hormone replacement therapy on muscle performance and balance in post-menopausal women. Clinical Science 1996;91(6):685-90. [DOI] [PubMed] [Google Scholar]
- Armstrong AL. Hormone replacement therapy - effects on strength, balance, and bone density [thesis]. Nottingham (UK): Univ. of Nottingham, 1996. [Google Scholar]
Ashburn 2007 {published data only}63503875
- Ashburn A, Fazakarley L, Ballinger C, Pickering R, McLellan LD, Fitton C. A randomised controlled trial of a home based exercise programme to reduce the risk of falling among people with Parkinson's disease. Journal of Neurology, Neurosurgery and Psychiatry 2007;78(7):678-84. [DOI] [PMC free article] [PubMed] [Google Scholar]
- Ashburn A, Pickering RM, Fazakarley L, Ballinger C, McLellan DL, Fitton C. Recruitment to a clinical trial from the databases of specialists in Parkinson's disease. Parkinsonism and Related Disorders 2007;13(1):35-9. [DOI] [PubMed] [Google Scholar]
- Ashburn A, Stack E, Ballinger C, Fazakarley L, Fitton C. The circumstances of falls among people with Parkinson's disease and the use of Falls Diaries to facilitate reporting. Disability & Rehabilitation 2008;30(16):1205-12. [DOI] [PubMed] [Google Scholar]
- ISRCTN63503875. Randomised controlled trial of a home-based exercise programme to reduce fall frequency among people with Parkinson's disease (PD). www.controlled-trials.com/ISRCTN63503875 (accessed 30 November 2011).
Barr 2005 {published data only}
- Barr RJ, Stewart A, Torgerson DJ, Seymour DG, Reid DM. Screening elderly women for risk of future fractures - participation rates and impact on incidence of falls and fractures. Calcified Tissue International 2005;76(4):243-8. [DOI] [PubMed] [Google Scholar]
Bea 2011 {published data only}
- Bea JW, Zhao Q, Cauley JA, LaCroix AZ, Bassford T, Lewis CE, et al. Effect of hormone therapy on lean body mass, falls, and fractures: 6-year results from the Women's Health Initiative hormone trials. Menopause 2011;18(1):44-52. [DOI] [PMC free article] [PubMed] [Google Scholar]
- Jackson RD, Wactawski-Wende J, LaCroix AZ, Pettinger M, Yood RA, Watts NB, et al. Effects of conjugated equine estrogen on risk of fractures and BMD in postmenopausal women with hysterectomy: Results from the women's health initiative randomized trial. Journal of Bone and Mineral Research. 2006;21(6):817-28. [DOI] [PubMed] [Google Scholar]
Berggren 2008 {published data only}
- Berggren M, Stenvall M, Olofsson B, Gustafson Y. Evaluation of a fall-prevention program in older people after femoral neck fracture: A one-year follow-up. Osteoporosis International 2008;19(6):801-9. [DOI] [PubMed] [Google Scholar]
- Stenvall M, Olofsson B, Lundstrom M, Englund U, Borssen B, Svensson O, et al. A multidisciplinary, multifactorial intervention program reduces postoperative falls and injuries after femoral neck fracture. Osteoporosis International 2007;18(2):167-75. [DOI] [PMC free article] [PubMed] [Google Scholar]
- Stenvall M, Olofsson B, Lundstrom M, Svensson O, Nyberg L, Gustafson Y. Inpatient falls and injuries in older patients treated for femoral neck fracture. Archives of Gerontology and Geriatrics 2006;43(3):389-99. [DOI] [PubMed] [Google Scholar]
- Stenvall M, Olofsson B, Nyberg L, Lundstrom M, Gustafson Y. Improved performance in activities of daily living and mobility after a multidisciplinary postoperative rehabilitation in older people with femoral neck fracture: a randomized controlled trial with 1-year follow-up. Journal of Rehabilitation Medicine 2007;39(3):232-8. [DOI] [PubMed] [Google Scholar]
Chapuy 2002 {published data only}
- Chapuy MC, Pamphile R, Paris E, Kempf C, Schlichting M, Arnaud S, et al. Combined calcium and vitamin D3 supplementation in elderly women: confirmation of reversal of secondary hyperparathyroidism and hip fracture risk: the Decalyos II study. Osteoporosis International 2002;13(3):257-64. [DOI] [PubMed] [Google Scholar]
Crotty 2002 {published data only}
- Crotty M, Finucane P, Hayball N, Gray S, Krishnan J, Wells V. A trial of rehabilitation in the home (RITHOM) for patients with fractured neck of femur: an early report [abstract]. Australian & New Zealand Journal of Medicine 2000;30(2):295. [Google Scholar]
- Crotty M, Kittel A, Hayball N. Home rehabilitation for older adults with fractured hips: how many will take part? Journal of Quality in Clinical Practice 2000;20(2-3):65-8. [DOI] [PubMed] [Google Scholar]
- Crotty M, Whitehead C, Gray S, Finucane P, Hayball N. Rehabilitation in the home (RITHOM) for patients with fractured neck of femur: preliminary results [abstract]. Internal Medicine Journal 2002;32 Suppl:A38. [Google Scholar]
- Crotty M, Whitehead C, Miller M, Cray S. Patient and caregiver outcomes 12 months after home-based therapy for hip fracture: A randomized, controlled trial. Archives of Physical Medicine and Rehabilitation 2003;84:1237-9. [DOI] [PubMed] [Google Scholar]
- Crotty M, Whitehead CH, Gray S, Finucane PM. Early discharge and home rehabilitation after hip fracture achieves functional improvements: a randomised controlled trial. Clinical Rehabilitation 2002;16(4):406-13. [DOI] [PubMed] [Google Scholar]
De Deyn 2005 {published data only}
- De Deyn P, Jeste DV, Swanink R, Kostic D, Breder C, Carson WH, et al. Aripiprazole for the treatment of psychosis in patients with Alzheimer's disease: a randomized, placebo-controlled study. Journal of Clinical Psychopharmacology 2005;25(5):463-7. [DOI] [PubMed] [Google Scholar]
Dubbert 2002 {published data only}
- Dubbert PM, Cooper KM, Kirchner KA, Meydrech EF, Bilbrew D. Effects of nurse counseling on walking for exercise in elderly primary care patients. Journals of Gerontology Series A-Biological Sciences & Medical Sciences 2002;57(11):M733-40. [DOI] [PubMed] [Google Scholar]
Dubbert 2008 {published data only}
- Dubbert PM, Morey MC, Kirchner KA, Meydrech EF, Grothe K. Counseling for home-based walking and strength exercise in older primary care patients. Archives of Internal Medicine 2008;168(9):979-86. [DOI] [PubMed] [Google Scholar]
Ebrahim 1997 {published data only}
- Ebrahim S, Thompson PW, Baskaran V, Evans K. Randomized placebo-controlled trial of brisk walking in the prevention of postmenopausal osteoporosis. Age and Ageing 1997;26(4):253-60. [DOI] [PubMed] [Google Scholar]
Edwards {published data only}
- Edwards N, Cere M, Leblond D. A community-based intervention to prevent falls among seniors. Family and Community Health 1993;15(4):57-65. [Google Scholar]
Elley 2003 {published data only}
- Elley CR, Kerse N, Arroll B, Robinson E. Effectiveness of counselling patients on physical activity in general practice: cluster randomised controlled trial. BMJ 2003;326(7393):793-6. [DOI] [PMC free article] [PubMed] [Google Scholar]
- Elley CR, Kerse NM, Arroll B. Why target sedentary adults in primary health care? Baseline results from the Waikato Heart, Health, and Activity Study. Preventive Medicine 2003;37(4):342-8. [DOI] [PubMed] [Google Scholar]
- Kerse N, Elley CR, Robinson E, Arroll B. Is physical activity counseling effective for older people? A cluster randomized, controlled trial in primary care. Journal of the American Geriatrics Society 2005;53(11):1951-6. [DOI] [PubMed] [Google Scholar]
Faber 2006 {published and unpublished data}
- Faber M. personal communication Aug 30 2006.
- Faber MJ, Bosscher RJ, Chin A Paw MJ, Van Wieringen PC. Effects of exercise programs on falls and mobility in frail and pre-frail older adults: A multicenter randomized controlled trial. Archives of Physical Medicine and Rehabilitation 2006;87(7):885-96. [DOI] [PubMed] [Google Scholar]
Gill 2002 {published data only}
- Gill TM, Baker DI, Gottschalk M, Peduzzi PN, Allore H, Byers A. A program to prevent functional decline in physically frail, elderly persons who live at home. New England Journal of Medicine 2002;347(14):1068-74. [DOI] [PubMed] [Google Scholar]
- Gill TM, McGloin JM, Gahbauer EA, Shepard DM, Bianco LM. Two recruitment strategies for a clinical trial of physically frail community-living older persons. Journal of the American Geriatrics Society 2001;49(8):1039-45. [DOI] [PubMed] [Google Scholar]
Graafmans 1996 {published data only}
- Graafmans WC, Ooms ME, Hofstee HM, Bezemer PD, Bouter LM, Lips P. Falls in the elderly: a prospective study of risk factors and risk profiles. American Journal of Epidemiology 1996;143(11):1129-36. [DOI] [PubMed] [Google Scholar]
- Lips P, Graafmans WC, Ooms ME, Bezemer PD, Bouter LM. Vitamin D supplementation and fracture incidence in elderly persons. A randomized, placebo-controlled clinical trial. Annals of Internal Medicine 1996;124(4):400-6. [DOI] [PubMed] [Google Scholar]
Green 2002 {published data only}
- Green J, Forster A, Bogle S, Young J. Physiotherapy for patients with mobility problems more than 1 year after stroke: a randomised controlled trial. Lancet 2002;359(9302):199-203. [DOI] [PubMed] [Google Scholar]
- N0049004427. A randomised trial of community physiotherapy one year post stroke. National Research Register (NRR) Archive: www.nihr.ac.uk/Pages/NRRArchiveSearch.aspx (accessed 23 February 2011). [NRR Publication ID: N0049004427]
Inokuchi 2007 {published data only}
- Inokuchi S, Matsusaka N, Hayashi T, Shindo H. Feasibility and effectiveness of a nurse-led community exercise programme for prevention of falls among frail elderly people: a multi-centre controlled trial. Journal of Rehabilitation Medicine 2007;39(6):479-85. [DOI] [PubMed] [Google Scholar]
Iwamoto 2005 {published data only}
- Iwamoto J, Takeda T, Sato Y, Uzawa M. Effect of whole-body vibration exercise on lumbar bone mineral density, bone turnover, and chronic back pain in post-menopausal osteoporotic women treated with alendronate. Aging-Clinical & Experimental Research 2005;17(2):157-63. [DOI] [PubMed] [Google Scholar]
Jee 2004 {published data only}
- Jee J, Wang JJ, Rose K, Landau P, Lindley R, Mitchell P. Incorporating vision and hearing tests into aged care assessment: methods and the pilot study. Ophthalmic Epidemiology 2004;11(5):427-36. [DOI] [PubMed] [Google Scholar]
- Wang J. personal communication August 03 2011.
Kerschan‐Schindl 2000 {published data only}
- Kerschan-Schindl K, Uher E, Kainberger F, Kaider A, Ghanem AH, Preisinger E. Long-term home exercise program: Effect in women at high risk of fracture. Archives of Physical Medicine and Rehabilitation 2000;81(3):319-23. [DOI] [PubMed] [Google Scholar]
Kerse 2010 {published data only}
- ACTRN12605000475640. Late life intervention to improve function in elderly patients with depression. www.anzctr.org.au/trial_view.aspx?ID=736 (accessed 2 September 2011).
- Kerse N, Falloon K, Moyes SA, Hayman KJ, Dowell T, Kolt GS, et al. DeLLITE depression in late life: an intervention trial of exercise. Design and recruitment of a randomised controlled trial. BMC Geriatrics 2008;8:12. [DOI] [PMC free article] [PubMed] [Google Scholar]
- Kerse N, Hayman KJ, Moyes SA, Peri K, Robinson E, Dowell A, et al. Home-based activity program for older people with depressive symptoms: DeLLITE--a randomized controlled trial. Annals of Family Medicine 2010;8(3):214-23. [DOI] [PMC free article] [PubMed] [Google Scholar]
Kiehn 2009 {published data only}
- Kiehn KA, Mahoney J, Jones AN, Hansen KE. Vitamin d supplement intake in elderly fallers. Journal of the American Geriatrics Society 2009;57(1):176-7. [DOI] [PMC free article] [PubMed] [Google Scholar]
- NCT00140322. Dane county safety assessment (SAFE) research study. clinicaltrials.gov/ct2/show/NCT00140322 (accessed 30 November 2011).
Kruse 2010 {published data only}
- Kruse RL, Lemaster JW, Madsen RW. Fall and balance outcomes after an intervention to promote leg strength, balance, and walking in people with diabetic peripheral neuropathy: "feet first" randomized controlled trial. Physical Therapy 2010;90(11):1568-79. [MEDLINE: ] [DOI] [PubMed] [Google Scholar]
Larsen 2005 {published data only}
- Larsen ER, Mosekilde L, Foldspang A. Determinants of acceptance of a community-based program for the prevention of falls and fractures among the elderly. Preventive Medicine 2001;33(2 Pt 1):115-9. [DOI] [PubMed] [Google Scholar]
- Larsen ER, Mosekilde L, Foldspang A. Vitamin D and calcium supplementation prevents osteoporotic fractures in elderly community dwelling residents: a pragmatic population-based 3-year intervention study. Journal of Bone and Mineral Research 2004;19(3):370-8. [DOI] [PubMed] [Google Scholar]
- Larsen ER, Mosekilde L, Foldspang A. Vitamin D and calcium supplementation prevents severe falls in elderly community-dwelling women: A pragmatic population-based 3-year intervention study. Aging-Clinical and Experimental Research 2005;17(2):125-32. [DOI] [PubMed] [Google Scholar]
- Larsen ER, Mosekilde L, Foldspang A. Vitamin D and calcium treatment and environmental adjustment in the prevention of falls and osteoporotic fractures among elderly Danish community residents [abstract]. Journal of Bone and Mineral Research 2002;17(Suppl 1):S157. [Google Scholar]
Lawton 2008 {published data only}
- Lawton B, Rose SB, Elley R, Dowell AC, Fenton A, Moyes SA. Exercise on prescription for women aged 40-74 recruited through primary care: two year randomised controlled trial. BMJ 2008;337:a2509. [DOI] [PMC free article] [PubMed] [Google Scholar]
- Lawton BA, Rose SB, Elley CR, Dowell AC, Fenton A, Moyes SA. Exercise on prescription for women aged 40-74 recruited through primary care: two year randomised controlled trial. British Journal of Sports Medicine 2009;43(2):120-3. [PubMed] [Google Scholar]
Lehtola 2000 {published data only}
- Lehtola S, Hanninen L, Paatalo M. The incidence of falls during a six-month exercise trial and four-month followup among home dwelling persons aged 70-75 years [Kaatumistapaturmien ilmaantuvuus 70-75-vuotiailla oululaisilla liikuntaintervention ja sen jälkeisen seurannan aikana]. Liikuntatiede 2000;6:41-6. [Google Scholar]
McMurdo 2010 {published data only}26786857
- ISRCTN26786857. A randomised controlled trial of the effectiveness of pedometers plus systematic advice to increase physical activity levels in sedentary older women. controlled-trials.com/ISRCTN26786857 (accessed 30 November 2011).
- McMurdo ME, Sugden J, Argo I, Boyle P, Johnston DW, Sniehotta FF, et al. Do pedometers increase physical activity in sedentary older women? A randomized controlled trial. Journal of the American Geriatrics Society 2010;58(11):2099-106. [DOI] [PubMed] [Google Scholar]
Means 1996 {published data only}
- Means KM, Rodell DE, O'Sullivan PS, Cranford LA. Rehabilitation of elderly fallers: pilot study of a low to moderate intensity exercise program. Archives of Physical Medicine and Rehabilitation 1996;77:1030-6. [DOI] [PubMed] [Google Scholar]
N0025078568 {published data only}
- N0025078568. Vestibular rehabilitation in prevention of falls due to vestibular disorders in adults. National Research Register (NRR) Archive. www.nihr.ac.uk/Pages/NRRArchiveSearch.aspx (accessed 23 February 2011).
- Pothula VB. personal communication May 22 2012.
N0084162084 {published data only}
- N0084162084. Prevention of falls and injuries in a community sample. A randomised trial of exercise for older women (PREFICS). National Research Register (NRR) Archive. www.nihr.ac.uk/Pages/NRRArchiveSearch.aspx (accessed 23 February 2011).
N0105009461 {published data only}
- Behrman R. personal communication September 12 2006.
- N0105009461. Prediction and prevention of falls in the elderly. National Research Register (NRR) Archive. www.nihr.ac.uk/Pages/NRRArchiveSearch.aspx (accessed 23 February 2011).
- N0105125155. A study into the prediction and prevention of disability and falls in the over 75 year population. National Research Register Archive. www.nihr.ac.uk/Pages/NRRArchiveSearch.aspx (accessed 23 February 2011).
N0582105006 {published data only}
- Allen A, Simpson JM. A primary care based fall prevention programme. Physiotherapy Theory and Practice 1999;15(2):121-33. [EMBASE: 1999232162 ] [Google Scholar]
- Cryer C. personal communication August 27 2006.
- Cryer C. personal communication Dec 15 2008.
- N0582105006. Prevention of falls in older people in Canterbury. National Research Register (NRR) Archive. www.nihr.ac.uk/Pages/NRRArchiveSearch.aspx (accessed 23 February 2011).
Orwig 2011 {published data only}
- Orwig DL, Hochberg M, Yu-Yahiro J, Resnick B, Hawkes WG, Shardell M, et al. Delivery and outcomes of a yearlong home exercise program after hip fracture: a randomized controlled trial. Archives of Internal Medicine 2011;171(4):323-31. [DOI] [PMC free article] [PubMed] [Google Scholar]
Peterson 2004 {published and unpublished data}
- Allegrante JP. personal communication November 26 2003.
- NCT00000436. Improving functional recovery after hip fracture. clinicaltrials.gov/ct2/show/NCT00000436 (accessed 2 September 2011).
- Peterson MGE, Ganz SB, Allegrante JP, Cornell CN. High-intensity exercise training following hip fracture. Topics in Geriatric Rehabilitation 2004;20(4):273-84. [Google Scholar]
- Ruchlin HS, Elkin EB, Allegrante JP. The economic impact of a multifactorial intervention to improve postoperative rehabilitation of hip fracture patients. Arthritis & Rheumatism 2001;45(5):446-52. [DOI] [PubMed] [Google Scholar]
Reid 2008 {published data only}
- ACTRN12605000274673. The effect of calcium supplementation on serum lipids and bone density in normal men. www.anzctr.org.au/trial_view.aspx?ID=349 (accessed 14 September 2011).
- Reid IR, Ames R, Mason B, Reid HE, Bacon CJ, Bolland MJ, et al. Randomized controlled trial of calcium supplementation in healthy, nonosteoporotic, older men. Archives of Internal Medicine 2008;168(20):2276-82. [DOI] [PubMed] [Google Scholar]
Ringe 2007 {published data only}
- Ringe JD, Farahmand P, Schacht E, Rozehnal A. Superiority of a combined treatment of Alendronate and Alfacalcidol compared to the combination of Alendronate and plain vitamin D or Alfacalcidol alone in established postmenopausal or male osteoporosis (AAC-Trial). Rheumatology International 2007;27(5):425-34. [DOI] [PubMed] [Google Scholar]
- Ringe JD, Schacht E. Potential of alfacalcidol for reducing increased risk of falls and fractures. Rheumatology International 2009;29(10):1177-85. [DOI] [PubMed] [Google Scholar]
Robertson 2001b {published data only}
- Gardner MM, Buchner DM, Robertson MC, Campbell AJ. Practical implementation of an exercise-based falls prevention programme. Age and Ageing 2001;30(1):77-83. [DOI] [PubMed] [Google Scholar]
- Gardner MM, Robertson MC, McGee R, Campbell AJ. Application of a falls prevention program for older people to primary health care practice. Preventive Medicine 2002;34:546-53. [DOI] [PubMed] [Google Scholar]
- Robertson MC, Gardner MM, Devlin N, McGee R, Campbell AJ. Effectiveness and economic evaluation of a nurse delivered home exercise programme to prevent falls. 2: Controlled trial in multiple centres. BMJ 2001;322(7288):701-4. [DOI] [PMC free article] [PubMed] [Google Scholar]
Rosie 2007 {published data only}
- Rosie J, Taylor D. Sit-to-stand as home exercise for mobility-limited adults over 80 years of age - GrandStand System may keep you standing? Age and Ageing 2007;36(5):555-62. [DOI] [PubMed] [Google Scholar]
Rucker 2006 {published data only}
- Rucker D, Rowe BH, Johnson JA, Steiner IP, Russell AS, Hanley DA, et al. Educational intervention to reduce falls and fear of falling in patients after fragility fracture: Results of a controlled pilot study. Preventive Medicine 2006;42(4):316-9. [DOI] [PubMed] [Google Scholar]
Sakamoto 2006 {published data only}
- Sakamoto K, Nakamura T, Hagino H, Endo N, Mori S, Muto Y, et al. Effects of unipedal standing balance exercise on the prevention of falls and hip fracture among clinically defined high-risk elderly individuals: A randomized controlled trial. Journal of Orthopaedic Science 2006;11(5):467-72. [DOI] [PubMed] [Google Scholar]
Sambrook 2012 {published data only}
- Durvasula S, Kok C, Sambrook PN, Cumming RG, Lord SR, March LM, et al. Sunlight and health: attitudes of older people living in intermediate care facilities in southern Australia. Archives of Gerontology & Geriatrics 2010;51(3):e94-9. [DOI] [PubMed] [Google Scholar]
- March L, Seibel M, Simpson J, Sambrook P, Cameron I, Durvasula S, et al. A randomised controlled trial of increased sunlight exposure to reduce vitamin D deficiency and falls risk in the elderly [abstract]. Journal of Bone and Mineral Research 2009;24(Suppl 1):S73.
- NCT00322166. The FREEDOM study: a randomised controlled trial of sunlight and calcium in older people. clinicaltrials.gov/show/NCT00322166 (accessed 2 September 2011).
- Sambrook PN, Cameron ID, Chen JS, Cumming RG, Durvasula S, Herrmann M, et al. Does increased sunlight exposure work as a strategy to improve vitamin D status in the elderly: a cluster randomised controlled trial. Osteoporosis International 2012;23(2):615-24. [MEDLINE: ] [DOI] [PubMed] [Google Scholar]
- Wilson N, Hilmer S, March L, Cameron I, Lord S, Mason R, et al. Physical functioning measures and risk of falling in older people living in residential aged care facilities. Therapeutic Advances in Musculoskeletal Disease 2011;3(1):9-15. [DOI] [PMC free article] [PubMed] [Google Scholar]
- Wilson NM, Hilmer SN, March LM, Cameron ID, Lord SR, Seibel MJ, et al. Associations between drug burden index and physical function in older people in residential aged care facilities. Age and Ageing 2010;39(4):503-7. [DOI] [PubMed] [Google Scholar]
Sato 2005b {published data only}
- Sato Y, Kanoko T, Satoh K, Iwamoto J. The prevention of hip fracture with risedronate and ergocalciferol plus calcium supplementation in elderly women with Alzheimer disease: a randomized controlled trial [see comment]. Archives of Internal Medicine 2005;165(15):1737-42. [DOI] [PubMed] [Google Scholar]
Sato 2006 {published data only}
- Sato Y, Iwamoto J, Kanoko T, Satoh K. Alendronate and vitamin D2 for prevention of hip fracture in Parkinson's disease: A randomized controlled trial. Movement Disorders 2006;21(7):924-9. [DOI] [PubMed] [Google Scholar]
Shaw 2003 {published data only}
- Dawson P, Chapman KL, Shaw FE, Kenny RA. Measuring the outcome of physiotherapy in cognitively impaired elderly patients who fall. Physiotherapy 1997;83(7):352. [Google Scholar]
- N0461021713. Physiotherapy intervention for cognitively impaired elderly fallers attending casualty. National Research Register (NRR) Archive. www.nihr.ac.uk/Pages/NRRArchiveSearch.aspxwww.nihr.ac.uk/Pages/NRRArchiveSearch.aspx (accessed 30 November 2011). [NRR Publication ID: N0461021713]
- N0461044514. Risk modification of falls in cognitively impaired elderly patients attending a casualty department. A randomised controlled explanatory study. National Research Register (NRR) Archive. www.nihr.ac.uk/Pages/NRRArchiveSearch.aspxwww.nihr.ac.uk/Pages/NRRArchiveSearch.aspx (accessed 30 November 2011). [NRR Publication ID: N0461044514]
- Shaw FE, Bond J, Richardson DA, Dawson P, Steen IN, McKeith IG, et al. Multifactorial intervention after a fall in older people with cognitive impairment and dementia presenting to the accident and emergency department: randomised controlled trial. BMJ 2003;326(7380):73-5. [DOI] [PMC free article] [PubMed] [Google Scholar]
- Shaw FE, Richardson DA, Dawson P, Steen IN, McKeith IG, Bond J, et al. Can multidisciplinary intervention prevent falls in patients with cognitive impairment and dementia attending a casualty department [abstract]. Age and Ageing 2000;29(Suppl 1):47. [Google Scholar]
Shimada 2003 {published and unpublished data}
- Shimada H, Uchiyama Y, Kakurai S. Specific effects of balance and gait exercises on physical function among the frail elderly. Clinical Rehabilitation 2003;17(5):472-9. [DOI] [PubMed] [Google Scholar]
- Shimada H. personal communication July 29 2004.
Singh 2005 {published data only}
- Singh NA, Stavrinos TM, Scarbek Y, Galambos G, Liber C, Fiatarone Singh MA. A randomized controlled trial of high versus low intensity weight training versus general practitioner care for clinical depression in older adults. Journals of Gerontology. Series A, Biological Sciences and Medical Sciences 2005;60(6):768-76. [DOI] [PubMed] [Google Scholar]
Sohng 2003 {published data only}
- Sohng K-Y, Moon J-S, Song H-H, Lee K-S, Kim Y-S. Fall prevention exercise program for fall risk factor reduction of the community-dwelling elderly in Korea. Yonsei Medical Journal 2003;44(5):883-91. [DOI] [PubMed] [Google Scholar]
Stineman 2011 {published data only}
- Stineman MG, Strumpf N, Kurichi JE, Charles J, Grisso JA, Jayadevappa R. Attempts to reach the oldest and frailest: recruitment, adherence, and retention of urban elderly persons to a falls reduction exercise program. Gerontologist. 2011;51 Suppl 1:S59-72. [DOI] [PMC free article] [PubMed] [Google Scholar]
Sumukadas 2007 {published data only}
- Sumukadas D, Witham MD, Struthers AD, McMurdo ME. Effect of perindopril on physical function in elderly people with functional impairment: a randomized controlled trial. CMAJ: Canadian Medical Association Journal 2007;177(8):867-74. [DOI] [PMC free article] [PubMed] [Google Scholar]
Teixeira 2010 {published data only}
- ACTRN12607000472471. Progressive load training for the quadriceps muscle associated to proprioception exercises for the prevention of falls in postmenopausal women with osteoporosis: a randomized controlled trial. www.anzctr.org.au/trial_view.aspx?ID=82213 (accessed 2 September 2011).
- Teixeira LE, Silva KN, Imoto AM, Teixeira TJ, Kayo AH, Montenegro-Rodrigues R, et al. Progressive load training for the quadriceps muscle associated with proprioception exercises for the prevention of falls in postmenopausal women with osteoporosis: a randomized controlled trial. Osteoporosis International 2010;21(4):589-96. [DOI] [PubMed] [Google Scholar]
Tennstedt 1998 {published data only}
- Tennstedt S, Howland J, Lachman M, Peterson E, Kasten L, Jette A. A randomized, controlled trial of a group intervention to reduce fear of falling and associated activity restriction in older adults. Journals of Gerontology. Series B, Psychological Sciences and Social Sciences 1998;53(6):P384-92. [DOI] [PubMed] [Google Scholar]
Tinetti 1999 {published data only}
- Tinetti ME, Baker DI, Gottschalk M, Williams CS, Pollack D, Garrett P, et al. Home-based multicomponent rehabilitation program for older persons after hip fracture: a randomized trial. Archives of Physical Medicine and Rehabilitation 1999;80:916-22. [DOI] [PubMed] [Google Scholar]
Vogler 2009 {published data only}
- ACTRN12605000335695. Reducing falls risk in older people discharged from hospital: a randomised controlled trial comparing (i) seated lower limb resistance training, (ii) functional weight-bearing training and (iii) social visits (control activity). www.anzctr.org.au/trial_view.aspx?ID=366 (accessed 2 September 2011).
- Vogler C, Sherrington C, Ogle S, Lord S. Reducing risk of falling in older people discharged from hospital: a randomised controlled trial comparing seated lower limb strength training, weight-bearing exercises and social visits [abstract]. Internal Medicine Journal 2008;38(Suppl 5):A127. [DOI] [PubMed] [Google Scholar]
- Vogler C. Reducing Fall Risk in Older People Discharged From Hospital: A Randomised Controlled Trial Comparing (i) Seated Lower Limb Resistance Training, (ii) Functional Weight-Bearing Exercises, and (iii) Social Visits [thesis]. Sydney (Australia): Univ. of Sydney, 2007. [Google Scholar]
- Vogler CM, Sherrington C, Ogle SJ, Lord SR. Reducing risk of falling in older people discharged from hospital: a randomized controlled trial comparing seated exercises, weight-bearing exercises, and social visits. Archives of Physical Medicine & Rehabilitation 2009;90(8):1317-24. [DOI] [PubMed] [Google Scholar]
Witham 2010 {published data only}
- Witham MD, Crighton LJ, Gillespie ND, Struthers AD, McMurdo MET. The effects of vitamin D supplementation on physical function and quality of life in older patients with heart failure a randomized controlled trial. Circulation: Heart Failure. 2010;3(2):195-201. [DOI] [PubMed] [Google Scholar]
Wolfson 1996 {published data only}
- Judge JO, Whipple RH, Wolfson LI. Effects of resistive and balance exercises on isokinetic strength in older persons. Journal of the American Geriatrics Society 1994;42(9):937-46. [DOI] [PubMed] [Google Scholar]
- Pacala JT, Judge JO, Boult C. Factors affecting sample selection in a randomized trial of balance enhancement: The FICSIT study. Journal of the American Geriatrics Society 1996;44(4):377-82. [DOI] [PubMed] [Google Scholar]
- Wolfson L, Whipple R, Derby C, Judge J, King M, Amerman P, et al. Balance and strength training in older adults: intervention gains and Tai Chi maintenance. Journal of the American Geriatrics Society 1996;44:498-506. [DOI] [PubMed] [Google Scholar]
- Wolfson L, Whipple R, Judge J, Amerman P, Derby C, King M. Training balance and strength in the elderly to improve function. Journal of the American Geriatrics Society 1993;41:341-3. [DOI] [PubMed] [Google Scholar]
Xia 2009 {published data only}
- Xia QH, Jiang Y, Niu CJ, Tang CX, Xia ZL. Effectiveness of a community-based multifaceted fall-prevention intervention in active and independent older Chinese adults. Injury Prevention 2009;15(4):248-51. [DOI] [PMC free article] [PubMed] [Google Scholar]
Yardley 2007 {published data only}
- Yardley L, Nyman SR. Internet provision of tailored advice on falls prevention activities for older people: a randomized controlled evaluation. Health Promotion International 2007;22(2):122-8. [DOI] [PubMed] [Google Scholar]
Yates 2001 {published data only}
- Yates SM, Dunnagan TA. Evaluating the effectiveness of a home-based fall risk reduction program for rural community-dwelling older adults. Journals of Gerontology. Series A, Biological Sciences and Medical Sciences 2001;56(4):M226-30. [DOI] [PubMed] [Google Scholar]
Ytterstad 1996 {published data only}
- Sattin RW. Preventing injurious falls [comment on: J Epidemiol Commun Health 1996;50:551-8]. Lancet 1997;349:150. [DOI] [PubMed] [Google Scholar]
- Ytterstad B. The Harstad injury prevention study: community based prevention of fall-fractures in the elderly evaluated by means of a hospital based injury recording system in Norway. Journal of Epidemiology and Community Health 1996;50(5):551-8. [DOI] [PMC free article] [PubMed] [Google Scholar]
Zhang 2006 {published data only}
- Zhang JG, Ishikawa-Takata K, Yamazaki H, Morita T, Ohta T. The effects of Tai Chi Chuan on physiological function and fear of falling in the less robust elderly: An intervention study for preventing falls. Archives of Gerontology & Geriatrics 2006;42(2):107-16. [DOI] [PubMed] [Google Scholar]
Zijlstra 2009 {published data only}43792817
- ISRCTN43792817. Reduction of fear of falling and associated increase in functional ability, activity level and quality of life in community-living older adults who are at risk for falling: a randomised controlled trial. controlled-trials.com/ISRCTN43792817 (accessed 14 September 2011).
- Kempen GI, Oude Wesselink SF, Haastregt JC, Zijlstra GA. Long-term effect on mortality of a multicomponent cognitive behavioural group intervention to reduce fear of falling in older adults: A randomised controlled trial. Age and Ageing 2011;40(4):519-23. [DOI] [PubMed] [Google Scholar]
- Haastregt JC, Zijlstra GA, Rossum E, Eijk JT, Witte LP, Kempen GI. Feasibility of a cognitive behavioural group intervention to reduce fear of falling and associated avoidance of activity in community-living older people: a process evaluation. BMC Health Services Research 2007;7:156. [DOI] [PMC free article] [PubMed] [Google Scholar]
- Zijlstra G, Haastregt JC, Eijk JT, Kempen GI. Evaluating an intervention to reduce fear of falling and associated activity restriction in elderly persons: design of a randomised controlled trial [ISRCTN43792817]. BMC Public Health 2005;5(1):26. [DOI] [PMC free article] [PubMed] [Google Scholar]
- Zijlstra GA, Haastregt JC, Ambergen T, Rossum E, Eijk JT, Tennstedt SL, et al. Effects of a multicomponent cognitive behavioral group intervention on fear of falling and activity avoidance in community-dwelling older adults: results of a randomized controlled trial. Journal of the American Geriatrics Society 2009;57(11):2020-8. [DOI] [PubMed] [Google Scholar]
- Zijlstra GA, Haastregt JC, Eijk JT, Witte LP, Ambergen T, Kempen GI. Mediating effects of psychosocial factors on concerns about falling and daily activity in a multicomponent cognitive behavioral group intervention. Aging & Mental Health 2011;15(1):68-77. [DOI] [PubMed] [Google Scholar]
References to studies awaiting assessment
Adunsky 2011 {published data only}
- Adunsky A, Chandler J, Heyden N, Lutkiewicz J, Scott BB, Berd Y, et al. MK-0677 (ibutamoren mesylate) for the treatment of patients recovering from hip fracture: a multicenter, randomized, placebo-controlled phase IIb study. Archives of Gerontology & Geriatrics 2011;53(2):183-9. [DOI] [PubMed] [Google Scholar]
Bighea 2011 {published data only}
- Bighea A, Patru S, Bumbea A, Popescu R. Randomized controlled trial of a home based exercise and balance training programme in elderly women with osteoporosis [abstract]. Osteoporosis International 2011;22(Suppl 1):S238. [EMBASE: 70393947] [Google Scholar]
- Bighea AC, Patru S, Marcu IR, Popescu RS. A home based exercise and balance training programme increase physical activity and improves health in women with osteoporosis [abstract]. Osteoporosis International 2010;21:S160. [EMBASE: 70225942] [Google Scholar]
- Patru S, Bighea AC, Marcu IR, Popescu RS. Randomized controlled trial of exercise fall prevention program in elderly women with osteoporosis [abstract]. Osteoporosis International 2010;21:S347. [EMBASE: 70226355] [Google Scholar]
Clemson 2012 {published data only}
- ACTRN12606000025538. Lifestyle (LIFE) versus structured balance and strength training to reduce falls in the elderly: a randomized trial. www.anzctr.org.au/trial_view.aspx?ID=1007 (accessed 15 June 2012).
- Clemson L, Fiatarone Singh MA, Bundy A, Cumming RG, Manollaras K, O'Loughlin P, et al. Integration of balance and strength training into daily life activity to reduce rate of falls in older people (the LiFE study): randomised parallel trial. BMJ 2012;345(7870):Article Number: e4547. [DOI] [PMC free article] [PubMed]
Freiberger 2012 {published and unpublished data}
- Freiberber E. personal communication October 25 2007.
- Freiberger E, Haberle L, Spirduso WW, Zijlstra GAR. Long-term effects of three multicomponent exercise interventions on physical performance and fall-related psychological outcomes in community-dwelling older adults: a randomized controlled trial. Journal of the American Geriatrics Society 2012 Feb 10 [Epub ahead of print]. [DOI: 10.1111/j.1532-5415.2011.03859.x] [DOI] [PubMed]
- Freiberger E, Menz HB, Abu-Omar K, Rutten A. Preventing falls in physically active community-dwelling older people: a comparison of two intervention techniques. Gerontology 2007;53(5):298-305. [DOI] [PubMed] [Google Scholar]
- Freiberger E, Menz HB. Characteristics of falls in physically active community-dwelling older people: Findings from the 'Standfest im Alter' study. Zeitschrift fur Gerontologie und Geriatrie 2006;39(4):261-7. [DOI] [PubMed] [Google Scholar]
- Freiberger E. personal communication December 12 2007.
Glendenning 2012 {published data only}
- ACTRN12609000748213. A randomised controlled placebo-controlled study to evaluate the effects of vitamin D treatment on reducing hospital admissions for falls, fractures and other disorders in elderly women. www.anzctr.org.au/trial_view.aspx?ID=308329 (accessed 11 October 2011).
- Glendenning P, Zhu K, Inderjeeth C, Howat P, Lewis JR, Prince RL. Effects of three monthly oral 150,000 IU cholecalciferol supplementation on falls, mobility and muscle strength in older postmenopausal women: a randomised controlled trial. Journal of Bone and Mineral Research 2012;27(1):170-6. [DOI: 10.1002/jbmr.5241] [DOI] [PubMed]
Neelemaat 2012 {published data only}
- Neelemaat F, Bosmans JE, Thijs A, Seidell JC, Van Bokhorst-De Van Der Schueren MAE. Post-discharge nutritional support in malnourished elderly individuals improves functional limitations. Journal of the American Medical Directors Association 2011;12(4):295-301. [DOI] [PubMed] [Google Scholar]
- Neelemaat F, Lips P, Bosmans JE, Thijs A, Seidell JC, Van Bokhorst-De Van Der Schueren MAE. Short-term oral nutritional intervention with protein and vitamin D decreases falls in malnourished older adults. Journal of the American Geriatrics Society 2012 Feb 8 [Epub ahead of print]. [DOI: 10.1111/j.1532-5415.2011.03888.x] [DOI] [PubMed]
- Neelemaat F, Thijs A, Seidell JC, Bosmans JE, Van Bokhorst-De Van Der Schueren MAE. Study protocol: Cost-effectiveness of transmural nutritional support in malnourished elderly patients in comparison with usual care. Nutrition Journal 2010;9(1):Article number: 6. [DOI] [PMC free article] [PubMed] [Google Scholar]
Pérula 2012 {published data only}
- Pérula LA, Varas-Fabra F, Rodríguez V, Ruiz-Moral R, Fernández JA, González J, et al. Effectiveness of a multifactorial intervention program to reduce falls incidence among community-living elderly people: a randomised clinical trial (The EPICA Study). Archives of Physical Medicine and Rehabilitation 2012 May 15 [Epub ahead of print]. [DOI] [PubMed]
Sach 2012 {published data only}ISRCTN67535605
- Sach TH, Logan PA, Coupland CA, Gladman JR, Sahota O, Stoner-Hobbs V, et al. Community falls prevention for people who call an emergency ambulance after a fall: aneconomic evaluation alongside a randomised controlled trial. Age and Ageing 2012 June 13 [Epub ahead of print]. [DOI: 10.1093/ageing/afs071 ] [DOI] [PMC free article] [PubMed]
Taylor 2012 {published data only}
- Taylor D, Hale L, Schluter P, Waters DL, Binns EE, McCracken H, et al. Effectiveness of tai chi as a community-based falls prevention intervention: a randomized controlled trial. Journal of the Americn Geriatrics Society 2012;60(5):841-8. [DOI] [PubMed] [Google Scholar]
References to ongoing studies
ACTRN012606000023550 {published data only}
- ACTRN12606000023550. Healthy Steps: A trial of pedometer-based Green Prescription to improve physical activity, health-related quality of life, and health and physical functioning in low-active older adults. www.anzctr.org.au/trial_view.aspx?ID=996 (accessed 2 September 2011).
- Kolt GS, Schofield GM, Kerse N, Garrett N, Schluter PJ, Ashton T, et al. The healthy steps study: a randomized controlled trial of a pedometer-based green prescription for older adults. Trial protocol. BMC Public Health 2009;9:404. [DOI] [PMC free article] [PubMed] [Google Scholar]
ACTRN12607000017426 {published data only}
- ACTRN12607000017426. A randomised controlled trial on improving gait speed and other health outcomes for elderly patients with hip fracture using an individualised nutrition and exercise program. www.anzctr.org.au/trial_view.aspx?ID=81735 (accessed 2 September 2011).
- Thomas SK, Humphreys KJ, Miller MD, Cameron ID, Whitehead C, Kurrle S, et al. Individual nutrition therapy and exercise regime: a controlled trial of injured, vulnerable elderly (INTERACTIVE trial). BMC Geriatrics 2008;8:4. [MEDLINE: 18302787 ] [DOI] [PMC free article] [PubMed] [Google Scholar]
ACTRN12607000018415 {published data only}
- ACTRN12607000018415. An evaluation of the Accident Compensation Corporation (ACC) Tai Chi programme in older adults: does it reduce falls. www.anzctr.org.au/trial_view.aspx?ID=1475 (accessed 11 August 2011).
- Waters DL, Hale L, Grant AM, Herbison P, Goulding A. Osteoporosis and gait and balance disturbances in older sarcopenic obese New Zealanders. Osteoporosis International 2010;21(2):351-7. [MEDLINE: ] [DOI] [PubMed] [Google Scholar]
ACTRN12607000206426 {published data only}
- ACTRN12607000206426. Community care and hospital based collaborative falls prevention project. www.anzctr.org.au/trial_view.aspx?ID=81955 (accessed 30 November 2011).
ACTRN12607000563460 {published data only}
- ACTRN12607000563460. Minimising disability and falls in older people through a post-hospital individualised exercise program. www.anzctr.org.au/trial_view.aspx?ID=82384 (accessed 2 September 2011).
- Sherrington C, Lord SR, Vogler CM, Close JC, Howard K, Dean CM, et al. Minimising disability and falls in older people through a post-hospital exercise program: a protocol for a randomised controlled trial and economic evaluation. BMC Geriatrics 2009;9:8. [MEDLINE: ] [DOI] [PMC free article] [PubMed]
ACTRN12610000576022 {published data only}
- ACTRN12610000576022. A comparison on the effectiveness of a novel intervention programme against a traditional supervised exercise programme in improving the fall efficacy in the moderate frail population aged 60 and above. www.anzctr.org.au/trial_view.aspx?ID=335721 (accessed 31 July 2011).
- Kwok BC, Mamun K, Chandran M, Wong CH. Evaluation of the Frails' Fall Efficacy by Comparing Treatments (EFFECT) on reducing fall and fear of fall in moderately frail older adults: study protocol for a randomised control trial. Trials 2011;12:155. [DOI] [PMC free article] [PubMed] [Google Scholar]
ACTRN12610000805077 {published data only}
- ACTRN12610000805077. RESTORE: Recovery exercises and Stepping On after fracture. www.anzctr.org.au/trial_view.aspx?ID=335781 (accessed 28 March 2012).
ACTRN12610000838011 {published data only}
- ACTRN12610000838011. In community-dwelling older people who have fallen, does the provision of falls prevention interventions and osteoporosis treatment through a specialist Falls and Bone service prevent more falls than care coordinated by General Practitioners. www.anzctr.org.au/trial_view.aspx?ID=335807 (accessed 30 November 2011).
Ferrer 2010 {published data only}
- Ferrer A, Badia T, Formiga F, Almeda J, Fernandez C, Pujol R. Gender differences in health status in a population of over 85 year-olds. The Octabaix study [Diferencias de genero en el perfil de salud de una cohorte de 85 anos. Estudio Octabaix]. Atencion Primaria 2011;43(11):577-84. [EMBASE: 2011609254] [DOI] [PMC free article] [PubMed] [Google Scholar]
- Ferrer A, Badia T, Formiga F, Gil A, Padros G, Sarro M, et al. A randomized clinical trial of falls and malnutrition prevention in community-dwelling elders aged 85 years old. The OCTABAIX study [Ensayo clinico aleatorizado de prevencion de caidas y malnutricion en personas de 85 anos en la comunidad. Estudio OCTABAIX]. Revista Espanola de Geriatria y Gerontologia 2010;45(2):79-85. [DOI] [PubMed] [Google Scholar]
ISRCTN10538608 {published data only}10538608
- ISRCTN10538608. SAFER (Support and Assessment for Fall Emergency Referrals) Trial: Evaluation of the costs and benefits of computerised on-scene decision support for emergency ambulance personnel to assess and plan appropriate care for older people who have fallen: a randomised controlled trial. www.controlled-trials.com/ISRCTN10538608 (accessed 2 September 2011).
- Snooks H, Cheung WY, Close J, Dale J, Gaze S, Humphreys I, et al. Support and Assessment for Fall Emergency Referrals (SAFER 1) trial protocol. Computerised on-scene decision support for emergency ambulance staff to assess and plan care for older people who have fallen: evaluation of costs and benefits using a pragmatic cluster randomised trial. BMC Emergency Medicine 2010;10:2. [DOI] [PMC free article] [PubMed] [Google Scholar]
- Thomas G, Sanchez A, Snooks H. Before the fall: A discussion paper on the organisational difficulties of setting up complex randomised control trials in emergency pre-hospital care [abstract]. Emergency Medicine Journal 2011;28(3):2. [Google Scholar]
ISRCTN11861569 {published data only}11861569
- ISRCTN11861569. Falls prevention for frail older adults: Cost-efficacy analysis of balance training based on Tai Chi. www.controlled-trials.com/ISRCTN11861569 (accessed 19 September 2008).
- Tousignant M, Corriveau H, Roy PM, Desrosiers J, Dubec N, Hébert R, et al. The effect of supervised Tai Chi intervention compared to a physiotherapy program on fall-related clinical outcomes: a randomized clinical trial. Disability & Rehabilitation 2012;34(3):196-201. [MEDLINE: ] [DOI] [PubMed] [Google Scholar]
- Tousignant M. personal communication 08 August 2011.
ISRCTN43453770 {published data only}43453770
- Iliffe S, Kendrick D, Morris R, Skelton D, Gage H, Dinan S, et al. Multi-centre cluster randomised trial comparing a community group exercise programme with home based exercise with usual care for people aged 65 and over in primary care: protocol of the ProAct 65+ trial. Trials 2010;11(1):6. [MEDLINE: ] [DOI] [PMC free article] [PubMed] [Google Scholar]
- ISRCTN43453770. Promoting physical activity in people aged 65+. www.controlled-trials.com/ISRCTN43453770 (accessed 19 July 2010).
- Perry L, Kendrick D, Morris R, Dinan S, Masud T, Skelton D, et al. Completion and return of fall diaries varies with participants' level of education, first language, and baseline fall risk. Journals of Gerontology Series A-Biological Sciences & Medical Sciences 2012;67(2):210-4. [DOI] [PubMed] [Google Scholar]
ISRCTN48015966 {published data only}48015966
- ISRCTN48015966. The Chaos Clinic for prevention of falls and related injuries: a randomised, controlled trial. www.controlled-trials.com/ISRCTN48015966 (accessed 2 September 2011).
ISRCTN57066881 {published data only}57066881
- Clegg A, Barber S, Young J, Forster A, Iliffe S. The Home-Based Older People's Exercise (HOPE) trial: Study protocol for a randomised controlled trial. Trials 2011;12:Article number 143. [DOI] [PMC free article] [PubMed] [Google Scholar]
- ISRCTN57066881. The Home-based Older People's Exercise (HOPE) programme: an exercise programme to improve the functional status of older people. www.controlled-trials.com/ISRCTN57066881 (accessed 2 September 2011).
ISRCTN60481756 {published data only}60481756
- Care of older people who fall: evaluation of the clinical and cost effectiveness of new protocols for emergency ambulance personnel to assess and refer to appropriate community based care. www.hta.ac.uk/1802 (accessed 2 May 2011).
- Gaze S. SAFER 2: Support and assessment for fall emergency referrals (part of the SAFER research programme [abstract]. Emergency Medicine Journal 2011;28(3):3. [Google Scholar]
- ISRCTN60481756. Care of older people who fall: evaluation of the clinical and cost effectiveness of new protocols for emergency ambulance personnel to assess and refer to appropriate community based care - a cluster randomised controlled trial. www.controlled-trials.com/ISRCTN60481756 (accessed 2 May 2011).
ISRCTN68240461 {published data only}68240461
- ISRCTN68240461. Multifaceted podiatry intervention for fall prevention in patients over 70 years of age. www.controlled-trials.com/ISRCTN68240461 (accessed 2 September 2011).
ISRCTN71002650 {published data only}71002650
- ISRCTN71002650. Prevention of Fall Injury Trial: a parallel group cluster randomised controlled trial and economic evaluation. www.controlled-trials.com/ISRCTN71002650 (accessed 22 Sept 2010).
- Lamb S. Prevention of fall related injuries trial (Pre-FIT). www.hta.ac.uk/2146 (accessed 22 Sept 2010).
NCT00413933 {published data only}
- NCT00413933. Comprehensive intervention for falls prevention in the elderly. clinicaltrials.gov/show/NCT00413933 (accessed 31 March 2008).
NCT00483275 {published data only}
- NCT00483275. Fall prevention by alfacalcidol and training (SPALT). clinicaltrials.gov/show/NCT00483275 (accessed 23 February 2011).
NCT00934531 {published data only}
- Montero-Odasso M, Wells JL, Borrie MJ, Speechley M. Can cognitive enhancers reduce the risk of falls in older people with mild cognitive impairment? A protocol for a randomised controlled double blind trial. BMC Neurology 2009;9:42. [DOI] [PMC free article] [PubMed] [Google Scholar]
- NCT00934531. Donepezil and the risk of falls in seniors with cognitive impairment. clinicaltrials.gov/show/NCT00934531 (accessed 31 August 2011).
NCT00946062 {published data only}
- NCT00946062. Evaluation of a standardised orientation and mobility training in older adults with low vision. clinicaltrials.gov/show/NCT00946062 (accessed 31 August 2011).
- Zijlstra GA, Rens GH, Scherder EJ, Brouwer DM, der V, Verstraten PF, et al. Effects and feasibility of a standardised orientation and mobility training in using an identification cane for older adults with low vision: design of a randomised controlled trial. BMC Health Services Research 2009;9:153. [DOI] [PMC free article] [PubMed] [Google Scholar]
NCT00986466 {published data only}
- NCT00986466. Vitamin D and exercise in falls prevention (DEX). clinicaltrials.gov/show/NCT00986466 (accessed 31 August 2011).
NCT01029171 {published data only}
- Donaldson MG, Khan KM, Sobolev B, Janssen P, Cook WL, McKay HA. Action Seniors!: An RCT of the Otago Home Exercise Program to ameliorate fall risk factor profile in patients at high risk of falls [abstract]. Annual Meeting of the American Society for Bone and Mineral Research; 2007 Sept 16-20; Honolulu (Hawaii).
- NCT01029171. Action Seniors! Exercise to prevent falls. clinicaltrials.gov/show/NCT01029171 (accessed 31 August 2011).
NCT01032252 {published data only}
- Blank WA, Freiberger E, Siegrist M, Landendoerfer P, Linde K, Schuster T, et al. An interdisciplinary intervention to prevent falls in community-dwelling elderly persons: protocol of a cluster-randomized trial [PreFalls]. BMC Geriatrics 2011;11:7. [MEDLINE: ] [DOI] [PMC free article] [PubMed] [Google Scholar]
- NCT01032252. Prevention of falls in general practitioner for community-dwelling older adults [PreFalls]. clinicaltrials.gov/show/NCT01032252 (accessed August 2011).
NCT01080196 {published data only}
- NCT01080196. Reducing falls with RENEW in older adults who have fallen. clinicaltrials.gov/show/NCT01080196 (accessed 31 August 2011).
NCT01358032 {published data only}
- Dorresteijn TA, Zijlstra GA, Delbaere K, Rossum E, Vlaeyen JW, Kempen GI. Evaluating an in-home multicomponent cognitive behavioural programme to manage concerns about falls and associated activity avoidance in frail community-dwelling older people: Design of a randomised control trial [NCT01358032]. BMC Health Services Research 2011;11:228. [DOI] [PMC free article] [PubMed] [Google Scholar]
- NCT01358032. Evaluating an in-home multicomponent program to manage concerns about falling in frail community dwelling older people. clinicaltrials.gov/ct2/show/NCT01358032 (accessed 04 March 2012).
NCT01452243 {published data only}
- Lopez-Torres Hidalgo J, ANVITAD Group. Prevention of falls and fractures in old people by administration of calcium and vitamin D. randomized clinical trial. BMC Public Health 2011;11:910. [DOI] [PMC free article] [PubMed] [Google Scholar]
- NCT01452243. Prevention of Falls and Fractures in Old People by Administration of Calcium and Vitamin D. Randomized Clinical Trial (ANVITAD). clinicaltrials.gov/ct2/show/NCT01452243 (accessed 14 March 2012).
NTR1593 {published data only}
- Hartholt KA, Van Der Velde N, Lieshout EM, Polinder S, Vries OJ, Boye ND, et al. [Cost]effectiveness of withdrawal of fall-risk increasing drugs versus conservative treatment in older fallers: design of a multicenter randomized controlled trial (IMPROveFALL-study). BMC Geriatrics 2011;11:48. [DOI] [PMC free article] [PubMed] [Google Scholar]
- NTR1593. Research into prevention of medication induced fall incidents. www.trialregister.nl/trialreg/admin/rctview.asp?TC=1593 (accessed 05 March 2012).
Additional references
Boutron 2008
- Boutron I, Moher D, Altman DG, Schulz KF, Ravaud P, CONSORT Group. Extending the CONSORT statement to randomized trials of nonpharmacologic treatment: explanation and elaboration. Annals of Internal Medicine 2008;148(4):295-309. [DOI] [PubMed] [Google Scholar]
Cameron 2010
- Cameron ID, Murray GR, Gillespie LD, Robertson MC, Hill KD, Cumming RG, et al. Interventions for preventing falls in older people in nursing care facilities and hospitals. Cochrane Database of Systematic Reviews 2010, Issue 1. Art. No: CD005465. [DOI: 10.1002/14651858.CD005465.pub2] [DOI] [PubMed] [Google Scholar]
Campbell 1990
- Campbell AJ, Borrie MJ, Spears GF, Jackson SL, Brown JS, Fitzgerald JL. Circumstances and consequences of falls experienced by a community population 70 years and over during a prospective study. Age and Ageing 1990;19:136-41. [DOI] [PubMed] [Google Scholar]
Campbell 1999c
- Campbell AJ, Robertson MC, Gardner MM, Norton RN, Buchner D. Falls prevention over 2 years: a randomized controlled trial in women 80 years and older. Age and Ageing 1999;28:513-18. [DOI] [PubMed] [Google Scholar]
Campbell 2004
- Campbell MK, Elbourne DR, Altman DG, CONSORT Group. CONSORT statement: extension to cluster randomised trials. BMJ 2004;328(7441):702-8. [DOI] [PMC free article] [PubMed] [Google Scholar]
Campbell 2006
- Campbell AJ, Robertson MC. Implementation of multifactorial interventions for fall and fracture prevention. Age and Ageing 2006;35 Suppl 2:ii60-4. [DOI] [PubMed] [Google Scholar]
Close 2000
- Close JCT, Patel A, Hooper R, Glucksman E, Jackson SHD, Swift CG. PROFET: improved clinical outcomes at no additional cost [abstract]. Age and Ageing 2000;29(Suppl 1):48. [Google Scholar]
Cummings 1995
- Cummings SR, Nevitt MC, Browner WS, Stone K, Fox KM, Ensrud KE et al. Risk factors for hip fracture in white women. Study of Osteoporotic Fractures Research Group [see comments]. New England Journal of Medicine 1995;332(12):767-73. [DOI] [PubMed] [Google Scholar]
Davis 2009
- Davis J, Guy P, Liu-Ambrose T, Donaldson M, Robertson M, Khan K, et al. Cost-effectiveness analysis of the Otago home-based strength and balance retraining in senior fallers [abstract]. Journal of Nutrition, Health & Aging 2009;13(Suppl 1):S436. [DOI: 10.1007/s12603-009-0095-9] [DOI] [Google Scholar]
Davis 2010
- Davis JC, Robertson MC, Ashe MC, Liu-Ambrose T, Khan KM, Marra CA. Does a home-based strength and balance programme in people aged > or =80 years provide the best value for money to prevent falls? A systematic review of economic evaluations of falls prevention interventions. British Journal of Sports Medicine 2010;44(2):80-9. [DOI] [PubMed] [Google Scholar]
Davis 2011b
- Davis JC, Robertson MC, Comans T, Scuffham PA. Guidelines for conducting and reporting economic evaluation of fall prevention strategies. Osteoporosis International 2011;22(9):2449-59. [DOI] [PubMed] [Google Scholar]
Deandrea 2010
- Deandrea S, Lucenteforte E, Bravi F, Foschi R, La VC, Negri E. Risk factors for falls in community-dwelling older people: a systematic review and meta-analysis. Epidemiology 2010;21(5):658-68. [DOI] [PubMed] [Google Scholar]
Excel [Computer program]
- Excel X for Mac. Version 12.2.8. Microsoft, 2008.
Findorff 2007
- Findorff MJ, Wyman JF, Nyman JA, Croghan CF. Measuring the direct healthcare costs of a fall injury event. Nursing Research 2007;56(4):283-7. [DOI] [PubMed] [Google Scholar]
Gillespie 2003
- Gillespie LD, Gillespie WJ, Robertson MC, Lamb SE, Cumming RG, Rowe BH. Interventions for preventing falls in elderly people. Cochrane Database of Systematic Reviews 2003, Issue 4. Art. No: CD000340. [DOI: 10.1002/14651858.CD000340] [DOI] [PubMed] [Google Scholar]
Haas 2006
- Haas M. Economic analysis of tai chi as a means of preventing falls and falls related injuries among older adults. CHERE working paper 2006/4. Sydney, Australia: Centre for Health Economics Research and Evaluation, University of Technology. datasearch.uts.edu.au/chere/research/working_papers.cfm (accessed 30 November 2011).
Hannan 2010
- Hannan MT, Gagnon MM, Aneja J, Jones RN, Cupples LA, Lipsitz LA, et al. Optimizing the tracking of falls in studies of older participants: comparison of quarterly telephone recall with monthly falls calendars in the MOBILIZE Boston Study. American Journal of Epidemiology 2010;171(9):1031-6. [DOI] [PMC free article] [PubMed] [Google Scholar]
Hauer 2006
- Hauer K, Lamb SE, Jorstad EC, Todd C, Becker C, ProFaNE-Group. Systematic review of definitions and methods of measuring falls in randomised controlled fall prevention trials. Age and Ageing 2006;35(1):5-10. [DOI] [PubMed] [Google Scholar]
Higgins 2003
- Higgins JP, Thompson SG, Deeks JJ, Altman DG. Measuring inconsistency in meta-analyses. BMJ 2003;327(7414):557-60. [DOI] [PMC free article] [PubMed] [Google Scholar]
Higgins 2011a
- Higgins JPT, Altman DG, Sterne JAC (editors). Chapter 8: Assessing risk of bias in included studies. In: Higgins JPT, Green S (editors). Cochrane Handbook of Systematic Reviews of Interventions Version 5.1.0 (updated March 2011). The Cochrane Collaboration, 2011. Available from www.cochrane-handbook.org.
Higgins 2011b
- Higgins JPT, Deeks JJ, Altman DG (editors). Chapter 16.3.4: Approximate analyses of cluster-randomized trials for meta-analysis: effective sample sizes. In: Higgins JPT, Green S (editors). Cochrane Handbook of Systematic Reviews of Interventions Version 5.1.0 (updated March 2011). The Cochrane Collaboration, 2011. Available from www.cochrane-handbook.org.
Higgins 2011c
- Deeks JJ, Higgins JPT, Altman DG (editors). Chapter 9.6.3.1 Is the effect different in different subgroups? In: Higgins JPT, Green S (editors). Cochrane Handbook of Systematic Reviews of Interventions Version 5.1.0 (updated March 2011). The Cochrane Collaboration, 2011. Available from www.cochrane-handbook.org.
Irvine 2010
- Irvine L, Conroy SP, Sach T, Gladman JR, Harwood RH, Kendrick D, et al. Cost-effectiveness of a day hospital falls prevention programme for screened community-dwelling older people at high risk of falls. Age and Ageing 2010;39(6):710-6. [DOI] [PMC free article] [PubMed] [Google Scholar]
Keene 1993
- Keene GS, Parker MJ, Pryor GA. Mortality and morbidity after hip fractures. BMJ 1993;307(6914):1248-50. [MEDLINE: ] [DOI] [PMC free article] [PubMed] [Google Scholar]
Kellogg 1987
- Anonymous. The prevention of falls in later life. A report of the Kellogg International Work Group on the Prevention of Falls by the Elderly. Danish Medical Bulletin 1987;34 Suppl 4:1-24. [PubMed] [Google Scholar]
Lamb 2005
- Lamb SE, Jorstad-Stein EC, Hauer K, Becker C, Prevention of Falls Network Europe and Outcomes Consensus Group. Development of a common outcome data set for fall injury prevention trials: the Prevention of Falls Network Europe consensus. Journal of the American Geriatrics Society 2005;53(9):1618-22. [DOI] [PubMed] [Google Scholar]
Lamb 2011
- Lamb SE, Becker C, Gillespie LD, Smith JL, Finnegan S, Potter R, et al. Reporting of complex interventions in clinical trials: development of a taxonomy to classify and describe fall-prevention interventions. Trials [Electronic Resource] 2011;12:125. [DOI] [PMC free article] [PubMed] [Google Scholar]
Lefebvre 2011
- Lefebvre C, Manheimer E, Glanville J. Chapter 6.4.11.1 The Cochrane Highly Sensitive Search Strategies for identifying randomized trials in MEDLINE. In: Higgins JPT, Green S (editors). Cochrane Handbook for Systematic Reviews of Interventions Version 5.1.0 (updated March 2011). The Cochrane Collaboration, 2011. Available from www.cochrane-handbook.org.
Lord 2008
McAlister 2003
- McAlister FA, Straus SE, Sackett DL, Altman DG. Analysis and reporting of factorial trials: a systematic review. JAMA 2003;289(19):2545-53. [DOI] [PubMed] [Google Scholar]
Nyman 2012
- Nyman SR, Victor CR. Older people's participation in and engagement with falls prevention interventions in community settings: an augment to the Cochrane systematic review. Age & Ageing 2012;41(1):16-23. [DOI] [PubMed] [Google Scholar]
Peel 2002
- Peel NM, Kassulke DJ, McClure RJ. Population based study of hospitalised fall related injuries in older people. Injury Prevention 2002;8(4):280-3. [DOI] [PMC free article] [PubMed] [Google Scholar]
Peeters 2011
- Peeters GM, Heymans MW, Vries OJ, Bouter LM, Lips P, Tulder MW. Multifactorial evaluation and treatment of persons with a high risk of recurrent falling was not cost-effective. Osteoporosis International 2011;22(7):2187-96. [DOI] [PMC free article] [PubMed] [Google Scholar]
RevMan 5.1 [Computer program]
- Review Manager (RevMan). Version 5.1. Copenhagen: The Nordic Cochrane Centre, The Cochrane Collaboration, 2011.
Rizzo 1996
- Rizzo JA, Baker DI, McAvay G, Tinetti ME. The cost-effectiveness of a multifactorial targeted prevention program for falls among community elderly persons. Medical Care 1996;34:954-69. [DOI] [PubMed] [Google Scholar]
Robertson 2001c
- Robertson MC, Devlin N, Scuffham P, Gardner MM, Buchner DM, Campbell AJ. Economic evaluation of a community based exercise programme to prevent falls. Journal of Epidemiology and Community Health 2001;55(8):600-6. [DOI] [PMC free article] [PubMed] [Google Scholar]
Robertson 2001d
- Robertson MC. Development of a falls prevention programme for elderly people: evaluation of efficacy, effectiveness, and efficiency. Dunedin (NZ): Univ. of Otago, 2001. [Google Scholar]
Robertson 2005
- Robertson MC, Campbell AJ, Herbison P. Statistical analysis of efficacy in falls prevention trials. Journals of Gerontology Series A-Biological Sciences & Medical Sciences 2005;60(4):530-4. [DOI] [PubMed] [Google Scholar]
Sach 2007
- Sach TH, Foss AJ, Gregson RM, Zaman A, Osborn F, Masud T, et al. Falls and health status in elderly women following first eye cataract surgery: an economic evaluation conducted alongside a randomised controlled trial. British Journal of Ophthalmology 2007;91(12):1675-9. [DOI] [PMC free article] [PubMed] [Google Scholar]
Sach 2010
- Sach TH, Foss AJ, Gregson RM, Zaman A, Osborn F, Masud T, et al. Second-eye cataract surgery in elderly women: a cost-utility analysis conducted alongside a randomized controlled trial. Eye 2010;24(2):276-83. [DOI] [PubMed] [Google Scholar]
Salkeld 2000
- Salkeld G, Cumming RG, O'Neill E, Thomas M, Szonyi G, Westbury C. The cost effectiveness of a home hazard reduction program to reduce falls among older persons. Australian and New Zealand Journal of Public Health 2000;24(3):265-71. [DOI] [PubMed] [Google Scholar]
Sherrington 2011
- Sherrington C, Tiedemann A, Fairhall N, Close JC, Lord SR. Exercise to prevent falls in older adults: an updated meta-analysis and best practice recommendations. [Review]. New South Wales Public Health Bulletin 2011;22(3-4):78-83. [DOI] [PubMed] [Google Scholar]
Smeeth 2002
- Smeeth L, Ng ES. Intraclass correlation coefficients for cluster randomized trials in primary care: data from the MRC Trial of the Assessment and Management of Older People in the Community. Controlled Clinical Trials 2002;23(4):409-21. [DOI] [PubMed] [Google Scholar]
Stata [Computer program]
- Stata Statistical Software. Version 11.2. Statacorp, 2009.
Tinetti 1988
- Tinetti ME, Speechley M, Ginter SF. Risk factors for falls among elderly persons living in the community. New England Journal of Medicine 1988;319:1701-7. [DOI] [PubMed] [Google Scholar]
Tinetti 1997
- Tinetti ME, Williams CS. Falls, injuries due to falls, and the risk of admission to a nursing home. New England Journal of Medicine 1997;337(18):1279-84. [DOI] [PubMed] [Google Scholar]
Verheyden 2010
- Verheyden GSAF, Weerdesteyn V, Pickering RM, Hyndman D, Lennon S, Geurts ACH, et al. Interventions for preventing falls in people after stroke. Cochrane Database of Systematic Reviews 2010, Issue 10. Art. No: CD008728. [DOI: 10.1002/14651858.CD008728] [DOI] [PMC free article] [PubMed] [Google Scholar]
Yardley 2002
- Yardley L, Smith H. A prospective study of the relationship between feared consequences of falling and avoidance of activity in community-living older people. Gerontologist 2002;42(1):17-23. [DOI] [PubMed] [Google Scholar]
Zecevic 2006
- Zecevic AA, Salmoni AW, Speechley M, Vandervoort AA. Defining a fall and reasons for falling: comparisons among the views of seniors, health care providers, and the research literature. Gerontologist 2006;46(3):367-76. [DOI] [PubMed] [Google Scholar]
Zwarenstein 2008
- Zwarenstein M, Treweek S, Gagnier JJ, Altman DG, Tunis S, Haynes B, et al. Improving the reporting of pragmatic trials: an extension of the CONSORT statement. BMJ 2008;337:a2390. [DOI] [PMC free article] [PubMed] [Google Scholar]
References to other published versions of this review
Gillespie 2008
- Gillespie LD, Robertson MC, Gillespie WJ, Lamb S, Gates S, Cumming RG, et al. Interventions for preventing falls in older people living in the community. Cochrane Database of Systematic Reviews 2008, Issue 2. Art. No: CD007146. [DOI: 10.1002/14651858.CD007146] [DOI] [PubMed] [Google Scholar]
Gillespie 2009
- Gillespie LD, Robertson MC, Gillespie WJ, Lamb SE, Gates S, Cumming RG, Rowe BH. Interventions for preventing falls in older people living in the community. Cochrane Database of Systematic Reviews 2009, Issue 2. Art. No: CD007146. [DOI: 10.1002/14651858.CD007146.pub2] [DOI] [PubMed] [Google Scholar]