

Abstract
Background and Purpose
Dopamine has multiple anti‐inflammatory effects, but its role and molecular mechanism in acute pancreatitis (AP) are unclear. We investigated the role of dopamine signalling in the inflammatory response in AP.
Experimental Approach
Changes in pancreatic dopaminergic system and effects of dopamine, antagonists and agonists of D1 and D2 dopamine receptors were analysed in wild‐type and pancreas‐specific Drd2 −/− mice with AP (induced by caerulein and LPS or L‐arginine) and pancreatic acinar cells with or without cholecystokinin (CCK) stimulation. The severity of pancreatitis was assessed by measuring serum amylase and lipase and histological assessments. The NF‐κB signalling pathway was evaluated, and macrophage and neutrophil migration assessed by Transwell assay.
Key Results
Pancreatic dopamine synthetase and metabolic enzyme levels were increased, whereas D1 and D2 receptors were decreased in AP. Dopamine reduced inflammation in CCK‐stimulated pancreatic acinar cells by inhibiting the NF‐κB pathway. Moreover, the protective effects of dopamine were blocked by a D2 antagonist, but not a D1 antagonist. A D2 agonist reduced pancreatic damage and levels of p‐IκBα, p‐NF‐κBp65, TNFα, IL‐1β and IL‐6 in AP. Pancreas‐specific Drd2 −/− aggravated AP. Also, the D2 agonist activated PP2A and inhibited the phosphorylation of Akt, IKK, IκBα and NF‐κB and production of inflammatory cytokines and chemokines. Furthermore, it inhibited the migration of macrophages and neutrophils by reducing the expression of CCL2 and CXCL2. A PP2A inhibitor attenuated these protective effects of the D2 agonist.
Conclusions and Implications
D2 receptors control pancreatic inflammation in AP by inhibiting NF‐κB activation via a PP2A‐dependent Akt signalling pathway.
Abbreviations
- AP
acute pancreatitis
- CCK
cholecystokinin
- DBH
dopamine β‐hydroxylase
- DDC
dopa decarboxylase
- PAC
pancreatic acinar cell
- PP2A
serine/threonine protein phosphatase 2A
- SCH
SCH‐23390
- WT
wild‐type
Introduction
The incidence of acute pancreatitis (AP), an inflammatory disorder of the pancreas, has increased in recent years (Pandol et al., 2007; Yadav and Lowenfels, 2013). To date, no specific therapy has been shown to be effective for AP, which has a high morbidity and mortality (Lankisch, 2015; Forsmark et al., 2016). Although the molecular mechanism of AP remains unclear, the premature activation of zymogens within the pancreatic acinar cells (PACs) initiates acinar cell injury, which triggers a local and systemic inflammatory response in which the immune cells play a central role (Halangk et al., 2000). Importantly, PAC itself produces inflammatory mediators, and subsequently, these signals activate immune cells. If this inflammatory reaction is manifest continually, it leads to a systemic inflammatory response syndrome (SIRS) and multiple organ failure (Leung and Ip, 2006). Accumulating evidence has shown that PI3K, Akt, NF‐κB and inflammasome are involved in the pathophysiological process of AP and inhibition of NF‐κB and inflammasome can attenuate the severity of AP (Algül et al., 2007; Baumann et al., 2007; Hoque et al., 2011; Huang et al., 2013; Wei et al., 2015). Furthermore, an endogenous anti‐inflammatory system is also activated during AP. However, the mechanism of this anti‐inflammatory system is still unclear.
Dopamine, one of the most important neurotransmitters, can regulate movement, emotion and cognition in humans (Basu and Dasgupta, 2000). Dopamine receptors are a superfamily of GPCRs, and are classified into two subtypes, D1‐like ( D1 and D5 receptors) and D2‐like ( D2, D3 and D4 receptors), based on their ability to stimulate or inhibit AC respectively. Recent studies have shown that dopamine has multiple anti‐inflammatory effects (Wei et al., 2013; Yan et al., 2015; Zhang et al., 2015b). However, D1‐like and D2‐like receptor signalling can act through different mechanisms. Yan and colleagues showed that D1 receptor signalling can control the processing and secretion of IL‐1β and IL‐18 in both systemic and periphery inflammation by inhibiting the NLRP3 inflammasome (Yan et al., 2015). Furthermore, Shao and colleagues found that Drd2 knockout mice show a remarkable inflammatory response in the brain through aB‐crystallin (CRYAB)‐dependent mechanism (Wei et al., 2013). In addition, the D2 receptor has protective effects in the kidney by limiting the inflammatory reaction and an impairing the function of the D2 receptor results in renal inflammation and organ damage (Zhang et al., 2015b). Taken together, these results suggest that the dopaminergic system may act as an endogenous anti‐inflammatory system retained during evolution.
Notably, the pancreas is an important source of non‐neuronal dopamine in the body, and this dopamine has an important role in protecting the pancreas and intestinal mucosa, but its role and the exact molecular mechanism involved in the pancreas is still unclear (Mezey et al., 1996). Previous studies showed that dopamine is an effective treatment for experimental AP, as a result of its ability to reduce pancreatic microvascular permeability (Karanjia et al., 1991; Karanjia et al., 1994). However, the role of the pancreatic dopaminergic system in the pathogenesis of AP remains unclear. Therefore, we sought to investigate the role of the dopamine signalling pathway in the inflammatory response during experimental pancreatitis. We investigated the changes in the pancreatic dopaminergic system and the effects of dopamine, D1 and D2 agonists and antagonists and pancreatic specific knockout of Drd2 on inflammatory responses in an in vivo and in vitro model of experimental pancreatitis. We showed that the pancreas dopaminergic system is activated, but the expression of D1 and D2 receptors is decreased in experimental pancreatitis, suggesting a down‐regulation of these receptors limits the protective effects of dopamine on AP. Our data also demonstrated that D2 receptor‐mediated signalling controls pancreatic inflammation in AP at least in part through inhibiting NF‐κB activation via a serine/threonine protein phosphatase 2A (PP2A)‐dependent Akt signalling pathway.
Methods
Patients with AP
Of the patients who were admitted to the Gastroenterology Department of Shanghai General Hospital from November 2014 to August 2015, only those who met the diagnostic criteria of AP were included in the study (Kinns, 2013). Patients with chronic or other acute inflammatory diseases were excluded. The severity of AP was assessed according to the revised Atlanta criteria (Banks et al. 2013). Healthy volunteers were assessed as the control group. The entire study design and procedures involved were in accordance with the Declaration of Helsinki. Informed written consent was obtained from all AP patients and healthy volunteers. The study protocol was approved by the medical ethics committee of Shanghai General Hospital (2017KY170). The methods regarding human subjects were carried out in accordance with approved guidelines and regulations.
Mouse strains
Mice including wild‐type (WT) Balb/C, C57BL6/J (6–8 weeks, 20–22 g, male) were purchased from Shanghai SLAC Laboratory Animal Co Ltd (Shanghai, China). Drd2fl/fl mice were a gift from Professor Jiaowei Zhou (Institute of Neuroscience, State Key Laboratory of Neuroscience, Shanghai Institutes for Biological Sciences, Chinese Academy of Sciences, Shanghai, China). Pdx1Cre mice were purchased from Jackson Laboratories (Bar Harbor, ME, USA). Drd2fl/fl mice were bred to Pdx1+/Cre mice to generate pancreas‐specific Pdx1+/Cre/Drd2fl/fl mice (Drd2−/−). All mice were housed under specific‐pathogen‐free conditions in individually‐ventilated cages with wood shavings as bedding material (4–6 mice per cage), 12 h dark/light cycle at 22°C and free access to water and standard rodent diet. All mice (20–22 g, male) were marked with an earmark and a randomized table was used; they were allocated into groups in a completely randomized manner (n = 6 per group). The pathologists but not to the experimental operators were blinded to the experiment groups. All the experiments involving animals were conducted under the principle for replacement, refinement and reduction (the 3Rs) and according to the legislation on the protection of animals and were approved by the Animal Ethics Committee of Shanghai Jiaotong University School of Medicine (SYXK 2013–0050, Shanghai, China). Animal studies are reported in compliance with the ARRIVE guidelines (Kilkenny et al., 2010; McGrath and Lilley, 2015).
Induction of experimental pancreatitis and treatments
Two murine models of AP have been in use for several years: caerulein‐induced AP and L‐arginine‐induced AP, both are noninvasive and rapidly induced. In caerulein‐induced AP the degree of AP severity can be easily controlled and it is highly reproducible; this was developed in mice (20–22 g) by 10 injections of caerulein (100 μg·kg−1, i.p. with a 1 h interval between injections); LPS (5 mg·kg−1) was administered by i.p. injection immediately after the last injection of caerulein, as described previously (Hu et al., 2011; Lerch and Gorelick, 2013; Wu et al., 2016). L‐Arginine‐induced AP was initiated in mice (20–22 g) by administration of two i.p. injections of L‐arginine (8%, pH = 7.0), each at concentrations of 4 g·kg−1 body weight with a 1 h interval between injections. L‐Arginine induces toxic effects specific to the pancreas (Dawra et al., 2007; Hu et al., 2011; Wu et al., 2016). Controls received similar injections of normal saline (NS) instead of caerulein or L‐arginine. In the caerulein‐induced AP model, the first NS injection was defined as 0 h. In the L‐arginine‐induced AP model, the second NS injection was defined as day 0. Dopamine (50 mg·kg−1, corresponding to ~5% of the median lethal dose – LD50) was administered i.p. at the same time as caerulein, due to its short half‐life period (Zaroslinski et al., 1977; Rouge‐Pont et al., 2002). To determine which subtype of dopamine receptor is involved in the effect of dopamine on AP, three experiments in vivo were conducted. Firstly, the AP model was induced by caerulein and LPS in Balb/C mice and a D1 receptor antagonist SCH‐23390 (SCH; 10 mg·kg−1, i.p., 0.5 h before the first caerulein injection) or D2 receptor antagonist eticlopride (10 mg·kg−1, i.p., 0.5 h before the first caerulein injection) was used in combination with the i.p. dopamine, as described in Figure 2C. Secondly, the AP model was induced by caerulein and LPS in Balb/C mice; a D2 agonist quinpirole (10 mg·kg−1, i.p., 0.5 h before the first caerulein injection) was used instead of dopamine. Thirdly, the AP model was induced by caerulein and LPS in WT C57BL6/J and in pancreas‐specific Drd2 −/− mice on a C57BL6/J background. Finally, to investigate the molecular mechanisms of D2 receptor signalling in AP, okadaic acid (100 ng per mouse), a PP2A inhibitor, was administered i.p. 1 h before the first caerulein injection, and quinpirole was administered 0.5 h before first caerulein injection, as described in Figure 7A, B. Animals were killed by exsanguination at the time points indicated in the figures after being anaesthetized with pentobarbital. The histology of pancreatic tissue was quantified on sections stained with haematoxylin–eosin (H&E), which was scored by two experienced pathologists (Van Laethem et al., 1995; Hu et al., 2011).
Figure 2.
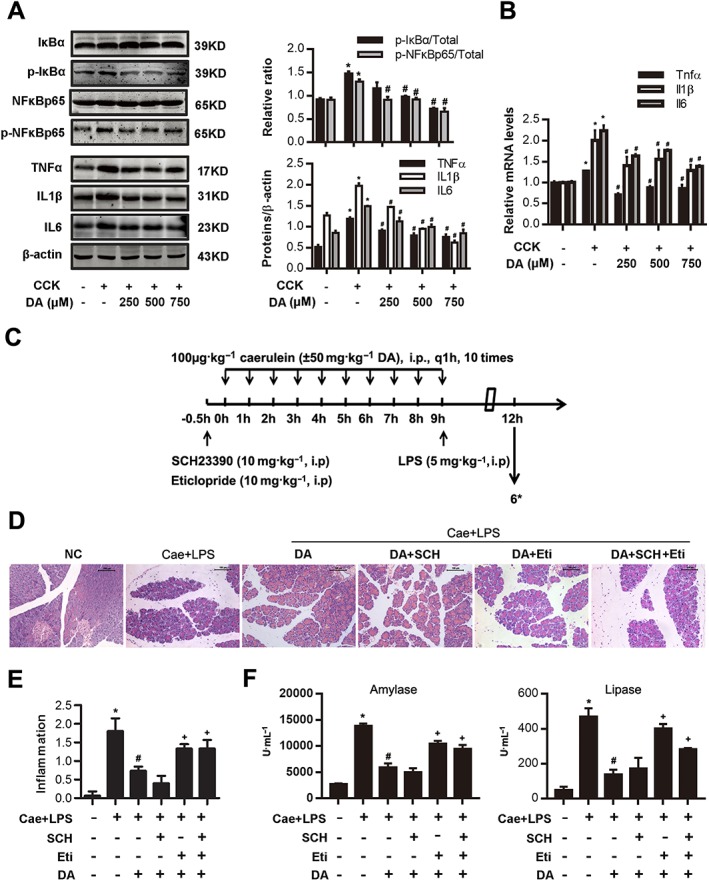
Dopamine (DA) signalling inhibits NF‐κB activation in AP and can be blocked by a D2 antagonist. (A, B) PACs were isolated from the pancreas of Balb/C mice. PACs were stimulated by 200 nM CCK 8 and treated with dopamine (250, 500 and 750 μM) at the same time. (A) Immunoblot analysis of IκBα, NF‐κBp65 phosphorylation level (at 1 h after CCK stimulation) and TNFα, IL‐1β and IL‐6 levels (at 4 h after CCK stimulation) in CCK‐stimulated PACs. (B) qRT‐PCR of mRNA levels of Tnfα, Il1β and Il6 in CCK‐stimulated PACs (at 4 h after CCK stimulation). (C–F) AP was induced by injection of caerulein (100 μg·kg−1) and LPS (5 mg·kg−1) in Balb/C mice, and the D1 antagonist SCH (10 mg·kg−1, i.p., 0.5 h before the first caerulein injection) or D2 antagonist eticlopride (10 mg·kg−1, i.p., 0.5 h before the first caerulein injection) was used in combination with dopamine (50 mg·kg−1, i.p., at the same time as caerulein). Mice were killed at 12 h after the first caerulein injection. (C) The time axis of AP model building and drug intervention. (D) Representative micrographs of H&E‐stained pancreatic sections (200×). (E) Histological score was determined as described in Methods. (F) Change in serum activity of amylase (left) and lipase (right). *n = 6 per group. Cae, caerulein; NC, normal control. Scale bar = 100 μm. *P < 0.05 versus NC, # P < 0.05 versus AP or CCK and + P < 0.05 versus dopamine.
Figure 7.
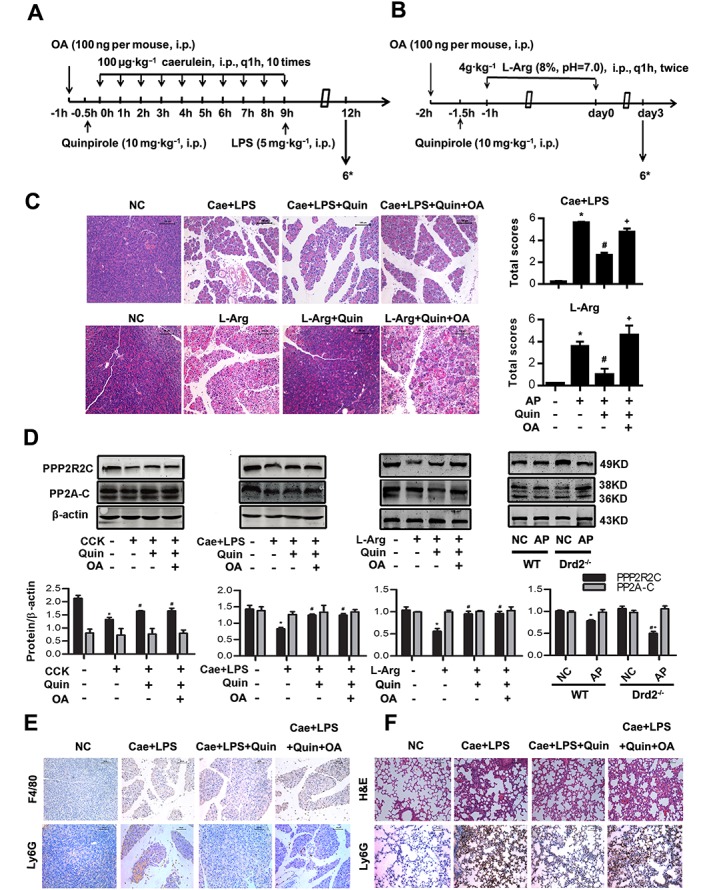
D2 receptor signalling inhibits inflammation in AP via PP2A in vivo. Two models of AP were induced in Balb/C mice in vivo (see Methods section). Mice were pretreated with quinpirole (10 mg·kg−1, i.p., 0.5 h before the first caerulein injection) with or without okadaic acid (100 ng per mouse, i.p., 0.5 h before quinpirole) intervenion. Mice were killed at 12 h after the first caerulein injection and at day 3 after the second L‐Arg injection. (A, B) The time axis of drug intervention and caerulein plus LPS AP model (A) or L‐Arg induced AP (B). (C) Representative micrographs of H&E‐stained pancreatic sections (200×) and histological scores from caerulein and LPS‐induced AP and L‐Arg‐induced AP. (D) Immunoblot analysis of PPP2R2C and PP2A‐C of CCK‐treated PACs or pancreatic tissue in WT or Drd2 −/− mice of both models of AP. (E) Representative micrographs of macrophage marker F4/80 (up) and neutrophil marker Ly6G (down) immunohistochemical analyses in pancreas (200×). (F) Representative micrographs of H&E‐stained lung sections and neutrophil marker Ly6G immunohistochemical analyses in lung (200×). n = 6 per group. Cae, caerulein; L‐Arg, L‐arginine. Scale bar = 100 μm. *P < 0.05 versus NC, # P < 0.05 versus AP and + P < 0.05 versus quinpirole.
Serological test
Blood samples from each group were centrifuged at 400× g for 20 min at 4°C. The serum levels of amylase and lipase were measured by enzyme dynamics chemistry using commercial kits according to the manufacturer's protocols in a Roche/Hitachi modular analytics system (Roche, Basel, Switzerland). The serum concentrations of dopamine, TNFα, IL1β, IL6, CCL2 and CXCL2 were measured by ELISA according to the manufacturer's protocols (R&D, MN, USA; Westang Bio‐Tech Co, LTD, Shanghai, China).
Haematoxylin–eosin and immunohistochemical staining
Fresh specimens of pancreas were fixed in 4% neutral paraformaldehyde for 24 h, embedded in paraffin, and 4 μm sections were processed for H&E staining by standard procedures. Endogenous peroxidase was blocked by 3% hydrogen peroxide. Sections were then incubated overnight at 4°C with monoclonal antibody against F4/80 (1:75) or Ly6G (1:100). After being rinsed in PBS for three times, sections were incubated with secondary antibody for 1 h at 37°C and then imaged by an ultrasensitive SP kit and a dopamineB kit (Fuzhou Maxin, China).
Isolation of pancreatic acinar cells and treatments
PACs were isolated from the pancreas of Balb/C mice using a collagenase (Sigma, USA) digestion procedure as described previously (Gukovskaya et al., 1997; Hu et al., 2011). PACs were incubated at 37°C in DMEM F‐12 medium containing 10% FBS. PACs were then stimulated with 200 nM cholecystokinin (CCK) 8 and treated with dopamine (250, 500 and 750 μM) at the same time. To determine which receptor was involved in the effect of dopamine on CCK‐stimulated PACs, two in vitro experiments were conducted. Firstly, the D1 antagonist SCH (10 μM) or D2 antagonist eticlopride (10 μM) was used in combination with dopamine (500 μM) at the time of CCK stimulation. Secondly, the D2 agonist quinpirole (5 μM) was used instead of dopamine (500 μM) at the time of CCK stimulation. Finally, to investigate the molecular mechanisms of D2 signalling, okadaic acid (2 nM) was administered 15 min before quinpirole (5 μM) and quinpirole was administered at the same time as CCK. PACs were collected at the time points indicated in the Figure legends.
Western blotting
Total protein of PACs and pancreatic tissues were extracted as described previously (Hu et al., 2011). Proteins (40 μg per lane) were separated by 10% SDS‐PAGE and electrotransferred to normal control membranes (Millipore, USA). Membranes were incubated with primary antibodies against polyclonal tyrosine hydroxylase (1:1000), dopa decarboxylase (DDC; 1:400), dopamine β‐hydroxylase (DBH; 1:400), MAO (1:1000), D2 receptor (1:400), p‐PI3K (1:1000), IKK (1:1000), PPP2R2C (1:1000), IL‐1β (1:1000) and IL‐6 (1:1000); monoclonal PI3K (1:1000), Akt (1:1000), p‐Akt (1:1000), p‐IKK (1:1000), IκBα (1:1000), p‐IκBα (1:1000), NF‐κBp65 (1:1000), p‐NF‐κBp65 (1:1000), PP2A‐C (1:1000), TNFα (1:1000) and β‐actin (1:1000) overnight at 4°C. After being washed with 0.1% Tween PBS three times, the membranes were probed with goat anti‐mouse or goat anti‐rabbit IR‐Dye 700 or 800 cw labelled secondary antisera for 1 h at 37°C. Membranes were imaged with an Odyssey infra‐red scanner (LI‐COR, Lincoln, NE, USA). To control for unwanted sources of variation, the relative expression of target proteins in different groups was normalized to β‐actin, and the phosphorylation level of target proteins was compared with their total level. The mean values of the control group were set to 1; the values of other groups were normalized to control group values, presented as fold of control values.
Quantitative reverse transcription PCR (qRT‐PCR)
mRNA transcripts were analysed by qRT‐PCR in the PACs or pancreatic tissues. Total RNA was isolated using Trizol reagent (Invitrogen, CA, USA). RNA was subjected to reverse transcription using a commercial SuperScript II preamplification kit (Fermentas, MD, USA); the purity of RNA products was determined by 260/280 ratio to be between 1.8 and 2.0. The synthesized cDNA was then subjected to qRT‐PCR using gene‐specific, intron‐spanning primers (Supporting Information Table S1). All the procedures were performed using an ABI Prism 7900HT Sequence Detection System (Applied Biosystems, CA, USA). To control for unwanted sources of variation, the mRNA levels were normalized to β‐actin mRNA, and the fold changes for each mRNA were calculated using the comparative CT (2−ΔΔCT) method. The mean values of the control group were set to 1; the values of other groups were normalized to control group values and presented as fold of control values. Each target gene was analysed in triplicate in each experiment.
Electrophoretic mobility shift assays (EMSAs)
EMSAs were used to check on the binding activity of NF‐κB. Nuclear extracts were prepared. A biotin end‐labelled probe containing the binding site of NF‐κB was incubated with 10 μg nuclear extracts for 30 min at room temperature. Protein–DNA complexes were separated on a native poly‐acrylamide gel in 0.5× Tris Buffer EDTA and transferred to a positively charged nylon membrane. The biotin end‐labelled DNA was detected using a chemiluminescent detection kit.
Preparation of macrophages and neutrophils
Bone marrow‐derived macrophages and neutrophils were collected from Balb/C mice as previously described (Weischenfeldt and Porse, 2008; Swamydas and Lionakis, 2013). Briefly, bone marrow cells were collected from femurs and tibias, red blood cells were removed and resuspended in DMEM F‐12 medium supplemented with 10% FBS and 20 ng·mL−1 M‐CSF. The cell viability was assessed by the Trypan blue exclusion assay (Gibco, USA) for >95%. To obtain macrophages, aliquots of 1 × 10⁶ cells were incubated in 6‐well plates, nonadherent cells were removed on day 3 and the cells were continuously cultured with fresh medium until day 7, when the medium was replaced again. On day 8, CD11b and F4/80 positive cells were evaluated by flow cytometry (FACSCaliber, BD Biosciences, Franklin, NJ, USA). Density gradient centrifugation method was used to acquire neutrophils: bone marrow cell suspension was overlaid on the top of the Histopaque 1119/1077 and centrifuged at 400× g for 30 min, and neutrophils at the interface of the Histopaque 1119/1077 layers were collected, then CD11b and Ly6G positive cells were evaluated by flow cytometry (FACSCaliber, BD Biosciences, Franklin, NJ, USA). Only cell preparations that exhibited 80% or more neutrophils were studied further. For macrophages, PACs were incubated with 10% FBS in the lower chamber, stimulated by 200 nM CCK and treated with quinpirole (2.5, 5 and 10 μM) with or without okadaic acid (2 nM); macrophages were placed in the upper chamber with 0.1% BSA for 6 h. The migration of non‐adherent neutrophils was analysed by a Transwell plate (5 μm polycarbonate membrane; Costar, WA, USA) under the stimulation of filtered supernatants of PACs for 30 min. Supernatants of PACs were generated by stimulation of 200 nM CCK and treatment with quinpirole at 2.5, 5 and 10 μM with or without okadaic acid at 2 nM for 6 h. Cell migration was detected by crystal violet staining, and the neutrophils suspended in the lower chamber were also counted. The concentrations of CCL2 and CXCL2 in the supernatants of the cultured PACs were measured by ELISA. To control for unwanted sources of variation, the mean migration (cell number) of the control group was set to 1. The values of other groups were normalized to control group values, presented as fold of control values.
Statistical analysis
All data are presented as mean ± SEM. The distribution of data was assessed by Kolmogorov–Smirnov test at first. If data followed a Gaussian distribution, parametric tests (Student's t‐test for two groups, or one‐way ANOVA for three or more groups) were carried out; for ANOVA, Bonferroni's post test was performed for data with F at P < 0.05 and no significant variance inhomogeneity. If data were not normally distributed, non‐parametric tests (Mann–Whitney test for two groups or Kruskal–Wallis test with Dunn's post test for three or more groups) were used by GraphPad Prism version 7.00 for Windows (GraphPad Software, La Jolla, CA, USA, www.graphpad.com). A P value <0.05 was considered statistically significant. The data and statistical analysis comply with the recommendations on experimental design and analysis in pharmacology (Curtis et al., 2015). The results were obtained from at least three independent experiments, with six mice (n = 6) per group to ensure their reliability.
Materials
Caerulein (#AS‐24252) was purchased from Anaspec (Fremont, CA, USA). L‐Arginine monohydrochloride (L‐Arg; A5131), LPS (#L2880), quinpirole (#Q102), SCH (#D054), eticlopride (#E101) and okadaic acid (#O8010) were purchased from Sigma‐Aldrich Chemical (St. Louis, MO, USA). BSA was purchased from Roche (Basel, Switzerland). Antibodies against DDC (#sc‐99203), DBH (#sc‐15318), MAO (#sc‐20156), DRD2 (#sc‐7523) and amylase (#sc‐46657) were from Santa Cruz Biotechnology (Dallas, TX, USA). Antibodies against tyrosine hydroxylase (TH; #2792), PI3K (#4257), phosphorylated PI3K (#4228), Akt (#4691), phosphorylated Akt (#13038), phosphorylated IKK (#2697), IκBα (#4812), phosphorylated IκBα (#2859), NF‐κBp65 (#8242), phosphorylated NF‐κBp65 (#3033) and PP2A‐C (#2259) were from Cell Signaling Technology (Danvers, MA, USA). Antibodies against DRD1 (#ab20066) and Ly6G (#ab25377) were from Abcam (Cambridge, MA, USA). Antibodies against IKK (#15649–1‐AP), TNF‐α (#60291–1‐Ig) and IL‐1β (#16806–1‐AP) were from Proteintech Biotechnology (Wuhan, China). Antibody against PPP2R2C (#NBP1–69160) was purchased from Novus Biologicals (Littleton, CO, USA). Antibody against IL‐6 (#BS6419) was from Bioworld Technology (St. Louis Park, MN, USA), and antibody against β‐actin (#AF0003) was purchased from Beyotime Biotechnology (Shanghai, China). Antibody against F4/80 (#GTX26640) was from GeneTex (San Antonio, TX, USA). PE‐conjugated rat anti‐mouse F4/80 antibody (#565410), PE‐conjugated rat anti‐mouse Ly6G antibody (#551461) and FITC‐conjugated rat anti‐mouse CD11b antibody (#561688) were purchased from BD Biosciences (Franklin, NJ, USA). Nuclear and Cytoplasmic Extraction Reagents was from Pierce (Rockford, IL, USA). The biotin‐labelled probe containing the NF‐κB consensus site was purchased from Beyotime Biotechnology. The Light Shift chemilumines‐cent EMSA kit was from Pierce. Transwell chamber was from Corning (NY, USA).
Nomenclature of targets and ligands
Key protein targets and ligands in this article are hyperlinked to corresponding entries in http://www.guidetopharmacology.org, the common portal for data from the IUPHAR/BPS Guide to PHARMACOLOGY (Southan et al., 2016), and are permanently archived in the Concise Guide to PHARMACOLOGY 2015/16 (Alexander et al., 2015a,b).
Results
The pancreas dopaminergic system is activated, but expression of D1 and D2 receptors are decreased in experimental pancreatitis
As shown in Figure 1, the dopamine level was elevated in human serum of severe AP patients compared to healthy people and those with mild AP (Figure 1A), and the serum levels of dopamine were significantly elevated at 12 h following caerulein‐ and LPS‐induced experimental pancreatitis (Figure 1B, C), suggesting the dopaminergic system is activated after AP. To test whether the pancreatic dopaminergic system is also activated in AP, we examined the levels of pancreatic dopamine synthetase and metabolism enzymes in AP. From in vitro samples and those from the two models of AP in vivo (Figure 1C, D and Supporting Information Figure S1A), Western blot analyses showed that protein levels of the pancreatic dopamine synthetase (TH and DDC) and metabolism enzymes (DBH and MAO) were significantly increased (Figure 1E), whereas D1 and D2 receptors were decreased (Figure 1F and Supporting Information Figure S1B, C). Among the five dopamine receptors, the expressions of D1 and D2 receptors were significantly reduced at 6–12 h in caerulein‐ and LPS‐induced AP in vivo or at 4 h after stimulation by CCK in vitro (Supporting Information Figure S1B–E), the time at which the inflammation was most obvious (Supporting Information Figure S1A). D2 receptors were reduced more obviously in the L‐arginine‐induce model of AP than in caerulein‐ and LPS‐induced AP (Figure 1F). Histological analysis revealed that AP is a self‐resolving process during caerulein‐ and LPS‐induced pancreatitis. Acute inflammation increased gradually from 12–24 h and was then restored within 5–7 days (Supporting Information Figure S1A). D1 and D2 levels increased progressively and had returned to a normal level as the inflammation disappeared (Supporting Information Figure S1B, C). Serum dopamine reached a peak level at 6–12 h and reduced gradually to normal level until day5 (Supporting Information Figure S1F). These results suggest that dopamine signalling might serve as an endogenous protective regulator of pancreatitis; however, down‐regulation of D receptors may limit the protective effects of dopamine on AP.
Figure 1.
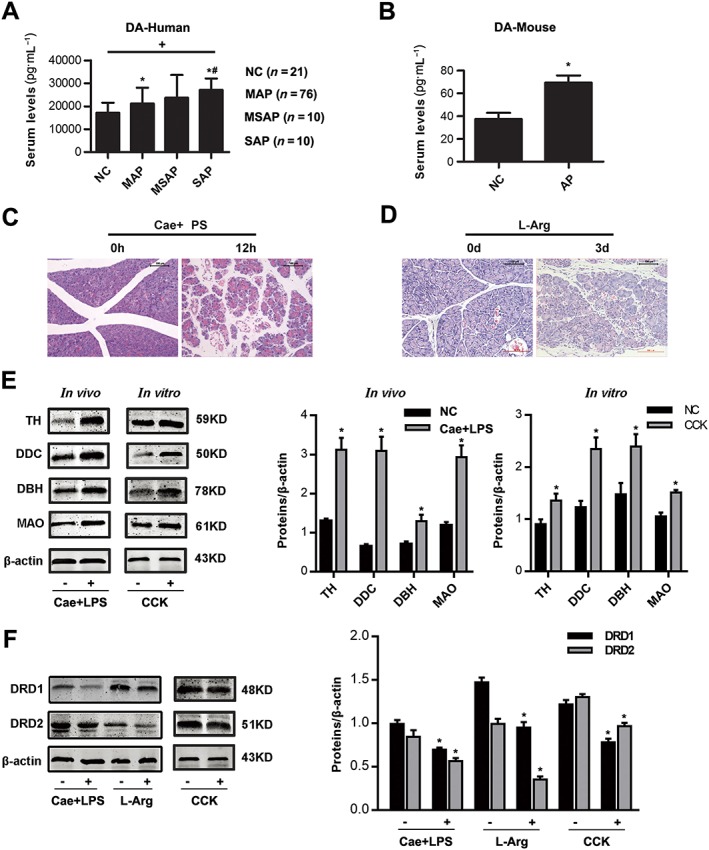
Changes in the dopaminergic system in the pancreas during AP. (A) Comparison of dopamine (DA) levels in serum of healthy controls (NC, n = 21), mild acute pancreatitis (MAP, n = 76), moderately severe acute pancreatitis (MSAP, n = 10) and severe acute pancreatitis (SAP, n = 10) patients. (B) ELISA of dopamine in serum of caerulein‐ and LPS‐induced model of pancreatitis. (C, D) Representative micrographs of H&E‐stained pancreatic sections (200×). (C) caerulein‐ and LPS‐induced AP, (D) L‐Arg‐induced AP. (E) Immunoblot analysis of TH, DDC, DBH and MAO proteins of pancreas (left) in mice treated with caerulein and LPS or PACs (right) with CCK stimulation. (F) Immunoblot analysis of D1 (DRD1) and D2 (DRD2) receptors of pancreatic tissue in two models of AP‐ or CCK‐treated PACs. n = 6 per group. Cae, caerulein; L‐Arg, L‐arginine; NC, normal control. Scale bar = 100 μm. *P < 0.05 versus NC, # P < 0.05 versus MAP and + P < 0.05 between groups.
Dopamine signalling inhibits NF‐κB activation via D2 receptors in experimental pancreatitis
As shown in Figure 2, qRT‐PCR and Western blot analyses revealed that dopamine reduced CCK‐induced increased expression of inflammatory cytokines (TNFα, IL‐1β and IL‐6) by inhibiting the IκBα/NF‐κB signalling pathway in a dose‐dependent manner in vitro (Figure 2A, B). Of note, we also found that dopamine can up‐regulate the expression of D1 and D2 receptor mRNA and protein levels (Supporting Information Figure S2). These results show that dopamine signalling has an anti‐inflammatory effect on AP through inhibiting NF‐κB activation via its modulation of D1 or D2 receptors.
Next, we investigated the mechanisms underlying the anti‐inflammatory effect of dopamine on AP. Dopamine exerts its effects by binding to its receptors located on the surface of cells. There is evidence indicating that stimulation of low‐affinity dopamine receptors, including D1 and D2, is coupled to anti‐inflammatory mechanisms (Wei et al., 2013; Yan et al., 2015). To determine which receptor was involved in the inhibitory effect of dopamine on NF‐κB, the D1 antagonist (SCH) and D2 antagonist (eticlopride) were administered in the in vivo and in vitro model of AP (Figure 2C). The severity of experimental pancreatitis was evaluated by measuring the levels of amylase and lipase in the serum. Morphological evidence of the extent of the pancreatic injury was obtained by standard histological examination. As shown in Figure 2, eticlopride significantly suppressed the anti‐inflammatory effect of dopamine on AP, while SCH had no effect (Figure 2D–F). Furthermore, we also found that eticlopride markedly blocked the reduction of IκBα, NF‐κBp65 phosphorylation levels, TNFα, IL‐1β and IL‐6 protein and mRNA levels induced by dopamine both in vivo (Figure 3A, B) and in vitro (Figure 3C, D), while SCH had no effect. Therefore, a D2 antagonist, but not a D1 antagonist, can block the inhibitory effect of dopamine on the NF‐κB pathway. These data showed that dopamine ameliorated experimental AP in mice through inhibition of NF‐κB activation via the D2 receptor signalling pathway.
Figure 3.
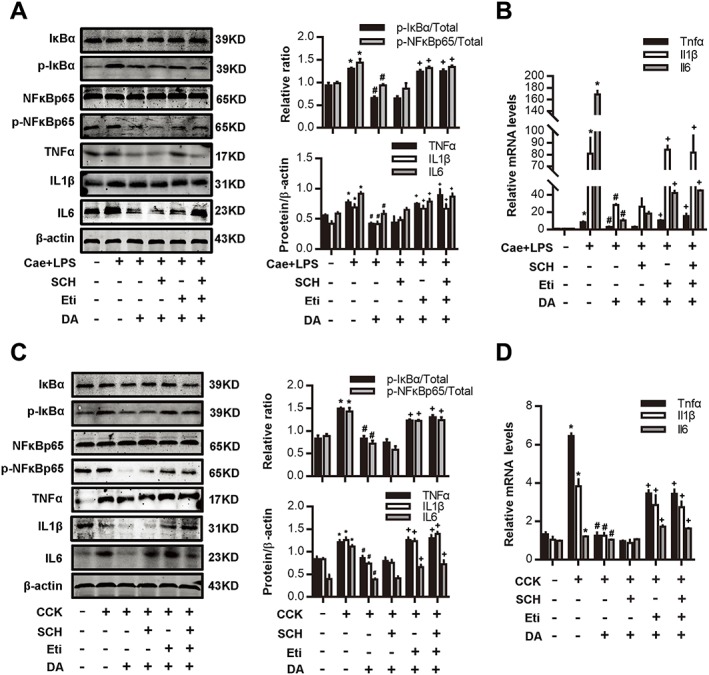
Dopamine signalling inhibits NF‐κB activation via D2 receptors in AP. (A, B) AP was induced by injection of caerulein (Cae; 100 μg·kg−1) and LPS (5 mg·kg−1) in Balb/C mice, and the D1 antagonist SCH (10 mg·kg−1, i.p., 0.5 h before the first caerulein injection) or D2 antagonist eticlopride (10 mg·kg−1, i.p., 0.5 h before the first caerulein injection) was used in combination with dopamine (DA; 50 mg·kg−1, i.p., at the same time as caerulein). Mice were killed at 12 h after the first caerulein injection. (A) Immunoblot analysis of IκBα, NF‐κBp65 phosphorylation levels and TNFα, IL‐1β and IL‐6 expression levels in pancreatic tissue in mice. (B) qRT‐PCR of mRNA levels of Tnfα, Il1β and Il6 in pancreatic tissue. (C, D) PACs were isolated from the pancreas of Balb/C mice. A D1 antagonist SCH (10 μM) or D2 antagonist eticlopride (10 μM) was used in combination with dopamine (500 μM) at the time of CCK (200 nM) stimulation. (C) Immunoblot analysis of IκBα, NF‐κBp65 phosphorylation levels (at 1 h after CCK stimulation) and TNFα, IL‐1β and IL‐6 levels (at 4 h after CCK stimulation) in CCK‐stimulated PACs. (D) qRT‐PCR of mRNA levels of Tnfα, Il1β and Il6 in CCK‐stimulated PACs (at 4 h after CCK stimulation). n = 6 per group. *P < 0.05 versus normal control, # P < 0.05 versus AP or CCK and + P < 0.05 versus dopamine.
D2 receptor activation exerts an anti‐inflammatory effect through inhibiting NF‐κB activation in experimental pancreatitis
To determine the role of the D2 receptor signalling pathway on AP, a D2 agonist (quinpirole) was administered before caerulein and LPS or CCK challenge, dopamine was administered at the same time as caerulein. As shown in Figure 4A–C, markedly decreased amylase and lipase activities were observed in the sera of quinpirole‐ or dopamine‐treated mice at 12 h after the first caerulein injection (Figure 4C). In addition, histological examination of the pancreas showed that the extent of pancreatic injury in quinpirole‐ or dopamine‐treated mice was less severe than that in mice treated with vehicle (Figure 4A, B). Furthermore, we found that both quinpirole and dopamine reduced IκBα and NF‐κBp65 phosphorylation, NF‐κB binding activity and TNFα, IL‐1β and IL‐6 levels in caerulein‐ and LPS‐induced pancreatitis (Figure 4D, E) and CCK‐stimulated PACs (Figure 4F–H).
Figure 4.
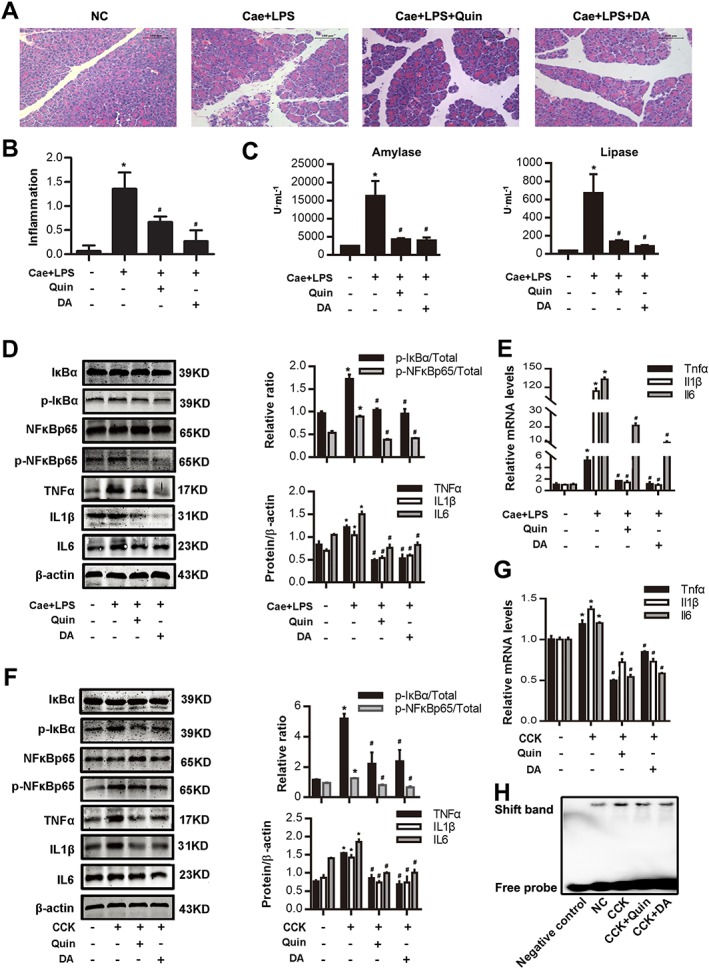
D2 receptor signalling inhibits NF‐κB activation in AP. In vivo, AP was induced by injection of caerulein (100 μg·kg−1) and LPS (5 mg·kg−1) in Balb/C mice, and a D2 agonist quinpirole (10 mg·kg−1, i.p., 0.5 h before the first caerulein injection) was used instead of dopamine (50 mg·kg−1, i.p., at the same time as caerulein). Mice were killed at 12 h after the first caerulein injection. In vitro, PACs were isolated from the pancreas of Balb/C mice. A D2 agonist quinpirole (5 μM) was used instead of dopamine (500 μM) at the time of CCK (200 nM) stimulation. (A) Representative micrographs of H&E‐stained pancreatic sections (200×). (B) Histological score was determined as described in Methods. (C) Change in serum activity of amylase (left) and lipase (right). (D) Immunoblot analysis of IκBα, NF‐κBp65 phosphorylation levels and TNFα, IL‐1β and IL‐6 expression levels of pancreatic tissue in mice. (E) qRT‐PCR of mRNA levels of Tnfα, Il1β and Il6 in pancreatic tissue. (F) Immunoblot analysis of IκBα, NF‐κBp65 phosphorylation levels (at 1 h after CCK stimulation) and TNFα, IL‐1β and IL‐6 levels (at 4 h after CCK stimulation) in CCK‐stimulated PACs. (G) qRT‐PCR of mRNA levels of Tnfα, Il1β and Il6 in CCK‐stimulated PACs (at 4 h after CCK stimulation). (H) EMSA analysis of NF‐κB binding ability. n = 6 per group. Cae, caerulein; NC, normal control. Scale bar = 100 μm. *P < 0.05 versus NC; # P < 0.05 versus AP or CCK.
Experimental pancreatitis aggravated in pancreas‐specific Drd2−/− mice
Next, to determine whether the pancreatic dopaminergic system regulates inflammation in AP, we crossed Drd2fl/fl mice with Pdx1+/Cre mice to generate pancreas‐specific Pdx1+/Cre/Drd2fl/fl (Drd2 −/−) mice (Supporting Information Figure S3). Histological analysis showed that pancreatic injury in Drd2 −/− mice was more severe than that in the WT group (Figure 5A). Loss of Drd2 in the pancreas led to a significant enhancement of caerulein‐ and LPS‐induced Akt, IKKα, IκBα and NF‐κBp65 phosphorylation but not PI3K (Figure 5B). In parallel, loss of Drd2 in the pancreas led to a significant enhancement of caerulein‐ and LPS‐induced intro‐pancreatic cytokines (TNFα, IL‐1β and IL‐6) and chemokines (CCL2 and CXCL2) expression (Figure 5C, D). In addition, the serum levels of TNFα, IL‐1β, IL‐6, CCL2 and CXCL2 were significantly increased at 12 h in the Drd2 −/− mice when compared with the WT mice after administration of caerulein and LPS (Figure 5E). The macrophage marker F4/80 and neutrophil marker Ly6G analyses revealed that the number of macrophages and neutrophils in the pancreas were significantly enhanced in the AP in Drd2 −/− compared to those in WT mice (Figure 5F). Loss of Drd2 also aggravated lung injury and increased neutrophil infiltration in lung during AP (Figure 5G). These data indicate that the pancreas‐specific Drd2 deficiency resulted in an enhanced local and systemic inflammatory response via the Akt/NF‐κB signalling pathway.
Figure 5.
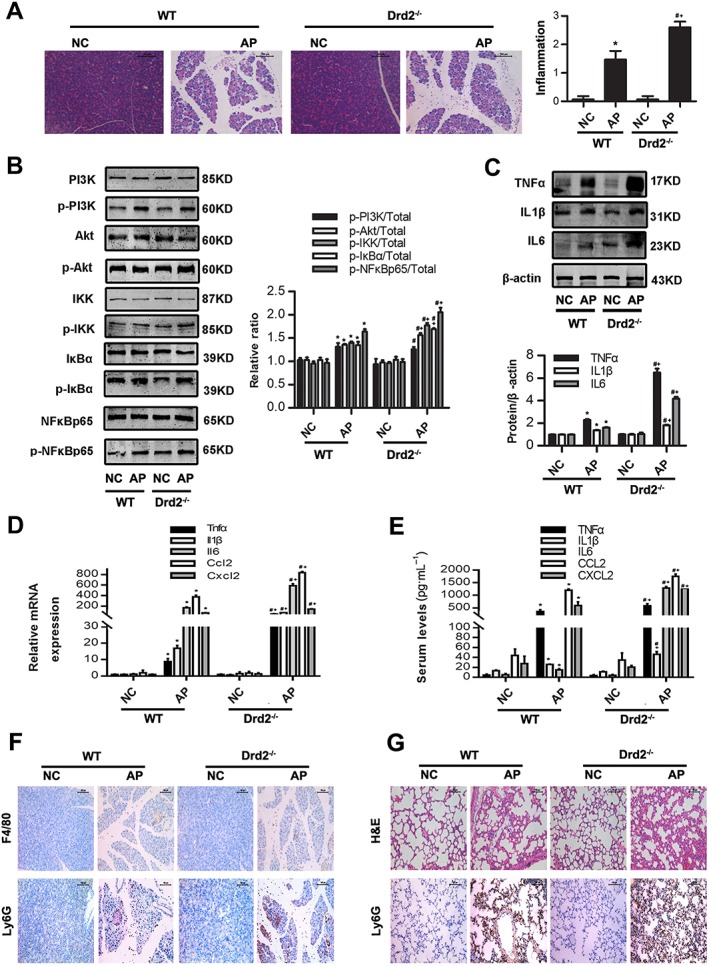
Pancreas‐specific Drd2 knockout mice promotes Akt/NFkB inflammatory signalling pathways in experimental AP. AP was induced by injection of caerulein (100 μg·kg−1) and LPS (5 mg·kg−1) in WT C57BL6/J and in pancreas‐specific Drd2 −/− on C57BL6/J background mice, and the blood samples and pancreatic tissue were collected at 12 h after the first caerulein injection. (A) Representative micrographs of H&E‐stained pancreatic sections (200×) and histological scores. (B) Immunoblot analysis of PI3K, Akt, IKK, IκBα and NF‐κBp65 phosphorylation levels of pancreatic tissue in WT and Drd2 −/− mice. (C) Immunoblot analysis of TNFα, IL‐1β and IL‐6 expression levels of pancreatic tissue in WT or Drd2−/− mice. (D) qRT‐PCR of mRNA levels of Tnfα, Il1β, Il6, Ccl2 and Cxcl2 of pancreatic tissue in WT or Drd2 −/− mice. (E) ELISA of serum TNFα, IL‐1β, IL‐6, CCL2 and CXCL2 levels in WT or Drd2 −/− mice. (F) Representative micrographs of macrophage marker F4/80 and neutrophil marker Ly6G immunohistochemical analyses in pancreas (200×). (G) Representative micrographs of H&E‐stained lung sections and neutrophil marker Ly6G immunohistochemical analyses in lung (200×). n = 6 per group. NC, normal control. Scale bar = 100 μm. *P < 0.05 versus WT‐NC, # P < 0.05 versus KO‐NC and + P < 0.05 versus WT‐AP.
D2 receptor signalling inhibits NF‐κB activation via PP2A‐dependent Akt signalling pathway in experimental pancreatitis
Next, we determined how dopamine and D2 receptor signalling inhibits NF‐κB activation. As shown in the above results, we found that dopamine and D2 receptor signalling inhibits NF‐κB activation by reducing p‐IκBα. IκBα phosphorylation is triggered by activation of the IκB kinase (IKK) complex, through serine/threonine kinase (Akt). Akt is a major downstream target of PI3K and is rigorously modulated by PI3K (Rommel et al., 2007). Firstly, we found that CCK stimulation significantly increased PI3K, Akt and IKK phosphorylation with a peak at 15 min, which then gradually declined until 120 min (Supporting Information Figure S4A), while IκBα and NF‐κBp65 phosphorylation were increased with a peak at 30–60 min and decreased until 4 h (Supporting Information Figure S4B). To test whether D2 receptor signalling inhibits NF‐κB activation via the PI3K/Akt/IKK signalling pathway, we investigated the effect of the D2 agonist quinpirole on PI3K, Akt and IKK phosphorylation in AP. PACs were treated with quinpirole at the indicated time of CCK stimulation. PI3K, Akt and IKK phosphorylation were detected at 15 min, IκBα and NF‐κBp65 phosphorylation at 1 h and TNFα, IL‐1β and IL‐6 at 4 h. We found that quinpirole markedly decreased the phosphorylation of Akt, IKKα, IκBα and NF‐κBp65, but not PI3K (Supporting Information Figure S5A). The mRNA and protein levels of TNFα, IL‐1β and IL‐6 were reduced by quinpirole in a dose‐dependent manner (Supporting Information Figure S5B, C). These results show that D2 receptor signalling inhibits NF‐κB activation via the Akt signalling pathway independently of PI3K.
Akt inactivation is regulated by PP2A, which is a major serine/threonine phosphatase and modulates the activity of various protein kinases such as Akt (Millward et al., 1999). PP2A is comprised of three subunits: a scaffold subunit (A), regulatory subunit (B) and catalytic subunit (C) (Millward et al., 1999; Andrabi et al., 2007). To test whether PP2A regulates Akt in AP, we examined the expression of the regulatory subunit (PP2A‐B or PPP2R2C) and catalytic subunit (PP2A‐C) of PP2A. Quinpirole increased significantly PPP2R2C expression in a time‐dependent manner both in vitro and in vivo. In vitro, quinpirole‐treated PACs showed an increased expression of PPP2R2C with a peak at 15 min, but not PP2A‐C; in vivo, PPP2R2C expression in the pancreas was significantly increased at 12 h after quinpirole administration, while PP2A‐C showed no change (Figure 6A). PPP2R2C expression was down‐regulated in CCK‐stimulated PACs or caerulein‐ and LPS‐induced or L‐arginine‐induced pancreatitis and up‐regulated by quinpirole. In addition, PPP2R2C expression was markedly decreased in Drd2 −/− mice (Figure 7D). To determine whether the effects of quinpirole were regulated by PP2A, we pretreated PACs or mice with a selective PP2A inhibitor, okadaic acid (Figure 7A, B). As shown in Figures 6 and 7, okadaic acid reversed the inhibitory activity of quinpirole on Akt, IKKα, IκBα and NF‐κBp65 phosphorylation, NF‐κB binding activity and TNFα, IL‐1β and IL‐6 levels in CCK‐stimulated PACs (Figure 6B–E). Okadaic acid also reversed the protective effects of quinpirole on AP: assessed by evaluating histology of pancreas (Figure 7C). Okadaic acid reversed not only the inhibitory role of quinpirole on macrophage and neutrophil migration in the pancreas but also lung injury and neutrophil infiltration in the lung of caerulein‐ and LPS‐induced AP (Figure 7E, F). Furthermore, okadaic acid reversed the inhibitory activity of quinpirole on Akt, IKKα, IκBα and NF‐κBp65 phosphorylation, mRNA and protein levels of TNFα, IL‐1β and IL‐6 in both AP models in vivo (Figure 8). Taken together, these results showed that D2 receptor signalling inhibits NF‐κB activation via a PP2A‐dependent Akt signalling pathway in AP.
Figure 6.
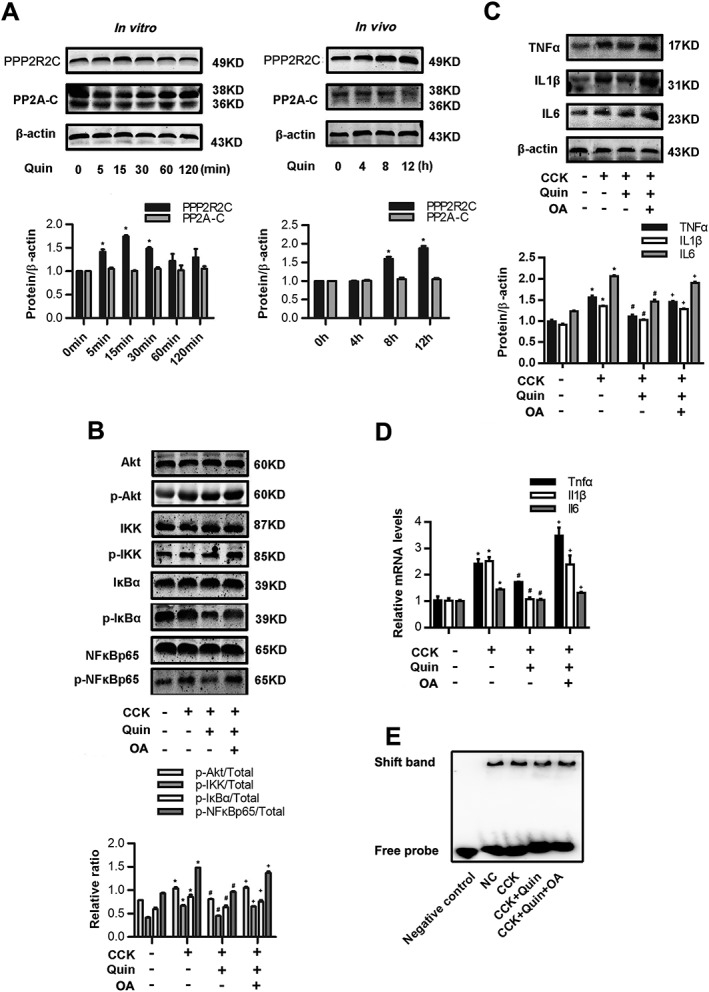
D2 receptor signalling inhibits NF‐κB activation via PP2A‐dependent Akt signalling pathway in CCK‐stimulated PACs. (A) Immunoblot analysis of PPP2R2C and PP2A‐C of quinpirole (5 μM)‐treated PACs at the indicated time point in vitro (left). Immunoblot analysis of PPP2R2C and PP2A‐C of pancreatic tissues in mice treated with quinpirole at the indicated time point in vivo (right). (B–E) PACs were stimulated by 200 nM CCK and treated with 5 μM quinpirole (at the time of CCK stimulation) with or without 2 nM okadaic acid (15 min before CCK stimulation) for 4 h. (B) Immunoblot analysis of Akt, IKK phosphorylation levels (at 15 min after CCK stimulation) and IκBα, NF‐κBp65 phosphorylation levels (at 1 h after CCK stimulation) of PACs. (C) Immunoblot analysis of TNFα, IL‐1β and IL‐6 levels (at 4 h after CCK stimulation) of PACs. (D) qRT‐PCR of mRNA levels of Tnfα, Il1β and Il6 (at 4 h after CCK stimulation) of PACs. (E) EMSA analysis of NF‐κB binding ability (at 1 h after CCK stimulation) of PACs. n = 6 per group. *P < 0.05 versus normal control (NC), # P < 0.05 versus AP and + P < 0.05 versus quinpirole.
Figure 8.
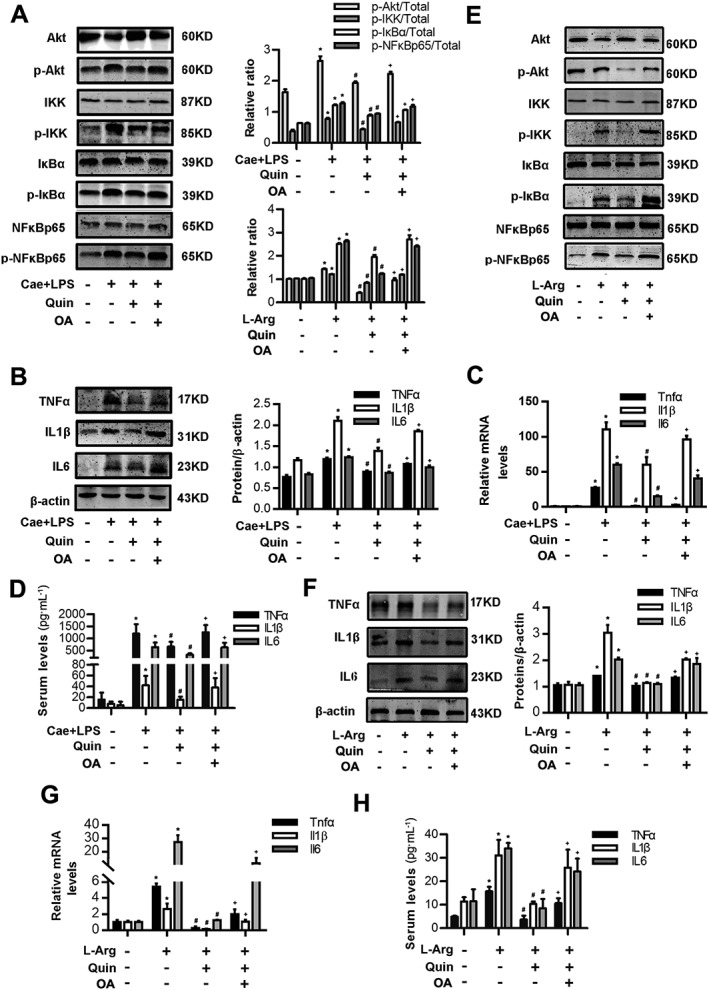
D2 receptor signalling inhibits NF‐κB activation via a PP2A‐dependent Akt signalling pathway in AP in vivo. Two models of AP were induced in Balb/C mice in vivo (see Methods section). Mice were pretreated with quinpirole (10 mg·kg−1, i.p., 0.5 h before the first caerulein injection) with or without okadaic acid (100 ng per mouse, i.p., 0.5 h before quinpirole). Mice were killed at 12 h after the first caerulein injection and at day 3 after the second L‐Arg injection. (A) Immunoblot analysis of Akt, IKK, IκBα and NF‐κBp65 phosphorylation levels of pancreatic tissue in mice of caerulein‐ and LPS‐induced AP. (B) Immunoblot analysis of TNFα, IL‐1β and IL‐6 levels of pancreatic tissue in mice of caerulein‐ and LPS‐induced AP. (C) qRT‐PCR of mRNA levels of Tnfα, Il1β and Il6 of pancreatic tissue in mice of caerulein‐ and LPS‐induced AP. (D) ELISA of serum TNFα, IL‐1β and IL‐6 levels in mice of caerulein‐ and LPS‐induced AP. (E) Immunoblot analysis of Akt, IKK, IκBα and NF‐κBp65 phosphorylation levels in pancreatic tissue in mice of L‐Arg‐induced AP. (F) Immunoblot analysis of TNFα, IL‐1β and IL‐6 levels in pancreatic tissue in mice of L‐Arg‐induced AP. (G) qRT‐PCR of mRNA levels of Tnfα, Il1β and Il6 in pancreatic tissue in mice of L‐Arg‐induced AP. (H) ELISA of serum TNFα, IL‐1β and IL‐6 levels in mice of L‐Arg‐induced AP. n = 6 per group. Cae, caerulein; L‐Arg, L‐Arginine. *P < 0.05 versus NC, # P < 0.05 versus AP and + P < 0.05 versus quinpirole.
D2 receptor signalling inhibits macrophage and neutrophil migration by reducing CCL2 and CXCL2 expression in vitro
As shown in Figure 9, quinpirole significantly reduced the levels of CCL2 and CXCL2 mRNA and protein levels in CCK‐stimulated PACs (Figure 9A, B, F, G). It has been reported that CCL2 and CXCL2 can induce macrophage and neutrophil migration in caerulein‐induced pancreatitis in mice (Keck et al., 2002; Saeki et al., 2012). To test whether quinpirole can inhibit macrophage and neutrophil migration, we acquired bone marrow‐derived macrophages and neutrophils, whose purity were 90.23 and 85.03% (Figure 9C, H). They were then incubated with PACs or PACs' medium in a Transwell co‐culture system respectively. We found that macrophage and neutrophil migration significantly increased in the CCK‐stimulated group and decreased in the quinpirole‐treated group in a dose‐dependent manner at 6 h and 30 min respectively (Figure 9D, E, I, J). Furthermore, we found that okadaic acid reversed the inhibitory effect of quinpirole on the up‐regulation of CCL2 and CXCL2 induced by caerulein and LPS in the pancreas or CCK in PACs (Figure 10A, B, D, E). Similarly, okadaic acid also reversed the inhibitory effect of quinpirole on the migration of macrophages (Figure 10C) and neutrophils (Figure 10F) in CCK‐stimulated PACs. These results suggest that quinpirole inhibits macrophage and neutrophil migration by reducing CCL2 and CXCL2 expression via a PP2A‐dependent Akt/NF‐κB signalling pathway. Taken together, all these data indicate that in the pancreas D2 receptor signalling inhibits local and systemic inflammatory responses via a PP2A‐dependent Akt/NF‐κB signalling pathway (Figure 10G).
Figure 9.
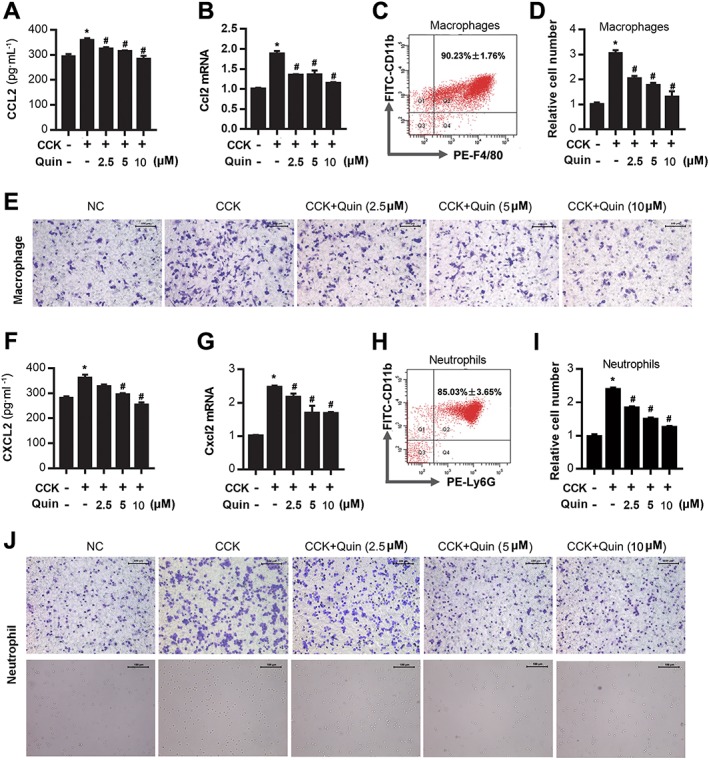
D2 receptor signalling inhibits macrophage and neutrophil migration by reducing CCL2 and CXCL2 expression. Bone marrow‐derived macrophages and neutrophils were collected from Balb/C mice, and their migration was assessed by Transwell assay. (A) ELISA of CCL2 in supernatants of CCK‐stimulated PACs. (B) qRT‐PCR of mRNA levels of Ccl2 in CCK‐stimulated PACs. (C) Flow cytometry (FCM) of macrophage purity at day 8. (D) Quantitative analysis of the number of migrated macrophages. (E) Representative micrographs (200×) of macrophage migration after staining with crystal violet. (F) ELISA of CXCL2 in supernatants of CCK‐stimulated PACs. (G) qRT‐PCR of mRNA level of Cxcl2 in CCK‐stimulated PACs. (H) FCM of neutrophil purity. (I) Quantitative analysis of the number of migrated neutrophils. (J) Representative micrographs (200×) of neutrophil migration after staining with crystal violet and in the lower chamber (lower graphs). Scale bar =100 μm. *P < 0.05 versus normal control (NC) and # P < 0.05 versus CCK.
Figure 10.
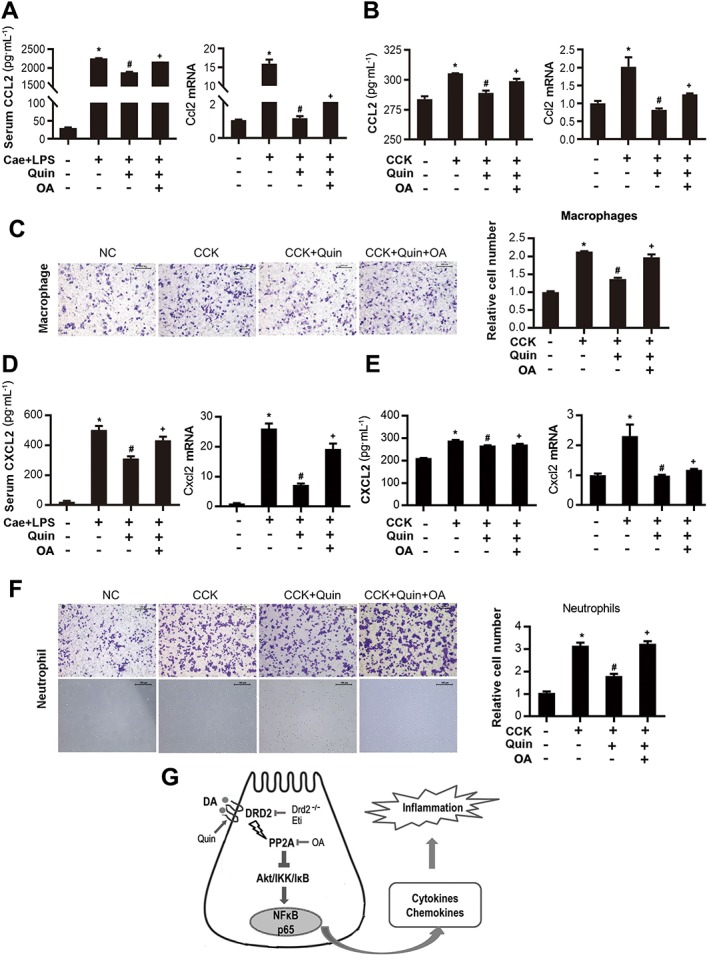
D2 receptor signalling inhibits macrophage and neutrophil migration by activating PP2A. Bone marrow‐derived macrophages and neutrophils were collected from Balb/C mice, and their migration was assessed by Transwell assay. (A) ELISA of serum CCL2 and qRT‐PCR of Ccl2 mRNA in caerulein‐challenged mice treated with 10 mg·kg−1 quinpirole with or without 100 ng okadaic acid. (B) ELISA of CCL2 in supernatants and qRT‐PCR of Ccl2 mRNA from CCK‐stimulated PACs treated with 5 μM quinpirole with or without 2 nM okadaic acid for 6 h. (C) Representative micrographs (200×) of macrophage migration after stained with crystal violet and quantitative analysis of the number of migrated macrophages. (D) ELISA of serum CXCL2 and qRT‐PCR of Cxcl2 mRNA in caerulein‐ challenged mice treated with 10 mg·kg−1 quinpirole with or without 100 ng okadaic acid. (E) ELISA of CXCL2 in supernatants and qRT‐PCR of Cxcl2 mRNA from CCK‐stimulated PACs treated with 5 μM quinpirole with or without 2 nM okadaic acid for 6 h. (F) Representative micrographs (200×) of neutrophil migration after staining with crystal violet and in the lower chamber (lower graphs) and quantitative analysis of the number of migrated neutrophils, including the adherent cells in the membrane and suspension of cells in the lower chamber. (G) Schematic diagram summarizing the mechanisms by which D2 receptor (DRD2) signalling controls inflammation in experimental pancreatitis. The protective effects of the D2 receptor signalling on AP are exerted at least in part through Akt dephosphorylation via PP2A. n = 6 per group. Cae, caerulein; NC, normal control. Scale bar = 100 μm. *P < 0.05 versus NC, # P < 0.05 versus AP or CCK and + P < 0.05 versus quinpirole.
Discussion and conclusions
Increasing evidence has shown that dopamine can function as a local chemical messenger in several periphery organs of the body, besides being a neurotransmitter in the brain (Beaulieu and Gainetdinov, 2011). Although a substantial amount of dopamine circulates in the bloodstream, its functions remain unclear. Dopamine exerts its effects by binding to and activating receptors located on the surface of cells. There are at least five subtypes of dopamine receptors that have been identified, termed D1‐D5, and most of them can be detected in immune cells, including monocytes and neutrophils (Mckenna et al., 2002). Previous studies have reported that human pancreatic islet cells express dopamine receptors and dopamine can influence the secretion of insulin (Rubí et al., 2005; Piston, 2013; Zhang et al., 2015c). Here, we showed for the first time that dopamine receptors are also expressed in PACs. Mezey and colleagues demonstrated that dopamine itself as well as TH is present in exocrine pancreatic cells by immunocytochemistry. Consistent with this, our results demonstrate that both of dopamine synthesizing (TH and DDC) and metabolism enzymes (DBH and MAO) exist in murine exocrine pancreas. These results suggest that the acinar cell itself can produce dopamine from circulating L‐dopa, which has not been reported previously. The dopamine level was elevated in human serum of AP patients compared to healthy people. Thus, dopamine may act on the pancreas via autocrine or paracrine pathways. Of note, although the pancreas dopaminergic system is activated, D1 and D2 receptor levels were significantly decreased in the in vivo and in vitro model of experimental pancreatitis, suggesting a down‐regulation of these receptors limits the protective effects of dopamine during AP. Moreover, we found that D1 and D2 receptor levels were restored to normal levels as the inflammation subsided in the caerulein‐ and LPS‐ or L‐arginine‐induced pancreatitis in mice. Taken together, these results indicate that dopamine signalling may be an endogenous inhibitor of inflammation in AP, which encouraged us to further explore the role of dopamine signalling in AP.
Previous studies showed that dopamine is an effective treatment for experimental AP, as a result of the reduction in pancreatic microvascular permeability and inflammatory cytokines (Karanjia et al., 1991; 1994; Zhang et al., 2007). However, Kaya indicated that a low dose of dopamine attenuates the lung injury but not the local pancreatic injury in 5% Na‐taurocolic acid‐induced AP in rats (Kaya et al., 2005). This may be due to variations in the different AP models and the timing of the observations. We improved the administration method of dopamine, injecting it i.p. at the same time as caerulein ,10 times separately, which takes into account its short half‐life (Zaroslinski et al., 1977). Therefore, our data showed that dopamine can attenuate experimental pancreatitis by inhibiting the NF‐κB signalling pathway. Recently, Yan and colleagues demonstrated that D1 receptor signalling can control the processing and secretion of IL‐1β and IL‐18 in both systemic and periphery inflammation by inhibiting the NLRP3 inflammasome (Yan et al., 2015). In addition, Shao and colleagues indicated that astrocytic D2 receptor activation could suppress neuroinflammation in the CNS through a CRYAB‐dependent mechanism (Wei et al., 2013). D1 and D2 agonists may act through different pathways. D1 receptor signalling can inhibit NLRP3 inflammasome activation via cAMP, while D2 receptor signalling can inhibit the NF‐κB signalling pathway that then results in a reduction in NLRP3 mRNA expression (Vande et al., 2014; Yan et al., 2015; Zhang et al., 2015a). In addition, Hoque and colleagues showed that NF‐κB regulates the mRNA expression of NLRP3, which can form the NLRP3 inflammasome (Hoque et al., 2011). Both NF‐κB and inflammasome are involved in the pathophysiological process of AP, and NF‐κB can regulate NLRP3 inflammasome; therefore, either D1 or D2 receptor activation can ameliorate AP via NF‐κB inhibition theoretically (Hoque et al., 2011; Huang et al., 2013). However, we found that a D2 antagonist but not a D1 antagonist blocked the protective effects of dopamine on AP. The reason for this result is explained by the following findings. Gene chips of the L‐arginine murine model showed that the D2 receptor expression level was over three times that of D1 receptors in normal pancreas and 25 times more in AP (data not shown). Because both D1 and D2 receptors are low‐affinity receptors, we speculate that dopamine may mainly combine with D2 receptors in AP. It was reported that Drd2 −/− mice exhibited spontaneous inflammation in the brain and activation of D2 receptors can suppress levels of pro‐inflammatory cytokines, including TNF‐α (Wei et al., 2013). Therefore, a D2 antagonist may block the inhibitory effects of dopamine on inflammatory cytokines via NF‐κB, but we cannot exclude the possibility of a subsequent D2 receptor‐mediated effect on inflammasome activation in AP. Taken together, these results indicate that dopamine can negatively regulate NF‐κB activation via D2 receptor signalling in AP, suggesting that D2 receptors might be a potential target for treatment of AP.
Furthermore, we found that D2 receptor signalling inhibits NF‐κB activation via Akt signalling pathway independently of PI3K in AP. PI3K can positively regulate Akt inactivation, whereas Akt inactivation is regulated by PP2A, which is a major serine/threonine phosphatase and modulates the activity of various protein kinases such as Akt (Millward et al., 1999; Matsuoka et al., 2003). PP2A consists of a family of heterotrimers composed of one scaffolding (A), one catalytic (C) and one regulatory (B) subunit and is expressed in the pancreas (Millward et al., 1999; Andrabi et al., 2007; Sandoval et al., 2009). There are several regulatory B subunits, of which PPP2R2C, a γ isoform of the subunit B55 subfamily, has been reported to associate with Akt selectively, regulating phosphorylation of Akt at Thr308 (Kuo et al., 2008; Zhang et al., 2015b). Of note, PP2A is oxidized and inactive in AP (Kuo et al., 2008; Sandoval et al., 2009). Consistent with these findings, our results indicate that Akt phosphorylation is increased, but PP2A expression is decreased in AP. Moreover, we also found that D2 receptor activation could partly increase the expression of PPP2R2C, which leads to Akt dephosphorylation, and then inhibits the IKKα/IκBα/NF‐κB signalling pathway. In addition, we found that the PP2A antagonist okadaic acid reversed the protective effects of a D2 agonist on AP. More importantly, compared to WT mice, pancreas‐specific Drd2 −/− mice exhibited a more severe AP, along with less PPP2R2C expression and more Akt/IKK/IκBα/NF‐κB phosphorylation and intense local and systemic inflammatory response. Taken together, these results indicate that the protective effects of D2 receptors on AP were exerted at least in part through the inhibition of Akt phosphorylation via PP2A. This phenomenon was similar to that in mouse renal proximal tubule cells: the D2 receptor controls renal inflammation, at least in part by modulation of Akt pathway through PP2A (Zhang et al., 2015b). As to the changes in the other signalling pathways or trypsinogen activation or necrosis after Drd2 knockout, further studies need to be undertaken.
AP is characterized by trypsinogen activation and an infiltration of immune cells into the pancreas (Pandol et al., 2007). The earliest events in AP occur within acinar cells, but macrophages and neutrophils can worsen the pancreatic injury and lead to SIRS (Shrivastava and Bhatia, 2010; Xue et al., 2014; Yang et al., 2015). Accumulating evidence indicates that PACs can produce CCL2 and CXCL2 and NF‐κB is involved in the induction of many pro‐inflammatory mediators (Panahi et al., 2015; Steele et al., 2015). As monocytes express the CCL2 receptor, CCR2, and neutrophils express the CXCL2 receptor, CXCR2, the chemokines produced by PACs can promote the migration and accumulation of macrophages and neutrophils to the pancreas to further magnify the inflammatory response (Feng et al., 1995; Ohtsuka et al., 2001; Terashima et al., 2005; Awla et al., 2011; Saeki et al., 2012; Panahi et al., 2015; Steele et al., 2015). Consistent with this, we found that CCL2 and CXCL2 expression are up‐regulated in both our in vivo and in vitro models of AP. Furthermore, our data show that a D2 agonist can inhibit the up‐regulation of CCL2 and CXCL2 and macrophage and neutrophil migration in vitro, while the PP2A inhibitor okadaic acid attenuated the inhibitory effects of quinpirole on the secretion of chemokines and migration of immune cells. Furthermore, pancreas‐specific Drd2 −/− mice had an increased infiltration of inflammatory cells compared to WT mice with AP. Taken together, these results indicate that D2 receptor signalling in the pancreas inhibits macrophage and neutrophil migration by reducing CCL2 and CXCL2 expression from PACs via a PP2A‐dependent Akt/NF‐κB signalling pathway. Because dopamine and its agonists has been shown to have an effect on immune cells including macrophages, we cannot exclude the possibility that the activation of D2 receptors has a direct inhibitory effect on immune cells in AP (Yan et al., 2015). Although we demonstrated the protective role of D2 receptors on PACs in vitro and in vivo via both WT and pancreas‐specific Drd2 −/− mice, the role of the dopaminergic system on effects on other cells such as macrophages and neutrophils in AP needs to be further clarified.
In summary, as presented in Figure 10G, in this study we have shown that in experimental pancreatitis, the pancreas dopaminergic system is activated, but D1 and D2 receptors are decreased. However, D2 receptor signalling controls pancreatic inflammation in AP at least in part through inhibiting NF‐κB signalling via a PP2A‐dependent Akt pathway. Further insights into the mechanisms through which the inflammatory pathways are activated may hold the key to increase our understanding of pancreatitis. Moreover, therapeutic approaches that activate D2 receptor signalling may represent a novel strategy for preventing or attenuating inflammation in AP clinically.
Author contributions
X.H., B.L. and X.Y. performed all the experiments, analysed data and drafted the manuscript. T.M., J.W., J.D. and D.W. performed the experiments and analysed data. J.N., R.Z. and J.X. provided technical support in the in vivo and in vitro experiments. G.H. designed, conceived the study, analysed data and revised the manuscript. G.H., X.W., J.N. and X.H. provided funding to support the study. R.W. and X.W. supervised the study.
Conflict of interest
The authors declare no conflicts of interest.
Declaration of transparency and scientific rigour
This Declaration acknowledges that this paper adheres to the principles for transparent reporting and scientific rigour of preclinical research recommended by funding agencies, publishers and other organisations engaged with supporting research.
Supporting information
Table S1 Primer sequences used for qRT‐PCR analysis.
Figure S1 Dynamic expression levels of DRDs in AP model. (A‐C) Caerulein‐induced AP was built by ten injections of caerulein (100 μg·kg−1, i.p. with a 1 h interval between injections). LPS (5 mg·kg−1) was administered by intraperitoneal injection immediately after the last injection of caerulein. Controls received similar injections of NS instead of caerulein or L‐Arginine. Mice were killed at 0 h, 1 h, 6 h, 12 h, 24 h, day3 and day5 after the first caerulein injection. (A) Representative micrographs of H&E‐stained pancreatic sections (200×). (B) Immunoblot analysis of DRD1 and DRD2 proteins of pancreas tissue at different time points. (C) qRT‐PCR of mRNA levels of Drd1 and Drd2 in pancreatic tissue at different time points. Results are shown as fold‐change relative to the 0 h group. (D) qRT‐PCR of mRNA levels of Drd1–5 in pancreatic tissue at 12 h after the first caerulein injection. (E) qRT‐PCR of mRNA levels of Drd1–5 in CCK‐stimulated PACs. (F) ELISA of dopamine in serum of caerulein and LPS induced pancreatitis. n = 6 per group. NC, normal control; AP, acute pancreatitis. Scale bar =100 μm. *P < 0.05 vs 0 h.
Figure S2 Dopamine upregulates DRD expression in CCK‐stimulated PACs. PACs were treated with dopamine (250 μM, 500 μM, 750 μM) at the time of CCK (200 nM) stimulation. (A) Immunoblot analysis of DRD1 and DRD2 of CCK‐stimulated PACs (at 4 h after CCK stimulation). (B) qRT‐PCR of mRNA levels of Drd1 and Drd2 in CCK‐stimulated PACs (at 4 h after CCK stimulation). DA, dopamine. *P < 0.05 vs NC, #P < 0.05 vs CCK.
Figure S3 Generation of conditional pancreas‐specific Drd2 knockout mice. RT‐PCR of genotype identification of transgenic mice. WT, wild‐type; Hom, homozygote; Het, heterozygote.
Figure S4 PI3K‐Akt‐IKK‐IκB‐NFκB pathway is activated in CCK‐stimulated PACs. PACs were stimulated by 200 nM CCK. (A) Immunoblot analysis of PI3K, Akt and IKK phosphorylation levels of PACs at the indicated time after CCK stimulation. (B) Immunoblot analysis of IκBα and NFκBp65 phosphorylation levels of PACs at the indicated time after CCK stimulation. *P < 0.05 vs 0 min.
Figure S5 DRD2 signalling inhibits NFκB activation in CCK‐stimulated PACs. PACs were treated with Quinpirole (2.5 μM, 5 μM, 10 μM) at the time of CCK (200 nM) stimulation. (A) Immunoblot analysis of PI3K, Akt, IKK phosphorylation levels (at 15 min after CCK stimulation) and IκBα, NFκBp65 phosphorylation levels (at 1 h after CCK stimulation). (B) Immunoblot analysis of TNFα, IL1β and IL6 levels of PACs (at 4 h after CCK stimulation). (C) qRT‐PCR of mRNA levels of Tnfα, Il1β and Il6 of PACs (at 4 h after CCK stimulation). Quin, Quinpirole. *P < 0.05 vs NC, #P < 0.05 vs CCK.
Acknowledgements
The authors thank Professor Jiaowei Zhou from Institute of Neuroscience, State Key Laboratory of Neuroscience, Shanghai Institutes for Biological Sciences and Chinese Academy of Sciences for providing Drd2flox mice.
This work was supported in part by National Natural Science Foundation of China 81370568 (G.H.), 81670584 (G.H.), 81570580 (X.W.), 81400663 (J.N.) and 81372643 (X.W.) and Doctoral Innovation Fund of Shanghai Jiao Tong University School of Medicine BXJ201735 (X.H.).
Han, X. , Li, B. , Ye, X. , Mulatibieke, T. , Wu, J. , Dai, J. , Wu, D. , Ni, J. , Zhang, R. , Xue, J. , Wan, R. , Wang, X. , and Hu, G. (2017) Dopamine D2 receptor signalling controls inflammation in acute pancreatitis via a PP2A‐dependent Akt/NF‐κB signalling pathway. British Journal of Pharmacology, 174: 4751–4770. doi: 10.1111/bph.14057.
Contributor Information
Xingpeng Wang, Email: richardwangxp@163.com.
Guoyong Hu, Email: huguoyongsh@sina.com.
References
- Alexander SPH, Fabbro D, Kelly E, Marrion N, Peters JA, Benson HE et al (2015a). The Concise Guide to PHARMACOLOGY 2015/16: G protein‐coupled receptors. Br J Pharmacol 172: 5744–5869. [DOI] [PMC free article] [PubMed] [Google Scholar]
- Alexander SPH, Fabbro D, Kelly E, Marrion N, Peters JA, Benson HE et al (2015b). The Concise Guide to PHARMACOLOGY 2015/16: Enzymes. Br J Pharmacol 172: 6024–6109. [DOI] [PMC free article] [PubMed] [Google Scholar]
- Algül H, Treiber M, Lesina M, Nakhai H, Saur D, Geisler F et al (2007). Pancreas‐specific RelA/p65 truncation increases susceptibility of acini to inflammation‐associated cell death following cerulein pancreatitis. J Clin Invest 117: 1490–1501. [DOI] [PMC free article] [PubMed] [Google Scholar]
- Andrabi S, Gjoerup OV, Kean JA, Roberts TM, Schaffhausen B (2007). Protein phosphatase 2A regulates life and death decisions via Akt in a context‐dependent manner. Proc Natl Acad Sci U S A 104: 19011–19016. [DOI] [PMC free article] [PubMed] [Google Scholar]
- Awla D, Abdulla A, Zhang S, Roller J, Menger MD, Regnér S et al (2011). Lymphocyte function antigen‐1 regulates neutrophil recruitment and tissue damage in acute pancreatitis. Br J Pharmacol 163: 413–423. [DOI] [PMC free article] [PubMed] [Google Scholar]
- Banks PA, Bollen TL, Dervenis C, Gooszen HG, Johnson CD, Sarr MG et al (2013). Classification of acute pancreatitis – 2012: revision of the Atlanta classification and definitions by international consensus. Gut 62: 102–111. [DOI] [PubMed] [Google Scholar]
- Basu S, Dasgupta PS (2000). Dopamine, a neurotransmitter, influences the immune system. J Neuroimmunol 102: 113–124. [DOI] [PubMed] [Google Scholar]
- Baumann B, Wagner M, Aleksic T, Von WG, Weber CK, Adler G et al (2007). Constitutive IKK2 activation in acinar cells is sufficient to induce pancreatitis in vivo. J Clin Invest 117: 1502–1513. [DOI] [PMC free article] [PubMed] [Google Scholar]
- Beaulieu JM, Gainetdinov RR (2011). The physiology, signaling, and pharmacology of dopamine receptors. Pharmacol Rev 63: 182–217. [DOI] [PubMed] [Google Scholar]
- Curtis MJ, Bond RA, Spina D, Ahluwalia A, Alexander SP, Giembycz MA et al (2015). Experimental design and analysis and their reporting: new guidance for publication in BJP. Br J Pharmacol 172: 3461–3471. [DOI] [PMC free article] [PubMed] [Google Scholar]
- Dawra R, Sharif R, Phillips P, Dudeja V, Dhaulakhandi D, Saluja AK (2007). Development of a new mouse model of acute pancreatitis induced by administration of L‐arginine. Am J Physiol Gastrointest Liver Physiol 292: G1009–G1018. [DOI] [PubMed] [Google Scholar]
- Feng L, Xia Y, Yoshimura T, Wilson CB (1995). Modulation of neutrophil influx in glomerulonephritis in the rat with anti‐macrophage inflammatory protein‐2 (MIP‐2) antibody. J Clin Invest 95: 1009–1017. [DOI] [PMC free article] [PubMed] [Google Scholar]
- Forsmark CE, Swaroop VS, Wilcox CM (2016). Acute Pancreatitis. N Engl J Med 375: 1972–1981. [DOI] [PubMed] [Google Scholar]
- Gukovskaya AS, Gukovsky I, Zaninovic V, Song M, Sandoval D, Gukovsky et al (1997). Pancreatic acinar cells produce, release, and respond to tumor necrosis factor‐alpha. Role in regulating cell death and pancreatitis. J Clin Invest 100: 1853–1862. [DOI] [PMC free article] [PubMed] [Google Scholar]
- Halangk W, Lerch MM, Brandt‐Nedelev B, Roth W, Ruthenbuerger M, Reinheckel T et al (2000). Role of cathepsin B in intracellular trypsinogen activation and the onset of acute pancreatitis. J Clin Invest 106: 773–781. [DOI] [PMC free article] [PubMed] [Google Scholar]
- Hoque R, Sohail M, Malik A, Sarwar S, Luo Y, Shah A et al (2011). TLR9 and the NLRP3 inflammasome link acinar cell death with inflammation in acute pancreatitis. Gastroenterology 141: 358–369. [DOI] [PMC free article] [PubMed] [Google Scholar]
- Hu G, Shen J, Cheng L, Guo C, Xu X, Wang F et al (2011). Reg4 protects against acinar cell necrosis in experimental pancreatitis. Gut 60: 820–828. [DOI] [PubMed] [Google Scholar]
- Huang H, Liu Y, Daniluk J, Gaiser S, Chu J, Wang H et al (2013). Activation of nuclear factor‐κB in acinar cells increases the severity of pancreatitis in mice. Gastroenterology 144: 202–210. [DOI] [PMC free article] [PubMed] [Google Scholar]
- Karanjia ND, Widdison AL, Lutrin FJ, Chang YB, Reber HA (1991). The antiinflammatory effect of dopamine in alcoholic hemorrhagic pancreatitis in cats. Studies on the receptors and mechanisms of action. Gastroenterology 101: 1635–1641. [DOI] [PubMed] [Google Scholar]
- Karanjia ND, Widdison AL, Lutrin FJ, Reber HA (1994). Dopamine in models of alcoholic acute pancreatitis. Gut 35: 547–551. [DOI] [PMC free article] [PubMed] [Google Scholar]
- Kaya E, Arslan A, Aliyazicioglu Y, Güven H, Aydin O, Ozkan K (2005). Low dose dopamine prevents end organ damage in experimentally induced pancreatitis. Hepatogastroenterology 52: 1250–1254. [PubMed] [Google Scholar]
- Keck T, Th BJ, Fernándezdel CC, Antoniu BA, Warshaw AL (2002). Matrix metalloproteinase‐9 promotes neutrophil migration and alveolar capillary leakage in pancreatitis‐associated lung injury in the rat. Gastroenterology 122: 188–201. [DOI] [PubMed] [Google Scholar]
- Kilkenny C, Browne W, Cuthill IC, Emerson M, Altman DG (2010). Animal research: reporting in vivo experiments: the ARRIVE guidelines. Br J Pharmacol 160: 1577–1579. [DOI] [PMC free article] [PubMed] [Google Scholar]
- Kinns H (2013). Classification of acute pancreatitis – 2012: revision of the Atlanta classification and definitions by international concensus. Ann Clin Biochem 50: 182–182. [DOI] [PubMed] [Google Scholar]
- Kuo YC, Huang KY, Yang CH, Yang YS, Lee WY, Chiang CW (2008). Regulation of phosphorylation of Thr‐308 of Akt, cell proliferation, and survival by the B55alpha regulatory subunit targeting of the protein phosphatase 2A holoenzyme to Akt. J Biol Chem 283: 1882–1892. [DOI] [PubMed] [Google Scholar]
- Lankisch PG (2015). Acute pancreatitis. Internist 22: 561–565. [Google Scholar]
- Lerch MM, Gorelick FS (2013). Models of acute and chronic pancreatitis. Gastroenterology 144: 1180–1193. [DOI] [PubMed] [Google Scholar]
- Leung PS, Ip SP (2006). Pancreatic acinar cell: its role in acute pancreatitis. Int J Biochem Cell Biol 38: 1024–1030. [DOI] [PubMed] [Google Scholar]
- Matsuoka Y, Nagahara Y, Ikekita M, Shinomiya T (2003). A novel immunosuppressive agent FTY720 induced Akt dephosphorylation in leukemia cells. Br J Pharmacol 138: 1303–1312. [DOI] [PMC free article] [PubMed] [Google Scholar]
- Mcgrath JC, Lilley E (2015). Implementing guidelines on reporting research using animals (ARRIVE etc.): new requirements for publication in BJP. Br J Pharmacol 172: 3189–3193. [DOI] [PMC free article] [PubMed] [Google Scholar]
- Mckenna F, Mclaughlin PJ, Lewis BJ, Sibbring GC, Cummerson JA, Bowen‐Jones D et al (2002). Dopamine receptor expression on human T‐ and B‐lymphocytes, monocytes, neutrophils, eosinophils and NK cells: a flow cytometric study. J Neuroimmunol 132: 34–40. [DOI] [PubMed] [Google Scholar]
- Mezey E, Eisenhofer G, Harta G, Hansson S, Gould L, Hunyady B et al (1996). A novel nonneuronal catecholaminergic system: exocrine pancreas synthesizes and releases dopamine. Proc Natl Acad Sci U S A 93: 10377–10382. [DOI] [PMC free article] [PubMed] [Google Scholar]
- Millward TA, Zolnierowicz S, Hemmings BA (1999). Regulation of protein kinase cascades by protein phosphatase 2A. Trends Biochem Sci 24: 186–191. [DOI] [PubMed] [Google Scholar]
- Ohtsuka Y, Lee J, Stamm DS, Sanderson IR (2001). MIP‐2 secreted by epithelial cells increases neutrophil and lymphocyte recruitment in the mouse intestine. Gut 49: 526–533. [DOI] [PMC free article] [PubMed] [Google Scholar]
- Panahi Y, Fakhari S, Mohammadi M, Rahmani MR, Hakhamaneshi MS, Jalili A (2015). Glycyrrhizin down‐regulates CCL2 and CXCL2 expression in cerulein‐stimulated pancreatic acinar cells. Am J Clin Exp Immunol 4: 1–6. [PMC free article] [PubMed] [Google Scholar]
- Pandol SJ, Saluja AK, Imrie CW, Banks PA (2007). Acute pancreatitis: bench to the bedside. Gastroenterology 133: 1056.e1051–1056.e1025. [DOI] [PubMed] [Google Scholar]
- Piston DW (2013). Dopamine synthesis and D3 receptor activation in pancreatic cells regulates insulin secretion and intracellular Ca oscillations. Mol Endocrinol 26: 1928–1940. [DOI] [PMC free article] [PubMed] [Google Scholar]
- Rommel C, Camps M, Hong J (2007). PI3K|[delta]| and PI3K|[gamma]|: partners in crime in inflammation in rheumatoid arthritis and beyond? Nat Rev Immunol 7: 191–201. [DOI] [PubMed] [Google Scholar]
- Rouge‐Pont F, Usiello A, Benoit‐Marand M, Gonon F, Piazza PV, Borrelli E (2002). Changes in extracellular dopamine induced by morphine and cocaine: crucial control by D2 receptors. J Neurosci 22: 3293–3301. [DOI] [PMC free article] [PubMed] [Google Scholar]
- Rubí B, Ljubicic S, Pournourmohammadi S, Carobbio S, Armanet M, Bartley C et al (2005). Dopamine D2‐like receptors are expressed in pancreatic beta cells and mediate inhibition of insulin secretion. J Biol Chem 280: 36824–36832. [DOI] [PubMed] [Google Scholar]
- Saeki K, Kanai T, Nakano M, Nakamura Y, Miyata N, Sujino T et al (2012). CCL2‐induced migration and SOCS3‐mediated activation of macrophages are involved in cerulein‐induced pancreatitis in mice. Gastroenterology 142: 1010–1020. [DOI] [PubMed] [Google Scholar]
- Sandoval J, Escobar J, Pereda J, Sacilotto N, Rodriguez JL, Sabater L et al (2009). Pentoxifylline prevents loss of PP2A phosphatase activity and recruitment of histone acetyltransferases to proinflammatory genes in acute pancreatitis. J Pharmacol Exp Ther 331: 609–617. [DOI] [PubMed] [Google Scholar]
- Shrivastava P, Bhatia M (2010). Essential role of monocytes and macrophages in the progression of acute pancreatitis. World J Gastroenterol 16: 3995–4002. [DOI] [PMC free article] [PubMed] [Google Scholar]
- Southan C, Sharman JL, Benson HE, Faccenda E, Pawson AJ, Alexander SPH et al (2016). The IUPHAR/BPS guide to PHARMACOLOGY in 2016: towards curated quantitative interactions between 1300 protein targets and 6000 ligands. Nucl Acids Res 44 (D1): D1054–D1068. [DOI] [PMC free article] [PubMed] [Google Scholar]
- Steele CW, Karim SA, Foth M, Rishi L, Leach JD, Porter RJ et al (2015). CXCR2 inhibition suppresses acute and chronic pancreatic inflammation. J Pathol 237: 85–97. [DOI] [PMC free article] [PubMed] [Google Scholar]
- Swamydas M, Lionakis MS (2013). Isolation, purification and labeling of mouse bone marrow neutrophils for functional studies and adoptive transfer experiments. J Vis Exp: e50586. [DOI] [PMC free article] [PubMed] [Google Scholar]
- Terashima Y, Onai N, Murai M, Enomoto M, Poonpiriya V, Hamada T et al (2005). Pivotal function for cytoplasmic protein FROUNT in CCR2‐mediated monocyte chemotaxis. Nat Immunol 6: 827–835. [DOI] [PubMed] [Google Scholar]
- Van Laethem JL, Marchant A, Delvaux A, Goldman M, Robberecht P, Velu T et al (1995). Interleukin 10 prevents necrosis in murine experimental acute pancreatitis. Gastroenterology 108: 1917–1922. [DOI] [PubMed] [Google Scholar]
- Vande WL, Van ON, Jacques P, Fossoul A, Verheugen E, Vogel P et al (2014). Negative regulation of the NLRP3 inflammasome by A20 protects against arthritis. Nature 512: 69–73. [DOI] [PMC free article] [PubMed] [Google Scholar]
- Wei S, Shu‐zhen Z, Mi T, Xin‐hua Z, Zheng Z, Yan‐qing Y et al (2013). Suppression of neuroinflammation by astrocytic dopamine D2 receptors via αB‐crystallin. Nature 494: 90–94. [DOI] [PubMed] [Google Scholar]
- Wei M, Gong YJ, Tu L, Li J, Liang YH, Zhang YH (2015). Expression of phosphatidylinositol‐3 kinase and effects of inhibitor Wortmannin on expression of tumor necrosis factor‐α in severe acute pancreatitis associated with acute lung injury. World J Emerg Med 6: 299–304. [DOI] [PMC free article] [PubMed] [Google Scholar]
- Weischenfeldt J, Porse B (2008). Bone marrow‐derived macrophages (BMM): isolation and applications. Cold Spring Harb Protoc 2008: pdb.prot5080. [DOI] [PubMed] [Google Scholar]
- Wu D, Zeng Y, Fan Y, Wu J, Mulatibieke T, Ni J et al (2016). Reverse‐migrated neutrophils regulated by JAM‐C are involved in acute pancreatitis‐associated lung injury. Sci Rep 6: 20545. [DOI] [PMC free article] [PubMed] [Google Scholar]
- Xue J, Sharma V, Habtezion A (2014). Immune cells and immune‐based therapy in pancreatitis. Immunol Res 58: 378–386. [DOI] [PubMed] [Google Scholar]
- Yadav D, Lowenfels AB (2013). The epidemiology of pancreatitis and pancreatic cancer. Gastroenterology 144: 1252–1261. [DOI] [PMC free article] [PubMed] [Google Scholar]
- Yan Y, Wei J, Lei L, Wang X, Chen D, Tian Z et al (2015). Dopamine controls systemic inflammation through inhibition of NLRP3 inflammasome. Cell 160: 62–73. [DOI] [PubMed] [Google Scholar]
- Yang Zw, Meng Xx, Xu P (2015). Central role of neutrophil in the pathogenesis of severe acute pancreatitis. J Cell Mol Med 19: 2513–2520. [DOI] [PMC free article] [PubMed] [Google Scholar]
- Zaroslinski JF, Possley LH, Schwartz RA, Morris RN, Carone FA, Browne RK (1977). The pharmacology and subacute toxicology of dopamine. Proc R Soc Med 70 (Suppl 2): 2–6. [PMC free article] [PubMed] [Google Scholar]
- Zhang S, Peng XG, Liu CC, Liu H, Lu Y (2007). Low‐dose dopamine reduces inlfammatory factors of acute pancreatitis in rats. Hepatobiliary Pancreat Dis Int 6: 646–649. [PubMed] [Google Scholar]
- Zhang Y, Chen Y, Wu J, Manaenko A, Yang P, Tang J et al (2015a). Activation of dopamine D2 receptor suppresses neuroinflammation through αB‐crystalline by inhibition of NF‐κB nuclear translocation in experimental ICH mice model. Stroke 46: 2637–2646. [DOI] [PMC free article] [PubMed] [Google Scholar]
- Zhang Y, Jiang X, Qin C, Cuevas S, Jose PA, Armando I (2015b). Dopamine D2 receptors effects on renal inflammation are mediated by regulation of PP2A function. Am J Physiol Renal Physiol 310: F128–F134. [DOI] [PMC free article] [PubMed] [Google Scholar]
- Zhang Y, Zheng R, Meng X, Wang L, Liu L, Gao Y (2015c). Pancreatic endocrine effects of dopamine receptors in human islet cells. Pancreas 44: 925–929. [DOI] [PubMed] [Google Scholar]
Associated Data
This section collects any data citations, data availability statements, or supplementary materials included in this article.
Supplementary Materials
Table S1 Primer sequences used for qRT‐PCR analysis.
Figure S1 Dynamic expression levels of DRDs in AP model. (A‐C) Caerulein‐induced AP was built by ten injections of caerulein (100 μg·kg−1, i.p. with a 1 h interval between injections). LPS (5 mg·kg−1) was administered by intraperitoneal injection immediately after the last injection of caerulein. Controls received similar injections of NS instead of caerulein or L‐Arginine. Mice were killed at 0 h, 1 h, 6 h, 12 h, 24 h, day3 and day5 after the first caerulein injection. (A) Representative micrographs of H&E‐stained pancreatic sections (200×). (B) Immunoblot analysis of DRD1 and DRD2 proteins of pancreas tissue at different time points. (C) qRT‐PCR of mRNA levels of Drd1 and Drd2 in pancreatic tissue at different time points. Results are shown as fold‐change relative to the 0 h group. (D) qRT‐PCR of mRNA levels of Drd1–5 in pancreatic tissue at 12 h after the first caerulein injection. (E) qRT‐PCR of mRNA levels of Drd1–5 in CCK‐stimulated PACs. (F) ELISA of dopamine in serum of caerulein and LPS induced pancreatitis. n = 6 per group. NC, normal control; AP, acute pancreatitis. Scale bar =100 μm. *P < 0.05 vs 0 h.
Figure S2 Dopamine upregulates DRD expression in CCK‐stimulated PACs. PACs were treated with dopamine (250 μM, 500 μM, 750 μM) at the time of CCK (200 nM) stimulation. (A) Immunoblot analysis of DRD1 and DRD2 of CCK‐stimulated PACs (at 4 h after CCK stimulation). (B) qRT‐PCR of mRNA levels of Drd1 and Drd2 in CCK‐stimulated PACs (at 4 h after CCK stimulation). DA, dopamine. *P < 0.05 vs NC, #P < 0.05 vs CCK.
Figure S3 Generation of conditional pancreas‐specific Drd2 knockout mice. RT‐PCR of genotype identification of transgenic mice. WT, wild‐type; Hom, homozygote; Het, heterozygote.
Figure S4 PI3K‐Akt‐IKK‐IκB‐NFκB pathway is activated in CCK‐stimulated PACs. PACs were stimulated by 200 nM CCK. (A) Immunoblot analysis of PI3K, Akt and IKK phosphorylation levels of PACs at the indicated time after CCK stimulation. (B) Immunoblot analysis of IκBα and NFκBp65 phosphorylation levels of PACs at the indicated time after CCK stimulation. *P < 0.05 vs 0 min.
Figure S5 DRD2 signalling inhibits NFκB activation in CCK‐stimulated PACs. PACs were treated with Quinpirole (2.5 μM, 5 μM, 10 μM) at the time of CCK (200 nM) stimulation. (A) Immunoblot analysis of PI3K, Akt, IKK phosphorylation levels (at 15 min after CCK stimulation) and IκBα, NFκBp65 phosphorylation levels (at 1 h after CCK stimulation). (B) Immunoblot analysis of TNFα, IL1β and IL6 levels of PACs (at 4 h after CCK stimulation). (C) qRT‐PCR of mRNA levels of Tnfα, Il1β and Il6 of PACs (at 4 h after CCK stimulation). Quin, Quinpirole. *P < 0.05 vs NC, #P < 0.05 vs CCK.