Abstract
Hypertension is a major risk factor for ischemic cardiovascular disease and cerebrovascular disease, which are respectively the primary and secondary most common causes of morbidity and mortality across the globe. To alleviate the risks of hypertension, there are a number of effective antihypertensive drugs available. However, the optimal treatment blood pressure goal for antihypertensive therapy remains an area of controversy. The results of the recent Systolic Blood Pressure Intervention Trial (SPRINT) trial, which found benefits for intensive lowering of systolic blood pressure, have been debated for several reasons. We aimed to assess the benefits of treating to four different blood pressure targets and to compare our results to those of SPRINT using a method for causal inference called the parametric g formula. We applied this method to blood pressure measurements obtained from the electronic health records of approximately 200,000 patients who visited the Mount Sinai Hospital in New York, NY. We simulated the effect of four clinically relevant dynamic treatment regimes, assessing the effectiveness of treating to four different blood pressure targets: 150 mmHg, 140 mmHg, 130 mmHg, and 120 mmHg. In contrast to current American Heart Association guidelines and in concordance with SPRINT, we find that targeting 120 mmHg systolic blood pressure is significantly associated with decreased incidence of major adverse cardiovascular events. Causal inference methods applied to electronic methods are a powerful and flexible technique and medicine may benefit from their increased usage.
Keywords: Causal inference, blood pressure, electronic health records, parametric g formula, preventative medicine
1. Introduction
1.1. Global Burden of Hypertension
Ischemic cardiovascular disease and cerebrovascular disease are the primary and secondary causes of global disease burden respectively, both in the United States and the rest of the world (1). Hypertension (HTN), also known as elevated blood pressure (BP), is a primary risk factor for both diseases (2). Additional evidence continues to accumulate for the role of HTN as a central risk factor for a wide variety of chronic diseases such as dementia (3) and type 2 diabetes mellitus (4). As both developed and developing countries continue to experience greater chronic disease burden, treatment and prevention of HTN is one of the most important issues in medicine.
1.2. Challenges in Previous Efforts to Discover Optimal Target Blood Pressures
There are up to 69 different drugs from 15 different classes available to manage HTN, demonstrating the widely understood importance of managing this condition. Even with this plethora of available medications, current estimates indicate that up to 65% of patients with HTN have difficulty controlling their blood pressure (5). One issue confounding this matter is a lack of consensus on the appropriate target blood pressure. In 2014, the Eighth Joint National Committee on Hypertension (JNC 8) released the latest guidelines for hypertension treatment which recommend that patients over 60 years old be medicated to a target BP of 150 mmHg systolic (SBP) and 90 mmHg diastolic (DBP) (6). Additionally, they recommended that patients 30–59 years old be medicated to a DBP target of 90 mmHg. Notably, the JNC 8 could not establish an evidence-based SBP goal for individuals within this age range. In 2015, investigators for the Systolic Blood Pressure Intervention Trial (SPRINT) released highly anticipated findings in the New England Journal of Medicine for the benefit of intensive HTN treatment measured against the standard hypertension treatment regime (7). The SPRINT investigators defined intensive therapy as medical therapy intended to reduce BP to 120/80 mmHg or below, instead of the standard goal therapy of 140/90 mmHg. This large trial recruited 9,361 patients from 102 different clinical sites (from 5 clinical networks) across the country and followed them for adverse outcomes for a median of 3.26 years.
SPRINT was intended to provide a definitive answer for the benefits of intensive antihypertensive therapy. The trial results seemed to demonstrate that intensive antihypertensive therapy was strongly associated with lowered risk for the study’s primary study endpoint of myocardial infarction, acute coronary syndrome, stroke, congestive heart failure, or cardiovascular death (HR=0.75, p<0.001) (7). However, this conclusion provoked a firestorm of controversy in the cardiovascular medicine community. Blood pressure is a difficult phenotype to measure, since readings vary from minute to minute, many patients suffer from “white-coat hypertension” in the presence of a physician, and measurements are usually taken with a manual sphygmomanometer and stethoscope (8,9). In contrast, the SPRINT trial broke with decades of precedence by using an automated electronic BP measurement device to capture a series of six measurements (8,9). Three measurements were spaced one minute apart in the presence of a researcher and three more were recorded outside of the presence of the researcher after a five-minute break (10,11). It has been suggested that this difference in BP measurement technique may make their results impossible to apply to the clinic (10). This is because the SPRINT blood pressure measurement method is known to produce systematically different blood pressure readings when compared to the standard technique used in many hospitals and in previous trials (9). Typical systolic blood pressure measurements are 14 mmHg lower using the SPRINT method compared to the standard method (9). For example, this implies a SPRINT target of 120mmHg may be equivalent to a real-world target of 134mmHg. Thus, the external validity of the SPRINT findings is unclear–SPRINT targets result from BP measurements that may not be comparable to normal BP measurements made outside of the clinical trial’s setting. Due to this controversy, we believe that additional complementary evidence supporting aggressive antihypertensive treatment could provide insight on treatment decisions and outcomes.
1.3. Causal Inference from Electronic Health Records As a Tool to Answer Difficult Clinical Questions
Electronic health records (EHR) present an excellent potential data source to analyze and determine optimal blood pressure treatment goal. EHR contain longitudinal information captured during the routine care process such as visit dates, patient demographics such as age; sex; self-declared race/ethnicity; medication prescription orders, disease and procedure billing codes, and most importantly, blood pressure measurements. Of note, the BP measurements contained within the EHR will reflect what is routinely measured clinically, instead of BP as is measured within a contained clinical trial setting such as SPRINT.
One challenge in the use of EHR for BP analysis is the clinical situation in which hypertension is managed. Hypertension is a chronic disease in which BP measurements are longitudinally manipulated by the administration of a variety of drugs over an extended period of time. This is in contrast to a clinical trial, where other exogenous factors are explicitly modeled and a drug may be consistently administered throughout the study. Confounding post-baseline time-varying dependent relationships such as these cannot be modeled using conventional statistical methods such as regression or survival analysis without many potentially unrealistic assumptions (11). While observational analyses are restricted to a framework where one can only test interventions that have been explicitly carried out in the data, the g-formula approach enables us to simulate dynamic treatment strategies and estimate their effects, even if those strategies have not been fully carried out in the data used to construct the model (12). G methods may be used to estimate the effect of different interventions on an outcome in the presence of time-varying confounders. For example, an extension of g methods called the parametric G formula has been used to measure the effect of different treatment regimes for highly active retroviral therapy (HAART) in AIDS (13); to estimate the effect of different governmental policies on radon and lung cancer (14); and to decide upon optimal anemia management strategies (15). However, these causal inference methods have never been applied to real, hospital-derived EHR. Here, we use the parametric g formula to model the effect of different BP treatment targets on major adverse cardiovascular outcomes (MACE).
2. Methods
2.1. Data Acquisition from the Mount Sinai Hospital EHR
The Mount Sinai Hospital (MSH) is a tertiary-care urban hospital located on the Upper East Side of Manhattan in New York City. MSH’s EMR contains longitudinal information for more than two million patients (800,00 with at least 1 prescription) collected from 2008–2016. We identified hypertensive patients using a phenotyping algorithm combining International Classification of Disease (ICD-9) billing codes, blood pressure measurements, natural language processed physician notes, and the prescription of antihypertensive medications (Figure 1). Phenotyped patients must have had at least two elevated blood pressure measurements (SBP>140 or DBP>90) and two instances (each on different days) of one of the following: hypertensive medications, ICD hypertension billing codes, or mentions of hypertension in the physician notes. Medications in the EMR were normalized to Anatomical Therapeutic Chemical (ATC) Classification System drug classes using RxNorm (16). Antihypertensive medications were defined as those belonging to ATC classes C02 (Antihypertensives), C03 (Diuretics), C04 (Peripheral vasodilators), C07 (Beta blocking agents), C08 (Calcium channel blockers), and C09 (Agents acting on the renin-angiotensin system) and then further filtered by intersection with JNC 8 recommended antihypertensive medications. Essential hypertension billing codes were identified as those starting with 401.xx. We assessed cardiovascular adverse outcomes with the commonly used major adverse cardiovascular event (MACE) composite endpoint, which is often composed of myocardial infarction, stroke, and heart failure events. We identified patients with a MACE using the corresponding ICD9 codes 410.xx, 411.xx, 428.xx, 433.xx, 434.xx, and 436.xx.
Figure 1.
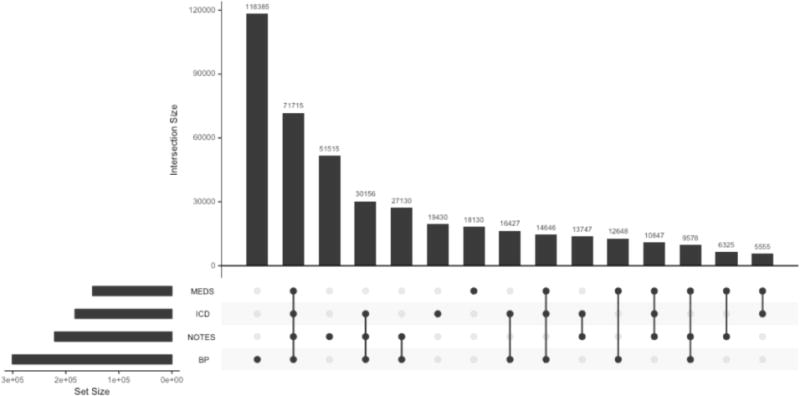
Hypertension phenotyping algorithm patient counts
2.2. Problem setup
We evaluated the effect of treating patients to four different SBP targets: 150 mmHg, 140 mmHg, 130 mmHg, and 120 mmHg. We chose these four targets because they have each been suggested as SBP blood pressure targets. We assume the causal pathway demonstrated by the directed acyclic graph in Figure 2, where, blood pressure measurements are related to drug choice selection as well as MACE outcomes. Additionally, at each time step an individual may be censored (i.e., lost from the EHR). Finally, antihypertensive medications act to reduce blood pressure measurements subsequent to their administration.
Figure 2.
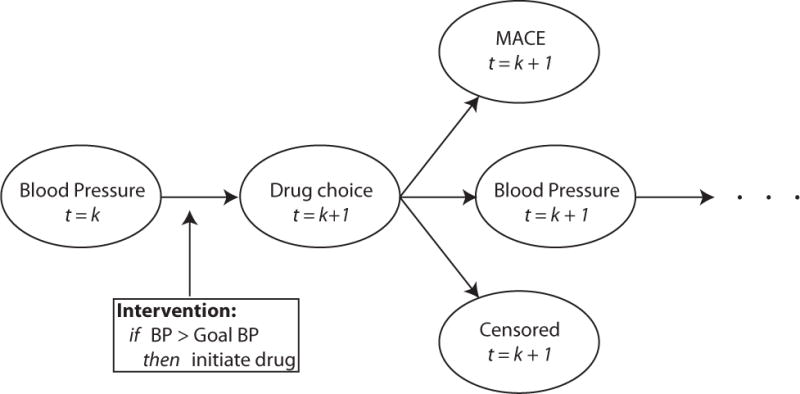
Directed acyclic graph for relationship between blood pressure measurement, drug administration, MACE, censoring, and modeled intervention policy
2.3. Parametric g formula
The g formula directly models probabilities for a given outcome conditional upon covariates and exposures. For real-world datasets, modeling all conditional probabilities directly is not feasible, especially in the presence of continuous covariates such as BP. The parametric g formula is an extension of the g formula where parametric models are used to model probabilities instead of direct calculations. Parametric methods have the advantage of being computationally feasible, able to handle continuous covariates, and more efficient given the data. Analysis using the parametric g formula requires a three-step algorithm (Figure 3).
Figure 3.
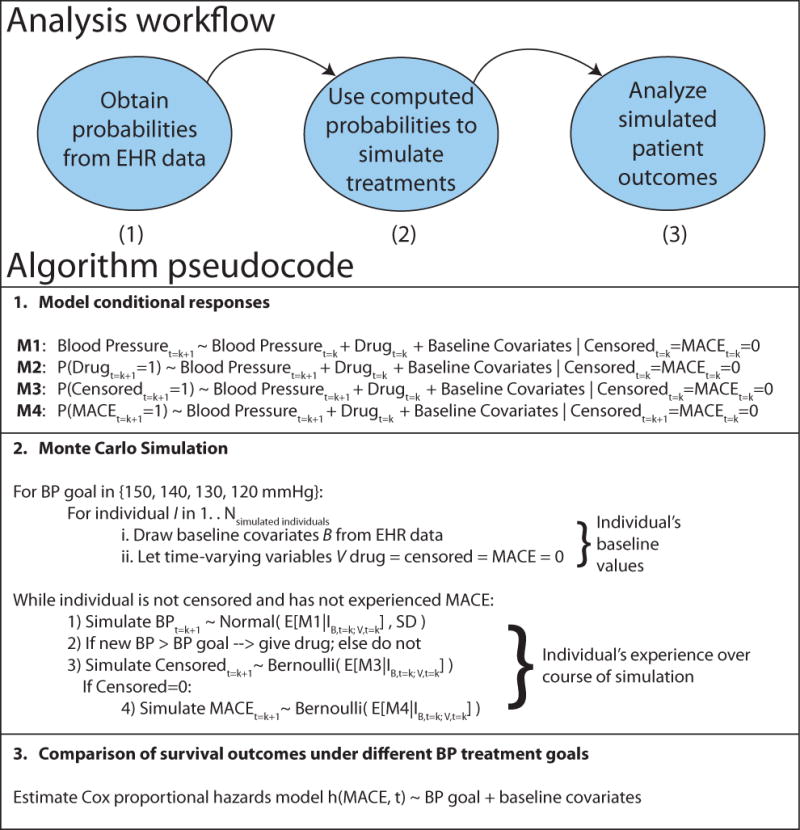
Explanation of parametric g formula analysis for BP target
1. Model Conditional Probabilities
First, we model effect sizes and conditional probabilities for all person-times for (a) all covariates and (b) outcomes in our dataset using Bayesian logistic regression. Bayesian prior regression models are implemented in the R package arm (17). Models are restricted to those who survive and remain uncensored to time t = k + 1 and include the effects of baseline covariates as well as time-varying covariates at time k.
2. Monte Carlo Simulation
Second, we perform Monte Carlo simulation for 10,000 individuals for each treatment target using the probabilities from step 1, intervening as required with drug treatment if BP exceeds our target BP. Each individual’s baseline covariates are sampled from the dataset, and time-varying covariates are simulated using the predicted probability as the conditional mean in a random draw from the Bernoulli distribution in the case of binary variables. In the case of BP, we used the predicted blood pressure as the mean for a normal distribution with standard deviation equal to the mean standard deviation for individuals with matched baseline covariates.
3. Risk computation under different treatment goals
We fit Cox proportional hazards models to evaluate the relative efficacy to the results from each of the different simulated treatment policies and estimate their efficacy.
3. Results
3.1. Electronic Health Records Data
We obtained health records from the Mount Sinai Hospital for 218,221 different hypertensive patients. 104,514 individuals were female, 98,048 individuals were male, and 4 individuals were of indeterminate sex and dropped from the analysis due to insufficient power. The remaining individuals did not have sex coded. 81,054 individuals were Caucasian, 38,134 were African American; 37,008 listed “Other;” 24,435 were Unknown; 12,108 were Hispanic/Latino; 7329 were Asian; and the rest were composed of known but rare ethnicities (Native American, Pacific Islander, etc., – sample counts not shown to preserve patient confidentiality) and subsequently combined into “Other.” These individuals were collectively prescribed medications 3,678,597 times (16.9 medication prescriptions per person). The EHR contained 31,088,598 measurements of SBP and 31,039,040 measurements of DBP, although the count of BP measurements per individual was significantly right-skewed likely due to frequent measurements of hospitalized critical-care unit patients.
3.2. Survival time by goal blood pressure target
We simulated 10,000 patients for each BP target. The 40,000 simulated patients experienced a total of 14,501 major adverse cardiovascular events. The number of MACE was highest in the 150 mmHg target group (3853 events), followed by 140 mmHg group (3722 events), followed by 130 mmHg group (3559 events), followed finally by the 120 mmHg target group (3367 events). Median MACE-free survival times were similarly ordered: 150 mmHg, 31 encounters (95% CI: 29–33); 140 mmHg, 33 encounters (95% CI: 31–34); 130 mmHg, 34 encounters (95% CI: 33–35); 120 mmHg, 35 encounters (95% CI: 34–37).
Survival was significantly associated with BP target (Figure 4), with survival highest at the lowest target goal (120mmHg) and less at 130 mmHg and 140 mmHg. Setting the reference target BP as 150 mmHg, we found hazard ratios of 0.934 (Target goal of 140 mmHg, p=0.003); 0.895 (Target goal of 130 mmHg, p=1.94×10⁻⁶); and 0.846 (Target goal of 120 mmHg, p=1.46×10⁻¹²). Male sex was significantly associated with elevated hazard compared to females (HR=1.27, p<10−15). Compared to Caucasian individuals, those of self-declared Hispanic/Latino and Unkown ancestry were more likely to have a MACE (HR=1.364, p<2×10⁻¹⁶ and HR=1.134, p=0.0003 respectively). Interestingly, those of Native American or African American ancestry actually had a slightly lower hazard ratio for MACE outcomes compared to Caucasian individuals (HR=0.932, p=0.023 and HR=0.922, p=0.016 respectively). Those of Asian or Other ancestry did not have a significantly different hazard ratio than Caucasian ancestry individuals (p=0.33 and p=0.279, respectively).
Figure 4.
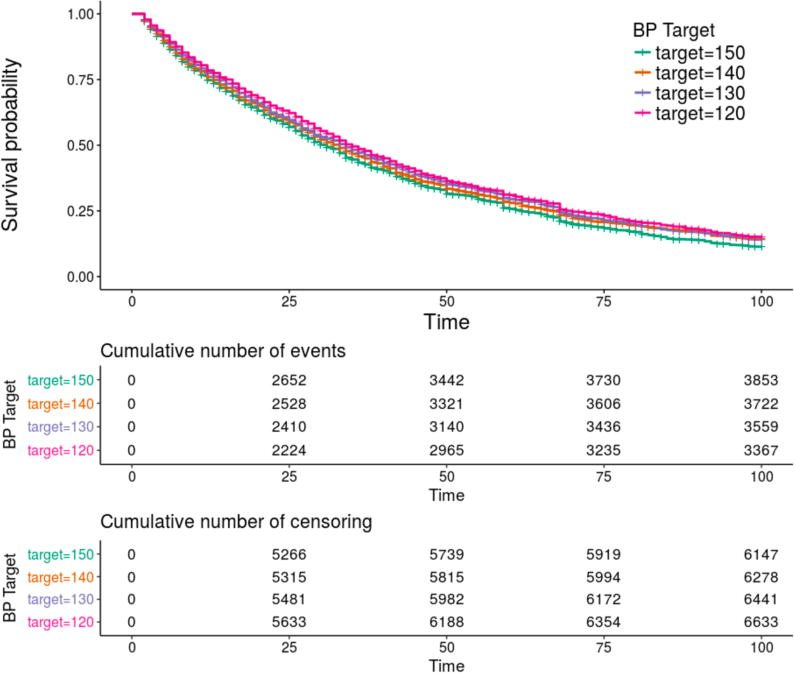
Kaplan-Meier survival plot for observed survival times stratified by target blood pressure. Survival was greatest at a target blood pressure of 120 mmHg, second best at 130 mmHg, third best at 140 mmHg, and worst at a BP target of 150 mmHg. The overall P value for the model was <10−16.
Interestingly, examination of the blood pressures of survivors revealed that the distribution of survivors’ blood pressures tended to shrink as time advanced. This can be explained by the fact that those with very high or very low blood pressures tended to either have their blood pressure managed toward a goal target or else experienced MACE (Figure 5).
Figure 5.
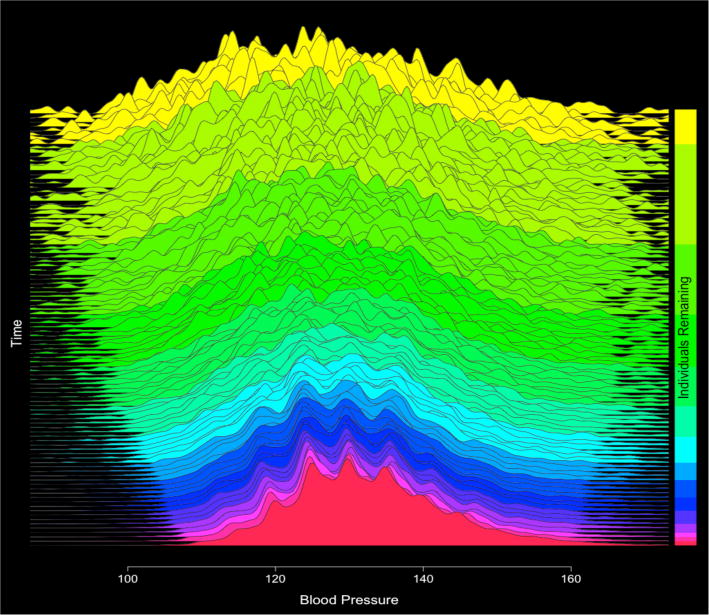
Plots of overall conditional predicted blood pressures over time (Beginning time at top of plot, final predictive models at the bottom of the plot). Distribution of conditional blood pressure predictions tends to shrink as there are a) fewer individuals
4. Conclusion
In this study, we applied an established causal inference technique to a large EHR database to simulate the effects of four different antihypertensive treatment regimes on MACE outcomes. Our findings are concordant with the recent conclusions from SPRINT, where a target systolic blood pressure goal of 120 mmHg was found to dramatically lower the incidence of adverse cardiovascular outcomes. Our estimated hazard ratio of 0.85 for 120 mm target compared to 150 mmHg compares to the SPRINT hazard ratio estimate of 0.75 for the same comparison, although our estimated hazard ratio is less optimistic than the SPRINT hazard ratio.
This contrasts with the current recommendations from the American Heart Association and the American Association of Family Physicians, who both do not recommend targeting 120 mmHg. Interestingly, BP measurements obtained at the Mount Sinai Hospital are generally measured using a manual sphygmomanometer and stethoscope, instead of with an automated device as in the SPRINT trial. Despite this difference, we arrived at similar conclusions for the efficacy of intensive antihypertensive therapy. This may suggest that SPRINT BP estimates are not as discordant with past literature as is believed. Certainly, as hypertension is a vitally important topic, we believe our finding points out the need for additional studies. Future studies for BP goal measurements will likely benefit greatly from the inclusion of more personalized drug treatments strategies and a more “precision medicine” approach.
There are several limitations to our study. First, the typical definition of major adverse cardiovascular events (MACE) often includes death from a cardiovascular etiology. Due to the limitations of EHR, we were not able to include death as a MACE outcome in our study. This limitation may be partially mitigated by the fact that many of those who die from a cardiovascular etiology would have one of the MACE ICD-9 billing codes preceding their death. Second, our treatment dynamic algorithm currently does not yet include changes in drug dosages, which is one technique physicians can use to adjust the degree of antihypertensive medication efficacy. Similarly, we do not consider patient BMIs when modeling drug efficacy per patient, which is related to drug dosages. Finally, as with all observational studies, there may be unmeasured confounders which may influence our results to some degree. To this end, we are comforted to some extent by the fact that our study conclusions more closely resembled those from a randomized clinical trial results than those from other observational analyses.
To the best of our knowledge, the e results represent a first application of the parametric g formula to a hospital-based electronic health record system, and almost certainly the first application of such a model in the context of cardiovascular preventative medicine. Causal inference methods allow for the retrospective analysis of treatment regimes which could not easily be performed, or in some cases would not even be ethical to be performed in a randomized clinical trial setting. Taken altogether, we believe our study (1) demonstrates the utility of the parametric g-formula for analysis of treatment interventions in EHR data; and (2) presents complementary and concordant evidence to the SPRINT trial in support of intensive antihypertensive therapy.
Table 1.
Results of Survival Analysis
| Covariate | Reference Level | Hazard Ratio | H.R. 95% CI | P-Value |
|---|---|---|---|---|
| 140 mmHg Target | 150 mmHg Target | 0.934 | (0.8928, 0.9770) | 0.002975 |
| 130 mmHg Target | 150 mmHg Target | 0.895 | (0.8553, 0.9370) | 1.94×10⁻⁶ |
| 120 mmHg Target | 150 mmHg Target | 0.846 | (0.8079, 0.8862) | 1.46×10⁻¹² |
| Male | Female | 1.270 | (1.2294, 1.3124) | <2×10⁻¹⁶ |
| African American | Caucasian | 0.922 | (0.8631, 0.9849) | 0.015937 |
| Asian | Caucasian | 0.970 | (0.9101, 1.0326) | 0.334363 |
| Hispanic/Latino | Caucasian | 1.364 | (1.2773, 1.4566) | <2×10⁻¹⁶ |
| Native American | Caucasian | 0.932 | (0.8775, 0.9904) | 0.023023 |
| Other Race | Caucasian | 0.934 | (0.8394, 1.0518) | 0.278997 |
| Unknown Race | Caucasian | 1.134 | 1.0584 1.2138 | 0.000341 |
Acknowledgments
We gratefully acknowledge Yi Zhang (yz@mttpi.org) for clarification of the parametric G formula and her previous work on the method over email correspondence.
References
- 1.Mortality GBD, Causes of Death C. Global, regional, and national life expectancy, all-cause mortality, and cause-specific mortality for 249 causes of death, 1980–2015: a systematic analysis for the Global Burden of Disease Study 2015. Lancet. 2016;388:1459–1544. doi: 10.1016/S0140-6736(16)31012-1. [DOI] [PMC free article] [PubMed] [Google Scholar]
- 2.Blacher J, Levy BI, Mourad JJ, Safar ME, Bakris G. From epidemiological transition to modern cardiovascular epidemiology: hypertension in the 21st century. Lancet. 2016;388:530–2. doi: 10.1016/S0140-6736(16)00002-7. [DOI] [PubMed] [Google Scholar]
- 3.Livingston G, Sommerlad A, Orgeta V, et al. Dementia prevention, intervention, and care. Lancet. 2017 doi: 10.1016/S0140-6736(17)31363-6. [DOI] [PubMed] [Google Scholar]
- 4.Kim MJ, Lim NK, Choi SJ, Park HY. Hypertension is an independent risk factor for type 2 diabetes: the Korean genome and epidemiology study. Hypertens Res. 2015;38:783–9. doi: 10.1038/hr.2015.72. [DOI] [PMC free article] [PubMed] [Google Scholar]
- 5.Oparil S, Schmieder RE. New approaches in the treatment of hypertension. Circ Res. 2015;116:1074–95. doi: 10.1161/CIRCRESAHA.116.303603. [DOI] [PubMed] [Google Scholar]
- 6.James PA, Oparil S, Carter BL, et al. 2014 evidence-based guideline for the management of high blood pressure in adults: report from the panel members appointed to the Eighth Joint National Committee (JNC 8) JAMA. 2014;311:507–20. doi: 10.1001/jama.2013.284427. [DOI] [PubMed] [Google Scholar]
- 7.Group SR. Wright JT, Jr, Williamson JD, et al. A Randomized Trial of Intensive versus Standard Blood-Pressure Control. N Engl J Med. 2015;373:2103–16. doi: 10.1056/NEJMoa1511939. [DOI] [PMC free article] [PubMed] [Google Scholar]
- 8.Cuspidi C, Sala C, Grassi G, Mancia G. White Coat Hypertension: to Treat or Not to Treat? Curr Hypertens Rep. 2016;18:80. doi: 10.1007/s11906-016-0687-9. [DOI] [PubMed] [Google Scholar]
- 9.Flack JM. Method of Blood Pressure Measurement, Interpretation of SPRINT, and the Atlantic Divide. Curr Hypertens Rep. 2017;19:19. doi: 10.1007/s11906-017-0719-0. [DOI] [PubMed] [Google Scholar]
- 10.Bakris GL. The Implications of Blood Pressure Measurement Methods on Treatment Targets for Blood Pressure. Circulation. 2016;134:904–5. doi: 10.1161/CIRCULATIONAHA.116.022536. [DOI] [PubMed] [Google Scholar]
- 11.Myers MG, Cloutier L, Gelfer M, Padwal RS, Kaczorowski J. Blood Pressure Measurement in the Post-SPRINT Era: A Canadian Perspective. Hypertension. 2016;68:e1–3. doi: 10.1161/HYPERTENSIONAHA.116.07598. [DOI] [PubMed] [Google Scholar]
- 12.Keil AP, Edwards JK, Richardson DB, Naimi AI, Cole SR. The parametric g-formula for time-to-event data: intuition and a worked example. Epidemiology. 2014;25:889–97. doi: 10.1097/EDE.0000000000000160. [DOI] [PMC free article] [PubMed] [Google Scholar]
- 13.Edwards JK, McGrath LJ, Buckley JP, Schubauer-Berigan MK, Cole SR, Richardson DB. Occupational radon exposure and lung cancer mortality: estimating intervention effects using the parametric g-formula. Epidemiology. 2014;25:829–34. doi: 10.1097/EDE.0000000000000164. [DOI] [PMC free article] [PubMed] [Google Scholar]
- 14.Westreich D, Cole SR, Young JG, et al. The parametric g-formula to estimate the effect of highly active antiretroviral therapy on incident AIDS or death. Stat Med. 2012;31:2000–9. doi: 10.1002/sim.5316. [DOI] [PMC free article] [PubMed] [Google Scholar]
- 15.Zhang Y, Young JG, Thamer M, Hernan MA. Comparing the Effectiveness of Dynamic Treatment Strategies Using Electronic Health Records: An Application of the Parametric g-Formula to Anemia Management Strategies. Health Serv Res. 2017 doi: 10.1111/1475-6773.12718. [DOI] [PMC free article] [PubMed] [Google Scholar]
- 16.Nelson SJ, Zeng K, Kilbourne J, Powell T, Moore R. Normalized names for clinical drugs: RxNorm at 6 years. J Am Med Inform Assoc. 2011;18:441–8. doi: 10.1136/amiajnl-2011-000116. [DOI] [PMC free article] [PubMed] [Google Scholar]
- 17.AGaY-S Su. arm: Data Analysis Using Regression and Multilevel/Hierarchical. Models. R package version 1.9–3. 2016 [Google Scholar]


