

Interstitial deletion of a single copy of chromosome 5q is the most frequent cytogenetic alteration in myelodysplastic syndromes (MDS), which results in reduced dosage of numerous genes. Moreover, the extent of the 5q deletion determines disease severity,1 suggesting cooperation between deleted genes in the proximal and distal regions of del(5q). Although the contribution of individual genes to the pathogenesis of del(5q) MDS has been investigated, less is known about the epistatic interactions and/or cooperation between neighboring deleted genes. Deletion of TRAF-interacting protein with forkhead-associated domain B (TIFAB) and miR-146a, two haploinsufficient genes in del(5q) MDS, has been previously reported to activate the Toll-like receptor (TLR) signaling cascade in hematopoietic stem/progenitor cells (HSPC) by increasing TRAF6 protein stability and mRNA translation, respectively.2 To investigate the epistasis of TIFAB and miR-146a, we generated a mouse model in which Tifab and miR-146a were simultaneously deleted (Tifab−/−; miR-146a−/−, dKO). Herein, we report that combined hematopoietic-specific deletion of Tifab and miR-146a results in more rapid and severe cytopenia, and progression to a fatal bone marrow (BM) failurelike disease as compared with Tifab- or miR-146a-deficiency alone. HSPC from Tifab−/−, miR-146a−/− and dKO mice exhibit enrichment of gene regulatory networks associated with innate immune signaling. Moreover, a subset of the differentially expressed genes is controlled synergistically following deletion of Tifab and miR-146a. Notably, nearly half of these defined synergy response genes identified in the mouse models were aberrantly expressed in del(5q) MDS HSPC when TIFAB (5q31) and miR-146a (5q33.3) were both deleted. Thus, synergistic control of gene expression following deletion of epistatic haploinsufficient genes in del(5q) MDS may be an underlying mechanism of the diseased state.
TIFAB resides within the proximal commonly-deleted region on band 5q31.1, and belongs to a family of forkhead-associated domain proteins. TIFAB is a gene that is deleted in nearly all reported cases of del(5q) MDS and acute myeloid leukemia (AML).2,3 As expected, TIFAB expression is significantly lower in CD34+ and BM mononuclear (MNC) cells isolated from MDS patients with del(5q) as compared with cells from MDS patients diploid at chr 5q. Recently we have shown that hematopoieticspecific deletion of Tifab results in progressive BM and blood defects, including aberrant HSPC proportions, altered myeloid differentiation and progressive cytopenia.2 Approximately 10% of mice transplanted with Tifab KO HSPCs develop a BM failure with neutrophil dysplasia and cytopenia. Gene expression analysis of Tifab KO lineage−Sca1+cKit+ (LSK) cells identified dysregulation of immune-related signatures, and hypersensitivity to TLR4 stimulation. We also reported that TIFAB forms a complex with TRAF6, and reduces TRAF6 protein stability. Re-expression of TIFAB in del (5q) MDS/AML cells results in attenuated TLR4 signaling and reduced MDS/AML cell viability.2 In a separate study, TIFAB was identified by a retroviral insertional mutagenesis screen as a target in del(5q) myeloid neoplasms.3
miR-146a resides within the distal deleted region on band 5q33.3, and serves as a rheostat for innate immunity by targeting several components of the TLR signaling pathway, including TLR4, TRAF6 and IRAK1. Multiple groups have validated TRAF6 and IRAK1 as key targets of miR-146a.4–8 Evidence that reduced levels of miR-146a contribute to hematopoietic defects associated with MDS was shown in mouse models: knockdown or germ-line deletion of miR-146a results in hematological abnormalities including transient myeloid expansion in the BM and peripheral blood (PB), late onset neutropenia, myeloid dysplasia and progression to more aggressive diseases such as lymphomas, BM failure and myeloid leukemia.4,6–8 Collectively, these findings underscore the importance of efficient regulation of innate immune/TRAF6 signaling within HSPCs by two del(5q) genes, TIFAB and miR-146a.
Given that TIFAB and miR-146a are co-deleted in ∼80% of del (5q) MDS, we examined whether there is an epistatic interaction between TIFAB and miR-146a by generating double Tifab- and miR-146a-deficient mice (Supplementary Figures 1a and b). Although TIFAB and miR-146a are located on the same chromosome in humans, the syntenic regions in mice are on separate chromosomes: miR-146a resides on chr 11, whereas Tifab is located on chr 13 in mice (Figure 1a). TRAF6 protein expression is increased in BM MNC from Tifab−/−; miR-146a−/− mice (dKO) as compared with single knockout BM cells, indicating that miR-146a and Tifab cooperate to suppress TRAF6 mRNA and protein expression in BM HSPCs2 (Figure 1b). Consistent with increased TRAF6 expression, dKO mice exhibit phosphorylation of IRAK1 and IRAK4 kinases, indicating activation of the TLR/innate immune pathway in BM HSPC of dKO mice (Figure 1b).
Figure 1.
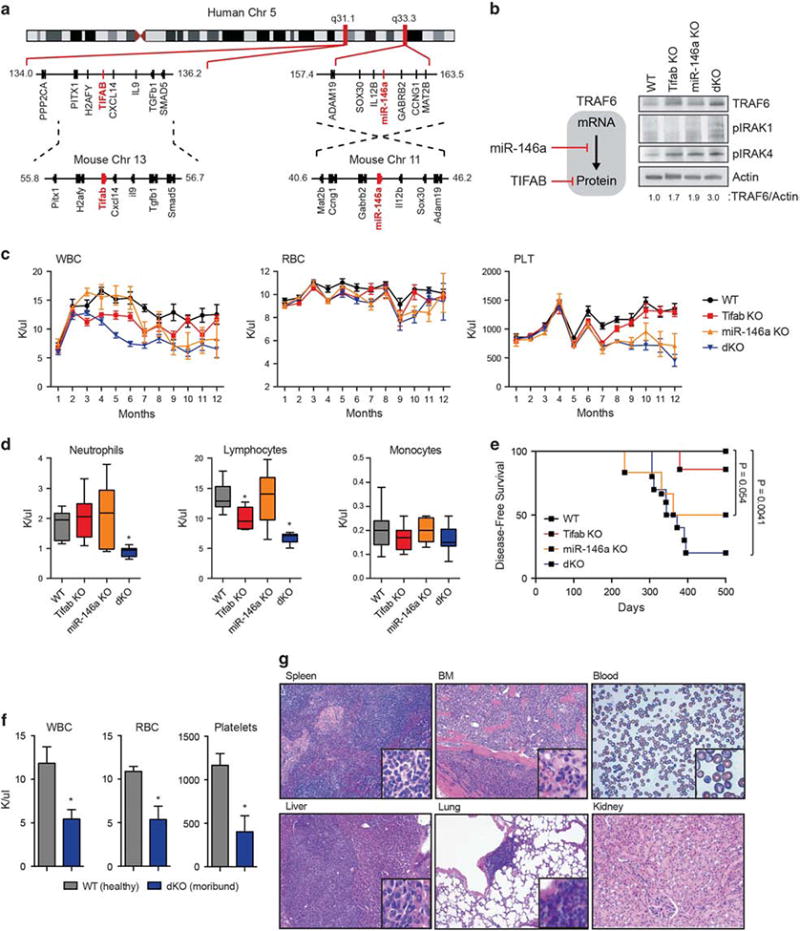
Combined deletion of Tifab and miR-146a, neighboring del(5q) MDS genes, results in a BM failure. (a) Schematic representation showing the genomic position of the TIFAB locus at chr 5q31.1 and miR-146a locus at chr 5q33.3. The syntenic mouse regions corresponding to human chr 5q31.1 and 5q33.3 are shown below. (b) Model of TRAF6 regulation by miR-146a and TIFAB as previously reported: miR-146a suppresses TRAF6 mRNA and translation.6,11 TIFAB suppresses TRAF6 protein stability.2 Immunoblotting of BM cells from mice transplanted with WT, Tifab−/−, miR-146a−/−, or Tifab−/−; miR-146a−/− (dKO) BM cells. Representative image from two independent transplantation experiments. Densitometric values for TRAF6 protein are shown below the image. (c) BM isolated from control (WT), Tifab−/−, miR-146a-/and Tifab−/−; miR-146a−/− (dKO) mice was transplanted into lethally-irradiated syngeneic recipient BoyJ mice. PB counts were performed at the indicated time points (months; n>8 per group) from two independent transplants. PLT, platelet; RBC, red blood cell; WBC, white blood cell;. (d) PB counts from mice transplanted with WT, Tifab−/−, miR-146a−/− and Tifab−/−; miR-146a−/− (dKO) at 6 months post transplant (n>8 per group). Error bars are mean ± s.e.m. values. (e) Kaplan–Meier survival curves for transplanted mice reconstituted with BM cells from WT (n=7), Tifab−/− (n=7), miR-146a−/− (n=6) and Tifab−/−; miR-146a−/− (dKO; n =10) mice. (f) PB counts from age-matched WT (n=5) or moribund dKO (n = 8) mice. PLT, platelet; RBC, red blood cell; WBC, white blood cell. (g) H&E-stained spleen, BM (femur), liver, lung and kidney, and Wright-Giemsa-stained PB from a representative moribund dKO mouse. *P<0.05; Student's t test.
To determine whether combined deletion of Tifab and miR-146a exaggerates the hematopoietic-specific defects observed in either Tifab- or miR-146a-deficient mice in vivo, BM cells from WT, Tifab−/−, miR-146a−/− and dKO mice were transplanted into lethally-irradiated syngeneic recipient mice. TIFAB expression is reduced by >75% in del(5q) MDS and AML,2 whereas expression of miR-146a in heterozygous mice is variable and in some cases at/above levels observed in WT cells;5 therefore, we examined homozygous-deficient mice as this approach better mimics the expression TIFAB and miR-146a in human del(5q) MDS. All recipient mice efficiently engrafted donor BM cells (Supplementary Figures 1c and d). Mice reconstituted with Tifab-deficient BM exhibited a decline in peripheral white blood cells, without significant changes in red blood cells (RBC) or platelets by 4 months. Deletion of miR-146a had only minor effects on blood counts in younger mice (<5 months post bone marrow transplantation (BMT)), but then developed a progressive leukopenia and thrombocytopenia in mice after ∼ 6 months post BMT (Figure 1c). In contrast, combined deletion of Tifab and miR-146a resulted in an accelerated leukopenia starting at 2 months after BMT, which is attributed to decreased peripheral neutrophils and lymphocytes (Figures 1c and d). At 6 months post BMT, dKO BM chimeric mice exhibit significantly decreased peripheral neutrophils (0.88 K/μl vs 1.9 K/μl; P<0.0001) and lymphocytes (6.7 K/μl vs 13.7 K/μl; P<0.0001) as compared with mice transplanted with either Tifab- or miR-146a-deficient BM cells, which persisted beyond 1 year (Figure 1d). RBC counts were not significantly different between any of the mice.
Three months post transplant and before overt disease, mice were evaluated for proportion of mature myeloid and lymphoid cells in the BM, spleen and PB. The proportions of mature myeloid and lymphoid cells in the BM and PB of dKO mice did not significantly differ among the single knockout and WT mice (Supplementary Figures 2a–e). In a subset of dKO mice, there was increased BM cellularity primarily due to expansion of mature neutrophils. The splenic composition of lymphocytes significantly differed in mice transplanted with either Tifab−/−, miR-146a−/− or dKO BM. In all of the Tifab- and miR-146a-deficient mice, the proportion of B cells (B220+) was significantly increased as compared with WT spleens (P <0.05; Supplementary Figures 2c and f). However, on morphological examination, dKO mice developed fused spleen follicles, lymphoid hyperplasia and dysplasia, and immature cells with condensed chromatin, morphological features that were absent or less severe in Tifab−/− or miR-146a−/− spleens (Supplementary Figure 3). Thus, combined deletion of Tifab and miR-146a exaggerates the hematopoietic phenotype as compared with deletion of either Tifab or miR-146a alone.
As previously reported,2,4 a minor subset of mice transplanted with Tifab-deficient BM and ∼ 50% of mice transplanted with miR-146a-deficient BM succumbed to a BMF-like disease. For mice transplanted with dKO BM, 80% of mice developed a fatal BMF-like disease with a more rapid onset (median survival of ∼ 350 days) (Figure 1e and Supplementary Figure 4a). In addition to the leukopenia (5.4 K/μl vs 11.9 K/μl; P=0.0003), moribund dKO mice presented with severe anemia (5.4 K/μl vs 10.9 K/μl; P<0.0001) and thrombocytopenia (404 K/μl vs 1167 K/μl; P<0.0001; Figure 1f). Morphological assessment revealed that moribund dKO mice displayed effacement of normal BM architecture, evidence of histiocytic neoplastic cells containing pale eosinophilic cytoplasm and marginated chromatin, and moderate anisocytosis and anisokaryosis (Figure 1g). Moreover, cellular infiltrates adjacent to blood vessels were observed in the lung of several moribund mice. Immunophenotypic analysis confirmed an expansion of myeloid cells (Cd11b+Gr1+) in the BM and PB (Supplementary Figures 4b and c). Moribund miR-146a-deficient mice display several of these features, but to a lesser degree, suggesting that combined deletion of Tifab and miR-146a reinforces the hematopoietic disorder as observed in single gene knockout mice. Notably, non-transplanted knockout mice infrequently developed hematologic disorders, suggesting that microenvironmental changes induced by lethal-irradiation and/or the hematopoietic stress of transplantation is a contributing factor to the hematologic phenotype associated with Tifab-and miR-146a-deficienct BM cells. Hematologic features resulting from deletion of Tifab and miR-146a are indicative of BM failure and consistent with some similarities to human MDS.
Previous reports indicate that deletion of Tifab results in a minor increase of HPSC (Lineage-Sca1+cKit+; LSK),2 while deletion of miR-146a results in a progressive decline in hematopoietic stem cell (HSC) (LSK SLAM+) and HSPC (LSK), particularly as the mice age.8 At 6 months post transplant, the BM LSK (P=0.014), and Lineage-cKit+ (LK; P= 0.0026) populations were modest, albeit significantly decreased in dKO-recipient mice (Supplementary Figure 5a). The proportion of long-term-HSC and overall composition of hematopoietic progenitor cells (HPC) was consistent between dKO- and Tifab−/−- or miR-146a−/−-recipient mice, suggesting that hematopoietic defect observed in dKO mice may be associated with aberrant progenitor frequency and/or function (Supplementary Figures 5b and c). To assess whether dKO HSPC affects hematopoietic progenitor differentiation in vitro, LK and LSK isolated from WT, Tifab−/−, miR-146a−/− or dKO mice were examined for progenitor colony formation in methylcellulose. Individual or combined deletion of Tifab and miR-146a resulted in increased colony formation by LSK, but not LK BM cells (P= 0.06; Supplementary Figure 6a). However, LSK (P =0.005) or LK (P= 0.003) cells from dKO mice formed significantly more granulocyte progenitor colonies (Supplementary Figures 6b and c), underscoring a functional cooperation between Tifab and miR-146a deficiency on HSPC function and myeloid progenitor differentiation.
To gain insight into the molecular nature and collaborative interplay between TIFAB and miR-146a deficiencies responsible for the exaggerated hematopoietic defect associated with MDS, we examined the gene regulatory networks in HSPC from mice transplanted with WT, Tifab−/−, miR-146a−/− and dKO BM. The LK BM fractions were analyzed using whole-genome RNA sequencing. Distinct and overlapping differentially expressed genes were identified in Tifab−/−, miR-146a−/− and dKO HSPC (Figure 2a, Supplementary Table 1), which can be categorized into 4 main groups: genes differentially expressed in Tifab-deficient LK, but not miR-146a−/− or dKO; genes differentially expressed in miR-146a-deficient LK, but not Tifab−/− or dKO; genes differentially expressed only in dKO; and gene differentially expressed in all 3 LK populations, but most striking in the dKO (Figures 2a and b). Pathway analysis performed using significantly differentially expressed genes (FC4twofold; P<0.05) in either Tifab−/−(n= 147), miR-146a−/− (n =323) or dKO (n= 216) revealed unique and overlapping gene signatures (Figure 2b). Enrichment of cAMP response element-binding protein regulation and interleukin-8 production was observed in dKO LK cells. miR-146a-deficient LK exhibited enrichment of innate immune response and cytokine gene signatures, while TLR signaling and lipid metabolism genes were enriched in Tifab-deficient LK (Figure 2b). Consistent with MDS biology, deletion of TIFAB and/or miR-146a results in innate immune pathway activation and dysregulated inflammation pathways.
Figure 2.
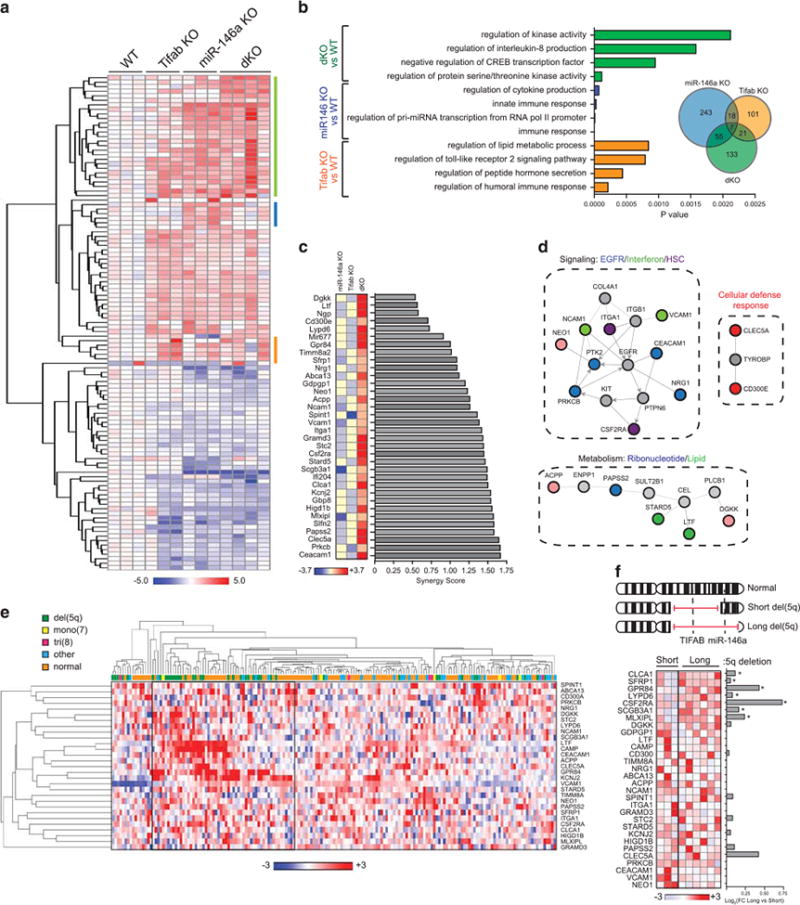
Differential expression and score of synergy genes in Tifab−/−;miR-146a−/− HSPC cells and co-regulation in human del(5q) MDS. (a) Heat map showing gene expression differences (fold-change >2.0; FDR <0.05) in LK isolated from 5-month-old mice transplanted with WT, Tifab−/−, miR-146a−/− and Tifab−/−; miR-146a−/− (dKO) BM cells (n=3 mice/group). The heat map shows log2 fold-changes as compared with WT. The color boxes represent genes predominantly expressed in dKO (green), miR-146a−/− (blue) or Tifab−/− (orange) cells. (b) Pathway analysis generated from differentially expressed genes in Tifab−/− vs WT (orange), miR-146a−/− vs WT (blue), and dKO vs WT (green) comparisons. Shown are the highest relevant enriched pathways generated by Toppgene.12 (c) Bar graphs ranking synergy scores calculated from genes in Tifab−/− vs WT, miR-146a−/− vs WT, and dKO vs WT comparisons. (d) Pathway and network analysis generated from synergy genes in dKO using Netwalker.13 Colored nodes represent synergy genes. Gray nodes indicate molecularly connected genes. (e) Unsupervised hierarchical clustering and heat map showing expression differences of the synergy genes from MDS CD34+ BM cells (n=183).10 The heat map was generated using normalized expression values. (f) Three patients examined by single-nucleotide polymorphism array have shorter telomeric breakpoints, which include deletion of TIFAB (5q31), but not miR-146a (5q33.3). Six patients have longer telomeric breakpoints, which include deletion of TIFAB and miR-146a. Heat map showing expression differences of the synergy genes from 9 MDS and AML patient BM mononuclear cells. The heat map was generated using Z-scores. The bar graph represents fold change (FC; log2) generated from M-values comparing expression of individual genes from patients with the long deletion versus the short deletion. *P <0.05; Student's t test.
Since TIFAB and miR-146 both regulate innate immune signaling via TRAF6, and as described herein, combined deletion of TIFAB and miR-146 results in an exaggerated hematopoietic phenotype in mice, we investigated whether the nature of the epistasis is additive or synergistic. Therefore, we next searched for genes regulated synergistically by Tifab and miR-146a at the genomic scale by applying a stepwise analysis. We first identified 216 differentially expressed genes between dKO and WT LK cells with a statistical cutoff at P<0.05 (FDR adjusted). A further subset of 35 annotated genes that responded synergistically (all upregulated) to the combined deletion of Tifab and miR-146a was determined using a synergy score (SC) as described in the ‘Methods’ section9 (SC < 1.6; Figure 2c, Supplementary Table 2). Intriguingly, the synergy genes encode proteins involved in epidermal growth factor signaling, interferon signaling and defense response, HSC function, and ribonucleotide and lipid metabolism (P <0.001; Figures 2c and d).
To gain insight into the relevance of the 35 synergy genes regulated by combined TIFAB and miR-146 deletion in MDS patients, we examined gene expression data from 183 MDS CD34+ BM cells.10 Unsupervised hierarchical clustering analysis (one-minus Pearson correlation) revealed that a subset of the synergy genes is overexpressed in MDS patients (Figure 2e). Notably, of the MDS patients with consistent overexpression of a subset of synergy genes, the majority represented patients with del(5q) (Figure 2e). The cytogenetic information for this MDS cohort does not provide 5q breakpoint data to distinguish patients with deletion of TIFAB (5q31) and miR-146a (5q33), or just TIFAB. In an independent cohort of MDS/AML patients (n=9), we simultaneously performed high-resolution DNA single-nucleotide polymorphism array analysis to precisely map the 5q breakpoints and microarray gene expression analysis on RNA isolated from BM MNCs. Three del(5q) MDS samples contained an interstitial deletion that included band 5q31 (TIFAB), but not band 5q33 (miR-146a), while six samples contained an interstitial deletion that encompassed 5q31 and 5q33 (TIFAB and miR-146a; Figure 2f, Supplementary Table 3). Forty percent (14/35; n = 7, P <0.05) of the synergy genes were overexpressed in del(5q) MDS samples when both TIFAB and miR-146a were deleted as compared with just deletion of TIFAB (Figure 2f).
It is widely accepted that the pathogenesis of del(5q) MDS results from reduced dosage and cooperation of numerous genes, and that the extent of the 5q deletion impacts disease severity and outcome.1 Although the contribution of individual genes to the pathogenesis of del(5q) MDS has been investigated, less is known about the epistatic interactions between neighboring deleted genes. Based on our integrative analysis, we report that combined hematopoietic-specific deletion of Tifab and miR-146a results in a rapid and severe cytopenia, progression to a fatal BM failure-like disease, and enrichment of gene regulatory networks associated with cell survival, immune response and metabolism. Epistatic interaction of TIFAB and miR-146a and modulation of synergy genes has common features in human and mouse hematopoietic diseases associated with MDS. As such, synergistic control of gene expression following deletion of epistatic haploinsufficient genes in del(5q) MDS may be an underlying mechanism of the diseased state, particularly in patients with del(5q) subtypes with longer deletions and worse outcomes. We anticipate the utility of the novel del(5q) MDS-like mouse model for preclinical studies and an opportunity for targeting gene regulatory networks.
Supplementary Material
Acknowledgments
This work was supported by Cincinnati Children's Hospital Research Foundation, American Society of Hematology (ASH), National Institute of Health (RO1HL111103) and Department of Defense grants to DTS. DTS is a Leukemia and Lymphoma Scholar. The umbilical cord CD34+ samples were received through the Normal Donor Repository in the Translational Core Laboratory at Cincinnati Children's Research Foundation, which is supported through the NIDDK Center's of Excellence in Experimental Hematology (P30DK090971). We thank the Mt. Auburn Ob-Gyn associates and delivery nursing staff at Christ Hospital (Cincinnati, OH) for collecting cord blood (CD34+) samples from normal deliveries. We thank Jeff Bailey and Victoria Summey for assistance with transplantations and xenotransplantations (Comprehensive Mouse and Cancer Core at CCHMC). We would also like to thank the pathology core at CCHMC for analysis of mouse tissues.
Footnotes
Conflict of Interest: The authors declare no conflict of interest.
Supplementary Information accompanies this paper on the Leukemia website (http://www.nature.com/leu)
References
- 1.Jerez A, Gondek LP, Jankowska AM, Makishima H, Przychodzen B, Tiu RV, et al. Topography, clinical, and genomic correlates of 5q myeloid malignancies revisited. J Clin Oncol. 2012;30:1343–1349. doi: 10.1200/JCO.2011.36.1824. [DOI] [PMC free article] [PubMed] [Google Scholar]
- 2.Varney ME, Niederkorn M, Konno H, Matsumura T, Gohda J, Yoshida N, et al. Loss of Tifab, a del(5q) MDS gene, alters hematopoiesis through derepression of Tolllike receptor-TRAF6 signaling. J Exp Med. 2015;212:1967–1985. doi: 10.1084/jem.20141898. [DOI] [PMC free article] [PubMed] [Google Scholar]
- 3.Stoddart A, Qian Z, Fernald AA, Bergerson RJ, Wang J, Karrison T, et al. Retroviral insertional mutagenesis identifies the del(5q) genes, CXXC5, TIFAB and ETF1, as well as the Wnt pathway, as potential targets in del(5q) myeloid neoplasms. Haematologica. 2016;101:e232–e236. doi: 10.3324/haematol.2015.139527. [DOI] [PMC free article] [PubMed] [Google Scholar]
- 4.Boldin MP, Taganov KD, Rao DS, Yang L, Zhao JL, Kalwani M, et al. miR-146a is a significant brake on autoimmunity, myeloproliferation, and cancer in mice. J Exp Med. 2011;208:1189–1201. doi: 10.1084/jem.20101823. [DOI] [PMC free article] [PubMed] [Google Scholar]
- 5.Fang J, Barker B, Bolanos L, Liu X, Jerez A, Makishima H, et al. Myeloid malignancies with chromosome 5q deletions acquire a dependency on an intrachromosomal NF-kappaB gene network. Cell Rep. 2014;8:1328–1338. doi: 10.1016/j.celrep.2014.07.062. [DOI] [PMC free article] [PubMed] [Google Scholar]
- 6.Starczynowski DT, Kuchenbauer F, Argiropoulos B, Sung S, Morin R, Muranyi A, et al. Identification of miR-145 and miR-146a as mediators of the 5q- syndrome phenotype. Nat Med. 2010;16:49–58. doi: 10.1038/nm.2054. [DOI] [PubMed] [Google Scholar]
- 7.Zhao JL, Rao DS, Boldin MP, Taganov KD, O'Connell RM, Baltimore D. NF-kappaB dysregulation in microRNA-146a-deficient mice drives the development of myeloid malignancies. Proc Natl Acad Sci USA. 2011;108:9184–9189. doi: 10.1073/pnas.1105398108. [DOI] [PMC free article] [PubMed] [Google Scholar]
- 8.Zhao JL, Rao DS, O'Connell RM, Garcia-Flores Y, Baltimore D. MicroRNA-146a acts as a guardian of the quality and longevity of hematopoietic stem cells in mice. eLife. 2013;2:e00537. doi: 10.7554/eLife.00537. [DOI] [PMC free article] [PubMed] [Google Scholar]
- 9.McMurray HR, Sampson ER, Compitello G, Kinsey C, Newman L, Smith B, et al. Synergistic response to oncogenic mutations defines gene class critical to cancer phenotype. Nature. 2008;453:1112–1116. doi: 10.1038/nature06973. [DOI] [PMC free article] [PubMed] [Google Scholar]
- 10.Pellagatti A, Cazzola M, Giagounidis A, Perry J, Malcovati L, Della Porta MG, et al. Deregulated gene expression pathways in myelodysplastic syndrome hemato-poietic stem cells. Leukemia. 2010;24:756–764. doi: 10.1038/leu.2010.31. [DOI] [PubMed] [Google Scholar]
- 11.Taganov KD, Boldin MP, Chang KJ, Baltimore D. NF-kappaB-dependent induction of microRNA miR-146, an inhibitor targeted to signaling proteins of innate immune responses. Proc Natl Acad Sci USA. 2006;103:12481–12486. doi: 10.1073/pnas.0605298103. [DOI] [PMC free article] [PubMed] [Google Scholar]
- 12.Chen J, Bardes EE, Aronow BJ, Jegga AG. ToppGene Suite for gene list enrichment analysis and candidate gene prioritization. Nucleic Acids Res. 2009;37:W305–W311. doi: 10.1093/nar/gkp427. [DOI] [PMC free article] [PubMed] [Google Scholar]
- 13.Komurov K, Dursun S, Erdin S, Ram PT. NetWalker: a contextual network analysis tool for functional genomics. BMC Genom. 2012;13:282. doi: 10.1186/1471-2164-13-282. [DOI] [PMC free article] [PubMed] [Google Scholar]
Associated Data
This section collects any data citations, data availability statements, or supplementary materials included in this article.