Summary
Self-motion triggers complementary visual and vestibular reflexes supporting image-stabilization and balance. Translation through space produces one global pattern of retinal image motion (optic flow), rotation another. We show that each subtype of direction-selective ganglion cell (DSGC) adjusts its direction preference topographically to align with specific translatory optic flow fields, creating a neural ensemble tuned for a specific direction of motion through space. Four cardinal translatory directions are represented, aligned with two axes of high adaptive relevance: the body and gravitational axes. One subtype maximizes its output when the mouse advances, others when it retreats, rises, or falls. ON-DSGCs and ON-OFF-DSGCs share the same spatial geometry but weight the four channels differently. Each subtype ensemble is also tuned for rotation. The relative activation of DSGC channels uniquely encodes every translation and rotation. Though retinal and vestibular systems both encode translatory and rotatory self-motion, their coordinate systems differ.
Introduction
Direction-selective retinal ganglion cells (DSGCs) encode visual motion. Earlier work has probed how they do so1–9. Here, we relate global patterns of direction preference to visual reafference during self-motion. When animals move, visual and vestibular feedback drive postural adjustments, image-stabilizing eye and head movements, and cerebellar learning10. Self‐motion can be decomposed into translatory and rotatory elements — movement along, or rotation about, an axis. The vestibular apparatus achieves this biomechanically. The relative activation of otolithic organs and semicircular canals uniquely encodes every translation or rotation11.
Movement through space also produces global patterns of retinal image motion called optic flow. Translation (Fig. 1a) induces optic flow that diverges from a point in extrapersonal space (‘direction of heading;’ asterisk), follows lines of longitude in global visual space, and converges at a diametrically opposed singularity. Rotational optic flow follows lines of latitude, circulating around a point in visual space (Fig. 1b). These motion trajectories are imaged on the hemispheric retinal surface (Figs. 1c,d). Rotatory and translatory optic flows evoke different behaviors, implying divergent encoding mechanisms and output circuits.
Figure 1. Directional preferences of ON-OFF-DSGCs are topographically dependent.
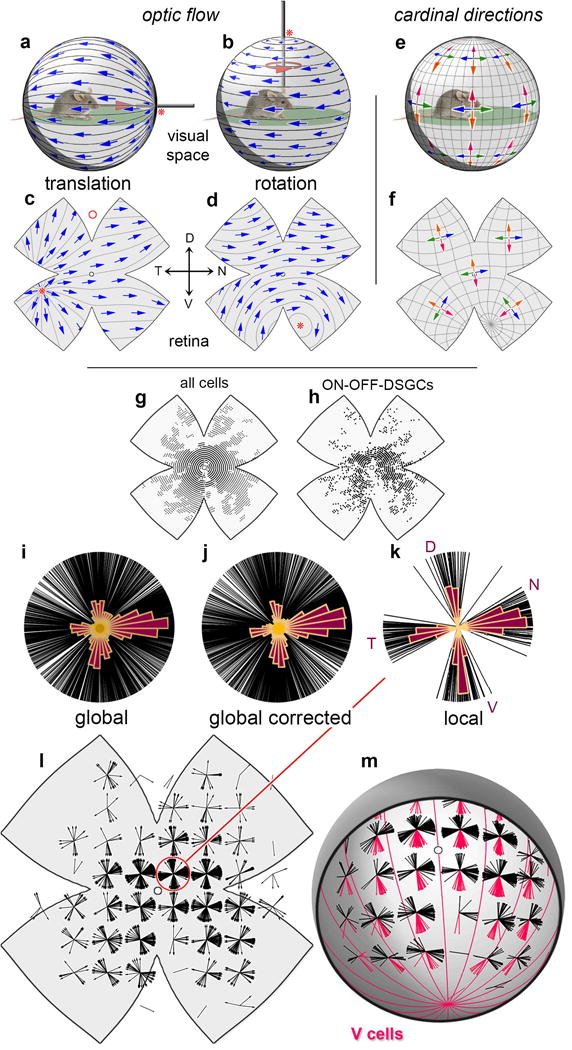
a-d, Optic flow induced by animal’s translation (a,c) or rotation (b,d) (pink arrows) and illustrated as apparent motions (blue arrows) in the visual space around the animal (a,b) and projected onto the retina, after flattening (c,d). Asterisks: flow fields’ center of expansion (a,c) or rotation (b,d). Red circle in (c): DSGC receptive-field size. e,f, Inferred geometry of ON‐OFF‐DS preferences assuming cardinal directions remain orthogonal everywhere. One pair of types (orange, red) follows longitudinal (translatory-flow) geometry, the other (blue, green) latitudinal (rotatory-flow) geometry. g,h. Location of calcium-imaged cells (g) and imaged ON‐OFF-DSGCs (h). i-k, Polar plots of DS preference among imaged ON‐OFF-DSGCs, one line per cell. Polar histograms are overlaid. Cells pooled from whole retina (i, j) or only from the small circled central region (k). l, Topographic dependence of ON-OFF-DSGC local directional preferences, displayed as polar plots on a standardized flattened retinal map. m, Same as (l) but in reconstructed 3D view, corrected for histological distortions. Cells preferring ventral retinal movement (red lobes; ‘V-cell’ subtype) prefer motion toward a ventral singularity (center of contraction) and align with optic flow produced by downward translation (red meridians in [m]; cf. pink arrows in [e,f]).
DSGCs encode optic flow locally within small receptive fields12 (~1% of the monocular field; Fig. 1c, red circle). Most belong to two canonical classes — ON-DSGCs and ON-OFF-DSGCs — differing in gene expression, structure, projections, functional properties and roles1.
ON-OFF-DSGCs innervate retinotopic targets mediating gaze shifts and conscious motion perception13–15. They comprise four subtypes, each preferring one of four cardinal directions16–18. The polar distribution of directional preferences among ON‐OFF‐DSGCs appears cruciform, with four lobes separated by 90° (Fig. 1k).
How do the directional preferences of ON‐OFF‐DSGCs relate to the spherical geometry of optic flow? If the cruciform pattern is universal, as widely assumed, a surprising corollary follows: one pair of subtypes must prefer motion along meridians as in translatory optic flow (Fig. 1a), while the other pair follows orthogonal lines of latitude, like rotatory flow (Fig. 1b). The dorsal/ventral pair matches translatory flow in Fig. 1e,f, but could match rotatory flow instead, provided the nasal/temporal pair also switches, to translatory flow.
By intensive global mapping of DS, we refute this model. Instead, we find that all four ON‐OFF-DSGC subtypes align their preferences everywhere with one of four cardinal translatory optic flow fields, thereby encoding self-motion along two specific axes — the gravitational and body axes. Each subtype forms a panoramic, binocular ensemble best activated when the animal rises, falls, advances or retreats. We expected the other DSGC class — ON-DSGCs — would exhibit a distinct geometry (Supplementary Note 1). Surprisingly, they proved to adhere to the same translatory optic-flow geometry as ON-OFF-DSGCs, and to comprise four subtypes, not three18,19. Though optimally tuned for translatory flow, DSGC ensembles also respond differentially to rotatory flow. Any translation or rotation is uniquely encoded in the relative activation of these channels, permitting the brain to differentiate translation from rotation by simple global summation or subtraction of channels.
Results
Mapping global direction preferences of DSGCs
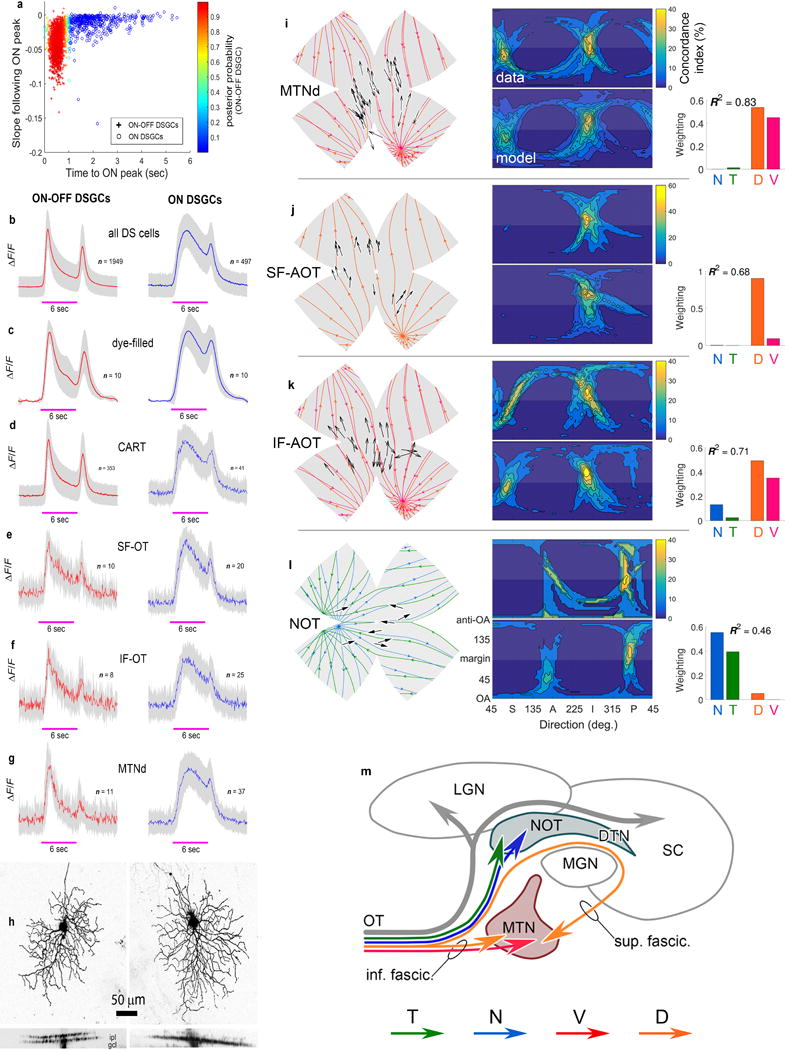
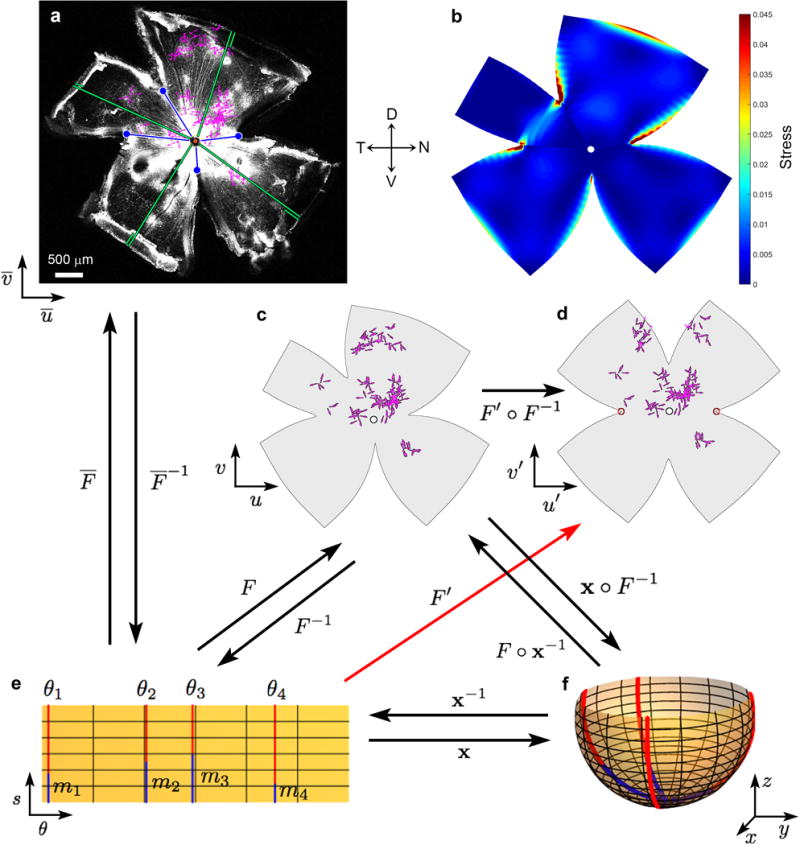
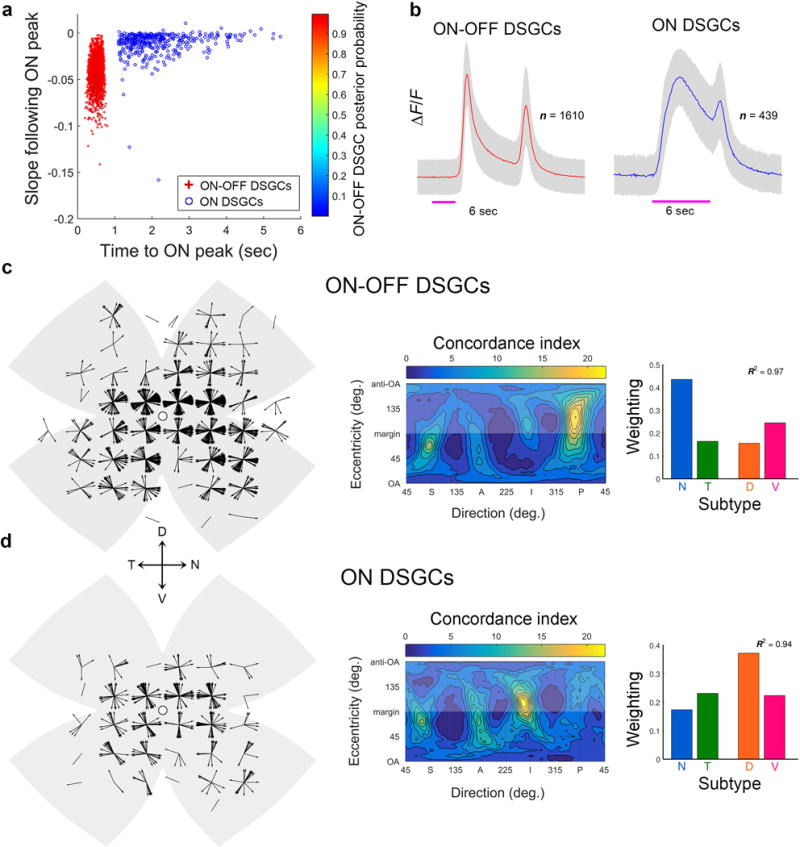
We mapped the direction preferences of >2400 DSGCs at known locations in flattened mouse retinas in vitro (from >33,900 neurons; 26 retinas; Fig. 1g,h). DSGCs were identified from Ca2+ responses to moving stimuli, imaged by two‐photon microscopy of virally expressed GCaMP6f (Methods; Extended Data Fig. 1a–d). All were ganglion cells (immunopositive for RNA-binding protein with multiple splicing20; n = 706; Extended Data Fig. 2a–f). ON‐OFF‐DSGCs were discriminated from ON-DSGCs by unsupervised clustering, exploiting their faster, more transient ON responses (Extended Data Fig. 3a–h). ON-OFF-DSGCs greatly outnumbered ON-DSGCs (ON-OFF: n=1949; 6.6 ± 2.1% of imaged cells per retina vs. ON: n=497; 1.8 ± 0.9%; mean ± s.d., Supplementary Note 2). No OFF-DSGCs were encountered. Each cell’s location was mapped to spherical coordinates, permitting comparisons across retinas using standardized displays as projected or flattened spherical surfaces (Extended Data Fig. 4, Supplementary Equations).
ON-OFF-DSGCs align direction preferences with optic flow produced by translation along two cardinal axes
Like all imaged cells, ON-OFF-DSGCs were widely distributed but concentrated centrally due to preferential viral infection (Fig. 1g,h). Their DS preferences, pooled across retinas and displayed in polar format, were markedly disordered (Fig. 1i). Four lobes marking the cardinal directions were apparent, but broad and blurred, without expected gaps. Correcting errors in retinal orientation (Fig. 1j) did not resolve this (Extended Data Fig. 5e). The disorder derived instead mainly from systematic topographic variation in DS preferences. Four distinct lobes emerged when sampling only central retina (Fig. 1k), but elsewhere the lobes tilted relative to cardinal retinal directions and one another (Fig. 1l). Such topographic dependence is not an artefact of retinal flattening; it is even more apparent when viewed in reconstructed three-dimensional form (Fig. 1m). Thus, plots of DS preference are not ubiquitously cruciform (Fig. 1e,f).
Consider the ON-OFF-DSGC subtype we call “V-cells,” after their preference for ventral motion on the retina, or of the mouse (‘upward’ motion in the visual field; red lobes in Fig. 1m). V-cells preferred motion toward a center of contraction in the ventral retina, and everywhere paralleled a ventrally directed translatory optic flow field (Fig. 1m, red meridians). We extended this analysis by targeted patch recording of GFP-tagged V-cells in Hb9-GFP mice21. They preferred motion toward a ventral singularity (Fig. 2a, black arrows; Extended Data Fig. 2l-r), just as imaged V‐cells did (Fig. 1m), aligned everywhere with the same translatory optic flow (Figs. 1m and 2a, red meridians). Dendritic-field asymmetries of V-cells, which correlate with preferred direction21 (Extended Data Fig. 2q), also aligned with this flow field (Figs. 2a, gold arrowheads). Thus, as an ensemble, V‐cells respond best to a specific translatory optic flow, produced by roughly downward motion.
Figure 2. Genetically defined ON-OFF-DSGC subtypes align DS preferences with translatory optic flow.
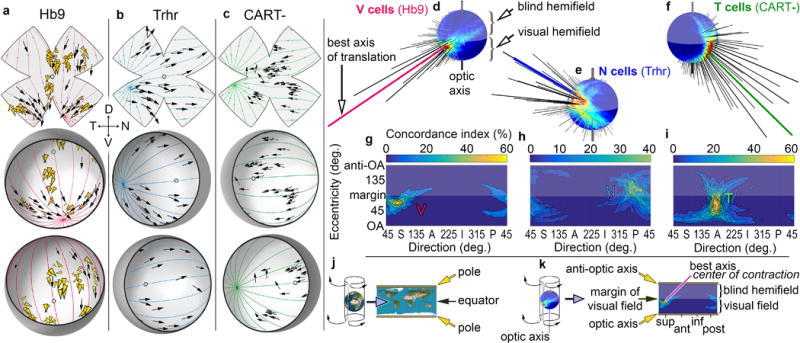
a-c, DS preferences of molecularly defined ON-OFF-DSGC subtypes, assessed electrophysiologically (black arrows) and plotted on standard flattened (above) and reconstructed hemispheric retinas viewed from two perspectives (below). a, V-cells, preferring ventral motion, targeted in Hb9-GFP mice. Gold arrowheads indicate orientations of dendritic asymmetry. b, N‐cells, preferring nasal motion, targeted in Trhr-GFP mice. c, T-cells, preferring temporal motion, identified by immunonegativity for CART. Colored lines in (a–c) indicate best-fitting translatory optic flow. d–k, Quantitative assessment and cartographic representation of best translatory axes for DSGC ensembles. d. Concordance index (goodness of fit) as a function of axis of translation for recorded Hb9 V-cells, plotted as a spherical flow-tuning map. Optic axis (projection of optic disk into central visual field) points downward in this view. Hotspot and longest spike (red) point to visual-field location of the center of contraction of the translatory flow field best aligned with the direction preferences of sampled cells. g, Cartographically flattened (plate carré) projection of the flow-tuning plot in (d). The spherical (d) and flattened plots (g) both exhibit the same hot spot near the superior (S) edge of the visual field. Equivalent plots shown for N-cells (e,h; e is rotated 90° to display hotspot) and T-cells (f,i), with optimal optic flow either diverging from (N-cells) or converging at a singularity in the anterior visual field. j-k, Schematic explication of cartographic flattening of earth (j) or spherical translatory tuning plots (k) by plate carré projection.
Other subtypes of ON-OFF-DSGCs also adhered to translatory optic-flow geometry. In Trhr‐GFP mice15, we targeted “N-cells,” preferring nasal retinal motion, for recordings. N‐cells preferred motion away from a center of expansion in temporal retina (Fig. 2b), following a distinct translatory flow field (blue meridians). To assess a third subtype, “T-cells,” preferring temporal retinal motion (Fig. 2c), we analyzed imaged ON‐OFF-DSGCs that were immunonegative for CART (Cocaine and Amphetamine Regulated Transcript)22,23. T-cell preferences too were aligned with a translatory optic flow field (green meridians), here with a center of contraction in the temporal retina (Fig. 2c).
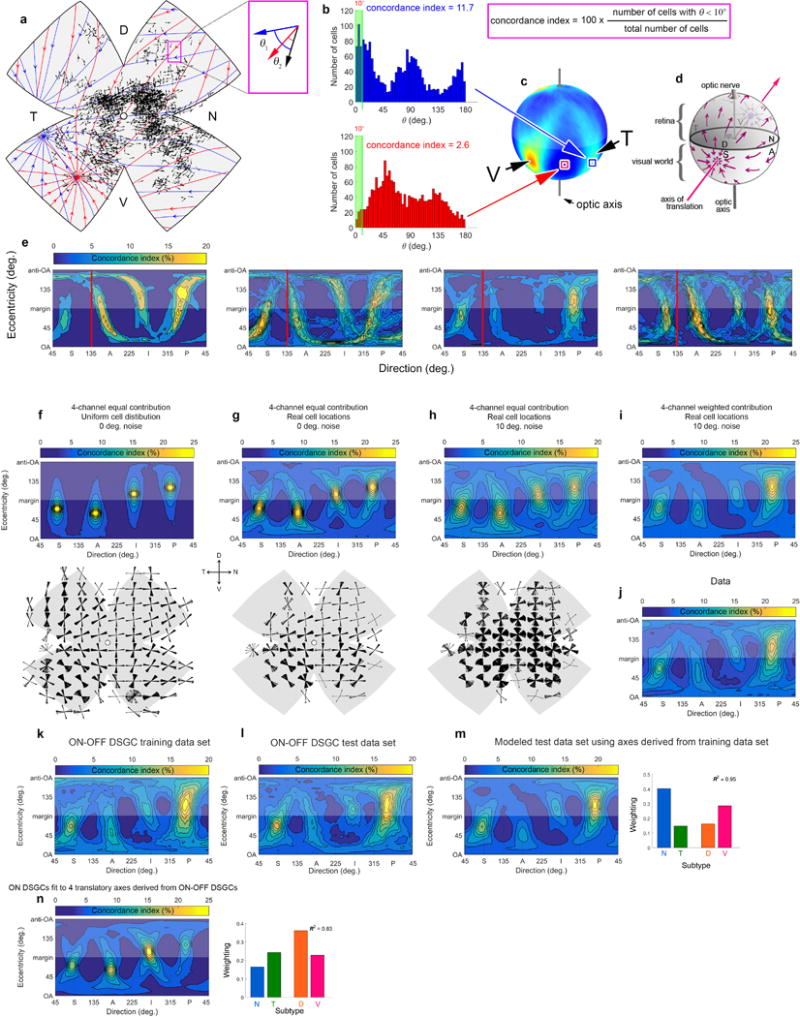
To quantify how well the DS preferences of a cell sample align with any single optic flow field, we devised a concordance index — the percentage of cells preferring directions within 10° of local flow. Repeating such template-matching for many possible translatory axes (n = 2701; 5° resolution), we generated a spherical tuning plot, displaying concordance as a function of the axis of translation. Hotspots show directions of translation inducing flow best aligned with observed DS preferences and thus driving maximal net output of this neuronal ensemble (Extended data Fig. 5a-d; Methods).
Fig. 2d shows such a translatory flow-tuning plot for patch-recorded Hb9 V-cells. Longer spikes and warmer map colors indicate better concordance and point to a location in extrapersonal space, the center of flow convergence. To facilitate comparisons, we cartographically flattened these plots (Fig. 2j,k). The flattened plot for V-cells (Fig. 2g) exhibits one hotspot at the visual coordinates of the optimal center of contraction. So do the other two molecularly defined ON‐OFF subtypes (Trhr N-cells; CART-negative T‐cells; Fig. 2b,c,e,f,h,i). Each subtype thus has a single best translation. The N- and T‐cell hotspots are separated by ~180° in polar direction (abscissa), suggesting they share a common axis, while the V-cell hotspot (Fig. 2g) is offset 90°, indicating preference for translation along an orthogonal axis (Supplementary Note 3).
The flow-tuning plot for all imaged ON-OFF-DSGCs featured four prominent hotspots separated by ~90° around the margin of the visual field or retina (Fig. 3a-c). Three of them correspond to V-, N-, and T-cell hotspots (Fig. 2d-f), the last evidently to D-cells, preferring dorsal retinal motion. The best axes of N- and T-cells are effectively aligned, as are those for D- and V-cells (Figure 3b). Thus ON-OFF-DSGCs comprise two pairs of subtypes, each pair preferring translation along the same axis, but in opposite directions.
Figure 3. Direction preferences of ON-OFF-DSGCs align globally with two axes of translatory optic flow.
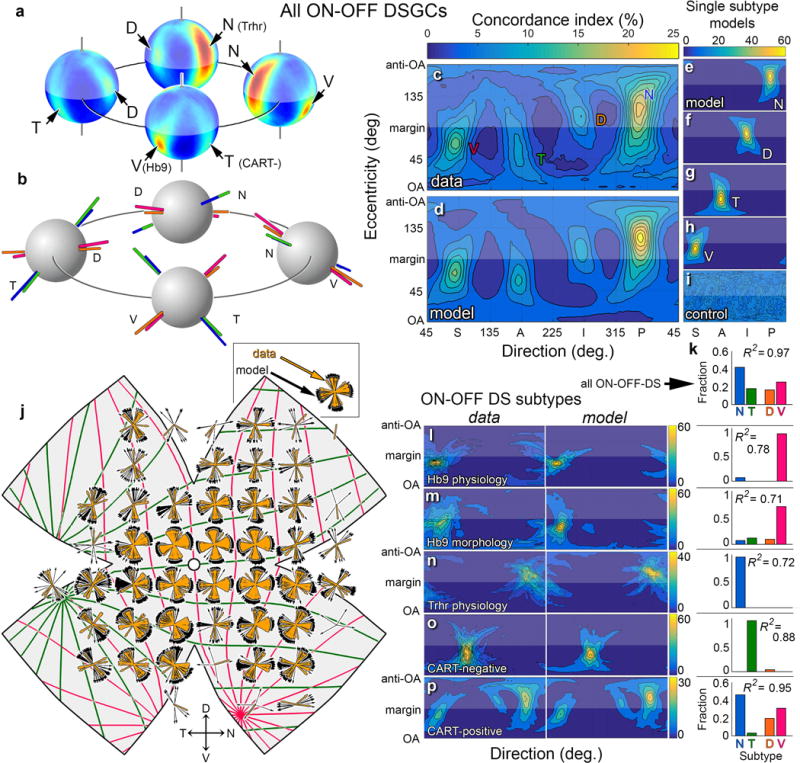
a, Spherical translatory-flow tuning plot for all ON-OFF-DSGCs, from four perspectives. Four hotspots are apparent, one per subtype (cf. Fig. 2d-f). b, Best translatory axes are aligned for D- and V-cells (orange; red), and for N- and T-cells (blue; green). c, Flattened version of translatory-flow-tuning plot in (a) (cf. Figs. 2g–k) is recapitulated by a model (d–h) comprising four subtype ensembles (e–h), weighted as in (k). i, Control flow-tuning map (randomized DS preferences). See Supplementary Note 3 for clarification. j, Local polar plots of DS preference for modeled cells (black) recapitulate the same topographic variations for imaged cells (gold). Colored meridians plot the two best-fitting translatory optic flows. l–o, Left column: flattened flow-tuning maps for effectively pure single-subtype samples. l, m, V-cells (Hb9-GFP); n, N-cells (Trhr-GFP); o, T-cells (CART-immunonegative). p, Same, but for all subtypes but T-cells using CART-immunopositivity. Best-fitting models (right column of plots) reproduce the actual plots; optimal weighting factors (bar plots) confirm subtype purity.
How well does this geometric description predict the DS preferences of DSGCs? We modeled four ON-OFF-DSGC channels adhering to the inferred translatory-flow-matching geometry. Each channel comprised modeled cells with locations matched to imaged DSGCs but with preferences aligned exactly with one of the four cardinal translatory flow fields. Angular jitter (~10°) was added to mimic biological and experimental variability. As expected, flow-tuning plots for single modeled channels (Fig. 3e-h) exhibited one hotspot (i.e., best axis; cf. Fig. 2g-i). The ~90° intervals between hotspots reflect the orthogonality of the two cardinal axes. Randomizing modeled preferences yielded a plot of uniformly mediocre concordance (Fig. 3i). We differentially weighted each channel to reproduce its apparent abundance in our sample (Extended data Fig. 5f-j; Methods) and summed them. The flow-tuning plot for the best-fitting model (Fig. 3d) was strikingly similar to that for the real data (Fig. 3c; R2 = 0.97). The fit was optimal when the relative abundance of subtypes was N > V > D or T (Fig. 3k). Local polar plots of DS preference for modeled cells (Fig. 3j; black) faithfully reproduced those for real cells (gold).
The model also recapitulated the behavior of other subsets of ON-OFF-DSGCs (Hb9; Trhr; CART–negative or –positive; Fig. 3l–p; see meridians in Fig. 2a–c). Weighting coefficients (Fig. 3l–p) provide estimates of relative abundances of subtypes in each sample; three molecularly defined samples effectively comprised single subtypes (Fig. 3l–o).
ON-DSGC preferences are aligned with the same translatory optic-flow fields
ON-DSGCs ostensibly comprise three subtypes preferring directions ~120° apart18,19, implying a global architecture distinct from that of ON-OFF-DSGCs. We suspected single ON-DSGC ensembles might prefer rotatory optic flow because they innervate the accessory optic system (AOS), which encodes rotatory slip and drives optokinetic image-stabilization24,25. Surprisingly, ON-DSGCs proved virtually identical in global architecture to ON-OFF-DSGCs (Fig. 4). They, too, comprised four subtypes (N-, T-, D-, and V-type ON-DSGCs). Each subtype aligned its DS preferences everywhere with essentially the same translatory flow field as its ON-OFF-DSGC counterpart. As before, four lobes ~90° apart were discernable in the polar plots of all ON‐DSGCs (Fig. 4b) and became more distinct when the central retina was selectively sampled (Fig. 4c).
Figure 4. ON-DSGCs unexpectedly match global geometry of ON-OFF-DSGCs: Four channels; four cardinal translatory directions.
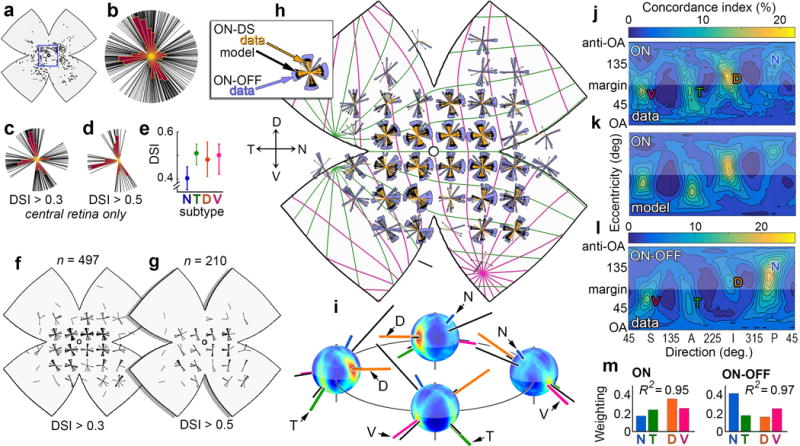
Locations (a) and DS preferences (b-d) of imaged ON-DSGCs. b, all cells; c,d, central retina (square in a). Four subtypes (lobes) are apparent in the central retina (c) but N-cells are less well-tuned for direction (e), so N-cell lobe vanishes under a more stringent tuning criterion (d,f,g). h, Topography of DS preference among ON-DSGCs (gold) resembles that of ON-OFF-DSGCs (purple) and of modeled ON-DSGCs (black) aligned with optimal orthogonal translatory optic flow fields (colored meridians). i, Spherical flow-tuning plot for all ON-DSGCs; four perspectives. Best axes for the four subtypes (colored) form two co-linear pairs defining two perpendicular cardinal translatory axes closely matching those of ON-OFF-DSGCs (black). j-m, Flow tuning plot for all ON-DSGCs (j) reveals four channels well described by the model (k) and closely resembling the equivalent plot for imaged ON-OFF-DSGCs (l) (from Fig. 3c) except for the relative weighting of channels (m).
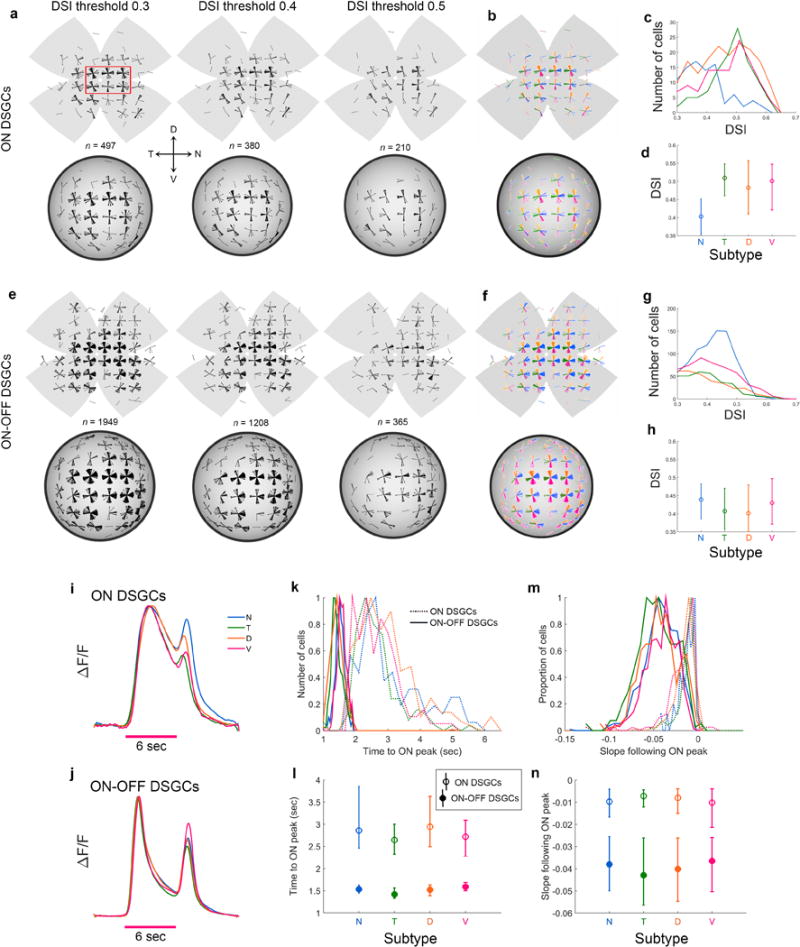
The unexpected similarity between ON- and ON-OFF-DSGCs is not an artefact of misidentification (Supplementary Discussion; Extended Data Figs. 1e-l, 3h, 6, and 7i-n). Why, then, do we find four ON-DSGC subtypes instead of three? ON-DSGC N-cells were less common (Fig. 4b,c) and less well-tuned than other ON-DSGC subtypes (Fig. 4e). A stringent direction-selectivity-index (DSI) criterion excluded virtually all of them, resulting in a three-lobed polar plot reminiscent of the classic one (Supplementary Note 4).
Like ON-OFF-DGSCs, ON-DSGCs aligned their preferred directions with optic flow produced by translation along one of two mutually orthogonal axes. Each is served by a pair of subtypes, generating paired hotspots at diametrically opposed global locations (Fig. 4i) or separated by 180° in flattened maps (Fig. 4j). Cardinal translatory axes were virtually identical for ON- and ON-OFF-DGSCs (Fig. 4i).
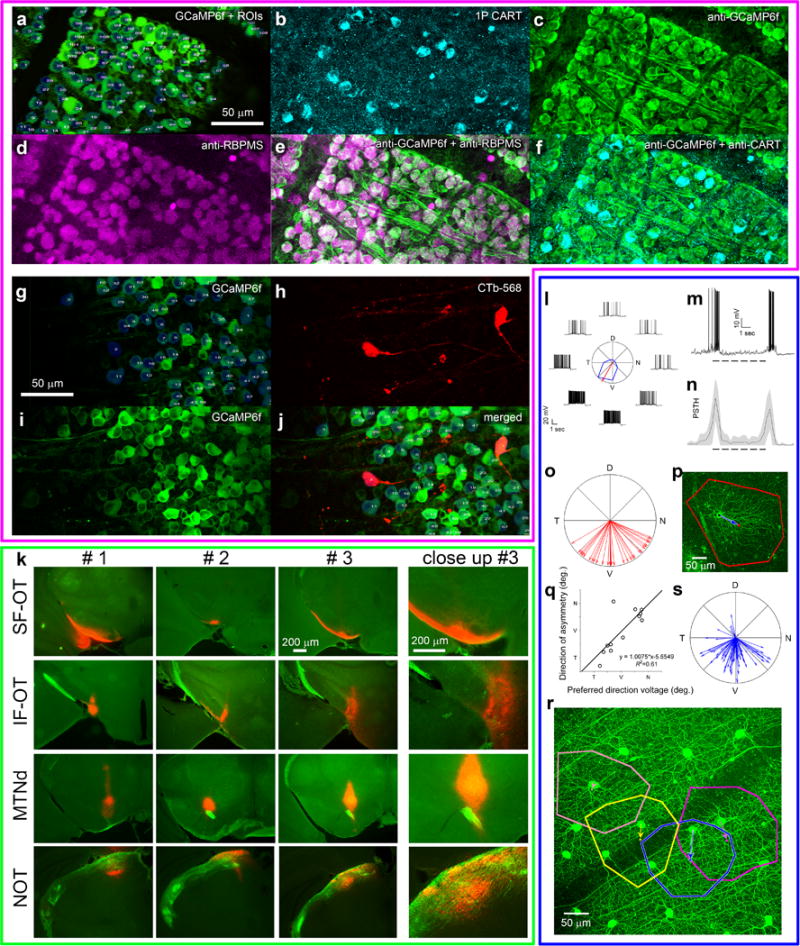
An adaptation of the model developed for ON-OFF-DSGCs faithfully recapitulated the flow‐tuning plot for ON-DSGCs (Figs. 4j,k; R2=0.95) and topographic variations in local DS preference (Figs. 4h). Real and modeled ON-DSGCs consistently matched ON-OFF-DSGCs in DS preference (Fig. 4h). However, the weighting of individual subtypes differed (Fig. 4m); D‐cells were the most abundant ON-DSGC subtype. Retrograde tracing revealed that ON-DSGC subtypes project differentially to components of the AOS (Extended Data Fig. 2g-k, Extended Data Fig. 3i-m).
DS subtypes panoramically encode optic flow induced by translation along the body and gravitational axes
From resting eye and head positions, we determined the orientation of these cardinal translatory axes of DSGCs relative to the visual environment (Methods). The N/T-cell axis approximated the anteroposterior (longitudinal body) axis, whereas the D/V-cell axis corresponded closely to the gravitational axis (Fig. 5a). Because N-cells, as an ensemble, respond best to forward translation along the body axis (ambulation), it is appropriate to call them “advance cells.” By extension, T-, V-, and D-cells are “retreat”, “fall”, and “rise” cells. The cardinal translatory axes are virtually identical for the two eyes (Fig. 5b), so members of one subtype prefer the same global flow regardless of their location in either retina. Together, they form a binocular, near‐panoramic cell array responding best to a specific translatory optic flow field and thus to self-motion in a cardinal direction (Fig. 5c,d).
Figure 5. Global geometry of retinal DS: ensemble coding of translatory and rotatory self-motion.
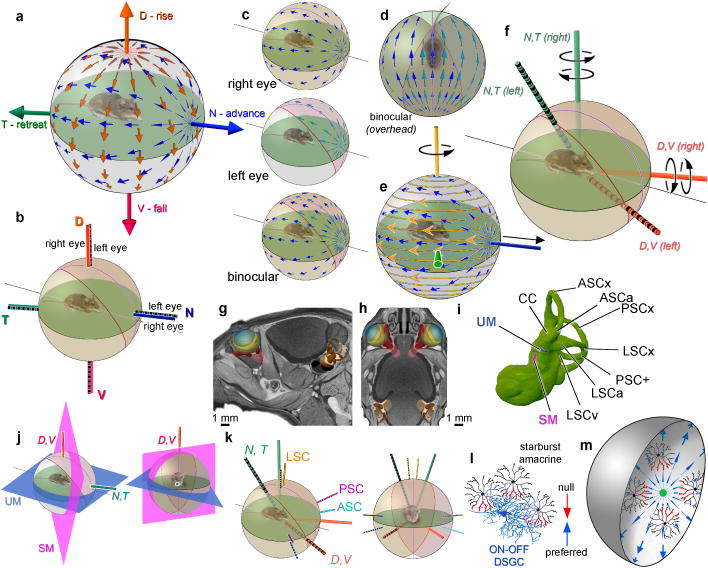
a, Orientation of best translatory axes in extrapersonal space, roughly midaxial and gravitational. b, Orientation of best translatory axes is identical for both eyes; thus a single translatory optic flow optimally activates the N-cell ensemble in both the right and left eyes (c,d). e, Geometric basis of sensitivity of DS ensembles to rotatory optic flow. In central retina, “advance” or N-cells (blue arrows) align their preferences with optic flow (gold lines and arrowheads) produced by rotation around a vertical axis (gold) orthogonal to their best translatory axis (blue). f, Best rotatory axes of N- and T-cells (green) and V- and D-cells (orange) in the two eyes; left-eye axes striped. g–i, MicroCT reconstruction of vestibular system in context from side (g), above (h), or in isolation (i). See Supplementary Note 7 for abbreviations. j, Relationship of cardinal DSGC translatory axes to otolithic planes. k, Relationship of best rotatory axes of DSGCs (thick) to those of semicircular canals (thin); axes for left eye and labyrinth are striped. l, Asymmetric starburst amacrine cell wiring underlying retinal DS. m, Current findings imply wiring asymmetries for a given DS subtype (blue) vary topographically and are oriented toward or away from a singularity.
Retinal DSGCs also encode rotatory optic flow
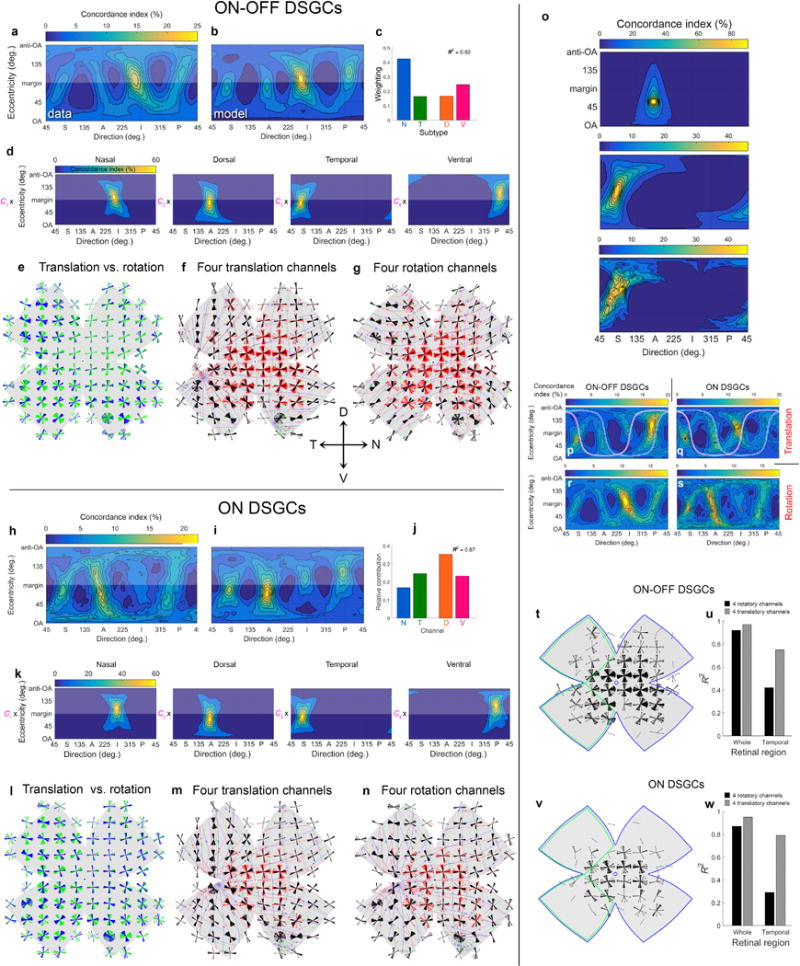
It is surprising that ON-DSGCs adhere to translatory optic-flow geometry because they supply directional information to the AOS and flocculus, which encode rotatory flow25. However, an ensemble aligned with translatory optic flow (Fig. 5e, blue) will also respond differentially to rotatory optic flow (Fig. 5e-f; Extended Data Fig. 8o-s; Supplementary Note 5). Might DSGC ensembles actually adhere to a rotatory flow geometry and, only secondarily, exhibit tuning for translation? Apparently not. The translatory model significantly outperformed the best rotatory one for every sample tested, including all imaged cells ON-OFF-DSGCs (R2 = 0.97 vs. 0.92) and ON-DSGCs (R2 = 0.95 vs. 0.87) (Supplementary Note 6; Extended Data Fig. 8a-n).
The brain can infer self-motion by comparing DS channels
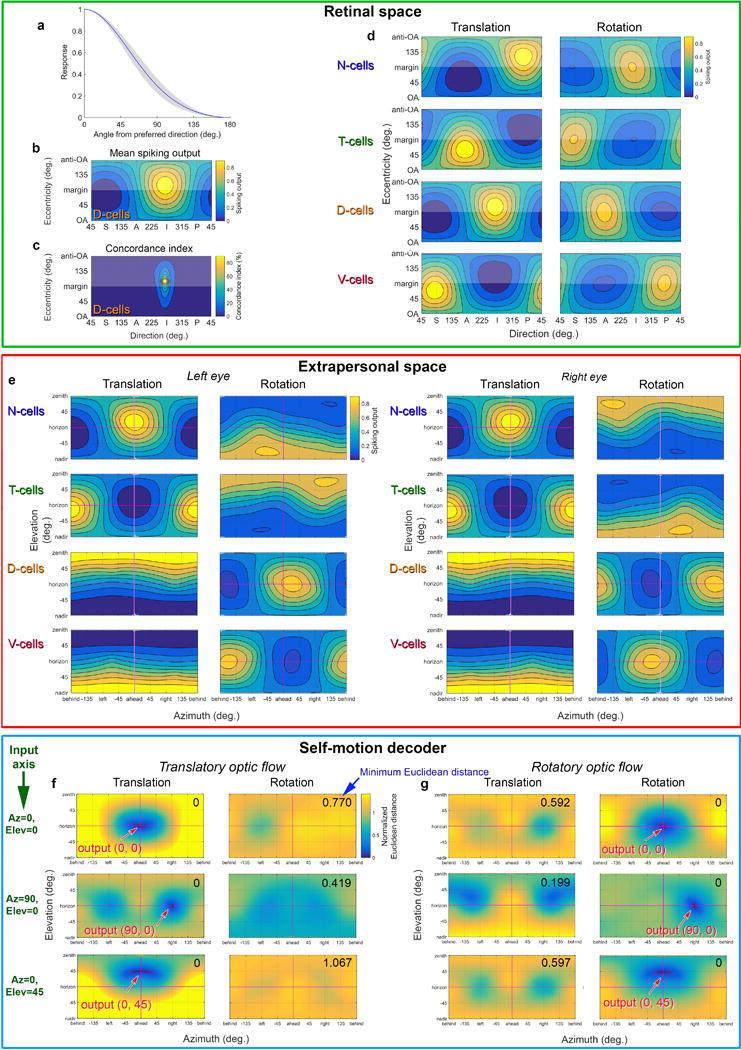
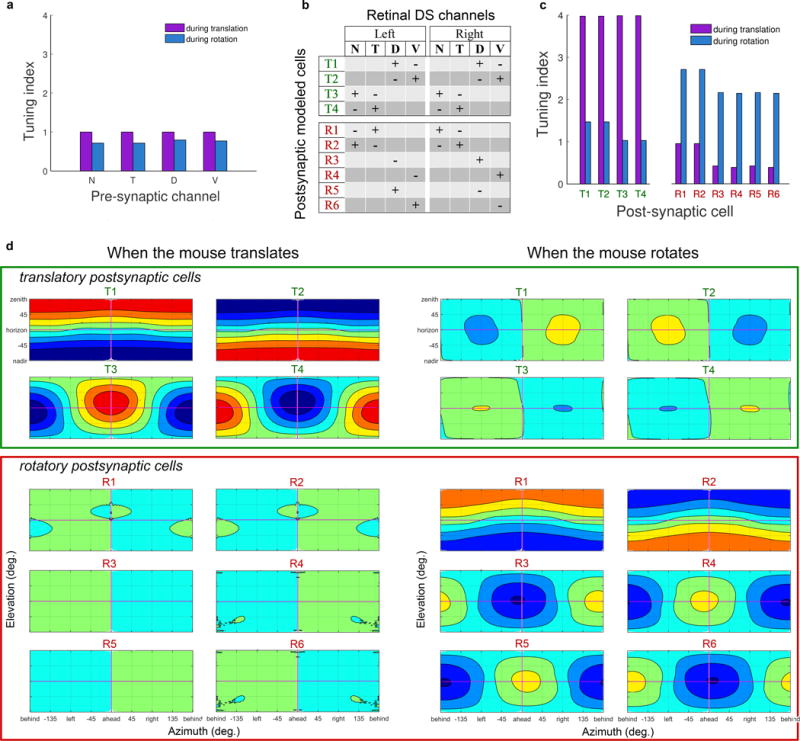
Thus, a single DSGC ensemble’s pooled output provides ambiguous information about self-motion. However, the brain could distinguish translation from rotation by comparing the relative activation of DS-subtype ensembles in the two eyes. For example, forward translation activates the same subtype (N-cells) in both eyes, whereas leftward rotation activates opposing subtypes (right eye: N; left: T). More generally, every possible translatory or rotatory optic flow produces a unique pattern of activation across the eight DS channels (2 axes X 2 directions X 2 eyes; Extended Data Fig. 9a-e). Indeed, a simple decoder using only relative activation of channels can distinguish translation from rotation and infer the motion axis (Extended Data Fig. 9f,g). Similarly, modeled postsynaptic cells differentially tuned for rotation or translation were easily constructed by summing or subtracting specific subtype signals from the two eyes (Extended Data Fig. 10).
Relationship between visual and vestibular channels
We have shown how retinal DS channels decompose reafferent visual motion signals into translatory (otolith-like) and rotatory (canal-like) components. Tomographic reconstruction revealed that cardinal vestibular cardinal axes and planes lie near, but do not precisely match, their DSGC analogs, (Fig. 5g-k; Supplementary Methods; Supplementary Notes 7, 8).
Discussion
All canonical DSGCs organize their directional preferences around the geometry of optic flow produced by translatory self-motion along two axes of high behavioral relevance: the body axis and the gravitational axis. They comprise 16 channels altogether: four cardinal directions of translation encoded per eye x 2 eyes x 2 DSGC classes (ON and ON-OFF). Subtype ensembles also respond differentially to rotatory optic flow. Any arbitrary translation or rotation will activate these 16 channels in a unique pattern the brain presumably decomposes into translatory and rotatory components. A table summarizing the properties of DSGC subtypes, their preferred translations and rotations, and their relation to previously reported DSGC subtypes and reporter mice is provided (Supplementary Table 1).
Eye movements in freely moving rodents appear driven largely by the vestibulo-ocular reflex (VOR)26 and optokinetic nystagmus (OKN), which compensate for head movements to stabilize the retinal image. The alignment between visual and vestibular axes, imperfect even at rest (Fig. 5j,k), would be further degraded by such deviations of the eye. The brain presumably compensates when coupling these two reafferent streams to common motor outputs. On the other hand, because VOR and OKN are image-stabilizing eye movements, they defend the alignment between DSGC cardinal translatory axes and the gravitational and body axes when the head rotates26. Gaze shifts transiently reorient the cardinal translatory directions in extrapersonal space, but eye and head typically return promptly to primary position26, reestablishing the alignment of cardinal visual directions with gravitational and body axes.
The matching of DS geometry to translatory optic flow may reflect the earlier evolutionary origins of translation-sensitive as compared to rotation-sensitive vestibular organs27. Retinotopic information from DS ensembles is preserved in mappings to the colliculus and geniculocortical system13, permitting higher-order computations based on retinal motion.
Anatomical asymmetries of starburst amacrine-cell inhibition generate direction preference in DSGCs8. Our data imply that these asymmetries are the same for ON- and ON-OFF-DSGCs, and are organized around two retinal singularities, corresponding to the centers of expansion or contraction of cardinal translatory flow fields (Fig. 5l, m).
Methods
Animals
All procedures were in accordance with National Institutes of Health guidelines and approved by the Institutional Animal Care and Use Committee at Brown University. We used three strains of adult mice of either sex, 2 - 2.5 months old: wildtype C57BL/6J (Jackson Laboratory), or Hb9:GFP (B6.Cg-Tg(Hlxb9-GFP)1Tmj/J; Jackson Laboratory) or Trhr:GFP (Tg(Trhr-EGFP)HU193Gsat; MMRRC) reporter mice.
Intravitreal injections of calcium indicator
Mice (C57BL/6J) were anesthetized with isoflurane (3% in oxygen; Matrx VIP 3000, Midmark). A viral vector inducing expression of the calcium indicator GCaMP6f (AAV2/1.hSynapsin.GCaMP6f; Vector Core, UPenn; 1.5 –2 μl of ~3 × 10¹³ units/ml) was injected into the vitreous humor of the right eye through a glass pipette using a microinjector (Picospritzer III, Science Products GmbH). Animals were killed and retinas harvested 14-21d later. GCaMP6f was expressed mainly in RGCs and amacrine cells of the ganglion-cell layer, most densely near central retinal blood vessels.
Retrograde labeling
Mice were anesthetized as for eye injections and secured in a stereotaxic apparatus. Respiration and body temperature were monitored. A micropipette (1B100-4; World Precision Instruments) filled with a retrograde tracer (1μl; cholera toxin beta-subunit conjugated to CF568; CtB-568; 1μg/μl PBS; Biotium #00071) was positioned stereotaxically. Tracer was injected pneumatically (Picospritzer; Parker Hannifin; 10 PSI; 400 ms pulses) and the pipette slowly withdrawn after 10 min. The wound was sutured and the mouse monitored until able to remain upright. Analgesia (Buprenex SR, subcutaneous) minimized postoperative pain.
Tissue harvest and retinal dissection
The right eye was removed and immersed in oxygenated Ames medium (95% O2, 5% CO2; Sigma-Aldrich; supplemented with 23 mM NaHCO3 and 10 mM D-glucose). In retrograde-labeling experiments, the brain was also removed and fixed by immersion in 4% paraformaldehyde overnight. Under dim red light, the globe was cut along the ora serrata, and cornea, lens and vitreous removed. Four radial relieving cuts were made in the eyecup, the largest centered on the insertions of the lateral and medial recti, useful later as a reference axis. The other two were deliberately asymmetric (roughly dorsotemporal and ventral) to disambiguate retinal orientation. The retina was flat-mounted on a custom-machined hydrophilic polytetrafluoroethylene membrane (cell culture inserts, Millicell28) using gentle suction, and secured in a chamber on the microscope stage. Retinas were continuously superfused with oxygenated Ames’ medium (32–34°C). The left eye was enucleated and photographed for measurement of arc length from optic disk to ora serrata, a parameter needed for mapping flatmounted retina data to spherical coordinates (see Extended Data Fig. 5 and Supplementary Equations).
Immunohistochemistry of retina and brain
After imaging or recording, retinas were fixed (4% paraformaldehyde, 30 min, 20°C) and counterstained with one or more antibodies: 1) rabbit anti-CART (Cocaine and Amphetamine Regulated Transcript; H00362, Phoenix Pharmaceuticals) - a specific marker for most ON-OFF DS cells23; 2) guinea pig anti-RBPMS (RNA-binding protein with multiple splicing; 1832-RBPMS, PhosphoSolutions), a pan-ganglion-cell marker20; or 3) chicken anti-GFP (Abcam), to enhance the fluorescence of the GFP-based GCaMP6f indicator, which helped us to align images captured during live imaging with subsequent histology. Using a custom-designed rotating stage, we oriented the processed retina in the multiphoton microscope to match that during calcium imaging, then acquired confocal one-photon Z-stacks of all fluorophores (including retrograde tracers) in the RGC layer. Brains were embedded in 4% agarose, cut coronally (50 μM) on a vibrating microtome and immunostained using rabbit anti‐GFP (Life Technologies, A-11122) to enhance GCaMP6f fluorescence in retinal axons, useful for localizing deposits in relation to fasciculi and terminal nuclei of the AOS.
Patch recording and dye filling of ganglion cells
Whole-cell patch-clamp recordings of isolated flat-mount retinae were performed under current-clamp using a Multiclamp 700B amplifier, Digidata 1550 digitizer, and pClamp 10.5 data acquisition software (Molecular Devices; 10 kHz sampling). Pipettes were pulled from thick-walled borosilicate tubing (P-97; Sutter Instruments). Tip resistances were 4–8 MΩ when filled with internal solution, which contained (in mM): 120 K-gluconate, 5 NaCl, 4 KCl, 2 EGTA, 10 HEPES, 4 ATP-Mg, 7 phosphocreatine-Tris, and 0.3 GTP-Tris, pH 7.3, 270–280 mOsm). We added red fluorescent dye (Alexa Fluor 568; Invitrogen) for visual guidance during two-photon imaging and intracellular dye-filling.
Selected calcium-imaged cells were dye-filled (Alexa Fluor 568 hydrazide; Invitrogen) using fine glass pipettes (~50 MΩ resistance) guided by two-photon imaging. A current pulse (-20 nA; 100 ms) triggered cell penetration. Dye was iontophoretically injected (20 - 60 biphasic current pulses; ‐2000 pA for 500 ms and +500 pA for 400 ms) until dendrites were well filled. After all calcium imaging was completed, filled cells were documented in Z-stacks acquired in confocal (single-photon) mode.
Two-photon functional imaging
Imaging was conducted on an Olympus FV1200MPE BASIC (BX-61WI) microscope equipped with a 25×, 1.05 NA water-immersion objective (XLPL25XWMP, Olympus) and an ultrafast pulsed laser (Mai Tai DeepSee HP, Spectra-Physics) tuned to 910 nm. Epifluorescence emission was separated into “green” and “red” channels with a 570nm dichroic mirror and a 525/50 bandpass filter (FF03-525/50-32, Semrock, green channel) and 575-630nm bandpass filter (BA575-630, Olympus, red channel), respectively. The microscope system was controlled by FluoView software (FV10-ASW v.4.1). Images of 256 × 128 pixels representing 256 × 128 μm on the retina were acquired at 15 Hz (zoom setting of 2).
Visual stimulation
Patterned visual stimuli, synthesized by custom software using Psychophysics Toolbox under Matlab (The MathWorks), were projected (AX325AA, HP) and focused onto photoreceptor outer segments through the microscope’s condenser. The projected display covered 1.5 × 1.5 mm; each pixel was 5×5 μm. The video projector was modified to use a single UV LED lamp (NC4U134A, Nichia). The LED’s peak wavelength (385 nm) shifted to 395 nm after transmission through a 440 nm short-pass dichroic filter (FF01-440/SP, Semrock), a dichroic mirror (T425lpxr, Chroma), and various reflective neutral density filters (Edmund Optics). Photoisomerization rates were derived from the stimulus spectrum (measured using an absolute‐irradiance-calibrated spectrometer [USB4000-UV-VIS-ES, Ocean Optics]), estimated rod (0.85 μm2) and cone (1μm2) collecting areas29; and spectral absorbances of mouse rod and cone pigments30. Rates were very similar among rods and cones [~104 photoisomerizations/s (R*/photoreceptor/s)], independent of their relative expression of S- and M-cone pigments31.
To probe ON and OFF responses, we used a bright bar on a dark background (bar width=1500 μm, inter-stimulus duration=5 sec) drifting perpendicular to the bars long axis in 8 randomized directions (45° interval, speed=300 μm/sec, 4 repetitions). To assess directional tuning, we used a sinusoidal grating spanning two spatial periods (spatial frequency=0.132 cycle/degree, Michelson contrast=0.95, stimulus duration=3.65 sec, inter-stimulus duration=5 sec at uniform mean grating luminance) drifted in 8 randomized directions (45° interval, drift speed=4.5 degree/sec, 4 repetitions). Grating and bar parameters were optimized for ON-DSGCs22. Frames of the stimulus movie appeared for 50 μs during the short 185 μs interval between successive sweeps of the imaging laser; thus, no stimulus was presented during the interval of laser scanning and associated imaging (300 μs /sweep). The very rapid flickering of the visual stimulus (>2000 Hz) was well above critical fusion frequency in mice32.
ROI selection and data analysis
Somatic Ca2+ responses were analyzed using FluoAnalyzer33 and custom Matlab scripts. In each imaged field, we manually defined many regions of interest (ROIs; >500 pixels each); each ROI consisted of one soma expressing enough GCaMP6f to support functional imaging. The space-averaged pixel intensity within such ROIs was the activity readout for the associated cell, a proxy for its spike rate34. Fluorescence responses are reported as normalized increases as follows:
| (1) |
where F denotes the instantaneous fluorescence and F0 the mean fluorescence over a 1-second period immediately preceding stimulus onset.
The preferred direction (PD) of a cell was estimated as the angle of the vector sum following35:
| (2) |
where r is the response amplitude to stimuli moving at direction ϕ (0, 45,…,315). The direction selectivity index (DSI) of cells which may range between 0 (no direction selectivity) and 1 (highest direction selectivity) was calculated as:
| (3) |
The response amplitude r represented the average calcium response from the stimulus onset to 2 sec following the termination of the stimulus, to capture the OFF responses and to account for the slow decay time of the calcium response36.
Unsupervised clustering and the diversity of DSGCs
For decades, seven canonical subtypes of DSGCs have been recognized: 3 ON-DSGCs and 4 ON-OFF-DSGCs. Recently, however, several new DSGC types or subtypes have been identified or suggested, including previously unknown OFF-DS types and novel forms of ON- and ON-OFF DSGCs (Supplementary Discussion).
To assess how many subtypes might be differentiable in our sample based on calcium-response kinetics, we performed unsupervised clustering using Gaussian Mixture Models. From each cell’s response to bar motion in the optimal tested direction, we extracted two features. The first was a response-latency measure. We estimated when the leading edge of the stimulus would first arrive at the receptive-field (assuming a diameter of 300 μm and accounting for cell position within the imaged field), then measured the subsequent delay to the peak of the ON response. The second feature extracted was the slope of the decay during the first 300 msec following the ON peak. For clustering, we used the full covariance matrix, regularized by the addition of a constant (0.001) to guarantee that the estimated covariance matrix is positive. To avoid local minima, we repeated the algorithm using 50 different sets of initial values, with the accepted fit being that with the largest log likelihood. The optimal model (the model with the optimal number of clusters), was estimated based on the Bayesian information criterion:
| (4) |
where L represents the maximum of the likelihood function of the model, k represents the number of clusters in the model (0-10 clusters), and n stands for the number of observations. The model with the lowest BIC was considered optimal, and any model with a BIC no higher than 6 than the optimal was considered an acceptable alternative37. Running the clustering routine on all DSGCs (n=2446) yielded an optimal model with six clusters, and a seven‐cluster model that was essentially as good. An alternative approach, the Akaike information criterion (AIC), yielded an optimal model with eight clusters and acceptable alternatives with three, four, and seven clusters. Altogether, this analysis provides evidence for 3 - 8 DSGC clusters, dependent on criteria selected. The relationship between these clusters and known or proposed DSGC subtypes is difficult to work out, though the canonical types are certainly among them, and the novel OFF-DGSCs are not (see Supplementary Discussion). In this report we therefore fall back on the classical and widely used binary division of DSGCs into ON-DSGC and ON-OFF-DSGCs classes. Of course, both classes population comprise multiple subtypes. Our findings indicate the presence of at least eight subtypes in total (ON vs. ON-OFF classes; four subtypes each, distinguishable by their topographically dependent direction preferences), in good agreement with the BIC and AIC analysis above. Because our analysis considered a limited set of potentially distinguishing parameters, it does not preclude further subdivision of DSGCs.
Inferring the form of the generic directional tuning curve for DSGCs
To generate the generic directional tuning function for DSGCs (Extended Data Fig. 9a), we expressed the directional preferences of 56 ON-DSGCs and 141 ON-OFF-DSGCs in terms of normalized spike output as a function of stimulus direction relative to the optimal (determined as described earlier). Each of these tuning curves was fit with a von Mises distribution38:
| (5) |
where rmax is the peak amplitude, k is the width of the distribution, r is the calcium response amplitude to stimuli moving in angle ϕ (0°, 45°,…, 315°) away from the preferred direction. The bandwidths of ON-DSGC tuning curves, assessed as full width half maximum (FWHM), did not differ significantly from those of ON-OFF-DSGCs (Welch t-test for unequal variances, t = −1.65, d.f. = 86.2, p = 0.101 [two-tailed]; average±s.d., 131°±16° for ON DSGCs and 135°±13° for ON-OFF-DSGCs). Therefore, we estimated the directional tuning of DSGCs, regardless of class and subtype, by averaging the normalized tuning curves of all imaged DSGCs (Extended Data Fig. 9a). The bandwidth of this function (FWHM) was 135°±14°.
Registration of calcium imaging data
Initially, retinas were oriented relative to the line connecting nasal and temporal relieving cuts made through rectus muscle insertions. We made a post-hoc adjustment to this orientation by exploiting the stereotyped form across retinas of flow-tuning maps for ON‐OFF-DSGCs (four ‘hot’ bands, roughly 90° apart along the direction axis – abscissa; see Extended Data Fig. 5). We assumed that the slight variation in the exact position (direction) of these bands resulted from experimental error in orienting the retina, though we cannot exclude contributions from biological variability. To correct for this presumed rotatory error, we measured the displacement of each retina’s flow-tuning map from a reference map of the same form. The reference map was generated by averaging four flow tuning plots maps in which the hot bands were clear and appeared in similar positions (Extended Data Fig. 5e). For each retina (n = 26), the rotatory error was taken to be the phase offset of its flow-tuning plot from this standard, determined by convolving the two along a single dimension (direction; abscissa) at a resolution of 5°. The correction factor was the phase shift maximizing the total amount of energy (brightness) in the convolution matrix. Computationally correcting these rotatory errors registered all retinal datasets, allowing us to pool directional data across retinas. Such offsets had a median value of 2.5°± 11.5° (s.d.). We corrected for these when transforming retinotopic data to global extrapersonal coordinates.
Estimating the relative abundance of single subtypes in samples of DSGCs
For ON- and ON-OFF-DSGCs independently, we generated a model comprising four DS subtypes (Fig. 3e-h), each of which aligned its DS preferences everywhere with the optic flow produced by translation along a single, empirically determined best axis (Fig. 3b). Coordinates of these four best axes were derived from the four local maxima (hotspots) in flow-tuning plots. We asked what weighting of these subtypes could best reproduce the translatory-flow-tuning plot for all DSGCs (Fig. 3c,d). Formally, the best fitting flow-tuning map for modeled cells (Mf) was derived from the weighted sum of four (i=1,2,…,4) single-subtype maps Mi (Fig. 3e-h):
| (6) |
where Ci denotes the weighting allocated to individual subtype maps. We used least-squares fitting (regress function in Matlab) and the multiple correlation coefficient (R2) for regression models without a constant term39 to assess the goodness of fit. Two-tailed 95% confidence intervals for R2 values were calculated using bootstrapping, resampling DS cells with replacement (Supplementary Note 6).
Transforming retinal coordinates into global egocentric coordinates
The retinocentric coordinate system we used was monocular, had its origin at the nodal point of the eye, and specified retinal or visual-field location by two coordinates: eccentricity and direction (Extended Data Fig. 5). Eccentricity was defined as the visual angle between the point of interest and the optic axis (the projection of optic disk). Eccentricity is 0° at the blind spot and 90° at the margin of the visual hemifield, corresponding to the retinal margin. Eccentricities of 90°- 180° correspond to spatial locations outside the visual hemifield. Direction refers to the direction of displacement of the point of interest from the optic axis, where nasal = 0°, dorsal = 90°, temporal = 180° and ventral = 270°.
For representations of global extrapersonal visual space, the origin was considered to lie at a point halfway between the two eyes (we neglected the small displacement of the eyes from the midline) (Extended Data Fig. 9). The horizontal plane (elevation=0°) was defined as the plane perpendicular to the gravitational axis that passes through the nodal points of the eyes. To translate retinocentric spatial locations to global ones, we assumed that the mouse’s head was in a typical ambulatory position40 which puts the lambda–bregma axis of the skull at an angle of 29° (bregma lower) relative to the anteroposterior axis. Locations in global extrapersonal space were defined by two coordinates: azimuth and elevation. Azimuth corresponds to the angle between a vector pointing straight ahead and a second vector defined by the intersection of two planes: the horizontal, and a vertical plane passing through the eye and the point of interest (azimuth = 0° at the vertical meridian of the visual field). At the horizon, azimuth = 90° lies directly to the right, ‐90° lies directly to the left, and 180° lies directly behind the animal. Iso‐elevation lines follow lines of latitude in the same global coordinate system, and range from 90° at the zenith, through 0° at the horizontal plane, to ‐90° at the nadir.
We transformed retinal or visual field locations from spherical retinocentric coordinates to global egocentric coordinates using two key additional values. The first was the orientation of the optic axis in the head of ambulating mice, drawn from Oommen and Stahl40, namely at global egocentric coordinates (as defined here) of 22° elevation and 64° azimuth. These values accounted for the tilt maculo-ocular reflex (tiltMOR), which tilts the eye upward in visual space when the nose tilts downward. The second value was the torsional orientation of the eyes measured from the positions of the insertions of the lateral and medial rectus muscles relative to the stereotaxic lambda-bregma axis. To obtain this value, mice (n = 5) were anesthetized as for survival surgery, mounted in a stereotaxic apparatus, the skull exposed, and the mouse’s head tilted about the interaural axis so that the lambda-bregma axis lay within a stereotaxic horizontal plane. Using a stereotaxically mounted fine probe as a depth guide, we used a cautery pen to make two small burn marks on the cornea, both within the same stereotaxic horizontal plane, but one at the rostral margin of the cornea, and the other at its caudal limit. The line connecting the two burn marks thus paralleled the lambda-bregma axis. We then measured the angle between this line and that connecting the insertions on the globe of the lateral and medial rectus muscles. This angle averaged 35.6±2.3° (average±s.d.), with the medial rectus insertion lying above the lateral one.
Extended Data
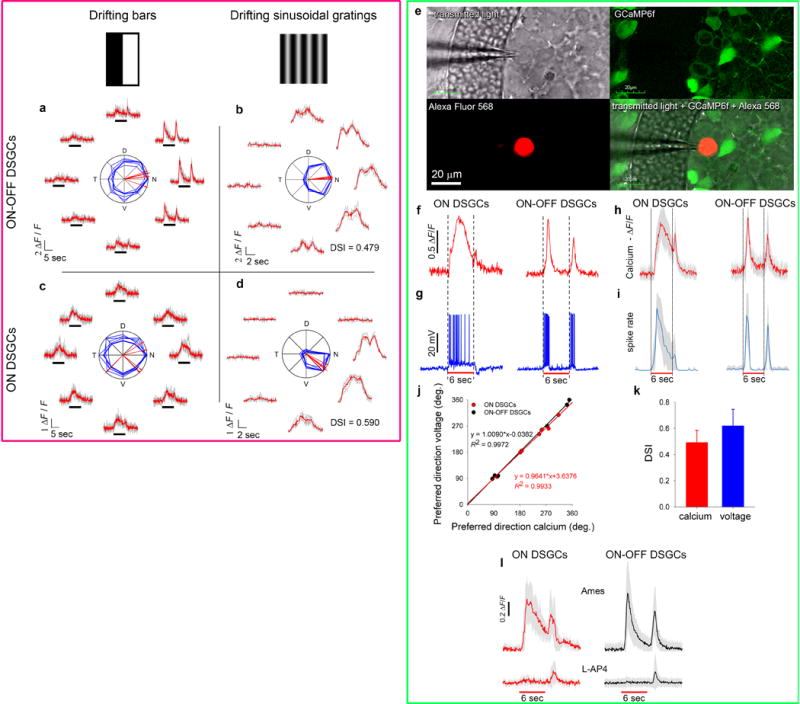
Extended Data Figure 1. Direction-selectivity of ON- and ON-OFF-DSGCs revealed by their calcium and voltage responses.
a-d, Calcium transients of representative ON-OFF-DSGCs (a,b) and ON-DSGCs (c,d) in response to bright bars (a,c) or sinusoidal contrast gratings (b,d) drifting in eight directions at 45° intervals. Preferred direction and direction selectivity index (DSI) were determined from grating responses, cell class (ON- or ON-OFF-DSGC) from the bar responses. Traces plot somatic GCaMP6f Ca2+ signal over time; red = mean; gray = single trials. Black marker indicates when stimulus bar was within the cell’s receptive field. Polar plots show response amplitude (normalized to maximum) for each direction (bold curves = mean of four repetitions; thin = single trials). Red vectors show preferred direction (bold, mean; thin, single trials; N, nasal; D, dorsal; T, temporal; V, ventral). Direction-selectivity index (DSI) was higher for gratings than bars, especially for ON-DSGCs (Supplementary Note 9). e–k, Morphological and functional validation of DSGC subtypes inferred from Ca2+ imaging. e, GCaMP6f fluorescence (top right) revealed DS tuning in a cell that was then targeted for patch recording (top left) and dye filling (bottom left; see Extended data Fig. 3i for representative morphological data). f,g, Calcium (f) and voltage (g) traces for representative ON- and ON-OFF-DSGCs in response to a drifting bright bar. h,i, mean calcium responses (h) and peristimulus time spike histograms (PSTH) (i) for patched ON- (n = 8) and ON-OFF-DSGCs (n = 6) in response to a drifting bright bar (gray bands: ±1 s.d.). The bar’s trailing edge evoked a small OFF Ca2+ transient in ON-DSGCs (h; see also f, left trace) and a very slight uptick in the PSTH (i). j–k, DS preference inferred from Ca2+ signal closely matches that inferred from spiking for both ON-DSGCs (red) and ON-OFF-DSGCs (black) (j), despite having significantly broader tuning (k; lower DSI; paired t-test, t = −4.068, p<0.001). l, Bath application of a selective ON-channel blocker (L-AP4) abolished the ON response, but left an OFF transient of reduced amplitude in ON-DSGCs (n=10) and ON‐OFF-DSGCs (n=43) alike. OFF responses of ON-DSGCs are presumably mediated by excitatory input from OFF bipolar cells to the sparse OFF dendritic arbors of ON-DSGCs22.
Extended Data Figure 2. Anatomical analyses: correlating calcium with immunofluorescence, retrograde labeling, and morphological asymmetries.
a-f, Correlating Ca2+ imaging and post-hoc immunofluorescence in a single imaged field. a, A 2‐photon image of GCaMP6f-expressing cells in live retina, in vitro. Numbers indicate regions of interest (ROIs) for assessing somatic DS responses. Cell-free zones are blood vessels. b-f, Confocal image of the same field after fixation, immunolabeling, and alignment with the live image (a). b, Immunolabeling for CART, a specific marker for 3 of 4 ON-OFF-DSGC subtypes (N-, V- and D-cells). c, Anti-GFP immunofluorescence, to enhance GCaMP6f signal which faded after fixation. d, Immunofluorescence for RBPMS, a marker for all RGCs. e,f, Merged images combining GCaMP6f (anti-GFP) signal with either RBPMS (e) or CART (f). g-j, Single imaged field demonstrating that identification of cells labeled by retrograde transport from the AOS can be linked to specific Ca2+-imaged cells. g, 2-photon image of GCaMP6f fluorescence in live retina in vitro; ROIs marked as in (a). h,i, Live confocal images of same field, showing (h) two cells retrolabeled from the MTNd (h; fluorescent cholera toxin beta-subunit, CTb) and GCaMP6f fluorescence (i). j, Merged image of h and i. k, Confocal images of coronal sections showing retrograde-tracer deposits (red) in 12 different mice, three mice each (#1-3) for four AOS targets (rows): superior fasciculus of the accessory optic tract (SF-AOT); inferior fasciculus of the AOT (IF-AOT); dorsal division of the medial terminal nucleus (MTNd); and nucleus of the optic tract (NOT). Far right column shows enlarged images from third column. These deposits spared retinorecipient nuclei outside the AOS, visible from nonspecific labeling by GCaMP6f fluorescence (green). l–s, Structure and function of GFP-labeled DSGCs in Hb9-GFP mice. l. Voltage responses to drifting gratings (conventions as for Extended Data Fig. 1b,d). m,n, Spike responses to a bright bar moving in the preferred direction. Dashed line indicates roughly when the stimulus overlapped the receptive field. m, Voltage response of representative Hb9-GFP cell on a single trial. n, Mean peristimulus time histogram (PSTH) for all recorded Hb9-GFP cells (n = 32; 4 retinas). Gray band represents ±1 s.d. o, Preferred directions of all recorded GFP+ cells (n = 32 cells; 4 retinas). All point generally ventral, but scatter is substantial. (Arrow length not scaled to DSI). p-s, Dendritic asymmetry in Hb9 cells correlates with preferred direction. p, Typical Hb9 cell dye-filled during patch recording; maximum-intensity projected (MIP) confocal image. Blue vector indicates displacement of centroid of dendritic arbor (red dot) from the soma (black dot), a measure of the magnitude and direction of asymmetry. q, Dendritic asymmetry correlates strongly with physiologically determined DS preference (n = 12). r, Assessment of dendritic-field asymmetry in Hb9-GFP cells based on GFP fluorescence alone. In this MIP image, colored polygons show estimated dendritic-field envelopes for four cells. Vectors mark magnitude and direction of asymmetry as in (p). s, Polar plot of direction and magnitude of dendritic asymmetry among a large sample of Hb9-GFP cells (n = 82 cells; 3 retinas) estimated as in (r). Estimates made blinded to retinal location. Vector length indicates magnitude of arbor asymmetry (displacement of dendritic-field centroid from soma, normalized by the arbor circumference). Nearly all markedly asymmetric fields were displaced in a ventral direction from their somatic location, but with substantial scatter.
Extended Data Figure 3. ON-DGSCs: Differentiation from ON-OFF-DSGCs by unsupervised clustering and projections to accessory optic system.
a, DSGCs can be clustered into two classes (ON and ON-OFF) based on two parameters of Ca2+ responses to moving bars: 1) the latency of the ON peak (relative to the arrival of the bar at the receptive-field; assumes 300 μm field diameter and accounts for cell position within the imaged field); and 2) the slope of decay for 300 msec following the ON peak, a measure of the transience. Each cell is shown by a point colored to represent its posterior probability of belonging to the ON-OFF-DSGC cluster. Most cells are very likely to be one type or the other. b–g, Average Ca2+ signals (ΔF/F ; mean [red] ± s.d. [gray]) evoked by light bar moving in the preferred direction for various samples of DSGCs (ON-OFF-DSGCs: red traces; ON-DSGCs: blue): b, all imaged DSGCs; c, morphologically identified (dye-filled) DSGCs; d, CART-immunopositive DSGCs (comprising mainly N-, D-, and V-type ON-OFF-DSGCs); e-g, DSGCs retrolabeled from three components of the AOS: superior (e) and inferior fasciculi (f) of the AOT, and dorsal division of the MTN (g). See Supplementary Note 10 for additional details. h, Representative morphology of ON-OFF-DSGCs (left) and ON-DSGCs (right) revealed by dye injection after Ca2+ imaging, and illustrated as MIP confocal images, projected onto the retinal plane (top) and an orthogonal one (bottom). ON-OFF-DSGCs stratify about equally in ON and OFF sublaminae; ON-DSGCs mainly in the ON sublamina. i-m, Ca2+ imaging of retrolabeled cells shows ON-DSGCs subtypes project differentially to AOS. Each panel includes DS preferences plotted on a standard flat retina with superimposed best-fitting optic flow for each subtype (left); translatory optic-flow-tuning plots (middle), one for the actual data [top] and a second for the best-fitting model [bottom]); and model-derived weighting coefficients (right), providing an estimate of relative subtype abundance. D- and V-cells selectively innervated the medial terminal nucleus (MTN) (i-k), while T- and N-cells supplied the nucleus of the optic tract (NOT)/dorsal terminal nucleus (DTN) (l). The superior fasciculus of the AOT (SF-AOT) apparently carries only D-cell axons (j), whereas the inferior fasciculus (IF-AOT) and dorsal MTN (MTNd) contain mixed V and D fibers (k) (but see42). Thus, two cardinal translatory axes are separately represented in the AOS, one in the NOT/DTN and the other in the MTN.
Extended Data Figure 4. Mapping cell locations in standard retinal coordinates.
a, Representative experimental retina after GCaMP6f imaging (confocal image). Bright patches (mostly central) are GCaMP6f fluorescence. Magenta vectors show locations and DS preferences of imaged DSGCs. Four radial relieving cuts were made to promote flattening; blue circles mark their termini. The nasal and temporal cuts were made at medial and lateral rectus insertions; the line connecting these (the ‘horizontal reference line’) effectively parallels the horizontal plane in ambulating mice. Curl at retinal margins developed gradually and was taken into account. b, Map of estimated strain energy density, reflecting local stretching during flattening . c-f, Mapping of cell locations onto a standardized spherical coordinate system for pooling data across retinas and display in flattened (d) or hemispherical form (f). c, Data in (a) remapped into standardized spherical coordinates, followed by remapping into flattened form using modeled relieving cuts approximating the actual ones; close similarity to (a) indicates these transformations are accurate and reversible. d, Same as (c), but in the form of a standardized flat-mounted retina (four virtual radial cuts, 90° apart, extending 60% of the distance from retinal margin to optic disk). e,f, Schematic illustration of the mathematical approaches used for mapping to, and transformation between, coordinate systems. See Supplementary Equations. Parametrization x : Ω → R3 of the spherical retina S. s: arc length as measured from the optic disk. θ: the longitudinal coordinate; 0° corresponds to the nasal terminus of the horizontal reference line, 90° to the dorsal retina, and so forth. Four red meridional arcs show the reconstructed positions of the four radial cuts in (a) and (c). These have angular coordinates of θi and an arc length of M − mi. M was approximated from the flat-mount as the average length of lines extending from the optic disk to the retinal margin (green lines, including the curled portions in a). mi was estimated as the distance on the flat-mount from optic disk to the terminus of the corresponding radial cut [blue lines in (a), (e) and (f)]. Numerical reconstruction of the flat-mounted retina allowed empirical cell locations to be mapped to the spherical retina via the mapping x ◦ F−1.
Extended Data Figure 5. Flow-tuning plots, correction for errors of rotatory orientation in vitro, and development of a flow-tuning model.
a-d, Generation of flow-tuning plots. a, DS preferences of all imaged ON-OFF-DSGCs mapped onto standard flattened retina. Each black vector marks one cell’s location and preferred direction. How well do these DS preferences aligned with the local retinal optic flow produced by the mouse’s translation along specific axes? Two flow fields are shown (blue and red lines and arrowheads); many more were tested (2701 axes; 5° intervals of spherical angle). For each tested translation, we measured the angle θ between each cell’s preferred direction and the local direction of optic flow (inset: θ1 for the blue flow field, θ2 for the red one). N: nasal; D: dorsal; T: temporal; V: ventral. b, Distributions of angles θ1 (top) and θ2 (bottom) among all cells in a. Concordance index comprises the percentage of cells with DS preferences differing <10° from the local motion in a specific flow field (green rectangles). Alignment was much greater with ‘blue’ than ‘red’ optic flow (concordance index = 11.7 and 2.6, respectively). c, Spherical translatory-flow-tuning plot displaying concordance index as a function of the axis of the animal’s translation through space. Location of data for “blue” and “red” optic flows are indicated. d, Schematic representation of translatory optic flow induced in visual space (bottom hemisphere) and on retina (upper hemisphere) by animal’s (and eye’s) translation along the indicated axis (best axis of V‐cell subtype). Translation along the indicated axis yields flow with a center of contraction in the ventral retina (as for V-cells; Fig. 1m and 2a) and in the corresponding locus in superior visual field. e, Correcting for errors of rotatory orientation of retina in chamber. Flattened translatory-flow-tuning plots for ON-OFF-DSGCs in four different retinas with large samples of imaged cells. Plots are highly stereotyped in form, but exhibit some variation in phase (i.e., horizontal position; compare positions of hotspots to the arbitrary red vertical reference line). To correct for this experimental error, we phase-shifted each retina’s heat map (i.e., offset it along the x-axis) to produce the best match with a reference heat map (an average of the four maps in e). See Methods for details. f-i, Stepwise development of the model of global DS geometry. Note the progressive improvement in the agreement between the flow-tuning plots of modeled and actual imaged ON-OFF-DSGCs (j). f, Basic version of the model. Modeled DSGCs were uniformly distributed over the retina. DS preferences set to local flow produced by translation in one direction along one of two orthogonal axes, derived in Fig. 3b. g, After restricting modeled cells to the locations of actual imaged cells. Smearing of hotpots reflects degraded certainty about the position of the best axes due to undersampling of cells in retinal regions near the singularities (centers of expansion or contraction). h, After mimicking biological and experimental variability by adding angular noise (standard deviation = 10°) to the preferred directions of cells used in g. i, After accounting for the unequal abundances of subtypes by differentially weighting them before summation. Below: local polar plots of preferred directions of modeled DSGCs. Equivalent plots for cells in the final, refined model (i) are shown in Fig. 3j (black). k-n, Evidence for the predictive power of the model across data sets. ON-OFF-DSGC cells were arbitrary divided into two samples, a training set (flow tuning plot in k) and a test set (l). Best translatory axes derived from the training set were used to generate a 4-subtype translatory flow-matching model of the same form as in i. m, flow-tuning plot for these modeled cells closely resembles that for imaged cells in the test set (l; R2=0.95). n, A model with translatory axes derived from ON-OFF-DSGCs predicts the DS preferences of imaged ON-DSGCs cells (R2=0.83). Weighting coefficients giving the best fit recapitulated those from direct modeling of ON-DSGC (Fig. 4j,m). See Supplementary Note 11 for details.
Extended Data Figure 6. Four ON-DSGC subtypes are still apparent when stringent criteria are used to distinguish them from ON-OFF-DSGCs.
Even when we apply a more stringent criterion to differentiate ON- from ON-OFF-DSGCs, we detect four ON-DSGC subtypes rather than the expected three (Fig. 4). a, Cluster analysis identical to Extended Data Fig. 3a but including only cells very likely to belong to the ON- or ON-OFF-DSGC classes (posterior probabilities >0.95 of membership in one of the classes). This excluded 457 cells from analysis. b, Average calcium signals (ΔF/F; mean±s.d.) to moving bars for these stringently classified samples of ON-OFF-DSGCs (red traces) or ON-DSGCs (blue traces). See Extended Data Fig. 3c for details. c,d, Four subtypes remain evident in both ON DSGCs (d) and ON-OFF DSGCs (c) after application of the stringent classification criterion. These subtypes are evident in the four lobes of local polar plots of preferred direction (left) and in the four hotspots in the associated flattened translatory-flow-tuning plots (center). Bar plots (right) display the weighting coefficients of the best fitting model, a measure of the relative abundance of the four subtypes. These weighting coefficients were similar to those obtained using the standard posterior-probability criterion (>0.5), suggesting that the cells excluded due to the stringent criteria were distributed roughly equally across the four subtypes for each class.
Extended Data Figure 7. Selectivity for direction varies among DSGC subtypes.
a, Polar plots of local DS preference among ON-DSGCs, plotted on standard flat retinas (above) and in reconstructed hemispherical form (below). Increasing the stringency of the criterion for direction-selectivity index (DSI) from 0.3 to 0.5 reduced the number of N-cells (top left) by 95%, but other subtypes by only 42-60% (sample zone: red rectangle). Thus, N-type ON-DS cells are unusually poorly tuned, and may have been excluded on that basis in previous studies reporting only three ON-DSGC subtypes. b, Left panels of (a) reproduced with color coded subtypes. Each cell’s subtype assignment determined by which of the four cardinal translatory flow fields was most closely aligned with its preferred direction. N, blue; T, green; D, orange; V, magenta. c, Line histograms showing the distribution of DSIs among each ON-DSGC subtype. The distribution for N-type ON-DSGCs is shifted to lower DSI values. d, Median DSI and first and third quartiles for each ON-DSGC subtype. N-cells were significantly less well tuned. e-h, same analysis as a–d, but for ON‐OFF DSGCs. There were significant differences among subtypes but the stringency of the DSI criterion did not affect the relative abundance of subtypes. i,j, Mean calcium responses (n=497) to preferred direction of bar motion of individual subtypes of ON‐DSGCs (i) and ON-OFF-DSGC (j). k,l, Histograms (k) and mean values (plus 1st and 3rd quartiles) (l) of latency to ON peak for each DSGC subtype, measured from estimated time of arrival bar edge at receptive field (see Methods). Latency differed significantly between each ON-DSGC subtype and its matching (homonymous) ON-OFF-DSGC subtype. m,n Histograms (n) and median plus 1st and 3rd quartiles (n) of the slope following the ON peak for each subtype of ON- and ON-OFF-DSGCs (see Methods). See Supplementary Note 12 for statistics and further details.
Extended Data Figure 8. Direction preferences of both ON- and ON-OFF-DSGCs are better aligned with translatory optic flow fields than with rotatory ones.
a, Flattened rotatory flow-tuning plot illustrating the concordance of DS preferences of all imaged ON‐OFF-DSGCs with rotatory optic flow fields as a function of rotatory axis orientation (plate carré projection; cf. Fig. 2j,k; Supplementary Note 13). b, Same as (a) but using modeled cells drawn from the best-fitting model. Model as for Extended Data Fig. 5i, but with subtypes (d) aligning DS preferences with rotatory instead of translatory optic flow fields (Supplementary Note 13). c, Weighting coefficients for the four subtypes in the best-fitting model. d. Rotatory-flow-tuning plots for the four individual rotatory-flow-matching subtypes used in the model, each with DS preferences aligned (±10° noise) with one of the four cardinal rotatory flow fields. e‐g, Local polar plots of DS preferences predicted for two sets of modeled DS cells, aligning their DS preferences either with translatory optic flow (Fig. 3d-h) or with rotatory optic flow [this figure, (b) and (d)]. e, Comparison of translatory and rotatory flow-matching models (green and blue polar plots, respectively). Predictions are similar in the central retina but diverge sharply in the periphery, especially ventrally and temporally. f, Observed preferred directions of imaged ON-OFF-DSGCs (red vectors; n = 1953) compared with those predicted by the model comprising four translatory-flow-matching channels (black vectors; n = 8100). g, Same as (f), but with preferred directions predicted from the rotatory-flow-matching model (black vectors; n = 8100). Optic flow preferred by each channel shown in pastel lines and arrowheads (N-cells, blue; D, green; T, red; V, magenta). h-n, Same as for (a-g), but comparing modeled and imaged ON‐DSGCs. o, Comparison of real and modeled responses to translatory and rotatory flow for an ensemble comprising a single ON-OFF-DSGC subtype (T-cells). Modeled cells were aligned with their respective canonical translatory optic flows and were uniformly distributed over the retina. Top: Response of modeled T-cell ensemble to translatory optic flow. Middle: Modeled ensemble response of same cells to rotatory optic flow. Bottom: same as middle, but for real imaged T-cells. p-s, Flow-tuning plots for all imaged ON-OFF-DSGCs (p,r) and ON-DSGCs (q,s) probed with translatory (p,q) or rotatory (r,s) flow. t–w, Translatory-flow-matching model outperforms its rotatory equivalent overall, but especially temporally (green sector in t and v), where model predictions are most divergent (see e). u,w, Bar plots of R2 for fit to data of translatory (grey) and rotatory (black) models, assessed separately for the retina overall (left) or the temporal sample region alone. Similar trends were also apparent near the ventral translatory singularity (not shown).
Extended Data Figure 9. Ensemble coding by DSGCs of all possible translatory and rotatory optic flows, mapped in retinal or global extrapersonal coordinates.
a, Average directional tuning curve of imaged DSGCs (mean Ca2+ response, normalized to maximum, as a function of the angular offset from preferred directions). Tuning curves did not differ for ON- and ON-OFF-DSGC classes (see Methods). b, Flattened map of summed spike output of a single modeled ON-OFF-DSGC subtype — the D-cells — as a function of direction of the animal’s translation, expressed in retinal coordinates. Hotspot indicates location in retinal space of the center of contraction of the preferred translatory flow field (Supplemental Note 14). c, Alternative flow-tuning plot for the same subtype but plotting the concordance index (as elsewhere in this report; cf. Fig. 2d-k; Supplementary Note 14). d, Flow-tuning plots of estimated summed ensemble spike output for each of four modeled translatory-flow-matching DSGC subtypes in response to optic flow generated by translation along (left column) or rotation about any axis (right column). e, Same as (d) but remapped in extrapersonal space and shown separately for the left and right eyes. Azimuth of zero is anterior; elevation of 90º is overhead. Hotspots in maps for translatory optic flow (first and third columns) indicate the best egocentric direction of heading for activating that DS subtype ensemble (Supplementary Note 14). f, g, Decoder model showing the brain could discriminate rotatory from translatory optic flow and identify the axis of self‐motion by exploiting unique patterns of relative activation of the eight DS-channels (4 subtypes X 2 eyes) induced by specific optic flow fields. f. Left column: heat plots showing, as a function of axis orientation, the Euclidean distance (dissimilarity) between two patterns of relative activation of the eight DS channels induced by: 1) translation along that axis; and 2) translation along a single “input” axis (the unknown to be inferred by decoding, indicated at left, in green). Each probed axis is represented by a single pixel in the global map. Coldest color marks the coordinates in extrapersonal space of the axis of translation evoking 8‐channel outputs closest in Euclidean distance (black number, upper right), and thus highest in similarity, to the 8-channel outputs evoked by the reference (unknown) axis. Right column of plots: same as left except that the eight-channel outputs induced by the input translatory optic flow are now compared to those of the same eight channels when induced by rotation about any possible axis. The coldest spot in this plot marks the orientation of the rotatory axis producing an 8-channel output pattern most similar to that produced by translation along the input (unknown) axis. g, Same as (f) except that the input axis listed at left (the unknown) is an axis of rotation, rather than of translation. In each case, the flow field generating eight-channel outputs most like those induced by rotation about the input axis (minimum Euclidean distance and darkest blue) is rotatory (right column of plots), not translatory (left column), and the orientation of the best‐matching rotatory axis corresponds to that of the input axis of rotation. See Supplementary Note 14 for further explanation and interpretation.
Extended Data Figure 10. Modeled postsynaptic cells differentially tuned for rotation or translation are easily generated by summing or subtracting specific DS channels in the two eyes.
a, We devised a ‘tuning index’ to quantify the strength of tuning of single modeled subtype-ensembles for specific optic flow fields (Extended Data Fig. 9). The index consisted simply of the range of the Euclidean-distance values for the individual modeled DSGC ensembles. Individual DSGC subtype ensembles are nearly as well tuned to a specific axis of rotation as they are to their best axis of translation (Extended Data Figs. 8a,h; 9e). b, Design of a simple model for generating postsynaptic cells with a selective preference for translation over rotation (T1-T4), or for rotation over translation (R1-R6), through linear summation or subtraction of multiple DSGC channels in the two eyes (see Supplementary Note 15 for details on model design). c, Selectivity of modeled postsynaptic cell types for specific translations (T1-T4) or rotations (R1-R6), reflected in the tuning index as in a; note the enhanced discriminability of translation from rotation relative to the input DSGCs (a). d, Flattened spherical ensemble-output plots, showing variations in net excitation of specific modeled postsynaptic cell classes as a function of the axis of translation or rotation, all in egocentric (global) coordinates (see Extended Data Figure 9e). In heat maps, red and blue represent maximum and minimum channel activation, respectively. The model thus demonstrates that arithmetic combinations of signals from specific retinal DS channels could allow the brain to decompose optic flow into its translatory and rotatory components, paralleling the biomechanical decomposition of self-motion into these components by the vestibular labyrinth.
Supplementary Material
Acknowledgments
We thank Jonathan Demb and Wei Wei for kindly providing us with Trhr-GFP and Drd4-GFP mice. Countless colleagues provided invaluable theoretical, data-analytic and technical advice, including imaging, electronics and device synchronization, intracranial and intraocular injections, electrophysiological recordings, and statistical analysis. They included Jim McIlwain, Bart Borghuis, Geoff Williams, Chris Deister, Jakob Voigts, Chris Moore, David Sheinberg, Kevin Briggman, Michelle Fogerson, Maureen (Estevez) Stabio, Jordan Renna, Scott Cruikshank, Shane Crandall, Barry Connors, Shaobo Guan, Jerome Sanes, Wilson Trucculo, and Carlos Aizenman. Dianne Boghossian maintained the mouse colony and genotyped experimental mice. Kim Boghossian, Carin Papendorp, and Pu-Ning Chiang contributed to digital image analysis. John Murphy constructed microscope stages and retinal mounts. We thank Vivek Jayaraman, Douglas S. Kim, Loren L. Looger, and Karel Svoboda from the GENIE Project, Janelia Research Campus, Howard Hughes Medical Institute for sharing their GCaMP6f calcium indicator. This project was supported by the Banting Postdoctoral Fellowship of Canada for S.S., The Sidney A. Fox and Dorothea Doctors Fox Postdoctoral Fellowship in Ophthalmology and Visual Sciences to S.S., NSF-RTG grant (DMS-1148284) to J.A.G., and NIH grant (R01 EY12793) and an Alcon Research Institute Award to D.M.B.
The data that support the findings of this study are available from the corresponding author upon reasonable request.
Footnotes
Author Contributions
D.M.B. and S.S. designed the study and developed the theoretical framework. S.S. performed all imaging, electrophysiological recordings, and intracellular dye-fills. S.S., A.B.L., G.M., G.C. and J.K.S performed intracranial and intraocular injections, immunostaining of retinas and brains, and calcium imaging data processing. J.A.G. developed the mathematical methods for interconverting locations on flattened retinas to hemispherical ones and to global extrapersonal space. N.J. performed the tomographic analysis of the vestibular system. S.S., D.M.B., J.A.G. and N.J. analyzed the data. D.M.B., S.S., J.A.G. and N.J. wrote the paper.
The authors declare no competing financial interests.
Supplementary Information is available in the online version of the paper.
Tomography of vestibular and ocular systems. See Supplementary Methods and Supplementary Table 2.
References
- 1.Vaney DI, He S, Taylor WR, Levick WR. In: Motion Vision - Computational, Neural, and Ecological Constraints. Zanker JM, Zeil, editors. Springer Verlag; 2001. pp. 13–56. [Google Scholar]
- 2.Wei W, Hamby AM, Zhou K, Feller MB. Development of asymmetric inhibition underlying direction selectivity in the retina. Nature. 2011;469:402–406. doi: 10.1038/nature09600. [DOI] [PMC free article] [PubMed] [Google Scholar]
- 3.Taylor WR, He S, Levick WR, Vaney DI. Dendritic computation of direction selectivity by retinal ganglion cells. Science. 2000;289:2347–2350. doi: 10.1126/science.289.5488.2347. [DOI] [PubMed] [Google Scholar]
- 4.Oesch N, Euler T, Taylor WR. Direction-selective dendritic action potentials in rabbit retina. Neuron. 2005;47:739–750. doi: 10.1016/j.neuron.2005.06.036. [DOI] [PubMed] [Google Scholar]
- 5.Demb JB. Cellular mechanisms for direction selectivity in the retina. Neuron. 2007;55:179–186. doi: 10.1016/j.neuron.2007.07.001. [DOI] [PubMed] [Google Scholar]
- 6.Ding H, Smith RG, Poleg-Polsky A, Diamond JS, Briggman KL. Species-specific wiring for direction selectivity in the mammalian retina. Nature. 2016;535:105–110. doi: 10.1038/nature18609. [DOI] [PMC free article] [PubMed] [Google Scholar]
- 7.Kim JS, et al. Space-time wiring specificity supports direction selectivity in the retina. Nature. 2014;509:331–336. doi: 10.1038/nature13240. [DOI] [PMC free article] [PubMed] [Google Scholar]
- 8.Briggman KL, Helmstaedter M, Denk W. Wiring specificity in the direction-selectivity circuit of the retina. Nature. 2011;471:183–188. doi: 10.1038/nature09818. [DOI] [PubMed] [Google Scholar]
- 9.Park SJ, Kim IJ, Looger LL, Demb JB, Borghuis BG. Excitatory synaptic inputs to mouse on-off direction-selective retinal ganglion cells lack direction tuning. J Neurosci. 2014;34:3976–3981. doi: 10.1523/JNEUROSCI.5017-13.2014. [DOI] [PMC free article] [PubMed] [Google Scholar]
- 10.Angelaki DE, Hess BJ. Self-motion-induced eye movements: effects on visual acuity and navigation. Nat Rev Neurosci. 2005;6:966–976. doi: 10.1038/nrn1804. [DOI] [PubMed] [Google Scholar]
- 11.Angelaki DE, Cullen KE. Vestibular system: the many facets of a multimodal sense. Annu Rev Neurosci. 2008;31:125–150. doi: 10.1146/annurev.neuro.31.060407.125555. [DOI] [PubMed] [Google Scholar]
- 12.Yang G, Masland RH. Receptive fields and dendritic structure of directionally selective retinal ganglion cells. J Neurosci. 1994;14:5267–5280. doi: 10.1523/JNEUROSCI.14-09-05267.1994. [DOI] [PMC free article] [PubMed] [Google Scholar]
- 13.Cruz-Martin A, et al. A dedicated circuit links direction-selective retinal ganglion cells to the primary visual cortex. Nature. 2014;507:358–361. doi: 10.1038/nature12989. [DOI] [PMC free article] [PubMed] [Google Scholar]
- 14.Huberman AD, et al. Genetic identification of an On-Off direction-selective retinal ganglion cell subtype reveals a layer-specific subcortical map of posterior motion. Neuron. 2009;62:327–334. doi: 10.1016/j.neuron.2009.04.014. [DOI] [PMC free article] [PubMed] [Google Scholar]
- 15.Rivlin-Etzion M, et al. Transgenic mice reveal unexpected diversity of On-Off direction-selective retinal ganglion cell subtypes and brain structures involved in motion processing. J Neurosci. 2011;31:8760–8769. doi: 10.1523/jneurosci.0564-11.2011. [DOI] [PMC free article] [PubMed] [Google Scholar]
- 16.Chan YC, Chiao CC. The distribution of the preferred directions of the ON-OFF direction selective ganglion cells in the rabbit retina requires refinement after eye opening. Physiol Rep. 2013;1:e00013. doi: 10.1002/phy2.13. [DOI] [PMC free article] [PubMed] [Google Scholar]
- 17.Oyster CW. Analysis of image motion by rabbit retina. J Physiol (Lond) 1968;199:613–635. doi: 10.1113/jphysiol.1968.sp008671. [DOI] [PMC free article] [PubMed] [Google Scholar]
- 18.Oyster CW, Barlow HB. Direction-selective units in rabbit retina - distribution of preffered directions. Science. 1967;155:841–842. doi: 10.1126/science.155.3764.841. [DOI] [PubMed] [Google Scholar]
- 19.Kanjhan R, Sivyer B. Two types of ON direction-selective ganglion cells in rabbit retina. Neurosci Lett. 2010;483:105–109. doi: 10.1016/j.neulet.2010.07.071. [DOI] [PubMed] [Google Scholar]
- 20.Kwong JMK, Quan A, Kyung H, Piri N, Caprioli J. Quantitative analysis of retinal ganglion cell survival with rbpms immunolabeling in animal models of optic neuropathies. Invest Ophthalmol Visual Sci. 2011;52:9694–9702. doi: 10.1167/iovs.11-7869. [DOI] [PMC free article] [PubMed] [Google Scholar]
- 21.Trenholm S, Johnson K, Li X, Smith RG, Awatramani GB. Parallel Mechanisms Encode Direction in the Retina. Neuron. 2011;71:683–694. doi: 10.1016/j.neuron.2011.06.020. [DOI] [PMC free article] [PubMed] [Google Scholar]
- 22.Dhande OS, et al. Genetic dissection of retinal inputs to brainstem nuclei controlling image stabilization. J Neurosci. 2013;33:17797–17813. doi: 10.1523/jneurosci.2778-13.2013. [DOI] [PMC free article] [PubMed] [Google Scholar]
- 23.Kay JN, et al. Retinal ganglion cells with distinct directional preferences differ in molecular identity, structure, and central projections. J Neurosci. 2011;31:7753–7762. doi: 10.1523/jneurosci.0907-11.2011. [DOI] [PMC free article] [PubMed] [Google Scholar]
- 24.Simpson JI, Leonard CS, Soodak RE. The accessory optic system of rabbit. II. Spatial organization of direction selectivity. J Neurophysiol. 1988;60:2055–2072. doi: 10.1152/jn.1988.60.6.2055. [DOI] [PubMed] [Google Scholar]
- 25.Simpson JI, Leonard CS, Soodak RE. The accessory optic system - Analyzer of self motion. Ann N Y Acad Sci. 1988;545:170–179. doi: 10.1111/j.1749-6632.1988.tb19562.x. [DOI] [PubMed] [Google Scholar]
- 26.Wallace DJ, et al. Rats maintain an overhead binocular field at the expense of constant fusion. Nature. 2013;498:65–69. doi: 10.1038/nature12153. [DOI] [PubMed] [Google Scholar]
- 27.Nilsson DE. The evolution of eyes and visually guided behaviour. Philos Trans R Soc Lond B Biol Sci. 2009;364:2833–2847. doi: 10.1098/rstb.2009.0083. [DOI] [PMC free article] [PubMed] [Google Scholar]
- 28.Ivanova E, Toychiev AH, Yee CW, Sagdullaev BT. Optimized protocol for retinal wholemount preparation for imaging and immunohistochemistry. J Vis Exp. 2013:e51018. doi: 10.3791/51018. [DOI] [PMC free article] [PubMed] [Google Scholar]
- 29.Naarendorp F, et al. Dark light, rod saturation, and the absolute and incremental sensitivity of mouse cone vision. J Neurosci. 2010;30:12495–12507. doi: 10.1523/jneurosci.2186-10.2010. [DOI] [PMC free article] [PubMed] [Google Scholar]
- 30.Govardovskii VI, Fyhrquist N, Reuter T, Kuzmin DG, Donner K. In search of the visual pigment template. Vis Neurosci. 2000;17:509–528. doi: 10.1017/s0952523800174036. [DOI] [PubMed] [Google Scholar]
- 31.Szel A, et al. Unique topographic separation of 2 spectral classes of cones in the mouse retina. J Comp Neurol. 1992;325:327–342. doi: 10.1002/cne.903250302. [DOI] [PubMed] [Google Scholar]
- 32.Dai X, et al. The frequency-response electroretinogram distinguishes cone and abnormal rod function in rd12 mice. PLoS ONE. 2015;10:e0117570. doi: 10.1371/journal.pone.0117570. [DOI] [PMC free article] [PubMed] [Google Scholar]
- 33.Borghuis BG, Marvin JS, Looger LL, Demb JB. Two-photon imaging of nonlinear glutamate release dynamics at bipolar cell synapses in the mouse retina. J Neurosci. 2013;33:10972–10985. doi: 10.1523/Jneurosci.1241-13.2013. [DOI] [PMC free article] [PubMed] [Google Scholar]
- 34.Borghuis BG, et al. Imaging light responses of targeted neuron populations in the rodent retina. J Neurosci. 2011;31:2855–2867. doi: 10.1523/jneurosci.6064-10.2011. [DOI] [PMC free article] [PubMed] [Google Scholar]
- 35.Kim IJ, Zhang YF, Yamagata M, Meister M, Sanes JR. Molecular identification of a retinal cell type that responds to upward motion. Nature. 2008;452:478–U411. doi: 10.1038/nature06739. [DOI] [PubMed] [Google Scholar]
- 36.Chen TW, et al. Ultrasensitive fluorescent proteins for imaging neuronal activity. Nature. 2013;499:295–300. doi: 10.1038/nature12354. [DOI] [PMC free article] [PubMed] [Google Scholar]
- 37.Kass RE, Raftery AE. Bayes Factors. J Amer Statist Assoc. 1995;90:773–795. doi: 10.2307/2291091. [DOI] [Google Scholar]
- 38.Venkataramani S, Taylor WR. Orientation selectivity in rabbit retinal ganglion cells is mediated by presynaptic inhibition. J Neurosci. 2010;30:15664–15676. doi: 10.1523/Jneurosci.2081-10.2010. [DOI] [PMC free article] [PubMed] [Google Scholar]
- 39.Maloney LT. Evaluation of linear-models of surface spectral reflectance with small numbers of parameters. J Opt Soc Am A Opt Image Sci Vis. 1986;3:1673–1683. doi: 10.1364/Josaa.3.001673. [DOI] [PubMed] [Google Scholar]
- 40.Oommen BS, Stahl JS. Eye orientation during static tilts and its relationship to spontaneous head pitch in the laboratory mouse. Brain Research. 2008;1193:57–66. doi: 10.1016/j.brainres.2007.11.053. [DOI] [PMC free article] [PubMed] [Google Scholar]
- 41.Oh SW, et al. A mesoscale connectome of the mouse brain. Nature. 2014;508:207–214. doi: 10.1038/nature13186. [DOI] [PMC free article] [PubMed] [Google Scholar]
- 42.Yonehara K, et al. Identification of retinal ganglion cells and their projections involved in central transmission of information about upward and downward image motion. Plos One. 2009;4 doi: 10.1371/journal.pone.0004320. doi:e432010.1371/journal.pone.0004320. [DOI] [PMC free article] [PubMed] [Google Scholar]
Associated Data
This section collects any data citations, data availability statements, or supplementary materials included in this article.


