Abstract.
Large variability in computed tomography (CT) radiomics feature values due to CT imaging parameters can have subsequent implications on the prognostic or predictive significance of these features. Here, we investigated the impact of pitch, dose, and reconstruction kernel on CT radiomic features. Moreover, we introduced correction factors to reduce feature variability introduced by reconstruction kernels. The credence cartridge radiomics and American College of Radiology (ACR) phantoms were scanned on five different scanners. ACR phantom was used for 3-D noise power spectrum (NPS) measurements to quantify correlated noise. The coefficient of variation (COV) was used as the variability assessment metric. The variability in texture features due to different kernels was reduced by applying the NPS peak frequency and region of interest (ROI) maximum intensity as correction factors. Most texture features were dose independent but were strongly kernel dependent, which is demonstrated by a significant shift in NPS peak frequency among kernels. Percentage improvement in robustness was calculated for each feature from original and corrected %COV values. Percentage improvements in robustness of 19 features were in the range of 30% to 78% after corrections. We show that NPS peak frequency and ROI maximum intensity can be used as correction factors to reduce variability in CT texture feature values due to reconstruction kernels.
Keywords: reconstruction kernel, radiation dose, pitch, computed tomography, noise power spectrum, peak frequency, radiomics
1. Introduction
Radiomics is a collection of many distinct data processing techniques with the aim of extracting quantitative information from medical images for subsequent model building.1 These techniques have shown promise as a tool for guiding treatment decisions in oncology.2–4 Studies have highlighted the importance of texture analysis by connecting cancer phenotypes captured by computed tomography (CT) and other imaging modalities with underlying gene expression profiles in several cancer types.5–8 The robustness of radiomic features has been a topic of recent research.9,10 Variations in image acquisition and reconstruction parameters using one scanner or between different scanners may affect the values of the extracted radiomic features. The standardization of CT parameters and/or radiomics techniques may be necessary to the successful application of extractable imaging features as biomarkers for tumor phenotype, diagnosis, prognosis, and decision support.11 One way to test the robustness of these features with varying acquisition and reconstruction parameters is to evaluate their fundamental characteristics using texture phantoms.12–14 Texture phantoms are advantageous since they provide a stable geometry and durable physical characteristics for testing the robustness of radiomic features as a function of CT parameters.
The impact of reconstruction kernel, radiation dose, and pitch on CT radiomic features is not well established. A recent report by Zhao et al.9 recommended phantom studies for the investigation of pitch, mAs, and reconstruction kernel impact on features on a multiscanner scale. Recent studies reported that radiomic features were significantly affected by different reconstruction kernels.15–17 Another study investigated the effect of dose reduction and reconstruction method on texture features and suggested that variability in CT texture features might be due to acquisition and reconstruction process rather than to changes in nodules themselves.18 Recently, Solomon et al.19 studied the effects of acquisition settings and reconstruction kernels on radiomic feature values in liver lesions, lung nodules, and kidney stones and found significant variation due to these parameters. All of these studies focused on variation in features but did not address how the inherent CT image noise due to dose, reconstruction kernel, and other acquisition and reconstruction parameters might be used to reduce variability.
The mAs setting (dose), the pitch, and the reconstruction kernel influence the noise texture of a CT image. Image noise is inversely proportional to the square root of the mAs for filtered back-projection (FBP)-based reconstructions, while pitch is directly related to radiation dose. Reconstruction kernels determine the smoothness or sharpness of CT images. Smoother kernels use low-pass filters to block high-frequency content to have better low-contrast resolution and low noise. In contrast, sharper kernels preserve high-frequency content for better spatial resolution at the expense of more noise in the final CT image.
When the noise value in each voxel is dependent on the noise values in the neighboring voxels then the noise is said to be correlated. Both the dose level and the kernel produce correlated noise texture through the reconstruction process. Texture features might be sensitive to this correlated noise in CT image because most of these features describe spatial relationships of voxel intensities within a region of interest (ROI). For example, features based on gray-level cooccurrence matrices (GLCM) characterize the texture of an image by counting how often pairs of voxels with the same gray level in certain spatial relationship occur within a ROI. Therefore, a fundamental question is to what extend GLCM features describe underlying texture information content of a CT image. This can be investigated by systemically quantifying the noise texture produced by different reconstruction kernels and tube current settings using radiomics phantoms.
The noise power spectrum (NPS) is an analytical tool for quantifying the noise texture of a CT image. The frequency fluctuations in an image and other physical factors affecting image quality such as gain, spatial resolution, and additive noise could be quantified by the NPS.20 NPS measurements for a CT image were reported as early as 1978 by Riederer et al.21 Many investigators used NPS metric as a task-based approach to characterize the noise texture and noise magnitude in CT.22–24 For CT images reconstructed with different kernels, noise increases strongly for small improvements in sharpness.25 Solomon et al.26 investigated how image noise changes with varying dose modulation across two CT scanners. These authors also used the peak frequency and root mean square difference for comparing the noise texture of various kernels across two scanners and suggested that the noise texture from a kernel was related to the peak frequency of the measured NPS.27 As texture features in CT radiomics are significantly affected by low-frequency (smooth kernels) and high-frequency (sharp kernels) noise,15,16 it would be useful to correlate these noise textures (and their peak frequencies) with the numerical values of texture features. Such a correlation would help in establishing a mathematical relationship between features values and correlated noise. Typically, reconstruction kernels in CT are vendor specific; thus, it would also be useful to evaluate how feature values correlate with noise texture across vendors. In this study, credence cartridge radiomic (CCR) texture phantom12 images generated using different kernels and tube currents for several CT scanners were used to extract radiomic features. The standard American College of Radiology (ACR) phantom was imaged under the same conditions to quantify the correlated noise texture from NPS measurements.
The purpose of this study was to characterize how correlated noise texture due to different kernels influences the variability of texture features. We designed experiments to evaluate texture features as a function of kernel strength, radiation dose, and pitch. Noise textures generated by different kernel and mAs settings were quantified using the NPS for several CT scanners. We identified features that showed a trend with kernel strength and reduced the variability in the numerical values of these features by applying correcting factors based on the NPS peak frequency and ROI maximum intensity.
2. Methods
2.1. Acquisition and Reconstruction
The CCR phantom12 and the standard ACR CT accreditation phantom were scanned on five different scanners from three different manufacturers: General Electric (GE), Siemens, and Philips Healthcare. The CCR phantom was used for extracting radiomic features and the ACR phantom was used to quantify noise texture for different reconstruction kernels. For consistency, the same acquisition and reconstruction parameters were used for both feature extraction and noise quantification. The variation of reconstruction kernels available on the five CT scanners was employed to obtain smoothest to sharpest phantom images. The term “kernel strength” throughout this paper represents a kernel scale from very smooth to very sharp images. Details of the kernels used as well as other CT parameters for each scanner are listed in Table 1.
Table 1.
CT scanners, acquisition, and reconstruction parameters for varying reconstruction kernels.
| CT scanner | kVp | mAs | Recon. FOV (mm) | Scan type | Slice thickness, recon. interval | Detector configuration (mm) | Reconstruction kernel (variable) |
|---|---|---|---|---|---|---|---|
| GE Discovery STE | 120 | 65 | 250 | Helical | 1.25 mm, adjacent | Det. coverage = 40 | Soft, standard, detail, lung, and edge |
| Philips Brilliance 64 | 120 | 65 | 250 | Helical | 1.5 mm, adjacent | Smooth (A), standard (B), sharp(C), lung enhanced (L), and -sharp (YA) | |
| Siemens Definition AS | 120 | 65 | 250 | Helical | 1.5 mm, adjacent | I26f-2, I30f-2, I40f-2,I44f-2, I50f-2, and I70f-2 | |
| Siemens Sensation 64 | 120 | 65 | 250 | Helical | 1.5 mm, adjacent | B10f, B20f, B31f, B50f, B60f, and B70f | |
| Siemens Sensation 40 | 120 | 65 | 250 | Helical | 1.5 mm, adjacent | B10f, B20f, B31f, B50f, B60f, and B70f |
To see the effect of radiation dose and pitch variation on features, CCR phantom scans were acquired for different mAs and pitch settings as shown in Tables 2 and 3. The dose modulation or automatic exposure control options available on the CT control panel were not used for this study. ACR phantom scans were also acquired for different radiation dose settings for NPS measurements, and the same acquisition parameters were used for extracting radiomic features as listed in Table 2.
Table 2.
CT Scanners, acquisition, and reconstruction parameters used for varying radiation dose (mAs).
| CT scanner | kVp | Kernel | Recon. FOV (mm) | Scan type | Slice thickness, reconstruction interval | Detector configuration (mm) | Radiation dose (mAs) (variable) |
|---|---|---|---|---|---|---|---|
| GE Discovery STE | 120 | Standard | 250 | Helical | 1.25 mm, adjacent | Det. coverage= 40 | 50, 100, 200, 300, 400 |
| Philips Brilliance 64 | 120 | Standard (B) | 250 | Helical | 1.5 mm, adjacent | 50, 100, 200, 300, 400 | |
| Siemens Definition AS | 120 | I31f-2 | 250 | Helical | 1.5 mm, adjacent | 50, 100, 200, 300, 400 | |
| Siemens Sensation 64 | 120 | B31f | 250 | Helical | 1.5 mm, adjacent | 50, 100, 200, 300, 400 |
Table 3.
CT Scanners, acquisition, and reconstruction parameters used for varying pitches.
| CT scanner | kVp | mAs | Recon. FOV (mm) | Scan type | Recon. kernel | Slice thickness, recon. interval | Detector configuration (mm) | Pitch (variable) |
|---|---|---|---|---|---|---|---|---|
| Philips Brilliance 64 | 120 | 65 | 250 | Helical | Standard (B) | 1.5 mm, adjacent | 0.6, 0.7, 0.8, 0.9, 1.0, 1.1, 1.2, 1.3 | |
| Siemens Definition AS | 120 | 65 | 250 | Helical | I31f-2 | 1.5 mm, adjacent | 0.6, 0.7, 0.8, 0.9, 1.0, 1.1, 1.2, 1.3, 1.4 | |
| Siemens Sensation 64 | 120 | 65 | 250 | Helical | B31f | 1.5 mm, adjacent | 0.6, 0.7, 0.8, 0.9, 1.0, 1.1, 1.2, 1.3, 1.4 |
2.2. Feature Extraction and Intrascanner Variability Assessment
An advanced imaging software package (Mirada RTx 1.6, Mirada Medical, Oxford, United Kingdom) was used for importing, exporting, and contouring purposes. An automatic contouring tool in Mirada RTx was used to contour three-dimensional (3-D) ROIs. A spherical ROI of was contoured on the central region of the shredded rubber cartridge of the CCR phantom12 and used for all mAs, pitch, and kernel settings for all scanners. The rubber cartridge was chosen because it was reported to have HU value characteristics similar to the nonsmall cell lung cancer tumors.12 Eighty-eight features14 including shape (11), intensity histogram (16), GLCM (26), GLRLM (11), GLSZM (11), NGTDM (05), and fractal dimensions (8) were extracted using an in-house program. Intensity volume histograms were used to calculate the first-order features. GLCM-based second-order features were initially developed by Haralick et al.28,29 Volumetric interpretations of GLCM features were proposed by Kurani et al.30 GLCM features describe spatial relationships of voxel intensities within an ROI; they characterize the specific texture of an image by counting how often pairs of voxels with the same gray level in certain spatial relationship occur in an ROI.31 GLRLM features were implemented in our program according to the definitions provided by Galloway,32 Dasarathy and Holder,33 and Chu et al.34 Texture features based on NGTDM and GLSZM were first developed by Amadasun and King35 and Thibault et al.,36 respectively. Fractal dimensions features were calculated as described in Sarkar and Chaudhuri37 and Jin and Ong.38 The intensities of image voxels were discretized using 64 equispaced gray levels for calculating all texture features. The absolute value of percent coefficient of variation was used as a metric to assess the intrascanner variability for each feature due to pitch, reconstruction kernel, and radiation dose. All features were classified into three groups based on %COV: very small (), small (), and large () range of variation.
2.3. Three-Dimensional Noise Power Spectrum
Two consecutive scans of the ACR phantom at each of kernel and mAs setting were used for the quantification of noise texture. 3-D NPS was measured20 using the equation
| (1) |
where , , and are the spatial frequencies () in the -, -, and -directions, respectively. Likewise , , and are the pixels sizes (mm) and , , and are the number of pixels in the corresponding directions in the ROI. denotes the 3-D Fourier transform, and is the ensemble mean of all ROIs. and are the voxel values (HU) of an ROI at position for the first and second scans. Subtraction of the first scan from the second would produce a detrended dataset in which the voxel values have zero mean and only image noise is present.
The 3-D NPS was measured using images from the third module of ACR phantom following the previously described methodology and freely available MATLAB code by Friedman et al.39 In our case, a voxel size of and an ROI size of were used for the Siemens and Philips scanners, whereas a voxel size of and an ROI size of were used for the GE scanners. Since voxel size variation has been shown to significantly impact numerical values of some radiomic features,14 the same voxel size was used for both CCR and ACR phantoms in this study. Peak frequency values for different kernels were calculated by fitting a mathematical function to each NPS curve and finding the peak frequency value corresponding to maximum NPS magnitude.
2.4. Noise Power Spectrum Peak Frequency and Maximum Intensity Corrections
Nineteen texture features based on GLCM, GLRLM, and NGTDM were computed using modified feature definitions that incorporate the peak frequency () and maximum intensity () as correction factors. That is,
| (2) |
| (3) |
where and are the exponents, , , , or , and , , , or depending on the feature. The symbol is the corrected feature value, and is the original feature value. A constant number of gray level, , was used. Voxel size “” was constant for Philips and Siemens scanners. However, a normalization factor with respect to voxel size was applied for images from the GE scanner. The only variable was the kernel strength “” that varied from smoothest to sharpest for all CT scanners. The symbol, , is the maximum voxel intensity within the rubber spherical ROI at kernel strength . The NPS peak frequency and ROI maximum intensity correction factors were further tested for a larger spherical rubber cartridge ROI of .
The ranges of and in Eqs. (2) and (3) were determined by plotting radiomic feature values as a function of kernel strength and then analyzing the mathematical trends that each feature follows. In a similar way, feature values were also plotted as a function of peak frequencies and maximum intensities obtained from the ROI to determine their behavior. Using the extracted feature values from rubber ROI and peak frequencies from noise power spectra measurements at respective kernels, a corresponding correction factor was identified for each feature. For example, a correction factor for GLCM-contrast (Table 5) can be obtained by plugging in Eq. (2). Similarly, the corrections factors for all 19 texture features can be obtained by plugging different values of and in Eqs. (2) and (3).
Table 5.
GLCM feature definitions, NPS peak frequency, and maximum intensity corrections.
| Feature | Original feature formula, | Corr. feature formula | Corr. feature formula |
|---|---|---|---|
| Energy | |||
| Contrast | |||
| Local homogeneity | |||
| Difference entropy | |||
| Sum variance | |||
| Inverse variance | , | ||
| Inverse variance P | |||
| Cluster tendency | |||
| Cluster prominence | |||
| Dissimilarity | |||
| Correlation | |||
| Information correlation 2 | |||
Note: is the cooccurrence matrix. is the number of discrete gray levels. is the ’th entry obtained by summing the rows of , and is the ’th entry obtained by summing the columns of . , , and are the mean of , and , respectively. and are the standard deviation of and , respectively.
2.5. Percent Improvement in Feature Robustness
The absolute value of the percent decrease in feature variability (or percentage improvement in feature robustness) for each texture feature was calculated using the equation
| (4) |
where is the original percent COV calculated for each feature from all CT datasets acquired with different kernels for all scanners. Likewise, is the corrected percent COV computed after applying NPS peak frequency and ROI maximum intensity corrections using Eqs. (2) and (3).
3. Results
3.1. Intrascanner Variability Assessment
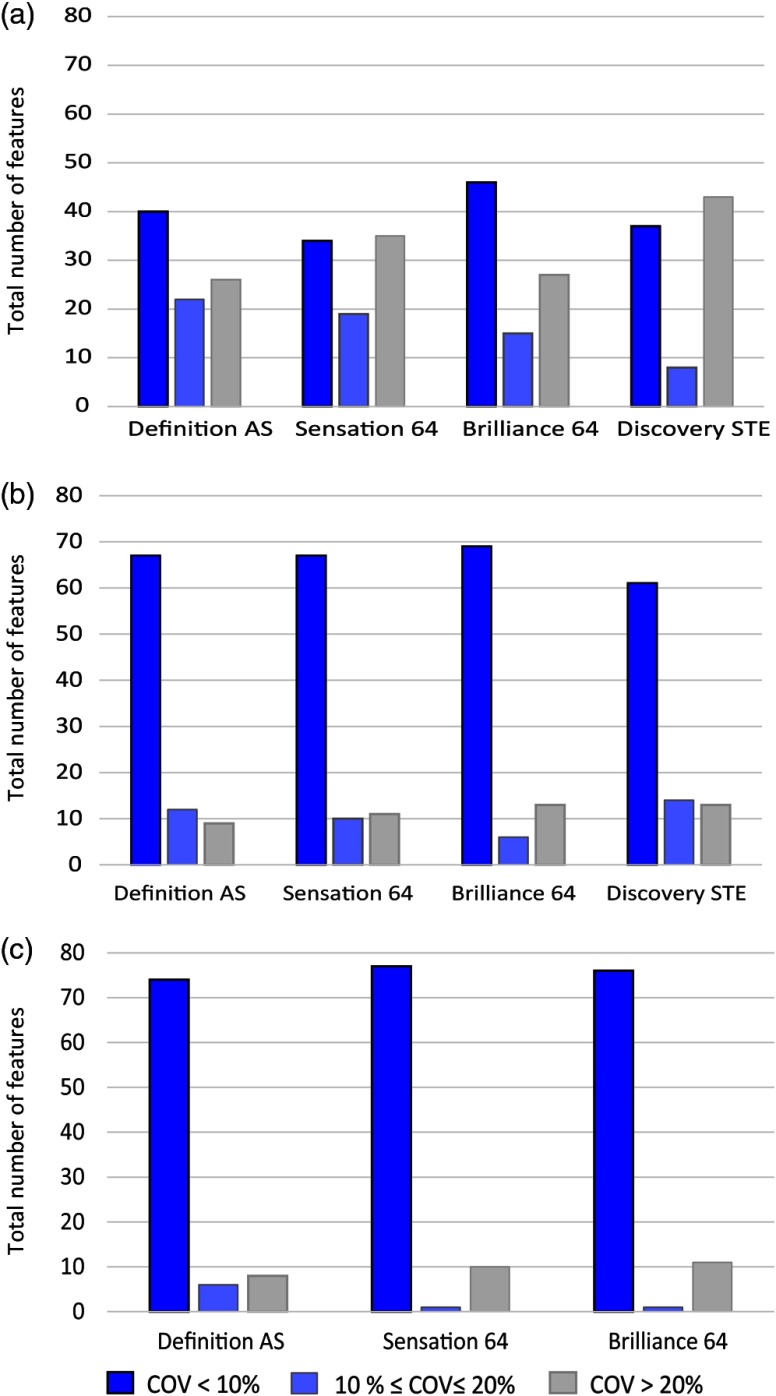
The intrascanner variability for 88 radiomic features due to varying reconstruction kernel, mAs, and pitch variation is shown in Fig. 1. For varying kernels, 30% of the total features had large variability () for all scanners as shown in Fig. 1(a). The highest variability was found for GE Discovery STE scanner for which almost half of the features had . A different variability trend was observed for features as a function of radiation dose and pitch. For both radiation dose and pitch, 80% to 90% of features were reproducible () for all scanners as shown in Figs. 1(b) and 1(c), respectively. Most GLSZM features and NGTDM-Busyness were found to have large variation () with pitch and mAs settings.
Fig. 1.
Intrascanner variability in radiomics features due to different CT parameters. 30% to 50% of total features had large variability () for (a) varying kernels; however, (b) for radiation dose and (c) pitch, only 10% to 15%, respectively, of features had variability .
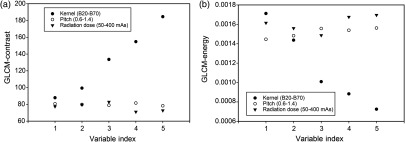
Figure 2 shows the GLCM-based energy and contrast features as a function of pitch, dose, and kernels for the Siemens Sensation 64 scanner. The variable index (1 to 5) on the -axis represents values of pitch, dose, and strength of the kernel. Numerical values for both features were found to be independent of variation in pitch and radiation dose. However, these two features were highly dependent on reconstruction kernels. This is likely due to differences in noise texture in CT images produced by different kernels. In contrast, variation in dose and pitch did not affect noise texture.
Fig. 2.
(a) Contrast and (b) energy from GLCM as a function of kernel strength, pitch, and dose for Siemens Sensation 64 CT scanner. Kernels are indicated by solid circles and vary from smooth (1) to very sharp (5), namely, B20f, B31f, B50f, B60f, and B70f. Pitch is depicted by open circles varying from 0.6 to 1.4 in steps of 0.2, and mAs is depicted by solid triangles with values of 50, 100, 200, 300, and 400. Numerical values for both GLCM features are linearly correlated with kernel strength but are almost independent of pitch and dose.
3.2. Noise Power Spectrum
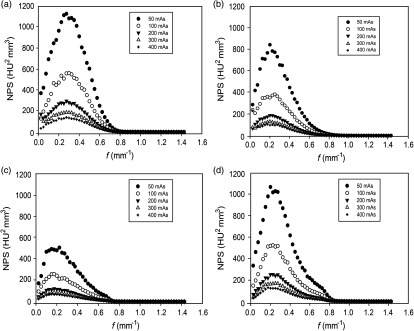
Figure 3 shows 3-D NPS as a function of spatial frequency at various “mAs” for four different CT scanners. As expected, noise magnitude decreases as radiation dose increases from 50 to 400 mAs for all scanners. The shape of the NPS curve was almost independent of radiation dose variation, that is, the peak frequency was nearly the same for all “mAs” settings. The peak frequency shifted slightly across different CT scanners, ranging from 0.15 to , with the lowest and highest values for Definition AS and Discovery STE, respectively. The important point here is that Siemens Definition AS scanner uses SAFIRE (sinogram affirmed iterative reconstruction), while all other scanners use FBP for image reconstruction. The iterative reconstruction algorithm typically provides the same image quality as FBP at lower radiation doses. The shape of NPS was consistent with that of expected FBP reconstruction as depicted by three orthogonal planes of NPS measured from the third module of the ACR phantom.39
Fig. 3.
Measured 3-D NPS as a function of spatial frequency for various mAs settings for four CT scanners. (a) GE Discovery STE, (b) Philips Brilliance 64, (c) Siemens Definition AS, and (d) Siemens Sensation 64. Most texture features were robust across varying dose levels as well as across different CT scanners as indicated by the small variation in peak frequencies.
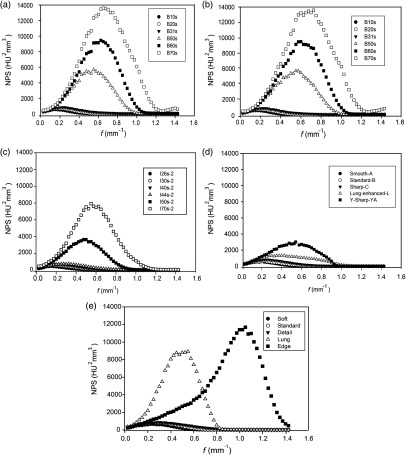
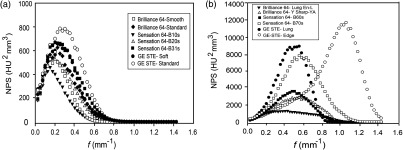
Noise power spectra as a function of spatial frequency for different kernels for all scanners are shown in Fig. 4. Note that the peak frequency gradually shifts to higher values as the kernel strength becomes sharper. The calculated peak frequency values for all kernels are listed in Table 4. For smoother kernels, there was a slight shift in peak frequency as kernel strength varies from B10s to B31s for the Sensation 64 scanner or from soft to standard for the GE scanner as shown in Fig. 5(a). However, peak frequency increases abruptly for sharper kernels as shown in Fig. 5(b). In particular, the peak frequency value for GE Edge kernel was almost four times higher than that for the Soft kernel. This shift of the NPS curve to higher frequencies with kernel strength is due to the correlated noise texture in the CT image. Texture features based on GLCM are sensitive to this correlated noise introduced through the reconstruction process but are independent of correlated noise introduced through the acquisition process (i.e., mAs settings).
Fig. 4.
Measured NPS as a function of spatial frequency for five CT scanners. (a) Siemens Sensation 64, (b) Siemens Sensation 40, (c) Siemens Definition AS, (d) Philips Brilliance 64, and (e) GE Discovery STE. For each scanner, the peak frequency slightly shifted to the right as kernel strength changed from smooth to sharp reconstruction. The large shift in the peak frequency was found for the Edge kernel of the GE Discovery scanner (a PET/CT scanner).
Table 4.
Peak frequencies for different reconstruction kernels from NPS measurements for all CT scanners.
| CT scanners | Peak frequency, () | |||||
|---|---|---|---|---|---|---|
| Siemens Definition AS | I26s-2 | I30s-2 | I40s-2 | I44s-2 | I50s-2 | I70s-2 |
| 0.15 | 0.15 | 0.20 | 0.33 | 0.50 | 0.55 | |
| Siemens Sensation 64 | B10s | B20s | B31s | B50s | B60s | B70s |
| 0.15 | 0.20 | 0.25 | 0.55 | 0.63 | 0.65 | |
| Siemens Sensation 40 | B10s | B20s | B31s | B50s | B60s | B70s |
| 0.15 | 0.20 | 0.23 | 0.55 | 0.60 | 0.73 | |
| GE Discovery STE | Soft | Standard | Detail | Lung | Edge | — |
| 0.23 | 0.25 | 0.30 | 0.55 | 1.05 | ||
| Philips Brilliance 64 | Smooth (A) | Standard (B) | Sharp (C) | Lung enh. (L) | sharp (YA) | — |
| 0.20 | 0.23 | 0.25 | 0.43 | 0.55 | ||
Fig. 5.
Measured 3-D NPS as a function of spatial frequency for (a) smoother kernels and (b) sharper kernels for three CT scanners. For low kernel strengths, only a slight shift in peak frequency was observed while, for high kernel strengths, the shift in peak frequency was significant, especially for GE edge kernel. Likewise, variability in CT texture features was found to be less pronounced for soft kernels than for sharper kernels. [Note the different scales along vertical axis in panels (a) and (b)].
3.3. Peak Frequency and Maximum Intensity Corrections
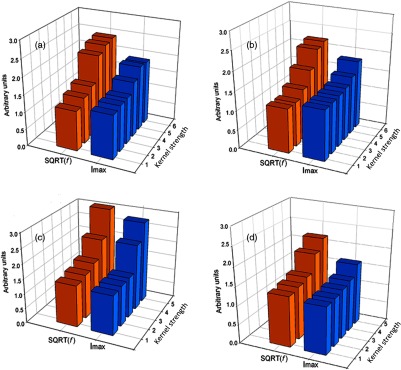
The correction factors based on peak frequency and maximum intensity for 19 features from different texture feature groups are shown in Tables 5 and 6. After a thorough investigation into NPS peak frequencies and maximum voxel intensities from the rubber cartridge ROI for all kernels, we found that the square root of the peak frequency was related to the maximum voxel intensity as shown in Fig. 6. Two features, GLCM-inverse variance and GLCM coarseness, were previously found to be voxel size-dependent.14 Therefore, a correction factor with respect to voxel size along with peak frequency or ROI maximum intensity was also applied to these two features. The peak frequency and maximum intensity corrections [Eqs. (2) and (3)] were applied to all of the features that had with varying kernels (Fig. 1). However, the features that showed percent improvement were listed in Table 5 and 6. NGTDM-busyness and most GLSZM features, namely, large area emphasis, low intensity emphasis, low intensity small area emphasis, low intensity large area emphasis, and high intensity low area emphasis, did not improve after corrections.
Table 6.
GLRLM, GLSZM, and NGTDM feature definitions and NPS peak frequency and maximum intensity corrections.
| Features | Original feature formula | Corr. feature formula | Corr. feature formula |
|---|---|---|---|
| GLRLM features | |||
| Low gray-level run emphasis | |||
| Short run low gray-level emphasis | |||
| Long run low gray-level emphasis | |||
| GLSZM Features | |||
| Small-area emphasis | |||
| High-intensity small-area emphasis | , , | ||
| Size-zone variability | |||
| NGTDM feature | |||
| Coarseness | |||
GLRLM: is the ’th entry in the given run-length matrix, and is the number of discrete gray levels in the image. is the longest run, and n is the total number of runs.
GLSZM: In size zone matrix rows indicate gray levels and columns indicating zone sizes. is the number of gray levels, and the largest zone size is indicated by m. is the total number of unique connected zones.
NGTDM: is the probability of occurrence of voxel of intensity , and is the NGTDM value of intensity . is the highest gray-level value present in the ROI.
Fig. 6.
Relationship between NPS peak frequency (orange bars) and maximum voxel intensity (blue bars) as a function of kernel strength for four CT scanners (a) Sensation 64, (b) Definition AS, (c) GE Discovery STE, and (d) Brilliance 64. Peak frequency and maximum intensity are linearly related with each other for the GE Discovery STE scanner. The change in both frequency and intensity was less pronounced with kernel strength for the Philips 64 scanner, which explains why more features were robust for this scanner. Peak frequency changed more abruptly for the Siemens scanners especially for sharper kernels.
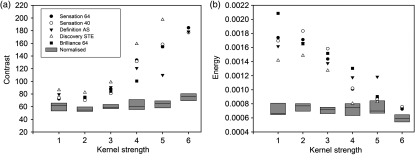
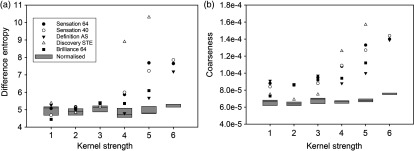
Two texture features, GLCM-energy and GLCM-contrast, as a function of kernel strength for different scanners are shown in Fig. 7. Without peak frequency corrections, both features were highly correlated with kernel strength, but, after applying peak frequency corrections, both features values were more reproducible with kernel strength. Similar to NPS peak frequency, maximum voxel intensity within an ROI was independent of radiation dose but dependent on kernel strength. GLCM-difference entropy and NGTDM-coarseness after maximum intensity corrections were nearly independent of kernel strength as shown in Fig. 8.
Fig. 7.
Texture feature values computed from original and corrected definitions as a function of kernel strength and different scanners. Corrected feature values are shown by the box plot. Middle, lower, and upper lines in the box indicate median, first quartile, and third quartile, respectively. Without correction, both (a) GLCM-contrast and (b) GLCM-energy showed dependence on kernel strength but, after NPS peak frequency corrections, both features were much less dependent on kernel strength.
Fig. 8.
Texture features values computed from original and corrected feature definitions as a function of kernel strength and different scanners. Corrected feature values are shown by box plots. Middle, lower, and upper lines of the boxes indicate median, first quartile, and third quartile, respectively. Without correction, both (a) GLCM-difference entropy and (b) NGTDM-coarseness showed dependence on kernel strength, but, after correction by maximum voxel intensity, the features are much less dependent of kernel strength.
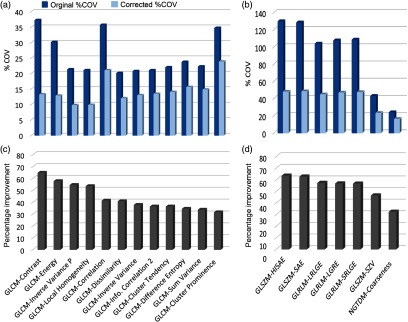
The calculated %COV values for original and frequency corrected features and the corresponding percent improvements for 19 texture features are shown in Fig. 9. The largest improvement, 64% according to Eq. 2 (), was for GLCM-contrast. Most of the GLCM features had before correction; however, after correction, %COV values were within 20% range [Fig. 9(a)]. Initial %COV values for some GLSZM and GLRLM features [Fig. 9(b)] were relatively high as compared with GLCM features, but, after applying correction factors, variability range was within 45%. GLCM-cluster prominence and NGTDM-coarseness were the least improved as improvement percentage was about 30% for these features.
Fig. 9.
Peak frequency corrections for 19 texture features. Panels (a) and (b) show the absolute value of %COV for all reconstruction kernels before (blue bars) and after (light blue bars) peak frequency corrections. Panels (c) and (d) show corresponding percent improvement [Eq. (4)] in each feature as a result of the corrections. GLCM-contrast showed the highest improvement, whereas GLCM-cluster prominence showed the least improvement in reproducibility after corrections. [Note the different scales along vertical axis in panels (a) and (b)].
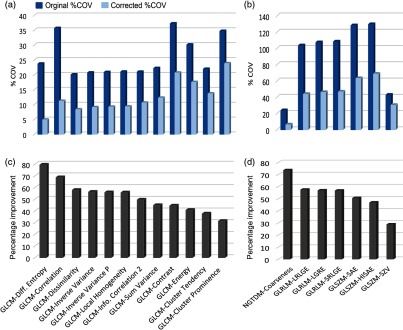
Figure 10 shows the percentage improvement in 19 texture features as a result of maximum intensity corrections. The largest improvement was for GLCM-difference entropy with a percentage improvement of 78%. The second most improved feature was NGTDM-coarseness with a percentage improvement of 72%. After corrections, both GLCM-difference entropy and NGTDM-coarseness became robust with kernel strength as both had %COV values . The least improvement as a result of intensity corrections was found in size zone variability (SZV) from the GLSZM group. Similar results were obtained for the 19 texture features extracted from the bigger sized ROI’s of volume following NPS peak frequency and ROI maximum intensity corrections.
Fig. 10.
Maximum intensity corrections for 19 texture features. Panels (a) and (b) show the absolute value of %COV for all reconstructions kernels before (blue bars) and after (light blue bars) maximum intensity corrections. Panels (c) and (d) show corresponding percent improvement in each feature as a result of corrections. Difference entropy from GLCM and coarseness from NGTDM showed highest percent improvement of 78% and 72%, respectively. SZV from GLSZM showed least improvement in reproducibility after corrections. (Note the different scales along vertical axis in panels a and b).
4. Discussion
Extraction and analysis of imaging features from medical images to be used as imaging biomarkers is currently an active area of research. However, before features can be used for medical applications, they must be found to be robust to common conditions and variables such as acquisition and reconstruction parameters. For example, some radiomic features such as intensity-energy, GLRLM-GLNU, GLRLM-RLNU, and NGTDM-coarseness were suggested as potential imaging biomarkers in recent radiomics research;3,40–42 however, these features were recently found to be dependent on voxel size.14 Therefore, it is important to evaluate feature robustness for common imaging parameters and devise methods to reduce or eliminate feature variability. In this study, we investigated the variability of 88 radiomic features due to changes in radiation dose (mAs), pitch, and reconstruction kernel across different CT scanners from three manufacturers. In particular, we evaluated the variability in texture features due to reconstruction kernels and dose using NPS measurements. In our analysis, we derived correction factors for 19 texture features to reduce their variability with respect to kernel strength, one of the most frequently varied parameters in computed tomography.
The intrascanner variability in CT features due to pitch and dose was significantly less as compared to variability due to reconstruction kernels. Except for most of the GLSZM features and the NGTDM-busyness feature, 80% to 90% of the features studied were robust to pitch and mAs variations (Fig. 1). However, 30% to 50% of the features had variability () for changes in kernel strength depending on the particular CT scanner used (Fig. 1). We found that some texture features were almost independent of dose and pitch variations; however, they were strongly dependent on reconstruction kernel (Fig. 2) for all CT scanners. The dependence on kernel strength suggests that features were strongly affected by the image reconstruction process (kernels) and less by the image acquisition process (radiation dose and pitch). Both reconstruction kernels and tube current produced correlated noise texture in CT images; however, the spatial frequency distribution in CT images was significantly more affected by the choice of the reconstruction kernel.
The peak frequency of the NPS was nearly independent of radiation dose variation and slightly dependent on scanner variation (Fig. 3). This is in agreement with an earlier report by Li et al.22 In contrast, the choice of reconstruction kernel shifted peak frequencies significantly (Fig. 4). The shift in peak frequency was less pronounced for softer kernels and more pronounced for sharper kernels (Fig. 5). These results were in agreement with earlier study for sharper kernels for GE and Siemens scanners by Solomon et al.27 NPS analysis for a Philips scanner for different dose and kernel settings was reported for the first time in this work as far as we know. Tube current variation did not change the spatial frequency distribution or correlated noise texture. However, the purpose of most reconstruction kernels is to render images with a certain level of smoothness or sharpness; consequently, kernels change the spatial frequency characteristics of the final CT images. Sharper kernels preserve higher spatial frequencies producing more high contrast resolution and consequently render more noise to the images. In contrast, smoother kernels use low-pass filters to block high frequencies to provide better low-contrast resolution and lower noise. This is why we have used the peak spatial frequency as a metric to quantify the level of noise introduced by kernels.
The variability in texture features was greatly affected by reconstruction kernels as shown in Fig. 7 for GLCM-contrast and GLCM-energy. Since these features measure a texture characteristic, they were significantly affected by the correlated noise introduced during the reconstruction process as demonstrated by the shift in peak spatial frequency of NPS measurements. Importantly, in addition to measuring useful information, texture features also quantify the noise texture of CT images. In other studies, some texture features were also found to be affected by the addition of uncorrelated Gaussian noise as reported by Oliver et al.43 for PET/CT images of lung cancer. In addition, Bagher-Ebadian et al.44 reported that radiomic features were impacted by high-pass filtering but were robust to low-power Gaussian noise. These findings agree with ours and lead us to investigate the use of the peak frequency as a correction factor, so texture features can be made more robust with kernel choice. Indeed, our corrected texture features became more reproducible as a function of kernel strength as shown by the box plot in Fig. 7 for GLCM-energy and GLCM-contrast. Kernel strength was also correlated with the maximum voxel intensity of the ROI. As kernel strength varied from smoother to sharper, the maximum image intensity value within the ROI varied accordingly. As with NPS peak frequency, it was found to be almost independent of dose.
The characterization of the robustness of texture features for different kernels is important for advancing the emerging field of CT radiomics. This characterization resulted in the identification of correction factors that may be useful in clinical applications, for example, in the analysis of images coming from different institutions using different scanners and acquisition and image reconstruction protocols. We formulated correction factors for 19 features with respect to peak frequency and maximum intensity as listed in Table 5 and 6. These factors improved the features by reducing the variations introduced by reconstruction kernels. The highest improvement was observed in GLCM-contrast and GLCM-energy for frequency-based correction. GLCM-contrast and GLCM-energy also reflect inherent CT noise, which was accounted for by the application of the correction factors based on NPS peak frequency. The highest improvement was found for GLCM-difference entropy and NGTDM-coarseness after maximum intensity corrections. We posit that the peak frequency from NPS measurements reflects the noise texture introduced by different kernels, while the maximum intensity reflects the change in image intensity values produced by different kernels.
The identification of correction factors for features that showed variability with imaging parameters will help reduce such variability. For example, NGTDM-coarseness and GLCM-inverse variance were found to be dependent on kernel strength in this study and dependent on voxel size in our previous report.14 Therefore, two correction factors can be applied to these features. Nevertheless, it must be kept in mind that robustness of a feature to acquisition and reconstruction parameters does not necessarily mean that the feature will be a useful imaging biomarker.
A limitation of this study was that radiomic features were extracted from the centrally located ROIs of a cartridge of the CCR phantom. However, noise in CT images might be ROI location dependent within the bore of a scanner. It is well known that noise texture in the center of the CT scanner might be different than noise in the periphery. This can be evaluated by measuring NPS from central and peripheral ROIs and comparing feature values. This is actually an ongoing investigation; we plan to report in the future.
5. Conclusions
The principal conclusion from this work is that second-order texture features are strongly affected by a CT image’s underlying noise texture produced by the reconstruction kernel used in image formation. We showed that by measuring the NPS of a scanner in a standard phantom for a given set of acquisition and reconstruction parameters, the noise texture can be characterized by the peak spatial frequency of the NPS. Likewise, we also showed that the maximum intensity inside an ROI is related to the noise level of the image. Furthermore, both of these parameters, namely, the NPS peak frequency and the ROI’s maximum intensity, can be used as correction factors to reduce the variability in texture features due to the noise introduced by reconstruction kernels. These findings reinforced previous calls for efforts toward standardization of radiomics processes11,12 and warrant more studies on what exactly radiomics features measure and how they are impacted by physical and clinical variables.
Acknowledgments
We would like to acknowledge Dr. Dennis Mackin from MD Anderson Cancer Center for providing CCR phantom. We are also thankful to Dr. Kenneth J. Ruchala from Sun Nuclear Corporation for providing the ACR phantom. This project was partly supported by National Institutes of Health, Award No. RO1-CA190105-01.
Biographies
Muhammad Shafiq-ul-Hassan is a graduate student at the University of South Florida and Moffitt Cancer Center PhD program in applied physics with emphasis in medical physics. He is primarily interested in the applications of advanced radiomics techniques to advance the concept of personalized medicine in radiotherapy. His current research focus is on the characterization of CT radiomic features using texture phantoms.
Geoffrey G. Zhang is a senior faculty member in the Department of Radiation Oncology at Moffitt Cancer Center and an adjunct professor in the Department of Physics at the University of South Florida and is certified by the American Board of Radiology in therapeutic medical physics. He received his PhD in medical physics from Carleton University, Canada, in 1998. His primary research interest is in quantitative image analysis for radiotherapy, Monte Carlo simulations, and other clinical dosimetry.
Dylan C. Hunt is a clinical physicist in the Department of Radiation Oncology at H. Lee Moffitt Cancer Center and holds an adjunct professorship at the University of South Florida. He has been certified in therapeutic medical physics from the American Board of Radiology. He received his PhD in medical biophysics from the University of Toronto in 2005. His main interests lie in the study of signal and noise in x-ray imaging systems analysis.
Kujtim Latifi is an assistant member of the Department of Radiation Oncology and Department of Cancer Imaging and Metabolism at Moffitt Cancer Center. His clinical focus is the application of advanced imaging techniques and software solutions to improve patient care and clinical workflow. Recently, his research focus has been on the investigation and development of quantitative imaging biomarkers (radiomics) from CT and PET/CT to predict treatment outcomes for patients treated with radiation.
Ghanim Ullah is an assistant professor in the Department of Physics at the University of South Florida, Tampa. He received his PhD in biophysics from Ohio University in 2006. His current research interests include image and signal processing and computational modeling of neuronal systems to understand neurological disorders, such as Alzheimer’s disease, epilepsy, and stroke.
Robert J. Gillies is the Martin Silbiger Chair of the Department of Cancer Imaging and Metabolism, vice-chair of radiology, and scientific director of the Small Animal Imaging Lab (SAIL) at the H. Lee Moffitt Cancer Center and Research Institute in Tampa, Florida. His research is focused on functional and molecular imaging of cancer, specifically with an emphasis on the use of imaging to inform evolutionary models of carcinogenesis and response to therapy.
Eduardo G. Moros is the chief of medical physics at the Moffitt Cancer Center. He is an active member of the AAPM and ASTRO and is associate editor of the Journal of Applied Clinical Medical Physics and the Journal of Radiation Oncology. He has published over 165 peer-reviewed papers and has been a principal investigator/co-investigator on numerous NIH and industry research grants. His current interest is radiomics applications to radiotherapy.
Disclosures
None declared.
References
- 1.Kumar V., et al. , “Radiomics: the process and the challenges,” Magn. Reson. Imaging 30(9), 1234–1248 (2012). 10.1016/j.mri.2012.06.010 [DOI] [PMC free article] [PubMed] [Google Scholar]
- 2.Gillies R. J., et al. , “The biology underlying molecular imaging in oncology: from genome to anatome and back again,” Clin. Radiol. 65(7), 517–521 (2010). 10.1016/j.crad.2010.04.005 [DOI] [PMC free article] [PubMed] [Google Scholar]
- 3.Aerts H. J. W. L., et al. , “Decoding tumour phenotype by noninvasive imaging using a quantitative radiomics approach,” Nat. Commun. 5, 4006 (2014). 10.1038/ncomms5006 [DOI] [PMC free article] [PubMed] [Google Scholar]
- 4.Lambin P., et al. , “Radiomics: extracting more information from medical images using advanced feature analysis,” Eur. J. Cancer 48(4), 441–446 (2012). 10.1016/j.ejca.2011.11.036 [DOI] [PMC free article] [PubMed] [Google Scholar]
- 5.Lee H.-J., et al. , “Epidermal growth factor receptor mutation in lung adenocarcinomas: relationship with CT characteristics and histologic subtypes,” Radiology 268(1), 254–264 (2013). 10.1148/radiol.13112553 [DOI] [PubMed] [Google Scholar]
- 6.Karlo C. A., et al. , “Radiogenomics of clear cell renal cell carcinoma: associations between CT imaging features and mutations,” Radiology 270(2), 464–471 (2014). 10.1148/radiol.13130663 [DOI] [PMC free article] [PubMed] [Google Scholar]
- 7.Gevaert O., et al. , “Non–small cell lung cancer: identifying prognostic imaging biomarkers by leveraging public gene expression microarray data—methods and preliminary results,” Radiology 264(2), 387–396 (2012). 10.1148/radiol.12111607 [DOI] [PMC free article] [PubMed] [Google Scholar]
- 8.Coroller T. P., et al. , “CT-based radiomic signature predicts distant metastasis in lung adenocarcinoma,” Radiother. Oncol. 114(3), 345–350 (2015). 10.1016/j.radonc.2015.02.015 [DOI] [PMC free article] [PubMed] [Google Scholar]
- 9.Zhao B., et al. , “Reproducibility of radiomics for deciphering tumor phenotype with imaging,” Sci. Rep. 6, 23428 (2016). 10.1038/srep23428 [DOI] [PMC free article] [PubMed] [Google Scholar]
- 10.Galavis P. E., et al. , “Variability of textural features in FDG PET images due to different acquisition modes and reconstruction parameters,” Acta Oncol. 49(7), 1012–1016 (2010). 10.3109/0284186X.2010.498437 [DOI] [PMC free article] [PubMed] [Google Scholar]
- 11.Nyflot M. J., et al. , “Quantitative radiomics: impact of stochastic effects on textural feature analysis implies the need for standards,” J. Med. Imaging 2(4), 041002 (2015). 10.1117/1.JMI.2.4.041002 [DOI] [PMC free article] [PubMed] [Google Scholar]
- 12.Mackin D., et al. , “Measuring computed tomography scanner variability of radiomics features,” Invest. Radiol. 50(11), 757–765 (2015). 10.1097/RLI.0000000000000180 [DOI] [PMC free article] [PubMed] [Google Scholar]
- 13.Fave X., et al. , “Can radiomics features be reproducibly measured from CBCT images for patients with non-small cell lung cancer?” Med. Phys. 42(12), 6784–6797 (2015). 10.1118/1.4934826 [DOI] [PMC free article] [PubMed] [Google Scholar]
- 14.Shafiq-ul-Hassan M., et al. , “Intrinsic dependencies of CT radiomic features on voxel size and number of gray levels,” Med. Phys. 44(3), 1050–1062 (2017). 10.1002/mp.12123 [DOI] [PMC free article] [PubMed] [Google Scholar]
- 15.Kim H., et al. , “Impact of reconstruction algorithms on CT radiomic features of pulmonary tumors: analysis of intra- and inter-reader variability and inter-reconstruction algorithm variability,” PLoS One 11(10), e0164924 (2016). 10.1371/journal.pone.0164924 [DOI] [PMC free article] [PubMed] [Google Scholar]
- 16.Zhao B., et al. , “Exploring variability in CT characterization of tumors: a preliminary phantom study,” Transl. Oncol. 7(1), 88–93 (2014). 10.1593/tlo.13865 [DOI] [PMC free article] [PubMed] [Google Scholar]
- 17.He L., et al. , “Effects of contrast-enhancement, reconstruction slice thickness and convolution kernel on the diagnostic performance of radiomics signature in solitary pulmonary nodule,” Sci. Rep. 6, 34921 (2016). 10.1038/srep34921 [DOI] [PMC free article] [PubMed] [Google Scholar]
- 18.Lo P., et al. , “Variability in CT lung-nodule quantification: Effects of dose reduction and reconstruction methods on density and texture based features,” Med. Phys. 43(8), 4854–4865 (2016). 10.1118/1.4954845 [DOI] [PMC free article] [PubMed] [Google Scholar]
- 19.Solomon J., et al. , “Quantitative features of liver lesions, lung nodules, and renal stones at multi–detector row CT examinations: dependency on radiation dose and reconstruction algorithm,” Radiology 279(1), 185–194 (2016). 10.1148/radiol.2015150892 [DOI] [PubMed] [Google Scholar]
- 20.Siewerdsen J. H., Cunningham I. A., Jaffray D. A., “A framework for noise-power spectrum analysis of multidimensional images,” Med. Phys. 29(11), 2655–2671 (2002). 10.1118/1.1513158 [DOI] [PubMed] [Google Scholar]
- 21.Riederer S. J., Pelc N. J., Chesler D. A., “The noise power spectrum in computed X-ray tomography,” Phys. Med. Biol. 23(3), 446–454 (1978). 10.1088/0031-9155/23/3/008 [DOI] [PubMed] [Google Scholar]
- 22.Li K., Tang J., Chen G. H., “Statistical model based iterative reconstruction (MBIR) in clinical CT systems: experimental assessment of noise performance,” Med. Phys. 41(4), 041906 (2014). 10.1118/1.4867863 [DOI] [PMC free article] [PubMed] [Google Scholar]
- 23.Siewerdsen J. H., et al. , “Signal, noise power spectrum, and detective quantum efficiency of indirect-detection flat-panel imagers for diagnostic radiology,” Med. Phys. 25(5), 614–628 (1998). 10.1118/1.598243 [DOI] [PubMed] [Google Scholar]
- 24.Solomon J., et al. , “Comparison of low-contrast detectability between two CT reconstruction algorithms using voxel-based 3D printed textured phantoms,” Med. Phys. 43(12), 6497–6506 (2016). 10.1118/1.4967478 [DOI] [PubMed] [Google Scholar]
- 25.Eldevik K., Nordhoy W., Skretting A., “Relationship between sharpness and noise in CT images reconstructed with different kernels,” Radiat. Prot. Dosim. 139(1–3), 430–433 (2010). 10.1093/rpd/ncq063 [DOI] [PubMed] [Google Scholar]
- 26.Solomon J. B., Li X., Samei E., “Relating noise to image quality indicators in CT examinations with tube current modulation,” Am. J. Roentgenol. 200(3), 592–600 (2013). 10.2214/AJR.12.8580 [DOI] [PubMed] [Google Scholar]
- 27.Solomon J. B., Christianson O., Samei E., “Quantitative comparison of noise texture across CT scanners from different manufacturers,” Med. Phys. 39(10), 6048–6055 (2012). 10.1118/1.4752209 [DOI] [PubMed] [Google Scholar]
- 28.Haralick R. M., Shanmugam K., Dinstein I., “Textural features for image classification,” IEEE Trans. Syst., Man, Cybern. SMC-3(6), 610–621 (1973). 10.1109/TSMC.1973.4309314 [DOI] [Google Scholar]
- 29.Haralick R. M., “Statistical and structural approaches to texture,” Proc. IEEE 67(5), 786–804 (1979). 10.1109/PROC.1979.11328 [DOI] [Google Scholar]
- 30.Kurani A. S., et al. , “Co-occurences matrices for volumetric data,” Presented at the 7th IASTED Int. Conf. on Computer Graphics and Imaging, CGIM, Kauai, Hawaii: (2004). [Google Scholar]
- 31.Oliver J. A., et al. , “Variability of image features computed from conventional and respiratory-gated PET/CT images of lung cancer,” Transl. Oncol. 8(6), 524–534 (2015). 10.1016/j.tranon.2015.11.013 [DOI] [PMC free article] [PubMed] [Google Scholar]
- 32.Galloway M. M., “Texture analysis using gray level run lengths,” Comput. Graphics Image Process. 4(2), 172–179 (1975). 10.1016/S0146-664X(75)80008-6 [DOI] [Google Scholar]
- 33.Dasarathy B. V., Holder E. B., “Image characterizations based on joint gray level: run length distributions,” Pattern Recognit. Lett. 12(8), 497–502 (1991). 10.1016/0167-8655(91)80014-2 [DOI] [Google Scholar]
- 34.Chu A., Sehgal C. M., Greenleaf J. F., “Use of gray value distribution of run lengths for texture analysis,” Pattern Recognit. Lett. 11(6), 415–419 (1990). 10.1016/0167-8655(90)90112-F [DOI] [Google Scholar]
- 35.Amadasun M., King R., “Textural features corresponding to textural properties,” IEEE Trans. Syst., Man, Cybern. 19(5), 1264–1274 (1989). 10.1109/21.44046 [DOI] [Google Scholar]
- 36.Thibault G., et al. , “Texture indexes and gray level size zone matrix application to cell nuclei classification” in 10th Int. Conf. on Pattern Recognition and Information Processing, pp. 140–145 (2009). [Google Scholar]
- 37.Sarkar N., Chaudhuri B. B., “An efficient approach to estimate fractal dimension of textural images,” Pattern Recognit. 25(9), 1035–1041 (1992). 10.1016/0031-3203(92)90066-R [DOI] [Google Scholar]
- 38.Jin X. C., Ong S. H., “A practical method for estimating fractal dimension,” Pattern Recognit. Lett. 16(5), 457–464 (1995). 10.1016/0167-8655(94)00119-N [DOI] [Google Scholar]
- 39.Friedman S. N., et al. , “A simple approach to measure computed tomography (CT) modulation transfer function (MTF) and noise-power spectrum (NPS) using the American College of Radiology (ACR) accreditation phantom,” Med. Phys. 40(5), 051907 (2013). 10.1118/1.4800795 [DOI] [PMC free article] [PubMed] [Google Scholar]
- 40.Balagurunathan Y., et al. , “Reproducibility and prognosis of quantitative features extracted from CT images,” Transl. Oncol. 7(1), 72–87 (2014). 10.1593/tlo.13844 [DOI] [PMC free article] [PubMed] [Google Scholar]
- 41.Yu H., et al. , “Coregistered FDG PET/CT-based textural characterization of head and neck cancer for radiation treatment planning,” IEEE Trans. Med. Imaging 28(3), 374–383 (2009). 10.1109/TMI.2008.2004425 [DOI] [PubMed] [Google Scholar]
- 42.Cook G. J. R., et al. , “Are pretreatment 18F-FDG PET tumor textural features in non-small cell lung cancer associated with response and survival after chemoradiotherapy?” J. Nucl. Med. 54(1), 19–26 (2013). 10.2967/jnumed.112.107375 [DOI] [PubMed] [Google Scholar]
- 43.Oliver J. A., et al. , “Sensitivity of image features to noise in conventional and respiratory-gated PET/CT images of lung cancer,” Technol. Cancer Res. Treat. 16(5), 595–608 (2016). 10.1177/1533034616661852 [DOI] [PMC free article] [PubMed] [Google Scholar]
- 44.Bagher-Ebadian H., et al. , “On the impact of smoothing and noise on robustness of CT and CBCT radiomics features for patients with head and neck cancers,” Med. Phys. 44(5), 1755–1770 (2017). 10.1002/mp.12188 [DOI] [PubMed] [Google Scholar]


