

SUMMARY
Energetic nutrients are oxidized to sustain high intra-cellular NADPH/NADP+ ratios. NADPH-dependent reduction of thioredoxin-1 (Trx1) disulfide and glutathione disulfide by thioredoxin reductase-1 (TrxR1) and glutathione reductase (Gsr), respectively, fuels antioxidant systems and deoxyribonucleotide synthesis. Mouse livers lacking both TrxR1 and Gsr sustain these essential activities using an NADPH-independent methionine-consuming pathway; however, it remains unclear how this reducing power is distributed. Here, we show that liver-specific co-disruption of the genes encoding Trx1, TrxR1, and Gsr (triple-null) causes dramatic hepatocyte hyperproliferation. Thus, even in the absence of Trx1, methionine-fueled glutathione production supports hepatocyte S phase deoxyribonucleotide production. Also, Trx1 in the absence of TrxR1 provides a survival advantage to cells under hyperglycemic stress, suggesting that glutathione, likely via glutaredoxins, can reduce Trx1 disulfide in vivo. In triple-null livers like in many cancers, deoxyribonucleotide synthesis places a critical yet relatively low-volume demand on these reductase systems, thereby favoring high hepatocyte turnover over sustained hepatocyte integrity.
In Brief
All cells require cytosolic disulfide-reducing power fueled by intracellular NADPH or, in mammals, alternatively generated by catabolism of the essential amino acid methionine. Prigge et al. show that liver homeostasis under cytosolic disulfide reductase paucity involves noncanonical trafficking of reducing power and a hyperproliferation-based organ survival strategy.
INTRODUCTION
Cell homeostasis requires cytosolic disulfide reduction reactions. For example,the activitiesof most cytosolic proteins require maintenance of the thiol state of their cysteine (Cys) residues. When these oxidize into disulfides or other modifications, they must be reduced back into thiols. Also, reduction of disulfide bonds drives the catalytic cycle of ribonucleotide reductase (RNR) in generating deoxyribonucleotide triphosphates (dNTPs) for DNA synthesis (Holmgren and Sengupta, 2010; Thelander and Reichard, 1979).
NADPH generated from NADP+ via intracellular oxidation of energetic nutrients provides the reducing power for most anabolic, homeostatic, and cytoprotective reduction reactions. However, only two cytosolic enzymes can channel reducing power from NADPH into disulfide reduction reactions: thioredoxin reductase-1 (TrxR1) and glutathione reductase (Gsr) (Arnér and Holmgren, 2000; Couto et al., 2016). TrxR1 reduces the active site disulfide in oxidized thioredoxin-1 (Trx1) into a dithiol. Gsr reduces glutathione disulfide (GSSG) into 2GSH, which can reduce oxidized glutaredoxins (Grxs, also called Glrxs). Trx1 and reduced glutathione (GSH)/Grx distribute this reducing power to substrates, including RNR, peroxidases, protein disulfides, and low-molecular-weight disulfides (Arnér, 2009; Holmgren, 1985; Laurent et al., 1964).
Highlighting the fundamental activities of NADPH-dependent disulfide reductase systems, E. coli coincidentally lacking both thioredoxin reductase and glutathione reductase are non-viable (Feeney et al., 2011). By contrast, we recently showed that TrxR1/Gsr-null mouse livers, which have the equivalent deficiency, sustain redox homeostasis using what is, to date, the only known constitutive NADPH-independent cytosolic disulfide reductase system (Eriksson et al., 2015). In this system, the reduced sulfur in methionine (Met) is transferred via the Met cycle and transsulfuration (in combination, MTS) onto Cys without changing its redox state. Besides providing an essential source of Cys for protein and coenzyme A synthesis, this Cys source is used for de novo GSH synthesis, thus putting the Met-derived reduced sulfur into a molecule that can support cytosolic disulfide reductions (Eriksson et al., 2015). Despite the predicted inefficiency of this pathway, lifespans of mice with TrxR1/Gsr-null livers can exceed 20 months.
The extent to which reducing power can be exchanged between GSH and Trx1 systems remains incompletely defined (Arnér, 2009). Mammalian TrxR1 is homologous to Gsr (Novoselov and Gladyshev, 2003), yet TrxR1 cannot reduce GSSG and Gsr cannot reduce Trx1 disulfide (Arnér, 2009). Nonetheless, TrxR1 can directly reduce cytosolic Grx2c disulfide in vitro (Johansson et al., 2004), Grxs can reduce Trx1 disulfide (Zhang et al., 2014), and in some conditions reduced Trx1 can reduce GSSG (Kanzok et al., 2001). In yeast, Trx1 is essential for maintaining S phase dNTP pools (Camier et al., 2007; Koc et al., 2006), suggesting that GSH/Grx in the absence of Trx1 cannot fully support RNR. In mammals the need for Trx1 is less clear. Trx1-knockout mice are embryonic lethal (Matsui et al., 1996); however, TrxR1-null embryos are also non-viable (Jakupoglu et al., 2005), yet this is associated with defects in embryonic patterning, not in cell proliferation or other basal cellular processes (Bondareva et al., 2007). Indeed, since both TrxR1-null and TrxR1/Gsr-null livers exhibit robust physiology and normal replication (Eriksson et al., 2015; Prigge et al., 2012), it is clear that enzymes including RNR can obtain adequate reducing power without the hepatocytes being able to use NADPH/TrxR1 to reduce Trx1. Either this reducing power must be coming directly from GSH/Grx or it must be cross-trafficked from the GSH system to Trx1, thereby maintaining the reduced state of Trx1 in the absence of TrxR1.
To distinguish between these possibilities, we here developed a floxed allele encoding Trx1 (Txn1fl). Mice having homozygous liver-specific disruption of this allele, as well as all combinatorial disruptions of hepatic Trx, TrxR1, and Gsr, proved to be viable. Pathway analyses revealed that, much like the strategy utility companies use to maintain a robust electrical power grid, mammalian cells have a robust disulfide-reducing power grid that diversifies re-routing possibilities to favor redox homeostasis. Most surprisingly, the predominant response to major disruptions in the hepatocyte cytosolic disulfide systems is adoption of a seemingly cancer-like phenotype that includes dramatic hyperproliferation and rapid cell turnover. This is discussed in the context of cellular reducing power requirements and cell survival strategies.
RESULTS
Development and Survival of Mice with Trx1-, Trx1/TrxR1-, Trx1/Gsr-, and Trx1/TrxR1/Gsr-Null Livers
No previous studies have shown in vivo evidence of TrxR1-independent Trx1 activity, suggesting that TrxR1-null cells should be functionally Trx1 null. Since TrxR1-null cells and livers are generally robust (Mandal et al., 2010; Peng et al., 2014; Suvorova et al., 2009), we investigated whether Trx1-null livers were also viable. A floxed allele of Txn1 (Txn1fl), encoding Trx1, that becomes protein null following Cre-mediated recombination was developed (Figures 1A–1C). Germline disruption, like for the original Txn1-knockout allele (Matsui et al., 1996), was recessive lethal in pre-implantation embryos (data not shown). Using Txn1fl, we generated homozygous liver-specific Trx1-null mice (Figure 1D, lanes 5 and 6), revealing that Trx1 is dispensable for overtly normal liver development and function. We then generated mice with all possible combinations of liver-specific disruptions of Trx1, TrxR1, and Gsr. Remarkably, mice survived through adulthood with each of these combinations, including even the liver-specific triple-homozygous Trx1/TrxR1/Gsr-null combination (see below).
Figure 1. Development of Mice with Liver-Specific Co-disruptions of Trx1, TrxR1, and Gsr.

(A) Txn1fl allele. The targeting vector generating the founder allele (Txn1found) contained a self-excising Flp/neo cassette that matures into the floxed allele (Txn1fl) in male germ cells. Cre recombination generates Txn1null. Details are in the Supplemental Experimental Procedures.
(B) Chromosomal targeting. C57BL/6 × 129SvEv hybrid embryonic stem cells (ESCs) were used. Founder pups (chimera × C57BL/6) that either did (left) or did not (right) contain the Txn1found allele were analyzed for D4Mit193 (17.9 cM from Txn1), distinguishing C57BL/6 and 129SvEv chromosome 4. Most pups with Txn1found were homozygous for the C57BL/6 D4Mit193 marker with ratios reflecting meiotic recombination frequencies, indicating the allele had targeted the C57BL/6 chromosome. M, marker; C, WT ESC control.
(C) Mendelian representation of WT (+) and Txn1fl alleles in genomic DNA from F1 sib-matings.
(D) Conversion of Txn1fl to Txn1null in liver by AlbCre and survival of mice with Trx1-null livers. Total RNA from adult livers was analyzed for the presence of mRNA from the WT or Txn1fl alleles (molecularly identical) versus from the Txn1null allele by RT-PCR. Lanes 5 and 6 show adult mice with Trx1-null livers. C, no template control.
(E) Histology of adult livers of each homozygous combination. Arrows show inflammation (blue), ductular reactions (purple), or hypertrophic (yellow) or degenerating (green) hepatocytes. Scale bars, 400 μm. C or P, representative central veins or portal triads, respectively.
(F) Liver size at harvest. Bars depict mean and SEM (*p < 0.05 and **p < 0.01; ns, not significant; versus WT, Student’s t test).
(G) Representative macroscopic and microscopic necrotic foci (green arrows) in double-null, but not in single-null, livers. Upper panels, liver lobes; scale bars, 1 mm. Lower panels, H&E-stained histology; scale bars, 200 μm.
(H) Immunoblots on liver lysates of representative genotypes. Asterisk denotes mitochondrial TrxR2, which cross-reacts with the TrxR1 antibody.
(I) Levels of GSH system component activities. Graphs depict means and SEM (*p < 0.05 and **p < 0.01; ns, not significant; versus WT, Student’s t test).
(J) Thiol generation in lysates detected by reaction with DTNB, measured at 421 nm. Reactions contained liver lysates, GSSG, NADPH, or NADH as indicated.
Liver histology in each of the single-homozygous mutations was similar to that of wild-type (WT) controls (Figure 1E, top). By contrast, double- and triple-null livers showed a range of histopathologies, including mild inflammation, ductular reactions, cell death (including both feathery and ballooning hepatocytes, individual necrotic hepatocytes, and intermittent multi-hepatocyte necrotic foci), intermittent presence of giant Langhan’s macrophages, and heteromorphic or hypertrophic hepatocytes (Figure 1E, bottom, and see below). Livers of double- and triple-null combinations were 2- to 3-fold larger per body mass than WT livers (Figure 1F), and necrotic foci were often visible from the surface (e.g., Figure 1G, green arrows). Immunoblots verified the hepatic protein-null status for each allele (Figure 1H). Residual TrxR1 or Trx1 protein in TrxR1- or Trx1-null condition, respectively, was from non-hepatocyte liver cell types, as shown previously for TrxR1-null livers (Eriksson et al., 2015; Suvorova et al., 2009). Levels of several other key redox proteins were also assessed. Mitochondrial Trx2 was modestly lower in livers lacking either Gsr or Trx1; Grx1 was modestly elevated in TrxR1- or TrxR1/Gsr-null livers; and the Trx-related protein of 14 kDa (TRP14) was subtly increased in TrxR1/Gsr- and Trx1/TrxR1-null livers. Curiously, levels of peroxiredoxin-2 (Prdx2 and Prx2), which requires reducing power from Trx1 for activity, were elevated in all genetic combinations lacking Trx1 (Figure 1H). Trx1/TrxR1-null livers also showed a small increase in mitochondrial TrxR2 (black asterisk in Figure 1H).
Because both the NADPH + Gsr system and the Met + MTS system traffic reducing power via GSH (Eriksson et al., 2015), we measured GSH system enzyme activities in representative liver lysates. Most genotypes had similar total glutathione levels, although these were 2-fold elevated in lysates from livers lacking Trx1, and Grx activity was subtly elevated in TrxR1- and TrxR1/Gsr-null livers, but not in livers lacking Trx1 (Figure 1I). Genotypes lacking Gsr showed no GSSG reductase activity using either NADPH or NADH (Figures 1I and 1J), verifying they did not contain a cryptic GSSG reductase activity.
The histopathologies associated with the double- and triple-null combinations suggested mice with these combinations might exhibit liver disease or dysfunction. As compared to sera from WT controls, mice with TrxR1/Gsr-null livers showed significantly elevated serum markers of liver damage, including alanine aminotransferase, aspartate aminotransferase, γ-gluta-myltransferase, alkaline phosphatase, and total bile acids (Table 1). They also showed significantly elevated levels of cholesterol; however, other markers of hepatic function, including serum glucose, protein, albumin, and bilirubin contents, did not differ significantly from those in WT controls, and serum immunoglobulin and urea contents were also normal (Table 1). This suggests that, despite having substantial chronic liver damage, maintenance of intermediary hepatic functions in mice with TrxR1/Gsr-null livers is remarkably unaffected.
Table 1.
Serum Markers of Hepatic Health and Function
| ALT | AST | GGT | AlkP | BA | Chol | Gluc | Prot | Alb | Glob | A:G | Bili | Urea | |
|---|---|---|---|---|---|---|---|---|---|---|---|---|---|
| U/L | U/L | U/L | U/L | μm/L | mg/dL | mg/dL | g/dL | g/dL | g/dL | ratio | mg/dL | mg/dL | |
| Control n = 13 (SEM) | 23.23 | 34.61 | 0 | 194.9 | 6.62 | 103.8 | 290.4 | 4.48 | 2.62 | 1.88 | 1.42 | 0.115 | 21.92 |
| (2.02) | (1.59) | (0) | (19.27) | (3.08) | (6.69) | (13.72) | (0.14) | (0.08) | (0.08) | (0.05) | (0.018) | (1.79) | |
|
| |||||||||||||
| TrxR1/Gsr null n = 13 (SEM) | 206.7 | 198.7 | 50.31 | 351.8 | 112.7 | 204.9 | 237.8 | 4.65 | 2.55 | 1.80 | 1.44 | 0.109 | 22.69 |
| (67.60) | (54.96) | (18.77) | (69.49) | (33.9) | (28.6) | (23.63) | (0.13) | (0.08) | (0.07) | (0.06) | (0.016) | (0.91) | |
|
| |||||||||||||
| Student’s t test | 0.012a | 0.006a | 0.013a | 0.040a | 0.014a | 0.002a | 0.069 | 0.452 | 0.331 | 0.499 | 0.781 | 0.843 | 0.714 |
ALT, alanine aminotransferase; AST, aspartate aminotrasferase; GGT, γ-glutamyltransferase; AlkP, alkaline phosphatase; BA, total bile acids; Chol, cholesterol; Gluc, glucose; Prot, total protein; Alb, serum albumin; Glob, immunoglobulin; A:G, Alb:Glob; Bili, total bilirubin.
Student’s t test p ≤ 0.05.
Redistribution of Cytosolic Disulfide-Reducing Power
Survival of mice having Trx1/TrxR1/Gsr-null livers indicates mammalian cells have unexpectedly robust means of redistributing cytosolic disulfide-reducing power under diverse conditions. This was further investigated using a short-term synthetic lethality assay in primary fibroblasts (Figure S1) (Suvorova et al., 2009). Cell survival was assessed over a 48-hr period following disruption of MTS with D,L-propargylglycine (PPG), of GSH synthesis with L-buthionine-(S,R)-sulfoximine (BSO) (Eriksson et al., 2015), or under hyperglycemia-induced oxidative stress (Peng et al., 2014) (Figure 2A). WT and Gsr-null cells tolerated each of the challenges. TrxR1- and Trx1/TrxR1-null cells tolerated PPG, but not BSO. TrxR1/Gsr-, Trx1/Gsr-, and Trx1/TrxR1/Gsr-null cells were killed by PPG as well as by BSO, and only Trx1/TrxR1/Gsr-null cells were susceptible to hyperglycemic stress in these conditions (Figures 2A and 2B). These results were mapped onto the cytosolic disulfide reductase pathways (Figure 2C).
Figure 2. Redistribution of Reducing Power among Cytosolic Disulfide-Reducing Systems in Primary Fibroblasts.

(A) Synthetic lethality at 48 hr. Stably WT or Gsr-null fibroblast cultures or cultures that had been converted to the indicated genotypes 4 days earlier (see Figure S1) were untreated (cont, standard medium, 5 mM glucose) or treated for 48 hr with 3 mM BSO, 3 mM PPG, or 33 mM glucose, as indicated at top, and photographed. Red numerals in select panels refer to conditions modeled in (C). Scale bars, 200 μm.
(B) Quantification of cell survival. Adherent live cells were counted on replicate plates as in (A), presented as the percentage of live cells present compared to the untreated control value for that cell line. Bars represent mean and SEM of surviving cells of the indicated line under the conditions indicated. Green shading and orange shading correspond to values considered to represent cell survival or cell failure under these conditions.
(C) Pathway interpretations. Top diagram depicts reducing power trafficking from NADPH-independent (rose) or -dependent sources (blue). Enzymes or pathways that are disrupted genetically or pharmacologically in (A) are indicated by red font or red arrows, respectively. Yellow star, hyperglycemia-induced oxidative stress; gray arrows, putative cross-trafficking of reducing power from TrxR1 to Grx (arrow i) or from Grx to Trx1 (arrow ii); blue and green arrows, the outputs of the GSH or Trx1 pathways, respectively. Below, the modeling pathway activities and outcomes under key conditions tested in (A) are shown. Assignments of survive or fail (green or orange, respectively) were based on values depicted with the same colors in (B). Red numerals refer to correspondingly labeled conditions in (A). Red Xs denote enzymes or activities that were disrupted in each condition.
The ability of Gsr-null cells to tolerate BSO or PPG (e.g., Figure 2, condition 1) indicated that the NADPH + TrxR1-driven system alone, in the absence of both the NADPH + Gsr- and the Met-driven systems, supported survival. In the Trx1/TrxR1-null fibroblasts, tolerance of PPG (condition 5) indicated that the NADPH + Gsr-driven system, in the absence of both the NADPH + TrxR1-driven and the Met-driven systems, supported survival. Survival of Trx1/Gsr-, TrxR1/Gsr-, and Trx1/TrxR1/Gsr-null cultures (e.g., conditions 3 and 7) confirmed that the Met + MTS-driven pathway in the absence of both NADPH-dependent systems was sufficient (Eriksson et al., 2015). Thus, survival was supported under all tested conditions in which reducing power could flow to Trx1 from TrxR1 or to GSH from either Gsr or MTS. Cross-trafficking from TrxR1 to GSH/Grx (Johansson et al., 2004) (gray arrow i in Figure 2C) did not support survival (condition 8). Also, the susceptibility of Trx1/TrxR1/Gsr-null, but not TrxR1/Gsr-null, fibroblasts to hyperglycemic stress (condition 10) suggests that, in the TrxR1/Gsr-null condition, Trx1 in the absence of TrxR1 provides protection against oxidative stress. One explanation for this could be that cross-trafficking of reducing power from GSH/Grx to Trx1 (gray arrow ii) supports Trx1 in this role (see the Discussion).
Oxidative Stress and Xenobiotic Tolerance in Disulfide Reductase-Deficient Livers
Prxs and glutathione peroxidases require reducing power from Trx1 or GSH, respectively, to support their functions as peroxidases or redox sensors (Brigelius-Flohéand Maiorino, 2013; Sobotta et al., 2015). It was, therefore, expected that livers having deficiencies in their Trx1, GSH, or both systems might exhibit increased steady-state levels of oxidatively damaged macromolecules and would exhibit increased susceptibility to oxidative challenges. To assess basal accumulation of oxidative damage, sections from WT, TrxR1-, or TrxR1/Gsr-null livers harvested from resting adult mice were stained for the posttranslational protein modifications 4-hydroxynonenal (4-HNE), acro-lein, or glutathionylation (Brand et al., 2004; Forman, 2016; Shearn et al., 2016; Uchida et al., 1998). Whereas neither WT nor TrxR1-null livers showed substantial staining for any of these antigens (Figures 3A–3H), TrxR1/Gsr-null livers exhibited a checkerboard-pattern of abundant scattered individual hepatocytes with strong staining for protein modification by 4-HNE (Figure 3J) and uniformly strong staining for protein acrolein adducts and protein glutathionylation (protein-SSG) in most hepatocytes (Figures 3K and 3L, respectively). Curiously, hepatocytes undergoing ballooning cell death (BHs in Figures 3I–3L) showed little staining for either 4-HNE or acrolein, yet they showed dramatic levels of glutathione conjugates. Intense protein-SSG staining was also observed as inclusions within giant Langhan’s macrophages (LMs), but not in their surrounding cytosol or nuclei (Figure 3L). These observations suggest that, although TrxR1/Gsr-null hepatocytes accumulate increased macromolecular oxidative damage as compared to WT or TrxR1-null hepatocytes and have a high frequency of BHs undergoing cell death, these terminal cells appear to have cleared 4-HNE and acrolein modifications and instead accumulate protein-SSG adducts. Following cell death, BH cells are likely engulfed by the macrophage precursors to LMs, which then become LMs and exhibit the protein-SSG staining in their phagolysosomes.
Figure 3. Accumulation of Oxidative Damage in Resting Adult Liver.

(A–L) Panels show representative images of H&E-stained histology (A, E, and I) or immunostaining for 4-HNE (B, F, and J), acrolein adducts (C, G, and K), or glutathionylated proteins (protein-SSG; D, H, and L) in WT (A–D), TrxR1-null (E–H), or TrxR1/Gsr-null (I–L) livers, as indicated. Blue arrows denote small rare acrolein-positive cells of unknown type, which are present in all genotypes. Abbreviations as in Figure 1; BH, ballooning hepatocyte; DR, ductal reaction; LM, giant Langhan’s type macrophage. Scale bars, 200 μm.
In the absence of normal NADPH-dependent routes of supplying reducing power to the cytosolic antioxidant systems, it was anticipated that endogenous ROS generated as a byproduct of mitochondrial oxidative phosphorylation would be the predominant cause of the oxidative damage and cell death observed in the double- and triple-null livers. Transmission electron microscopy of livers revealed that all of the mutant liver genotypes analyzed, including Trx1 and TrxR1 null, which showed no overt pathology, have significantly reduced mitochondrial cross-sectional areas, indicating their mitochondrial networks are composed of finer branches (Figures 4A and 4B, top panel). However, morphometric analyses indicated that total mitochondrial area per cytoplasmic area was similar across genotypes (Figure 4B, middle panel). Also, the levels of mitochondrial citrate synthase (Cs) activity per liver protein, as well as the levels of activity for all five mitochondrial electron transport systems, were similar among all genotypes (Table S1). This further indicated that the total hepatic mitochondrial content and total mitochondrial activity were not substantially affected by these disruptions in the cytosolic disulfide reductase systems. Curiously, compared to WT hepatocytes, the TrxR1/Gsr-, Trx1/Gsr-, and Trx1/TrxR1/Gsr-null hepatocytes also showed a significantly increased abundance of coarse electron-dense bodies (DBs) surrounded by one or more distinct layers of membrane (yellow arrows in Figure 4A and quantified in Figure 4B), as well as coarse electron-dense formations within some mitochondria (yellow asterisks in Figure 4A). The identities of these structures and their relationship to each other are uncertain, although they might reflect mitochondrial fission and mitophagic activities (Khraiwesh et al., 2013; Quist et al., 2015).
Figure 4. Hepatocytic Mitochondrial Ultrastructure.

(A) Representative transmission electron micrographs, captured at 5,000× magnification. Yellow arrows denote regions where DBs have distinct multilamminar surrounding membranes; yellow asterisks denote Mi containing distinct electron-dense condensations; blue arrows denote glycogen rosettes dispersed outside of GTs. DB, coarsely electron dense bodies; ER, endoplasmic reticulum; GT, glycogen tracts; LD, lipid droplet; Mi, mitochondrion; Nu, nucleus. Scale bars, 1,000 nm.
(B) Quantification of average mitochondrial cross-sectional area (top panel), average total mitochondrial area per cytoplasmic area (middle), or average number of DBs per cytoplasmic area (bottom).
To test whether the reductase-deficient livers, which exhibited already dramatically elevated oxidative damage and hepatocyte death (see above), had increased susceptibility to oxidative challenges, we used a model of hepatic ischemia/reperfusion (I/R) injury-induced oxidative stress (Jaeschke, 2003) on mice with WT, Trx1-, Trx1/TrxR1-, Trx1/Gsr-, TrxR1/Gsr-, or Trx1/TrxR1/Gsr-null livers. Unexpectedly, nearly all animals of all genotypes survived until the 2-week harvest point (Figure 5A, top). The double- and triple-null livers harvested at 2 weeks post-I/R surgery showed increased necrotic cells and acellular debris (Figure 5A, bottom), but this did not lead to liver failure.
Figure 5. Impacts of Acute Oxidative or Hepatotoxic Stress.

(A) Acute oxidative stress. Top: experimental strategy for I/R injury model is shown. The left lateral lobe (one-third of liver mass) was occluded for 30 min to induce ischemia; 14-day survival is tabulated below. Bottom: representative liver micrographs at 14 days post-I/R injury are shown (see also Figures S3 and S4). Inflammatory foci, py-knotic cells, necrotic hepatocytes, or post-necrotic acellular debris are denoted by yellow, white, green, or blue arrows, respectively. Scale bars, 200 μm.
(B) Hepatic acetaminophen toxicity. Adult male mice were challenged with the indicated doses of APAP and harvested 24 hr later for histopathological evaluation. Representative tracts of centi-lobular congestion (CC) are denoted with dashed lines; other designations are as above. Scale bars, 200 μm.
To investigate how reductase system disruptions affected susceptibility to hepatotoxins, we challenged adult male TrxR1/Gsr-null or WT mice with the pro-hepatotoxin acetaminophen (paracetamol, APAP) at doses from zero to 165 mg/kg (LD50 = 338 mg/kg for WT mice). Previous studies showed that disruption of only TrxR1 in mouse liver results in high APAP tolerance, which is associated with increased activities of the pathways for detoxifying APAP, itself, and its cytotoxic metabolite N-acetyl-p-benzoquinone imine (NAPQI) (Iverson et al., 2013). WT mice showed no response to any of the APAP doses, and, even at the highest dose, their livers revealed no overt histopathology at 24 hr (Figure 5B, top panel). By contrast, at the highest dose (165 mg/kg; ~0.5 × LD50), one of the three mice with TrxR1/Gsr-null livers died in <20 hr. At the 24-hr harvest, the other two mice with TrxR1/Gsr-null livers challenged at this dose were lethargic and their livers appeared uniformly pale (data not shown). Histology revealed that nearly all hepatocytes in these livers were necrotic (Figure 5B, second panel). Although all TrxR1/Gsr-null mice challenged with 83, 26, or 16.5 mg/kg APAP survived until the 24-hr harvest, following even the lowest dose of APAP (~0.05 × LD50), histology revealed extensive centrilobular hepatocyte death and sinusoidal congestion (Figure 5B, lower panels). Thus, although TrxR1-null livers are highly resistant to APAP (Iverson et al., 2013) and TrxR1/Gsr-null livers show surprising tolerance to hepatic oxidative stress (Figure 4), the TrxR1/Gsr-null livers are highly sensitive to APAP.
Hyperproliferation in Hepatocytes Having Disulfide Reductase System Deficiencies
Because RNR requires disulfide-reducing power and because RNR inhibition arrests proliferative growth (Holmgren and Sengupta, 2010), it was expected that the double- and triple-null livers in this study would have compromised proliferative capacities. However, morphometry revealed that the average hepatocyte volumes in TrxR1/Gsr- and Trx1/TrxR1/Gsr-null livers were ~16-fold greater than those in WT livers (Figure 6A). The volume of hepatocyte nuclei in these livers was similarly increased (Figures 6B and 6D), so there were no substantial differences in the nuclear:cytoplasmic ratios between genotypes (Figure 6C). Most surprisingly, resting adult double- and triple-null livers showed frequencies of proliferatively active hepatocytes, as distinguished by the expression of proliferative cell nuclear antigen (PCNA) and Ki67 antigen, 20- to 300-fold above those in WT livers (Figures 6E, 6F, and S3), and frequencies of hepatocytes in M phase of the cell cycle, as visualized by staining for phospho-histone H3 (PHH3), 7- to 30-fold higher than those in WT livers (Figure 6G). Many hepatocytes in the double- and triple-null livers exhibited ballooning or feathery degeneration (Figure 1E, green arrows), which are forms of programmed parenchymal cell death generally associated with steatohepatitis or cholestasis, respectively (Li and Crawford, 2004; Yip and Burt, 2006). The elevated rates of proliferation and cell death indicate that these livers have exceptionally high hepatocyte turnover rates and survive in a chronic regeneration-like state.
Figure 6. Hepatocyte Morphometry and Proliferation.

(A–C) Genotype-specific hepatocyte morphometry. Volumetric values are plotted on a log2 scale. Each point represents a single hepatocyte or nuclei (A and B, respectively). The nuclear:total hepatocyte volumetric ratio for each hepatocyte is plotted in (C). WT livers are predominated by diploid and tetraploid nuclei, as seen by clustering of values for WT livers in (B), and these landmarks were used to assign approximate ploidy values. See the Supplemental Experimental Procedures for details.
(D) Hepatocyte nuclear sizes in juvenile or aged mice. Cryosections of livers from post-natal day 26 (P26) or P255 mice of the indicated genotypes were prepared and imaged by fluorescence microscopy. In TrxR1/Gsr-null mice, hepatocyte nuclei are green and nuclei of all other cell types are red; in Gsr-null mice all nuclei are red. For each condition, a low-magnification (left; scale bar, 100 μm) and embedded zoomed image pair is shown for nuclei size comparisons. Results show that hyperploidy is already pronounced by P26 in TrxR1/Gsr-null livers (e.g., compare P26 TrxR1/Gsr-null nuclei sizes to P255 Gsr-null nuclei sizes) yet increases further with age.
(E–G) Proliferation in resting adult livers. Representative immunostaining or compiled data for PCNA (E and F, respectively) or PHH3 (G) staining are shown. Graphs depict means and SEM (*p < 0.05 and **p < 0.01; ns, not significant; versus WT, Student’s t test). Scale bars, 200 μm. See also Figure S4.
DISCUSSION
Survival and proliferation of mouse hepatocytes lacking Trx1 contrasts with the situation in lower eukaryotes in which Trx1 is required to support S phase replication (Camier et al., 2007; Koc et al., 2006). Remarkably, when hepatic Trx1 disruption is combined with the elimination of TrxR1 and Gsr, the predominant phenotype is hyperproliferation rather than a replicative deficiency.
To better understand the paradox of how TrxR1/Gsr- or Trx1/TrxR1/Gsr-null hepatocytes could support increased DNA replication without the use of canonical NADPH-dependent pathways to drive RNR, we estimated the burden that S phase places on the cytosolic disulfide reductase systems (Figures S2A and S2B). This revealed that hepatocytes contain within their steady-state GSH pools roughly three times the reducing power required for RNR to support a replication cycle. Moreover, normal hepatocyte S phase is ~7 hr whereas GSH normally has a <2 hr half-life, so during the S phase the GSH pools chemically turn over several times (Figure S2C). Because half of the sulfur in WT liver GSH pools comes from Met via MTS (Mosharov et al., 2000), the molar consumption rate of Met for GSH synthesis in normal resting hepatocytes is therefore already several times higher than the molar consumption rate of reducing power by RNR during the S phase (Figure S2C). In TrxR1/Gsr-null hepatocytes using only Met to fuel cytosolic disulfide reduction (Eriksson et al., 2015), an increase of <10% in the rate of GSH synthesis over basal would be sufficient to support S phase RNR activity (Figure S2C). Actual demand could be lower yet if deoxyribonucleoside salvage also contributes (Arnér and Eriksson, 1995). Thus, the burden of S phase RNR activity is quite small compared to the steady-state rate of GSH turnover.
The highly enlarged average cell and nuclear volume in Trx1/TrxR1/Gsr-null hepatocytes (Figures 6A–6D) suggests proliferative hepatocytes in these livers frequently bypass mitosis (endoreplication) to become super-polyploid. More modest super-polyploidy phenotypes occur in hepatocytes of patients or mice with non-alcoholic fatty liver disease (NAFLD) and in normal rodent livers following partial hepatectomy-induced liver regeneration (Gentric et al., 2015; Melchiorri et al., 1993). In the NAFLD models, inefficient progression through S and G2 phases activates a G2/M checkpoint that blocks entry into M phase but can be bypassed, thereby allowing G2-arrested hepatocytes to directly enter S phase (Gentric et al., 2015). This reveals that replication-dependent hepatocyte super-polyploidy can be caused, counterintuitively, by replication inefficiency coupled with G2/M checkpoint activation and mitosis bypass. In the current study, we show that Trx1/TrxR1/Gsr-null hepatocytes can support and sustain dramatically elevated proliferation rates, yet it remains possible that RNR output and replication efficiency in these livers is nevertheless compromised and actually underpins the super-poly-ploidy phenotype. Further studies will be required to resolve the mechanisms underlying the cell cycle phenotypes of these hepatocytes and how this program might contribute to long-term survival of mice with Trx1/TrxR1/Gsr-null livers.
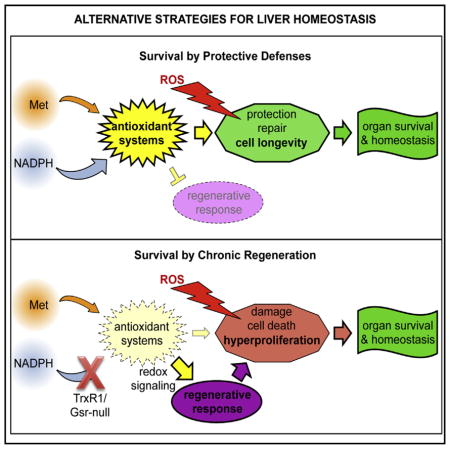
The current study shows that liver homeostasis, and therefore survival of animals with hepatocyte defects, follows classic principles of steady-state kinetics and population biology. Thus, because hepatocytes can have variable rates of both production (cell proliferation, equivalent to a synthesis rate) and loss (cell death, a decay rate), organ stability is maintained as long as hepatocyte proliferation and death rates are balanced. The liver genotypes with the highest proliferation indexes in this study also show the most cell death, indicating these livers have rapid hepatocyte turnover despite also maintaining a stable steady-state hepatocyte population. These dynamics are reminiscent of an r strategy in population biology’s classic r/K selection theory, wherein high production of low-fitness progeny allows persistence of the population despite the high individual mortality rates (Wilson and MacArthur, 1967). Intriguingly, cancer cells also frequently have high rates of both proliferation and cell death. Following I/R injury, evidence of hepatocyte death further increased, yet animals of all genotypes recovered and exhibited long-term survival (Figure 5A). This suggests that rates of proliferation must also increase following I/R injury and, indeed, TrxR1/Gsr-null livers are able to proliferatively regenerate following two-third hepatectomy (Eriksson et al., 2015). In the case of post-I/R injury, however, animal-to-animal variance in both resting and post-I/R injury proliferative values precluded detection of an increase in proliferation rates (Figure S3).
Cytosolic disulfide-reducing power can be disseminated via diverse routes in mammalian cells. We previously found that the Met + MTS pathway alone was able to support homeostasis in the absence of the NADPH-dependent systems (Eriksson et al., 2015). In the current study, we show that either NADPH + TrxR1 alone or NADPH + Gsr alone can also support cell survival and that Trx1 in the absence of both TrxR1 and Gsr can provide a survival advantage under some conditions. In the latter case, we infer that the previously described cross-trafficking of reducing power from GSH/Grx to Trx1 (Zhang et al., 2014) underpins this advantage, possibly by allowing Trx1 to support some Prx activity. Interestingly, Trx1-null livers exhibit increased levels of Prx2 protein despite lacking Trx1, the obligatory reducing power donor for Prx activity. This might suggest that a feedback circuit regulates Prx2 protein levels.
In conclusion, mammalian cells are here shown to have a surprisingly robust cytosolic disulfide reductase grid. This grid can be fueled either by reducing power generated intracellularly via the oxidation of energetic nutrients yielding NADPH to power TrxR1 and Gsr, or by reducing power assimilated from extracellular Met to drive de novo NADPH-independent GSH biosynthesis. From any of these sources, the disulfide-reducing power can be redistributed via diverse routes, such that cytosolic disulfide reductase system functions are maintained despite disruption of key components within individual pathways. When the outcomes of these compensatory pathways in liver become insufficient, macromolecular oxidative damage accumulates and cell death increases. However, our results indicate that this increased cell death is compensated for by increased hepatocyte proliferation rates, which match the increased cell turnover rates and maintain cell population homeostasis.
EXPERIMENTAL PROCEDURES
Mice, Surgeries, and Harvests
All animal procedures presented in this study had been reveiwed and approved in advance by the Montana State University Institutional Animal Care and Use Committee (IACUC). Detailed methods are provided in the online Supplemental Experimental Procedures. A floxed allele of the mouse Txn1 gene, in which exons 2and 3 are flanked by codirectional loxP sites (Txn1fl), was generated on a C57BL/6J backgroud. These mice, as well as mice with the Txnrd1fl allele, are publicly available through Jackson ImmunoResearch Laboratories (stocks JAX 030221 and JAX 028283, respectively). Mice with TrxR1-, Gsr-, Trx1-, TrxR1/Gsr-, Trx1/TrxR1-, Trx1/Gsr-, and Trx1/TrxR1/Gsr-null livers are all overtly normal as adults and fertile in both genders. Hepatic I/R injury involved 30 min of occlusion of the left lateral lobe (~33% of liver) followed by reperfusion. All analyses shown were done on adult mice (60–90 days of age) of both genders except as specified in the text or figure legends. Animals were maintained on a 14:10-hr light:dark cycle with unrestricted access to feed and water. Except where indicated otherwise, all harvests were performed between 9:00 and 11:30 a.m.
Immunoblotting and Enzymatic Assays
For immunoblotting and enzymatic analyses, snap-frozen liver samples were pulverized with a mortar and pestle, homogenized in ice-cold buffer, and clarified by centrifugation. Immunoblots used 20 μg total protein of the clarified lysate per lane. Antibody sources are specified in the Supplemental Experimental Procedures. Glutathione levels were determined as described previously (Eriksson et al., 2015). Gsr activity was measured using 30 μg protein lysate with the Gsr activity analysis kit (Cayman Chemical 703202; Figure 1I) or the DTNB reduction assay (Sigma GRSA; Figure 1J). Grx activity was measured on 20 μg protein lysates by a fluorescent assay (IMCO FkGRX-01). Measurements of mitochondrial enzymatic activities were performed on liver samples that had been saline-perfused at harvest and snap-frozen in liquid nitrogen prior to shipment on dry ice to the NIH/NIDDK Diabetes Research Center Bio-Analytical Redox Biology Core at the University of Alabama at Birmingham.
Primary Fibroblast Systems
Cultured cells were grown on plastic cell culture wells at 37°C in ambient air using standard medium, consisting of DMEM (Gibco 31885, which includes 5.6 mM D-glucose, 4.0 mM L-glutamine, and 1.0 mM sodium pyruvate) supplemented with 10% fetal calf serum. Procedures for establishing and Cre-converting mouse primary fibroblast cultures were described previously (Suvorova et al., 2009) and are validated in Figure S1. As indicated, cultures were treated for 48 hr with 3 mM BSO (Acros Organics 235520050), 3 mM PPG (Sigma P7888), or with an additional 28 mM D-glucose.
Statistical Analyses and Resource Sharing
Statistical analyses were performed on Excel or GraphPad Prism 7 software. Graphs show means and SEM. Significance was determined by a Student’s t tests versus WT samples. All renewable resources developed in this study are available for unrestricted non-profit use on request unless otherwise restricted by an outside party.
Supplementary Material
Highlights.
Disulfide-reducing power from NADPH or methionine traffic via a diversified network
Reducing power from either Trx1 or Grxs can support mammalian S phase replication
Reductase-insufficient cells accumulate oxidative damage and become hyperproliferative
Hyperproliferation in stressed livers, as in tumors, compensates for cell death
Acknowledgments
We thank I. Cavigli, S. Brumfield, D. Moellering, K. Quale, I. Pader, S. Tamow-ski, C. Lenz, S. Barnett, M. Capecchi, L. Brandenberger, R. Molina, L. Johns, M. Jerome, S. Eriksson, T. Kavanagh, G. Merrill, and E. Talago for their contributions and discussions. E.E.S. was supported by grants from the National Institute on Aging (AG040020 and AG055022), an appointment from the Montana Agricultural Experiment Station, institutional infrastructure grants (GM110732 and DK 079626), and a fellowship from the Swedish Wenner-Gren Foundation. E.S.J.A. was supported by the Karolinska Institutet (faculty funding), the Swedish Research Council (2013-4054 and 2014-2603), the Swedish Cancer Society (2015/238), and the Knut and Alice Wallenberg Foundation (2015/238). A.H. was supported by the Swedish Research Council (2013-3529) and the Swedish Cancer Society (2015-961).
Footnotes
AUTHOR CONTRIBUTIONS
J.R.P., L.C., S.S.M., F.O., C.G.M., M.D.B., J.L., D.J.O., C.T.S., Å.M., T.N.G., A.E.H., J.A.K., and E.E.S. performed experiments. E.S.J.A., A.H., and E.E.S. conceived the project, designed the experiments, and analyzed the data. E.E.S., A.H., E.S.J.A., L.C., J.R.P., and M.P.T. prepared the manuscript.
Supplemental Information includes Supplemental Experimental Procedures, four figures, and one table and can be found with this article online at http://dx.doi.org/10.1016/j.celrep.2017.06.019.
References
- Arnér ESJ. Focus on mammalian thioredoxin reductases–important selenoproteins with versatile functions. Biochim Biophys Acta. 2009;1790:495–526. doi: 10.1016/j.bbagen.2009.01.014. [DOI] [PubMed] [Google Scholar]
- Arnér ESJ, Eriksson S. Mammalian deoxyribonucleoside kinases. Pharmacol Ther. 1995;67:155–186. doi: 10.1016/0163-7258(95)00015-9. [DOI] [PubMed] [Google Scholar]
- Arnér ES, Holmgren A. Physiological functions of thioredoxin and thioredoxin reductase. Eur J Biochem. 2000;267:6102–6109. doi: 10.1046/j.1432-1327.2000.01701.x. [DOI] [PubMed] [Google Scholar]
- Bondareva AA, Capecchi MR, Iverson SV, Li Y, Lopez NI, Lucas O, Merrill GF, Prigge JR, Siders AM, Wakamiya M, et al. Effects of thioredoxin reductase-1 deletion on embryogenesis and transcriptome. Free Radic Biol Med. 2007;43:911–923. doi: 10.1016/j.freeradbiomed.2007.05.026. [DOI] [PMC free article] [PubMed] [Google Scholar]
- Brand MD, Affourtit C, Esteves TC, Green K, Lambert AJ, Miwa S, Pakay JL, Parker N. Mitochondrial superoxide: production, biological effects, and activation of uncoupling proteins. Free Radic Biol Med. 2004;37:755–767. doi: 10.1016/j.freeradbiomed.2004.05.034. [DOI] [PubMed] [Google Scholar]
- Brigelius-Flohé R, Maiorino M. Glutathione peroxidases. Biochim Biophys Acta. 2013;1830:3289–3303. doi: 10.1016/j.bbagen.2012.11.020. [DOI] [PubMed] [Google Scholar]
- Camier S, Ma E, Leroy C, Pruvost A, Toledano M, Marsolier-Kergoat MC. Visualization of ribonucleotide reductase catalytic oxidation establishes thioredoxins as its major reductants in yeast. Free Radic Biol Med. 2007;42:1008–1016. doi: 10.1016/j.freeradbiomed.2006.12.027. [DOI] [PubMed] [Google Scholar]
- Couto N, Wood J, Barber J. The role of glutathione reductase and related enzymes on cellular redox homoeostasis network. Free Radic Biol Med. 2016;95:27–42. doi: 10.1016/j.freeradbiomed.2016.02.028. [DOI] [PubMed] [Google Scholar]
- Eriksson S, Prigge JR, Talago EA, Arnér ES, Schmidt EE. Dietary methionine can sustain cytosolic redox homeostasis in the mouse liver. Nat Commun. 2015;6:6479. doi: 10.1038/ncomms7479. [DOI] [PMC free article] [PubMed] [Google Scholar]
- Feeney MA, Veeravalli K, Boyd D, Gon S, Faulkner MJ, Georgiou G, Beckwith J. Repurposing lipoic acid changes electron flow in two important metabolic pathways of Escherichia coli. Proc Natl Acad Sci USA. 2011;108:7991–7996. doi: 10.1073/pnas.1105429108. [DOI] [PMC free article] [PubMed] [Google Scholar]
- Forman HJ. Glutathione - From antioxidant to post-translational modifier. Arch Biochem Biophys. 2016;595:64–67. doi: 10.1016/j.abb.2015.11.019. [DOI] [PMC free article] [PubMed] [Google Scholar]
- Gentric G, Maillet V, Paradis V, Couton D, L’Hermitte A, Panasyuk G, Fromenty B, Celton-Morizur S, Desdouets C. Oxidative stress promotes pathologic polyploidization in nonalcoholic fatty liver disease. J Clin Invest. 2015;125:981–992. doi: 10.1172/JCI73957. [DOI] [PMC free article] [PubMed] [Google Scholar]
- Holmgren A. Thioredoxin. Annu Rev Biochem. 1985;54:237–271. doi: 10.1146/annurev.bi.54.070185.001321. [DOI] [PubMed] [Google Scholar]
- Holmgren A, Sengupta R. The use of thiols by ribonucleotide reductase. Free Radic Biol Med. 2010;49:1617–1628. doi: 10.1016/j.freeradbiomed.2010.09.005. [DOI] [PubMed] [Google Scholar]
- Iverson SV, Eriksson S, Xu J, Prigge JR, Talago EA, Meade TA, Meade ES, Capecchi MR, Arnér ES, Schmidt EE. A Txnrd1-dependent metabolic switch alters hepatic lipogenesis, glycogen storage, and detoxification. Free Radic Biol Med. 2013;63:369–380. doi: 10.1016/j.freeradbiomed.2013.05.028. [DOI] [PMC free article] [PubMed] [Google Scholar]
- Jaeschke H. Molecular mechanisms of hepatic ischemia-reperfusion injury and preconditioning. Am J Physiol Gastrointest Liver Physiol. 2003;284:G15–G26. doi: 10.1152/ajpgi.00342.2002. [DOI] [PubMed] [Google Scholar]
- Jakupoglu C, Przemeck GK, Schneider M, Moreno SG, Mayr N, Hatzopoulos AK, de Angelis MH, Wurst W, Bornkamm GW, Brielmeier M, Conrad M. Cytoplasmic thioredoxin reductase is essential for embryogenesis but dispensable for cardiac development. Mol Cell Biol. 2005;25:1980–1988. doi: 10.1128/MCB.25.5.1980-1988.2005. [DOI] [PMC free article] [PubMed] [Google Scholar]
- Johansson C, Lillig CH, Holmgren A. Human mitochondrial glutaredoxin reduces S-glutathionylated proteins with high affinity accepting electrons from either glutathione or thioredoxin reductase. J Biol Chem. 2004;279:7537–7543. doi: 10.1074/jbc.M312719200. [DOI] [PubMed] [Google Scholar]
- Kanzok SM, Fechner A, Bauer H, Ulschmid JK, Müller HM, Botella-Munoz J, Schneuwly S, Schirmer R, Becker K. Substitution of the thioredoxin system for glutathione reductase in Drosophila melanogaster. Science. 2001;291:643–646. doi: 10.1126/science.291.5504.643. [DOI] [PubMed] [Google Scholar]
- Khraiwesh H, López-Domínguez JA, López-Lluch G, Navas P, de Cabo R, Ramsey JJ, Villalba JM, González-Reyes JA. Alterations of ultrastructural and fission/fusion markers in hepatocyte mitochondria from mice following calorie restriction with different dietary fats. J Gerontol A Biol Sci Med Sci. 2013;68:1023–1034. doi: 10.1093/gerona/glt006. [DOI] [PMC free article] [PubMed] [Google Scholar]
- Koc A, Mathews CK, Wheeler LJ, Gross MK, Merrill GF. Thioredoxin is required for deoxyribonucleotide pool maintenance during S phase. J Biol Chem. 2006;281:15058–15063. doi: 10.1074/jbc.M601968200. [DOI] [PubMed] [Google Scholar]
- Laurent TC, Moore EC, Reichard P. Enzymatic Synthesis Of Deoxyribonucleotides. Iv Isolation And Characterization Of Thioredoxin, The Hydrogen Donor From Escherichia Coli. B J Biol Chem. 1964;239:3436–3444. [PubMed] [Google Scholar]
- Li MK, Crawford JM. The pathology of cholestasis. Semin Liver Dis. 2004;24:21–42. doi: 10.1055/s-2004-823099. [DOI] [PubMed] [Google Scholar]
- Mandal PK, Schneider M, Kölle P, Kuhlencordt P, Förster H, Beck H, Bornkamm GW, Conrad M. Loss of thioredoxin reductase 1 renders tumors highly susceptible to pharmacologic glutathione deprivation. Cancer Res. 2010;70:9505–9514. doi: 10.1158/0008-5472.CAN-10-1509. [DOI] [PubMed] [Google Scholar]
- Matsui M, Oshima M, Oshima H, Takaku K, Maruyama T, Yodoi J, Taketo MM. Early embryonic lethality caused by targeted disruption of the mouse thioredoxin gene. Dev Biol. 1996;178:179–185. doi: 10.1006/dbio.1996.0208. [DOI] [PubMed] [Google Scholar]
- Melchiorri C, Chieco P, Zedda AI, Coni P, Ledda-Columbano GM, Columbano A. Ploidy and nuclearity of rat hepatocytes after compensatory regeneration or mitogen-induced liver growth. Carcinogenesis. 1993;14:1825–1830. doi: 10.1093/carcin/14.9.1825. [DOI] [PubMed] [Google Scholar]
- Mosharov E, Cranford MR, Banerjee R. The quantitatively important relationship between homocysteine metabolism and glutathione synthesis by the transsulfuration pathway and its regulation by redox changes. Biochemistry. 2000;39:13005–13011. doi: 10.1021/bi001088w. [DOI] [PubMed] [Google Scholar]
- Novoselov SV, Gladyshev VN. Non-animal origin of animal thioredoxin reductases: implications for selenocysteine evolution and evolution of protein function through carboxy-terminal extensions. Protein Sci. 2003;12:372–378. doi: 10.1110/ps.0226503. [DOI] [PMC free article] [PubMed] [Google Scholar]
- Peng X, Mandal PK, Kaminskyy VO, Lindqvist A, Conrad M, Arnér ES. Sec-containing TrxR1 is essential for self-sufficiency of cells by control of glucose-derived H2O2. Cell Death Dis. 2014;5:e1235. doi: 10.1038/cddis.2014.209. [DOI] [PMC free article] [PubMed] [Google Scholar]
- Prigge JR, Eriksson S, Iverson SV, Meade TA, Capecchi MR, Arnér ES, Schmidt EE. Hepatocyte DNA replication in growing liver requires either glutathione or a single allele of txnrd1. Free Radic Biol Med. 2012;52:803–810. doi: 10.1016/j.freeradbiomed.2011.11.025. [DOI] [PMC free article] [PubMed] [Google Scholar]
- Quist EM, Filgo AJ, Cummings CA, Kissling GE, Hoenerhoff MJ, Fenton SE. Hepatic Mitochondrial Alteration in CD-1 Mice Associated with Prenatal Exposures to Low Doses of Perfluorooctanoic Acid (PFOA) Toxicol Pathol. 2015;43:546–557. doi: 10.1177/0192623314551841. [DOI] [PMC free article] [PubMed] [Google Scholar]
- Shearn CT, Orlicky DJ, McCullough RL, Jiang H, Maclean KN, Mercer KE, Stiles BL, Saba LM, Ronis MJ, Petersen DR. Liver-Specific Deletion of Phosphatase and Tensin Homolog Deleted on Chromosome 10 Significantly Ameliorates Chronic EtOH-Induced Increases in Hepatocellular Damage. PLoS ONE. 2016;11:e0154152. doi: 10.1371/journal.pone.0154152. [DOI] [PMC free article] [PubMed] [Google Scholar]
- Sobotta MC, Liou W, Stöcker S, Talwar D, Oehler M, Ruppert T, Scharf AN, Dick TP. Peroxiredoxin-2 and STAT3 form a redox relay for H2O2 signaling. Nat Chem Biol. 2015;11:64–70. doi: 10.1038/nchembio.1695. [DOI] [PubMed] [Google Scholar]
- Suvorova ES, Lucas O, Weisend CM, Rollins MF, Merrill GF, Capecchi MR, Schmidt EE. Cytoprotective Nrf2 pathway is induced in chronically txnrd 1-deficient hepatocytes. PLoS ONE. 2009;4:e6158. doi: 10.1371/journal.pone.0006158. [DOI] [PMC free article] [PubMed] [Google Scholar]
- Thelander L, Reichard P. Reduction of ribonucleotides. Annu Rev Biochem. 1979;48:133–158. doi: 10.1146/annurev.bi.48.070179.001025. [DOI] [PubMed] [Google Scholar]
- Uchida K, Kanematsu M, Sakai K, Matsuda T, Hattori N, Mizuno Y, Suzuki D, Miyata T, Noguchi N, Niki E, Osawa T. Protein-bound acrolein: potential markers for oxidative stress. Proc Natl Acad Sci USA. 1998;95:4882–4887. doi: 10.1073/pnas.95.9.4882. [DOI] [PMC free article] [PubMed] [Google Scholar]
- Wilson EO, MacArthur RH. The theory of island biogeography. Princeton University Press; 1967. [Google Scholar]
- Yip WW, Burt AD. Alcoholic liver disease. Semin Diagn Pathol. 2006;23:149–160. doi: 10.1053/j.semdp.2006.11.002. [DOI] [PubMed] [Google Scholar]
- Zhang H, Du Y, Zhang X, Lu J, Holmgren A. Glutaredoxin 2 reduces both thioredoxin 2 and thioredoxin 1 and protects cells from apoptosis induced by auranofin and 4-hydroxynonenal. Antioxid Redox Signal. 2014;21:669–681. doi: 10.1089/ars.2013.5499. [DOI] [PMC free article] [PubMed] [Google Scholar]
Associated Data
This section collects any data citations, data availability statements, or supplementary materials included in this article.