

SUMMARY
Despite expression of oncogenic KRAS, premalignant pancreatic intraepithelial neoplasia 1 (PanIN1) lesions rarely become fully malignant pancreatic ductal adenocarcinoma (PDAC). The molecular mechanisms through which established risk factors such as chronic pancreatitis, acinar cell damage and/or defective autophagy increase the likelihood of PDAC development are poorly understood. We show that accumulation of the autophagy substrate p62/SQSTM1 in stressed KrasG12D acinar cells is associated with PDAC development and maintenance of malignancy in human cells and mice. p62 accumulation promotes neoplastic progression by controlling the NRF2-mediated induction of MDM2, which acts through p53-dependent and -independent mechanisms to abrogate checkpoints that prevent conversion of differentiated acinar cells to proliferative ductal progenitors. MDM2 targeting may be useful for preventing PDAC development in high-risk individuals.
In Brief
Todoric et al. demonstrate that pancreatitis-induced accumulation of the autophagy substrate p62/SQSTM1 in the context of oncogenic KRAS promotes progression to pancreatic ductal adenocarcinoma. This p62 function relies on NRF2-driven induction of MDM2 and both p53 dependent and independent activity of MDM2.
INTRODUCTION
Despite being a leading cause of cancer related deaths, pancreatic ductal adenocarcinoma (PDAC) is relatively rare with a worldwide incidence of 4.1 per 100,000 (Bray et al., 2013). However, pancreatic intraepithelial neoplasia1 (PanIN1), a premalignant precursor lesion, is extremely common, found in 16% of healthy controls and 60% of chronic pancreatitis patients (Hruban et al., 2008). Although most PanIN1 contain KRAS oncogenic mutations, only 1% of them ever progress to PDAC (Collins and Pasca di Magliano, 2013; Hruban et al., 2008). Nonetheless, several risk factors greatly increase the likelihood that PanIN1 lesions will progress to PDAC, including having first degree relatives with PDAC and chronic or cryptogenic pancreatitis (Becker et al., 2014; Levy et al., 2014). Obesity, smoking and alcohol consumption also increase PDAC risk. Thus, early PDAC screening may be economically justified in high risk individuals and together with effective chemoprevention may reduce the enormous death toll associated with the disease. Such efforts, however, require improved understanding of the mechanisms that control PanIN1 to PDAC progression. Obesity, hypernutrition, alcohol consumption, tobacco smoking and chronic pancreatitis have all been linked to impaired autophagic-lysosomal protein degradation in differentiated acinar cells, which specialize in production and secretion of digestive enzymes (Gukovsky et al., 2013). In mice that conditionally express oncogenic Kras alleles in pancreatic epithelial cells (PEC), PanIN1 to PDAC progression, which is very inefficient, is strongly accelerated by cerulein, a pancreatic enzyme secretagogue that induces acinar cell damage and acute pancreatitis (Carriere et al., 2009; Guerra et al., 2011). Cerulein also interferes with autophagy-dependent proteolysis (Mareninova et al., 2009), a process that is downregulated in human pancreatitis (Gukovsky et al., 2013). We postulated that insufficient autophagy, needed for protection of acinar cells from endoplasmic reticulum (ER) stress, to which they are highly susceptible (Antonucci et al., 2015), could be responsible for enhancing PanIN1 to PDAC progression.
Impaired autophagic degradation causes buildup of autophagy substrates, such as p62/SQSTM1, whose accumulation has been detected in mouse and human pancreatitis (Li et al., 2013). p62 aggregates are a common sign of chronic liver diseases that promote hepatocellular carcinoma (HCC) development (Denk et al., 2006). Recent studies have identified p62 as a key driver in HCC, whose high expression in non-tumor liver tissue predicts rapid recurrence after curative ablation (Umemura et al., 2016). In addition to being an autophagy receptor that recognizes poly-ubiquitinated proteins and organelles, p62 is a signaling adaptor that promotes activation of NF-κB and NRF2 transcription factors (Komatsu and Ichimura, 2010; Moscat and Diaz-Meco, 2009; Moscat et al., 2016). Given that NRF2 was shown to promote PanIN1 formation and proliferation in mice (DeNicola et al., 2011), we postulated that impaired acinar autophagy may stimulate neoplastic progression in the pancreas via a p62-NRF2 cascade. We therefore sought to determine how NRF2, which controls expression of enzymes that detoxify reactive oxygen species (ROS), overcomes the quiescent state of early PanINs. Of note, oncogene-induced senescence, which was suggested to be linked to ROS-accumulation in K-Ras transformed acinar cells (DeNicola et al., 2011), depends on activation of tumor suppressor p53 (Courtois-Cox et al., 2008), which controls transcription of cell cycle inhibitors and apoptosis inducers. p53 also inhibits cellular reprogramming thereby preventing acquisition of stemness (Kawamura et al., 2009; Marion et al., 2009), and is functionally inactivated in >80% of human PDAC (Waddell et al., 2015). Complete inhibition of autophagy accelerates PanIN1 progression to more proliferative PanIN2/3 lesions but blocks further malignant progression by inducing p53 accumulation (Rosenfeldt et al., 2013). Here, we investigate how the p62-NRF2 cascade accelerates development of stress-induced PDAC and helps maintain the malignant phenotype.
RESULTS
p62 Accumulates in Human PDAC and Affects Malignant Behavior
Immunohistochemistry (IHC) revealed much more p62 in advanced PanIN2/3 lesions and PDAC epithelial cells than in normal or chronically inflamed pancreata (Figures 1A and S1A). p62 did not accumulate in peritumoral stroma. SQSTM1 gene transcription is stimulated by NRF2 (Komatsu and Ichimura, 2010), a transcription factor proposed to protect K-Ras-transformed cells from ROS-induced senescence (DeNicola et al., 2011). In turn, p62 sequesters Keap1 which recruits the CUL3 E3 ligase to NRF2 to promote its degradation, thereby increasing NRF2 abundance (Komatsu and Ichimura, 2010). Congruently, expression of NRF2 and its target NQO1 paralleled p62 in PDAC specimens (Figures 1A and S1A). PanIN2/3 lesions and PDAC also exhibited elevated nuclear HES1, indicating active Notch signaling, a feature not obvious in chronic pancreatitis (Figure 1A). Expression of MDM2, which is mainly known as a negative regulator of p53 but has numerous other functions including Notch signaling activation (Fahraeus and Olivares-Illana, 2014; Pettersson et al., 2013), was also upregulated in human pancreatitis and PDAC (Figure 1A and S1A). MDM2 expression correlated with p62, NRF2 and NQO1 (R = 0.359, p < 0.001; R = 0.559, p < 0.001; and R = 0.403 and p < 0.001, respectively), suggesting a link between MDM2 and the p62-NRF2 axis. p62 expression in PDAC also overlapped that of Sox9 (Figure S1B), a transcriptional factor that controls acinar-to-ductal reprogramming and PDAC initiation (Kopp et al., 2012). In mouse pancreatitis, p62 accumulation is promoted by PEC-specific IKKα ablation (Li et al., 2013). In concordance with these findings, decreased IKKα expression was observed in human PDAC (Figure 1A) and it statistically correlated with elevated p62 (R = −0.419, p < 0.01; Figure S1A).
Figure 1. p62 Accumulates in Human PDAC and Maintains Malignancy.

(A) Representative immunohistochemical (IHC) analysis of normal human pancreata, pancreatitis and malignant tissues containing PanIN2/3 and PDAC with antibodies to indicated proteins. Scale bars: 25 µM. (B) Expression of indicated proteins in MIA PaCa-2 xenografts was examined by immunoblotting (IB) (n = 6). (C) Growth of MIA PaCa-2 xenografts transduced with either p62 or scrambled shRNA (n = 6). (D) Sphere formation by control and p62- ablated MIA PaCa-2 and Capan-2 cells (n = 6). (E) Sphere formation by control, IKKα-depleted and p62-ablated/IKKα-depleted MIA PaCa-2 and Capan-2 cells (n = 6). (F) Tumorigenic growth of control and IKKα-depleted MIA PaCa-2 cells. (G) Sphere formation by control and NRF2-ablated MIA PaCa-2 and Capan-2 cells (n = 6). (H) Tumorigenic growth of control and NRF2-ablated MIA PaCa-2 cells. p62, IKKα, and NRF2 ablation was examined by IB. Results in C–H are mean ± SEM; *, p < 0.05; **, p < 0.01; ***, p < 0.001. Statistical significance was calculated using Student’s t test (C–H). See also Figure S1.
p62 was expressed in human MIA PaCa-2 PDAC cells and its shRNA-mediated silencing reduced NRF2, HES1, progenitor (SOX9), ductal (CK19) and proliferative (Ki67) markers and diminished tumorigenic growth in immunocompromised mice (Figures 1B and 1C). Accordingly, p62 ablation in MIA PaCa-2 and Capan-2 human PDAC cells (Figure 1D) decreased KRT19, SOX9, NES, PDX1, PROX1, EPCAM, CD24, CD44, PROM1 and ALDH1 mRNAs, the last five of which mark PDAC stem cells (Matsuda et al., 2012), along with NRF2-regulated (GSTM1 and NQO1) genes and Notch pathway components (NOTCH1, NOTCH2, NOTCH3, NOTCH4 and HES1; Figure S1C). p62 ablation also diminished MDM2 mRNA expression in both cell lines. In p53-mutated MIA PaCa-2 cells p62 ablation increased CDKN1B mRNA, which codes for the cell cycle inhibitor p27. Despite the decrease in MDM2 mRNA, expression of p53 target genes, including CDKN1A, PMAIP1 and BBC3 was not increased (Figure S1C), congruent with the p53-deficient status of MIA PaCa-2 cells (Deer et al., 2010). Thus, p62 upregulation is important for maintaining malignant behavior even in p53-deficient PDAC. In Capan-2 cells, which harbor WT p53, the p62 deficiency increased expression of the cell-cycle inhibitors and p53 targets CDKN1A, PMAIP1 and BBC3. p62 ablation in both cell lines reduced sphere formation, a surrogate read-out for stemness (1D and S1D). By contrast, IKKα silencing enhanced sphere formation and modestly elevated p62 expression (Figure 1E). Of note, IKKα silencing in MIA PaCa-2 cells increased tumorigenic growth in immunocompromised mice and its effect on spheroid formation was blocked by p62 depletion, supporting the epistatic relationship between the two proteins (Figures 1E and 1F). Ablation of NRF2, encoded by the Nfe2l2 gene, was also accompanied by decreased sphere formation and tumorigenic growth in immunocompromised mice (Figures 1G, 1H, and S1E). Since cellular senescence is an established PDAC-suppressive mechanism (Guerra et al., 2011), we used senescence-associated (SA)-β-galactosidase (gal) and histone γ-H2AX to enumerate senescent cells. The results suggested that p62 and NRF2 deletions enhanced cellular senescence (Figures S1F and S1G). NRF2 activation, induced by KEAP1 ablation restored sphere formation and decreased senescence in p62-deficient human MIA PaCa-2 and Capan-2 PDAC cells (Figures S1H and S1I), suggesting that p62 promotes a cancer stem/progenitor cell character via NRF2.
p62 Accelerates PanIN1 to PDAC Progression in Chronic Pancreatitis
We used mice to investigate whether conditions that promote p62 accumulation contribute to acinar-to-ductal metaplasia (ADM) and neoplastic progression. Since by interfering with autophagic proteolysis, PEC-specific IKKα ablation causes chronic pancreatitis accompanied by p62 accumulation (Li et al., 2013), we crossed ChukΔpan (hereafter IkkαΔpan) mice with Pdx1-Cre;LSL-KrasG12D/+ (hereafter KrasG12D) mice, which develop PanIN1 lesions by 2 weeks of age but rarely progress to PDAC within their first year (Hingorani et al., 2003). KrasG12D;IkkαΔpan mice were obtained at the expected frequency but manifested weight loss and abdominal distension at 4–5 weeks, and at 8 weeks were obviously distressed. Necropsy revealed a large, irregularly shaped white mass occupying the entire pancreas and compressing the duodenum, with gallbladder dilation and splenomegaly (Figure 2A). Age-matched KrasG12D mice displayed only 1–2 small, white nodules on a normal pancreas. Eight-week-old KrasG12D;IkkαΔpan mice lacked normal acinar tissue, and already at 5 weeks exhibited multiple tumor nodules. Histology revealed abundant ADM, which is used to repair pancreatic injuries (Murtaugh and Keefe, 2015), and PanIN lesions of different stages in KrasG12D;IkkαΔpan pancreata, whereas KrasG12D pancreata contained only low-grade PanIN1 at five weeks of age (Figure 2B). These pronounced pathological changes were accompanied by rapid neoplastic progression in KrasG12D;IkkαΔpan animals, which showed multiple PanIN2/3 lesions by 8 weeks and hardly any normal acinar cells, dramatically shortened tumor latency and aggressive PDAC by 2 months with a median 5 month survival (Figures 2B–2D). KrasG12D;IkkαΔpan tumors displayed elevated p62 and LC3II in transformed acinar cells (Figure 2E), but little further increase in Sqstm1/p62 mRNA, which was already elevated in KrasG12D mice (Figure 2F). Using ductal-specific Dolichos biflorus agglutinin (DBA) and acinar-specific Ulex europaeus agglutinin I (UEA-I) lectin labeling we isolated ductal and acinar cells from mouse pancreata (Reichert et al., 2013; Xiao et al., 2016). NRF2 target genes were upregulated in KrasG12D relative to WT mice, but IKKαΔpan ablation resulted in significant further increase in gene expression in both cell fractions (Figure 2G).
Figure 2. Chronic Pancreatitis Enhances PanIN to PDAC Progression and p62 Accumulation.

(A) Gross morphology of pancreata from KrasG12D and KrasG12D;IkkαΔpan mice, whose age is indicated. Arrow – pancreas. (B) H&E and amylase stained pancreatic sections from above mice. Scale bars: 100 µm. (C) Tumor latency (n = 6). (D) Kaplan-Meier survival curves (n = 6). (E) IB analysis of pancreatic lysates from 5-week-old mice. (F) Q-RT-PCR of Sqstm1 mRNA in 5-week-old mice of indicated genotypes (n = 5). (G) Q-RT-PCR of NRF2 target genes in RNA isolated from acinar and ductal cells of 5-week-old mice of indicated genotypes (n = 5). (H, I) Quantification of lesions per high power (200×) field (HPF) in 5- and 8-week-old mice of indicated genotypes (n = 5) for ADM (H) and PanIN (I). (J) Quantification of Ki67 staining in pancreata of 5-week-old mice. (K) IB analysis of pancreatic lysates. Loading control (ERK) is in panel E. (L) IHC of Sox9 and CK19 in pancreata of 5-week-old mice. Scale bars: 25 µm. (M) IHC of NQO1, MDM2 and HES1 in ductal progenitor lesions of 5-week-old mice. Scale bars: 25 µm. (N) p53 IB of pancreatic lysates from 5-week-old mice. Results in C and F–J are mean ± SEM; **, p < 0.01; ***, p < 0.001; ND, not detected. Statistical significance was calculated using Student’s t test (C, F–J) or log-rank test (D). See also Figure S2.
Although ADM can give rise to PanINs that may further progress to PDAC, it usually forms in response to pancreatic damage (Murtaugh and Keefe, 2015). ADM and PanIN multiplicity, grade and size were markedly elevated in KrasG12D;IkkαΔpan mice relative to KrasG12D mice already at 5 weeks of age (Figures 2H and 2I). IKKα-deficient specimens contained many more proliferative cells (Ki67, PCNA, cyclin D1 and pERK positive) and showed an increase in Ck19-, SOX9-, or Alcian blue-positive ductal precursor lesions compared to IKKα-expressing KrasG12D counterparts (Figures 2J–2L and S2A). Furthermore, the NRF2 target NQO1, MDM2 and HES1 were more strongly expressed in IKKα-deficient ductal precursor lesions (Figure 2M). Unlike Atg7 deletion, which completely blocks autophagy and induces massive p53 accumulation (Rosenfeldt et al., 2013), IKKα deficiency slightly reduced p53 protein expression (Figure 2N). Serum amylase and lipase were dramatically elevated in KrasG12D;IkkαΔpan mice (Figure S2B), indicating extensive acinar injury. KrasG12D;IkkαΔpan acinar and ductal cells, exhibited markedly elevated expression of ductal (Krt19)-, progenitor (Sox9, Nes, Pdx1 and Prox1)- and stemness (Epcam, Cd24, Cd44, Prom1, Aldh1)-related transcripts along with Notch (Notch1, Notch2, Notch3, Notch4, Hes1) targets and components (Figure S2C). Of note, the fold-increase in ductal (Krt19) and certain progenitor markers (Nes, Pdx1, Prox1) was much greater in the IKKα-deficient acinar fraction due to lower basal expression relative to ductal cells. Expression of pro-apoptotic p53 targets (Pmaip1, Bbc3) was decreased along with Cdkn1b mRNA in both fractions, while Trp53 mRNA remained unaltered and Mdm2 mRNA was upregulated on IKKα ablation, especially in the ductal fraction (Figure S2C). Elevated Sirius Red and α smooth muscle actin (αSMA) staining, indicative of stellate cell activation and fibrosis, massive immune cell infiltration, primarily F4/80+ macrophages, and accumulation of fibrosis-and inflammation-related transcripts (Acta2, Col1a1, Col3a1, Tgfb1, Timp1, Ccl2, Ccl5, Tnf, Il6 and Il1b) also accompanied IKKα loss (Figures S2D and S2E).
p62 Drives Stress-Induced Malignant Progression
p62 ablation in KrasG12D;IkkαΔpan mice reduced ADM, inhibited appearance of advanced PanIN lesions, and reversed acinar cell loss (Figures 3A and 3B). Notably, p62 ablation also prolonged KrasG12D;IkkαΔpan mouse survival by approximately 50% (Figure 3C) and reduced the number of proliferative (Ki67+) cells (Figures 3A and S3A). Ductal progenitor and stemness markers were downregulated along with MDM2 and NRF2 and Notch targets upon p62 ablation, in both acinar and ductal cells (Figures 3B, 3D, and 3E). The effect of p62 ablation on progenitor and ductal markers was most striking in the acinar cell fraction. Furthermore, Cdkn1a (p21) and Cdkn1b (p27) mRNAs were elevated, especially in acinar cells. In line with this, p53 protein was higher in KrasG12D;Ikkα/Sqstm1Δpan (hereafter KrasG12D;Ikkα/p62Δpan) than in KrasG12D;IkkαΔpan mice (Figure 3F). By contrast, the stem-cell marker ALDH, whose expression was elevated in KrasG12D;IkkαΔpan cells, was lower in KrasG12D;Ikkα/p62Δpan double knockouts (Figures 3G and S3B). Sorted EpCAM+;ALDH+ KrasG12D;IkkαΔpan PEC exhibited much higher sphere forming ability than KrasG12D;Ikkα/p62Δpan EpCAM+;ALDH+ cells (Figures 3H and S3C), underscoring p62 importance in augmenting stemness or proliferative capacity.
Figure 3. p62 Ablation Attenuates Pancreatitis-Accelerated Neoplastic Progression.

(A) Quantification of ADM and PanIN1 density, amylase and Ki67 staining of pancreatic sections of indicated 5-week-old mice (n = 5). (B) H&E staining, amylase IHC, amylase and CK19 co-IF, and Sox9 IHC of pancreatic sections from indicated 5-week-old mice. Scale bars: 25 µm. (C) Kaplan-Meier survival curves of indicated mouse strains (n = 10). (D) Q-RT-PCR analysis of mRNA in acinar and ductal cell fractions from indicated 5-week-old mice (n = 5). (E) NQO1, MDM2 and HES1 IHC of pancreatic sections from indicated 5-week-old mice. Scale bars: 25 µm. (F) p53 IB analysis of pancreatic lysates from 5-week-old mice of indicated genotypes. (G) Frequency of ALDH expression in EpCAM+ cells from 8-week-old KrasG12D (n = 3), KrasG12D;IkkαΔpan (n = 7), and KrasG12D;Ikkα/p62Δpan (n = 4) mice. (H) Sphere-forming capacity of isolated ALDH+ cells from indicated genotypes (n = 3 per group). (I) Sphere formation of control and p62-ablated MIA PaCa-2 and Capan-2 cells with or without NICD1 overexpression. (J) Representative images and quantified SA-β-gal staining and γ-H2AX and ERK1/2 IB of cells as in I. Scale bars: 100 µm. Results in A, D, and G–J are mean ± SEM; *, p < 0.05; **, p < 0.01; ***, p < 0.001. Statistical significance was calculated using Student’s t test (A, D, G–J) or log-rank test (C). See also Figure S3.
Coactivation of Kras and Notch promotes rapid reprogramming of acinar cells to a ductlike phenotype and PanIN formation (De La et al., 2008; Thomas et al., 2014). Conversely, Notch inhibition suppresses PDAC cell proliferation and tumor growth (Wang et al., 2006; Yabuuchi et al., 2013). Having shown in human PDAC cell lines and mice that p62 promotes progenitor and stem-cell features and PanIN formation, we postulated that p62 affects Notch signaling during PDAC development. Indeed, overexpression of human Notch1 intracellular domain (NICD1) abrogated the decrease in progenitor and stem cell markers in p62-deficient PDAC cells and suppressed senescence, regardless of p53 status (Figures 3I, 3J, and S3D).
Cerulein-induced pancreatitis accelerates PDAC development in KrasG12D mice (Carriere et al., 2009). To determine the role of p62 in this model, KrasG12D and KrasG12D;p62Δpan mice were treated with PBS or cerulein and were analyzed 2 or 12 days later. At day 2, both strains exhibited damage-induced ADM development, but on day 12, when KrasG12D pancreata displayed big fibrotic nodules containing ADM, advanced PanIN and few remaining acinar cells, KrasG12D;p62Δpan pancreata exhibited fewer lesions and little amylase+ acinar cell loss (Figures 4A–4D). As described (Guerra et al., 2007), cerulein treatment decreased senescent (SA-β-gal+) and increased proliferative (Ki67+) cells in KrasG12D PanINs but this was not seen in KrasG12D;p62Δpan PanINs (Figures 4E–4G). Furthermore, p62 ablation in KC cells, originally derived from developed KrasG12D tumors, that were injected orthotopically into C57BL/6J mice resulted in substantially longer host survival, even in cerulein treated hosts (Figure 4H).
Figure 4. p62 Ablation Impairs Cerulein-Induced Neoplastic Progression.

(A) H&E staining of pancreatic tissue from indicated 5-week-old mice 2 days after cerulein treatment. Scale bars: 50 µm. (B) H&E staining, amylase and CK19 co-IF, and Sox9 IHC of pancreatic sections from indicated mice 12 days after cerulein treatment. Scale bars: 50 µm. (C) Alcian blue and amylase staining of same tissues as above. Scale bars: 25 µm. (D) Quantification of areas occupied by Alcian blue positive ductal lesions and residual amylase positive acinar cells (n = 6). (E) Ki67 IHC and X-Gal staining of PanIN lesions from cerulein treated mice of indicated genotypes. Scale bars: Ki67, 12.5 µm; X-gal, 25 µm; inset, 12.5 µm. (F) Quantification of Ki67 positive cells in above tissues (n = 6). (G) Quantification of SA-β-gal positive cells (n = 6). (H) Kaplan-Meier survival curves of cerulein or PBS-treated WT mice orthotopically injected with control or p62-deficient KC cells (n = 10). Results in D, F and G are mean ± SEM; *, p < 0.05. Statistical significance was calculated using Student’s t test (D, F, G) or log-rank test (H). See also Figure S4.
Consistent with its effect on autophagy (Mareninova et al., 2009), cerulein treatment induced p62 and NRF2 accumulation and ERK activation, all of which were prevented by p62 ablation, which also decreased cerulein-induced ductal, progenitor and stemness markers, NRF2 and Notch signaling targets and inflammatory genes (Figures S4A and S4B). The p62 deficiency also resulted in lower amounts of Mdm2 mRNA and higher expression of p53 target genes in cerulein-treated pancreata.
The p62-NRF2 Axis Controls Malignant Progression and Reprogramming
To uncover NRF2 role in p62-induced neoplastic progression and acinar to ductal reprogramming, we generated KrasG12D;IkkαΔpan;Nfe2l2−/− mice (hereafter KrasG12D;IkkαΔpan;Nrf2−/−). NRF2 loss attenuated ADM formation and all three stages of PanIN lesions and significantly prolonged KrasG12D;IkkαΔpan mouse survival, with the strongest effect on PanIN2 and 3 (Figures 5A–5C). NRF2 ablation also reduced CK19, ALDH, HES1 and MDM2 expression in 5-week-old pancreata and dramatically increased p27 (Figure 5D). Nonetheless, Mdm2 mRNA, NRF2 and Notch pathway targets as well as ductal, progenitor and stemness markers showed lower expression in acinar and ductal cells from KrasG12D;IkkαΔpan;Nrf2−/− mice, whereas senescence-related transcripts, such as Cdkn1a and Cdkn1b, were more highly expressed (Figures S5A and S5B). NRF2-deficient ductal lesions displayed markedly weaker NQO1, MDM2 and HES1 staining (Figure S5C).
Figure 5. NRF2 Mediates Pancreatitis-Accelerated Neoplastic Progression and Induction of Stemness Genes.

(A) Quantification of ADM and PanIN lesions in pancreata of 5-week-old mice of indicated genotypes (n = 9). (B) H&E staining of above tissues. Insets show representative PanIN3 in NRF2-expressing tissue and PanIN1 in NRF2-deficient tissue. Scale bars: 50 µm; inset: 25 µm. (C) Kaplan-Meier survival curves of indicated mouse strains (n = 10). (D) IB analysis of pancreatic lysates from above mice. (E, F) Q-RT-PCR analysis of RNA isolated from acinar cells that were cultured for 3 days in Matrigel after transfection with empty or p62 expression vectors (3 µg; n = 3). KrasG12D (E). KrasG12D ;Nrf2−/− (F). (G) Sphere formation by control and NRF2-ablated MIA PaCa-2 and Capan-2 cells with or without NICD1 overexpression. (H) Quantification of SA-β-gal staining of cells as in G. Results in A, E–H are mean ± SEM; *, p < 0.05; **, p < 0.01; ***, p < 0.001. Statistical significance was calculated using Student’s t test (A, E–H) or log-rank test (C). See also Figure S5.
Three-dimensional (3D) Matrigel culture of non-transformed acinar cells can be used to study ADM, during which acinar cells are converted to more proliferative ductal progenitors (Hall and Lemoine, 1992; Shi et al., 2013). Matrigel culture upregulated progenitor, ductal and stemness marker transcripts, as well as Sqstm1/p62 mRNA, NRF2 targets and Notch pathway components, but decreased expression of the key acinar marker amylase (Figure S5D). IKKαF/F, IKKαΔpan, IKKα/p62F/F, and IKKα/p62Δpan acinar cells formed spheroids of similar morphology during their first 4 days in Matrigel, but IKKαΔpan spheroids were much larger than the rest and the only ones with ductal morphology on day 6 (Figures S5E and S5F), suggesting that p62, which is elevated upon Ikkα ablation, maintains acinar to ductal transdifferentiation and proliferative potential. Indeed, ectopic p62 expression in Matrigel-cultured primary KrasG12D acinar cells (Figure S5G) increased mRNAs encoding CK19, progenitor and stemness markers, NRF2 and Notch targets, Mdm2 and inhibited p53 target genes (Figure 5E). p62 overexpression also increased mRNAs encoding inflammatory chemokines and cytokines. Similar experiments were conducted on KrasG12D;Nrf2−/− acinar cells. The NRF2 deficiency abrogated most p62-dependent alterations in gene expression and only Sox9 mRNA was still elevated (Figure 5F), confirming that Sox9 upregulation is NRF2-independent. Similar results were obtained using a p62ΔKIR variant, which does not bind Keap1 and cannot activate NRF2 (Komatsu et al., 2010). Although p62ΔKIR still induced Sox9, Notch4 and Il1b mRNAs, it did not upregulate other p62-responsive and NRF2-dependent transcripts, including Mdm2 mRNA (Figure S5H).
Consistent with results obtained with p62-ablated human PDAC cell lines, NICD1 overexpression in MIA PaCa-2 and Capan-2 cells partially abrogated the decrease in sphere formation induced by NRF2 ablation and suppressed the increase in senescence (Figures 5G, 5H, S5I, and S5J). These results suggest that the tumor-promoting link between the p62-NRF2 axis and Notch signaling also operates in human PDAC.
p53 Blocks MDM2-Mediated p62-Induced Reprogramming
The ability of p53 to limit stem cell characteristics and reprogramming is well-established (Spike and Wahl, 2011). p53 also blocks PanIN1 to PDAC progression in Atg7Δpan mice (Rosenfeldt et al., 2013). We investigated whether p53 blocks p62-induced ductal reprogramming of primary KrasG12D acinar cells. Indeed, co-transfection with exogenous p53 or inhibition of the p53 antagonist Mdm2 with Nutlin-3 (Vassilev et al., 2004) abrogated the p62-induced increase in Krt19, Pdx1, Prox1, Aldh1 mRNAs and other progenitor markers without affecting p62 mRNA (Figures 6A and 6B). Nutlin-3 treatment and p53 overexpression also abrogated p62-enhanced formation of ADM-like structures in Matrigel (Figure 6C). Of note, Nutlin-3 treatment reduced pancreatic weight (a measure of tumor growth), ADM and PanIN formation and prevented loss of pancreatic cellularity in KrasG12D;IkkαΔpan mice and cerulein-treated KrasG12D mice (Figures 6D–6F). Nutlin-3-treated 3-month-old KrasG12D mice, in which neoplastic progression was not induced by genetic changes or cerulein treatment, showed a decrease in ADM and PanIN-1 formation that failed to reach statistical significance and no change in pancreatic weight. Nutlin-3 treatment of KrasG12D;IkkαΔpan mice and cerulein-treated KrasG12D mice also reduced expression of Notch targets, ductal, progenitor and stem cell markers and increased expression of p53 targets and the senescence inducer Cdkn1b, but did not affect inflammation-related transcripts (Figures S6A and S6B). In vitro, Nutlin-3 inhibited sphere formation by control and Ikkα-ablated KC cells, while it had no effect on Ikkα/p62 KO or Ikkα/Nrf2 KO KC cells (Figure 6G) suggesting that the Nutlin-3 effect depends on the p62-Nrf2 axis. In the p53 null KPC cell line, Nutlin-3 treatment had no effect on sphere formation, indicating that its effect is p53-dependent (Figure 6H). Considering the importance of both p53 and Notch pathways in control of stemness and progenitor characteristics, we investigated their relative importance in our system. Sphere formation by IKKα-ablated cells was partly reduced by p53 overexpression or the Notch pathway inhibitor DAPT and completely inhibited by a combination of the two (Figure 6I).
Figure 6. p53 inhibits p62 Induction of Stem/Progenitor Marker Genes.

(A, B) Q-RT-PCR mRNA analysis primary KrasG12D acinar cells transfected with control or p62 expression vectors with or without p53 (A) or with or without Nutlin-3 (10 µM) treatment (B) (n = 3 each panel). (C) Quantification of duct-like structures formed by KrasG12D primary acinar cells transfected with either empty or p62 and/or p53 expression vectors and cultured for 4 days in Matrigel with or without Nutlin-3 (n = 3). (D) H&E stained pancreatic sections from mice of indicated genotypes treated with DMSO or Nutlin-3 for 21 days (KrasG12D and cerulein-treated KrasG12D) or 14 days (KrasG12D;IkkαΔpan) (n = 7). (E, F) Pancreata of 5-week-old KrasG12D and KrasG12D;IkkαΔpan mice (n = 7 each group), treated as indicated. Pancreas weight (E) and ADM and PanIN lesions (F). (G, H) Sphere formation by Nutlin-3 (10 µM) or DMSO-treated control or Ikkα-ablated KC (G) and KPC (H) cells with or without p62 or NRF2 ablation. (I) Sphere formation of control or IKKα-ablated Capan-2 human PDAC cells with or without p53 overexpression and/or DAPT treatment (10 µM). Results in A–C, E–I are mean ± SEM; *, p < 0.05; **, p < 0.01; ***, p < 0.001 by Student’s t test. See also Figure S6.
Consistent with previous reports (Rosenfeldt et al., 2013), Atg7-ablation in IkkαΔpan mice resulted in massive p62 and p53 induction, but much lower CK19 and ALDH expression despite the increase in p62 (Figure S6C).
NRF2 Controls Mdm2/MDM2 Transcription
NRF2 is elevated in PDAC, correlating with neoplastic cell proliferation, resistance to chemo- and radio-therapy and poor survival (Lister et al., 2011; Soini et al., 2014). NRF2-regulated antioxidant response facilitates KrasG12D-induced PanIN formation, proliferation, and senescence evasion (DeNicola et al., 2011), but transcriptional targets through which NRF2 exerts these pro-tumorigenic functions in PDAC were not identified. Given the strong correlation between NRF2 activation and elevated Mdm2/MDM2 expression in mouse and human PDAC, we investigated whether NRF2 directly controls these genes. We first used an Mdm2 promoter-driven luciferase reporter (Figure S7A). Both, p62 and NRF2 stimulated reporter expression, although their effect was not as strong as that of p53 (Figure 7A). A pharmacological NRF2 activator, sulforaphane (Negrette-Guzman et al., 2013), also stimulated Mdm2 promoter activity, whereas co-transfection of p62 with Nrf2 shRNA inhibited reporter expression (Figure 7A). To verify these results, the NRF2 binding site (ARE) located upstream to the P2 Mdm2 promoter was inactivated (Figure S7A). The mutation obliterated the response to p62, NRF2 or sulforaphane but had no effect on the response to p53 (Figure 7A). Chromatin immunoprecipitation (ChIP) revealed recruitment of NRF2 and its dimerization partners, the small Maf proteins (Motohashi et al., 2004), to the conserved NRF2 binding site (ARE) upstream to the human or mouse P2 MDM2/Mdm2 promoter in human MIA PaCa-2 and mouse KPC cells, respectively (Figures 7B, S7B, and S7C). No significant recruitment of NRF2 or Maf proteins to an intronic region was observed. To further establish specificity, we performed ChIP on NRF2-ablated KPC and MIA PaCa-2 cells. No NRF2 promoter recruitment was observed in these cells (Figures 7B and S7B). Oncomine search of PDAC and normal pancreatic tissue datasets revealed a significant increase in MDM2 mRNA expression in PDAC (Figure S7D).
Figure 7. The p62-NRF2-MDM2 Module Controls Stemness and Senescence via Notch Signaling.

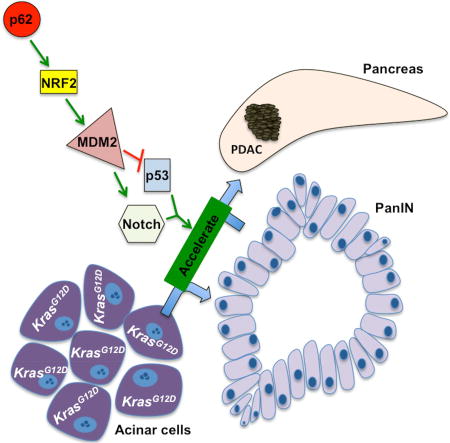
(A) Effects of p53, p62 and NRF2 overexpression, NRF2 silencing and sulforaphane on Mdm2 promoter activity in transfected KPC cells (n = 3). (B) Chromatin immunoprecipitation assays probing NRF2 and small MAF protein recruitment to the MDM2 promoter in WT and NRF2 ablated MIA PaCa-2 (n = 3) cells. (C) Sphere formation of control or MDM2-ablated MIA PaCa-2 and Capan-2 cells with or without NICD1 overexpression. (D) SA-β-gal staining and γ-H2AX IB of cells as in C. (E) Sphere formation of control and p62-ablated MIA PaCa-2 and Capan-2 cells with or without MDM2 CRISPR-mediated activation vector (n = 3). (F) SA-β-gal staining and γ-H2AX IB of cells as in E. (G) Sphere formation of control and NRF2-ablated MIA PaCa-2 and Capan-2 cells with or without MDM2 CRISPR-mediated activation vector (n = 3). (H) SA-β-gal staining and γ-H2AX IB of cells as in G. (I) A scheme explaining how p62 accumulation, operating via the NRF2-MDM2 module leads to dedifferentiation and cell cycle progression in preneoplastic lesions in pancreas. Results are mean ± SEM; *, p < 0.05; **, p < 0.01; ***, p < 0.001 by Student’s t test. See also Figure S7.
MDM2 can suppress expression of genes associated with a differentiated cell phenotype in a p53-independent manner (Sczaniecka et al., 2012; Wienken et al., 2016). In agreement with such reports, MDM2 ablation in either p53-negative MIA PaCa-2 cells or p53-positive Capan-2 cells reduced expression of Notch targets, ductal, progenitor and stem-cell markers and increased expression of senescence-related genes including Cdkn1b mRNA (Figures S7E and S7F), which was mirrored by decreased sphere formation and elevated number of SA-β-gal positive cells and γ-H2AX amounts (Figures 7C and 7D). Both effects were partly abrogated by NICD1 overexpression. In line with this, transfection of p62- and NRF2-deleted MIA PaCa-2 and Capan-2 cells with a CRISPR-based MDM2 activation plasmid increased sphere formation and reduced SA-β-gal and γ-H2AX (Figures 7E–7H).
DISCUSSION
In addition to the initiating KRAS mutation, PDAC development requires accumulation of other mutations (Jones et al., 2008). However, given the ability of activated K-Ras to induce senescence (Serrano et al., 1997) and the high frequency of KRAS mutations in low grade PanIN1 lesions, most of which will never progress to PDAC (Hruban et al., 2008), it is important to understand how KRAS-activated acinar cells acquire additional oncogenic mutations and traits. Pharmacological inhibition of such mechanisms may prevent PDAC development in high risk individuals. Likely, acquisition of additional mutations by KRAS-activated acinar cells requires dismantling of oncogene-induced senescence, a potent tumor suppressive process thought to depend on ROS-accumulation (Courtois-Cox et al., 2008). Indeed, the master activator of the anti-oxidant defense, NRF2, whose expression is elevated in KrasG12D mice was shown to abrogate senescence and cell death, fostering PanIN generation and proliferation (DeNicola et al., 2011). Additional stress linked to disrupted autophagic proteolysis, which induces p62 accumulation, further augments NRF2 activation via p62-mediated titration of Keap-1, a substrate adapter for the E3 ubiquitin ligase complex responsible for NRF2 degradation (Komatsu and Ichimura, 2010). Although NRF2 activates SQSTM1 gene transcription, p62 accumulation depends on inhibition of its autophagic degradation (Komatsu and Ichimura, 2010). Once p62 accumulates and NRF2 is activated, genes whose products abrogate oncogene-induced senescence and increase the proliferation of KrasG12D acinar cells are induced. Amongst these genes, the most critical NRF2 target is MDM2/Mdm2, whose ablation or pharmacological inhibition prevents pancreatitis-accelerated PDAC development and loss of acinar tissue in mice. Moreover, MDM2 ablation in either p53-negative MIA PaCa-2 or p53-positive Capan-2 human PDAC cells phenocopies the effects of NRF2 ablation, leading to reduced expression of Notch targets, ductal progenitor and stem-cell markers and elevated expression of the senescence inducer p27.
Although old age is one of the strongest PDAC risk factors, in younger individuals PDAC risk is strongly enhanced by chronic pancreatitis, excessive alcohol consumption, tobacco smoking and obesity (Becker et al., 2014). Mouse studies have confirmed the ability of pancreatic injury to accelerate PanIN1 to PDAC progression and invoked inflammation-related mechanisms, including COX2 and IL-6 induction and STAT3 activation (Corcoran et al., 2011; Guerra et al., 2011; Lesina et al., 2014; Muller-Decker et al., 2006). Our results suggest that acinar cell stress triggers neoplastic progression in pancreas via the p62-NRF2-MDM2 module. Both IKKα ablation and repetitive cerulein treatment induce accumulation of p62, whose expression is also elevated in human pancreatitis (Li et al., 2013) and is even more pronounced in advanced PanIN2/3 lesions and PDAC. Although p62 induction by either IKKα ablation or cerulein treatment is lower than the effect of complete autophagy blockade, p62 is critically needed for acceleration of neoplastic progression and PDAC development in KrasG12D mice subjected to experimental pancreatitis. Such mice are p53 positive, but unlike ATG7 ablation, which blocks malignant progression through massive p53 accumulation (Rosenfeldt et al., 2013), IKKα ablation slightly reduces p53 expression and induces expression of the p53 antagonist MDM2. Although it is not clear how elevated p62 protein expression is maintained in established PDAC, it is absolutely required for maintaining the malignant phenotype of MIA PaCa-2 and Capan-2 cells, where it also activates NRF2 and induces MDM2 expression.
NRF2 and its target gene NQO1 were elevated in the vast majority of human PDAC specimens analyzed in our study and were previously linked to a more malignant phenotype, drug resistance and decreased survival (Jones et al., 2008; Lister et al., 2011; Soini et al., 2014). However, analysis of over 100 human pancreatic cancer specimens revealed no NFE2L2 mutations (DeNicola et al., 2011), in contrast to HCC where 14% of tumors contain either NFE2L2 gain-of-function or KEAP1 loss-of-function mutations (Schulze et al., 2015; Shibata and Aburatani, 2014). As indicated by analysis of MIA PaCa-2 and Capan-2 cells, NRF2 activation in human PDAC is maintained by p62, which also drives NRF2 expression and activity prior to malignant establishment in KrasG12D mice. While oncoproteins such as K-Ras and c-Myc induce NFE2L2 gene transcription (DeNicola et al., 2011), the gene product NRF2 is rapidly degraded in cells that are not subjected to oxidative stress due to Keap-1-mediated ubiquitination (Kobayashi et al., 2006). Accumulation of p62, NRF2 or its target NQO1 in premalignant lesions may therefore be due to oxidative stress and could be useful for confirming elevated PDAC risk in susceptible individuals.
NRF2 activation was proposed to facilitate PanIN formation and proliferation by suppressing ROS-induced senescence or cell death (DeNicola et al., 2011; Zhang et al., 2013). However, it was never conclusively shown that activation of the antioxidant response is required for bypass of K-Ras-induced senescence. Our studies suggest that NRF2 promotes PDAC progression by inducing MDM2/Mdm2 transcription, which abrogates the p53-imposed programming checkpoint, reduces expression of the senescence inducer p27 and activates Notch signaling (Figure 7I). The NRF2-MDM2 module also controls earlier steps that precede neoplastic progression, including ADM, the major pancreatic repair process in which differentiated acinar cells are converted to ductal progenitors (Murtaugh and Keefe, 2015). MDM2 gene ablation or the MDM2 inhibitor Nutlin-3 reduce progenitor and stemness markers in both p53-positive and -negative cells. Of note, Nutlin-3 treatment of KrasG12D;IkkαΔpan or cerulein-treated KrasG12D mice prevented acinar cell loss, abrogated tumor growth, and reduced Notch signaling components, ductal progenitor and stemness markers, while inducing p53 target genes and p27. Although MDM2 is a well-established p53 antagonist, it has p53-independent activities, including induction of stemness by supporting polycomb repressor functions (Wienken et al., 2016) and K48-linked ubiquitination of the Notch antagonist Numb (Yogosawa et al., 2003). Notch signaling activation during pancreatitis inhibits the acinar cell fate (De La and Murtaugh, 2009; Jensen et al., 2005; Murtaugh et al., 2003), which we find to be maintained upon MDM2 inhibition. Notch activation, marked by Hes1, is also NRF2-dependent and known to promote progenitor cell proliferation by repressing transcription of p27-encoding Cdkn1b (Murata et al., 2005), whose expression is strongly upregulated on MDM2 deletion in p53-negative MIA PaCa-2 cells. In summary, it is quite clear that MDM2 can regulate cell proliferation independently of p53 via the Notch-p27 axis, explaining how p62 and NRF2 control malignant behavior in p53 negative cells.
In sum, our results illustrate a key role for p62-promoted NRF2-dependent MDM2 induction in control of acinar cell plasticity and reprogramming, a process known as ADM. When this injury-and stress-activated process affects acinar cells that harbor an oncogenic KrasG12D, it accelerates acquisition of malignant traits. These findings suggest that treatment of individuals who are at high risk of PDAC development with new and improved MDM2 inhibitors, currently under development (Holzer et al., 2015; Wang et al., 2014), may prevent PanIN to PDAC progression and reduce the toll of this currently incurable malignancy.
STAR METHODS
CONTACT FOR REAGENT AND RESOURCE SHARING
Further information and requests for resources and reagents should be directed to and will be fulfilled according to institutional rules by the Lead Contact, Michael Karin (karinoffice@ucsd.edu).
EXPERIMENTAL MODEL AND SUBJECT DETAILS
Cell Lines
Capan-2 (source: male) and MIA PaCa-2 (source: male) pancreatic cancer cells were obtained from the American Type Culture Collection (Rockville, MD). The KC (UN-KC-6141) and KPC (UN-KPC-960) cell lines were generated in Dr. Surinder K. Batra lab at the University of Nebraska Medical Center (Omaha, NE) and derived from pancreatic tumors of a KrasG12D;Pdx1-Cre (KC) mouse at 50 weeks of age and KrasG12D;Trp53R172H;Pdx1-Cre (KPC) mice at 17 weeks of age, respectively. Information on gender of KC and KPC cell lines is not publicly available. All cell lines were cultured in Dulbecco’s Modified Eagle Medium (DMEM) supplemented with 10% fetal bovine serum, penicillin (100 mg/ml) and streptomycin (100 mg/ml) and incubated at 37°C in a humidified chamber with 5% CO2. All cells were passaged with 0.25% trypsin/2.21 mM EDTA in PBS when they reached a confluency of 75–80%.
Primary Cells
Source and culturing conditions for the primary cells are described in the detailed methods section.
Mice
Female NOD.CB17-Prkdcscid/NCrCrl, so-called NOD-SCID and C57BL/6 mice were obtained at 8 weeks of age from Charles River Laboratories and The Jackson Laboratory, respectively. B6.FVB-Tg(Pdx1-cre)6Tuv/J (termed Pdx1-Cre) and B6.129S4-Krastm4Tyj/J (LSL-KrasG12D) breeding pairs were obtained from The Jackson Laboratory. IKKαF/F, Atg7F/F, p62F/F and B6.129×1-Nfe2l2tm1Ywk/J (Nrf2−/− ) were generous gifts from Boehringer Ingelheim (Ingelheim am Rhein, Germany), Dr. Masaaki Komatsu at Niigata University (Niigata, Japan), Dr. Jorge Moscat at Sanford Burnham Prebys Medical Discovery Institute (La Jolla, CA) and Dr. David A. Tuveson at Cold Spring Harbor Laboratory (Cold Spring Harbor, NY), respectively and were previously described (Chan et al., 1996; Komatsu et al., 2005; Liu et al., 2008; Muller et al., 2013) Pdx1-Cre, LSL-KrasG12D, IkkαF/F, p62F/F, Nrf2−/− and Atg7F/F mice were interbred as needed to obtain the compound mutants Pdx1-Cre;LSL-KrasG12D (termed KrasG12D), Pdx1-Cre; IKKαF/F; LSL-KrasG12D (termed KrasG12D;IkkαDpan), Pdx1-Cre; p62F/F; LSL-KrasG12D (termed KrasG12D;p62Dpan), Pdx1-Cre; IKKαF/F;p62F/F; LSL-KrasG12D (termed KrasG12D;Ikkα/p62Dpan), Pdx1-Cre; IkkαF/F; Nrf2−/−;LSL-KrasG12D (termed KrasG12D;IkkαDpan;Nrf2−/−), Pdx1-Cre;p62F/F (termed p62Dpan) and Pdx1-Cre; IkkαF/F; Atg7F/F (termed Ikkα;Atg7Dpan). Age- and sex-matched male and female mice of each genotype were generated as littermates for use in experiments in which different genotypes were compared. For all studies that included chemical treatment age- and sex-matched mice of both genders were randomly assigned to different treatment group. For xenograft studies female mice were randomly distributed in different group after cell-injections. All mice were maintained in filter-topped cages on autoclaved food and water, and experiments were performed in accordance to UCSD Institutional Animal Care and Use Committee and NIH guidelines and regulations on age and gender-matched littermates Dr. Karin’s Animal Protocol S00218 was approved by the UCSD Institutional Animal Care and Use Committee. The number of mice per experiment and their age are indicated in the figure legends.
Human Samples and Study Approval
Human tissue sections and arrays were kindly provided by Dr. R. H. Hruban (Johns Hopkins Medicine, Baltimore, MD). PDAC and normal adjacent tissues were obtained from 49 male and 41 female Caucasian (77), African American (7), Hispanic (5) and Asian (1) patients between the ages of 34–90. Informed consent was obtained from each patient before tumor tissue collection. The study was approved by the Johns Hopkins Medicine Institutional Review Board.
METHOD DETAILS
Subcutaneous Xenografts
Tumors were established in hind flanks of 8- to 12-week-old NOD-SCID mice by injecting 2 ×10⁶ MIA PaCa-2 cells stably expressing p62 or IKKα-specific or scrambled shRNA or were transfected with NRF2 CRISPR/Cas9 KO or a control CRISPR/Cas9 plasmid and NRF2 HDR plasmid (Santa Cruz, sc-421869, sc-421869-HDR and sc-418922) in 50 µl growth medium mixed with 50 µm of BD Matrigel. Tumor volumes were measured with digital calipers twice weekly. Tumor volume was calculated as: 0.5236×length×(width)2.
Cerulein-Induced Pancreatitis and PDAC
5-week-old KrasG12D and KrasG12D;p62Dpan mice were given 7 hourly i.p. injections of 50 µg/kg cerulein (Bachem, H-3220). Mice were sacrificed 12 hr after the first injection. Mouse pancreatic tissues and serum were collected for analysis. For PDAC induction, 5-week-old mice were given 2 sets of 6 hourly i.p. 50 µg/kg cerulein injections on days −2 and 0. Mice were sacrificed on days 7, 12, and 21. For survival studies, 2-month-old C57BL/6J mice were treated with cerulein at days 3 and 5 after orthotopic tumor cell implantation.
In Vivo Nutlin-3 Treatment
Racemic Nutlin-3 (Cayman Chemical, 10004372) was injected every second day for 2 (KrasG12D;IkkαDpan) or 3 weeks (KrasG12D) at 50 mg/kg in 10% DMSO (Millipore Sigma, D4540). KrasG12D mice were either subjected to cerulein-induced PDAC prior to Nutlin-3 treatment or treated with Nutlin-3 alone.
Histopathology and Immunohistochemistry
Pancreata were dissected and fixed in 4% paraformaldehyde in PBS and embedded in paraffin. 5 µm sections were prepared and stained with hematoxylin and eosin (H&E), Sirius Red (Abcam, ab150681) or Alcian blue (Abcam, ab150662). IHC was performed as follows: after xylene de-paraffinization and ethanol dehydration, sections were incubated with primary antibodies diluted in PBS with 5% goat serum for 1 hr at room temp, followed by incubation with 1:200 biotinylated secondary antibodies conjugated with HRP for 30 min and 1:500 streptavidin-HRP for 30 min. Bound peroxidase was visualized by 1–10 min incubation in a 3, 3’-diaminobenzidine (DAB) solution (Vector Laboratories, SK-4100). Sections were washed, counterstained with eosin, dehydrated and mounted. The following antibodies were used: α-amylase (Millipore Sigma, A8273), Cytokeratin 19 (Santa Cruz, sc-33111), Ki67 (GeneTex, GTX16667), IKKα (Novus Biologicals, 14A231), p62 (Progen, GP62-C), Nrf2 (Santa Cruz, sc-722), Nqo1 (Cell Signaling, #3187), Nqo1 (Santa Cruz, sc-16464), Sox9 (Santa Cruz, sc-20095), MDM2 (Millipore Sigma OP 115), Hes1 (Santa Cruz, sc-25392), cyclin D1 (Cell Signaling, #2978), αSMA (abcam, ab5694), F4/80 (Caltag Medsystems, PSI-76-052).
Immunofluorescence Staining
After xylene de-paraffinization and ethanol dehydration, paraffin-embedded tissue sections were incubated overnight with primary antibodies at 4°C, followed by incubation with secondary antibodies conjugated to Alexa-594 or Alexa-488. Antibodies for IF staining were CK19 (Santa Cruz, sc-33111) and amylase (Sigma, A8273). Images were captured on an upright light/fluorescent Imager A2 microscope (Zeiss) equipped with an AxioCam camera.
IHC Scoring
By light microscopy, tissue microarrays were scored semiquantitatively for cytoplasmic staining. Labeling scores were determined by multiplying the percentage of positive acinar and/or malignant cells per tissue core (0% to 100%) by the dominant staining intensity (0 = negative, 1 = weak, 2 = intermediate and 3 = strong). Resulting scores ranged from 0 to 300. Cores with overall scores of 5 to 100, 101 to 200, and 201 to 300 were classified as weak, intermediate-level and high-level expression, respectively. Specimens that exhibited complete absence of staining or faint staining in less than 5% of the cells were classified as negative. All patients had undergone a standardized pancreaticoduodenectomy and a total of 360 cores from 90 cases with PDAC were arrayed on slides. Two tissue cores from tumor and 2 from adjacent normal tissues were sampled for each patient. We excluded missing tissue cores or cores that were uninterpretable secondary to artifacts. For cases with tumors with two satisfactory cores, the results were averaged; for cases with tumors with one poor-quality spot, results were based on the interpretable core. The number of evaluated cases for each different staining in PDAC and normal tissues and the scoring summary is indicated (Figure S1a). Spearman correlation analysis was used to estimate the association between p62, NRF2, NQO1 and MDM2 and p62 and IKKα staining intensities.
Characterization of Pancreatic Ductal Lesions
PanIN-1A lesions are characterized by a transition from normal cuboidal morphology to a columnar phenotype with abundant supranuclear, mucin-containing cytoplasm. Cell polarity is still maintained with basally located nuclei, and nuclear atypia, when seen at all, is minimal. Papillary or micropapillary ductal lesions without significant loss of polarity or nuclear atypia were defined as PanIN-1B. As the mice aged, higher-grade PanINs were observed with increasing frequency. Moderate nuclear atypia and a loss of polarity, manifested by movement of nuclei away from a strictly basal location herald the transition to PanIN-2. In PanIN-3 lesions, significant nuclear atypia and complete loss of polarity were observed, such that it was often impossible to discern luminal from basal boundaries within the lesion center. Goblet cells, mucus-producing cells normally restricted to respiratory and intestinal epithelia, were seen in PanINs of various stages. In PanIN-3 lesions, nuclear enlargement and pleomorphism were apparent; clusters of cells which appeared to have “budded off” into the lumen were also seen. These represent cardinal feature of human PanIN-3 lesions, also referred to as carcinoma-insitu. KrasG12D;IkkcΔpan mice also developed a strong stromal response, desmoplasia.
X-Gal Staining
X-Gal staining, or senescence-associated β-galactosidase (SA-β-gal) staining on mouse pancreatic tissue sections was performed as described (DeNicola et al., 2011). Briefly, O.C.T.-embedded frozen pancreatic tissues were cut into 10 µm sections and allowed to adhere to coated slides at 25° C for 1 min before fixation for 15 min in PBS containing 0.5% glutaraldehyde (Millipore Sigma, G5882). Sections were then rinsed with PBS, pH 5.5, containing 1 mM MgCl2 and incubated at 37 °C for 16 h in pre-warmed and filtered oil % 5-bromo-4-chloro-3-indolyl-β-d-galactoside (X-gal) (0.1% X-gal (Millipore Sigma, B4252) dissolved in PBS, pH 5.5, containing 1 mM MgCl2, 5 mM potassium ferrocyanide and 5 mM potassium ferricyanide), rinsed with PBS, post-fixed in 95% ethanol, rehydrated, counterstained with Nuclear Fast Red, dehydrated and mounted. SA-β-gal staining of MIA PaCa-2 and Capan-2 cells was performed using a Senescence Detection Kit (BioVision, K320-250), following manufacturer’s instructions.
Immunoblot Analysis
IB analysis was performed on tissue or cell lysates that were separated by SDS-PAGE and transferred to nitrocellulose membranes. Blots were incubated with 5% (w/v) nonfat dry milk in PBS with 0.05% (w/v) Tween 20 (Millipore Sigma, P9416) (PBST) at room temp for 1 hr to block nonspecific binding, and overnight at 4°C with primary antibodies in 3% BSA (w/v) in PBST and finally with HRP-conjugated secondary antibody in blocking buffer. Blots were developed using enhanced chemiluminescence detection kit (Western Lighting Plus-ECL kit, PerkinElmer, NEL103001EA). The following antibodies were used: PCNA (BD Pharmingen, #555566), cyclin D1 (Santa Cruz, sc-8396), pERK (Cell Signaling, #9101), ERK (Cell Signaling, #9102), p62 (Progen, GP62-C), LC3B (Cell Signaling, #2775), Keap1 (Cell Signaling D6B12), NRF2 (Santa Cruz, sc-722), NQO1 (Santa Cruz, 271116), tubulin (Sigma, T9026), Hes1 (Santa Cruz, sc-25392), CK19 (Santa Cruz, sc-33111), p27 (Santa Cruz, sc-528), p53 (Cell Signaling, 2524), Sox9 (Santa Cruz, sc-20095), Ki67 (GeneTex, GTX 16667), MDM2 (Santa Cruz, sc-965), ALDH (Abcam, ab24343), p-Histone H2A.X (Ser 139) (Santa Cruz, sc-517348).
Lentiviral shRNA Production and Infection
For knockdown experiments we used a pLKO.1-puro lentiviral vector encoding shRNA specific for p62, pLSLPw G418r vector encoding shRNA for IKKα and a control vector with scrambled RNA (Sarbassov et al., 2005). For lentiviral production, the packaging cell line HEK293T was transfected with 10 K 2pLKO vectors together with packaging and envelope plasmids, using Lipofectamine 2000 transfection reagent (Thermo Fisher Scientific, 11668019) according to manufacturer’s instructions. Culture medium containing lentiviral particles was collected 48 and 72 h post-transfection and filtered through 0.45 µm filters. Viral supernatants were pooled and stored at −80°C. MIA PaCa-2 and Capan-2 cells were infected with viruses in medium containing 8 µl polybrene (Santa Cruz, sc-134220). Cells stably expressing p62 shRNA, were selected with 3 µg/ml puromycin (InvivoGen, ant-pr-1) for 5 days. In experiments with MIA PaCa-2 and Capan-2 cells bearing p62 CRISPR/Cas9 knockout and p62 HDR plasmids, the cells stably expressing shRNA for IKKα were selected with 100 µg/ml geneticin (G 418 disulfate salt) (Millipore Sigma, A 1720) for 5 days.
CRISPR/Cas9 Transfections
Transfections of MIA PaCa-2, Capan-2 cells, KC and KPC cell lines with CRISPR/Cas9 KO, HDR or CRISPR activation plasmids listed in the key resources table were performed with UltraCruz® Transfection Reagent (Santa Cruz, sc-395739) according to the manufacturer’s instructions. Loss or overexpression of targeted proteins was confirmed by IB.
Luciferase Assay
MIA PaCa-2 cells seeded in 24-well plates at a 2 × 10⁴ cells/well were transfected with Lipofectamine 3000 reagent (Thermo Fisher Scientific, L3000015) with the following plasmids and sh-RNAs: pGL3Basic-Mdm2-T1 (Addgene, Plasmid# 32365) (Chang et al., 2004) and its corresponding ARE mutant plasmid PGL3Basic-Mdm2-ARE-mut obtained by site-directed mutagenesis, pRL-TK control plasmid (Promega, E2241), WT p62 expression vector (Umemura et al., 2016), pCDNA3-Myc3-Nrf2 (Addgene, Plasmid# 21555) (Furukawa and Xiong, 2005) , Flag-p53/pRK5 (Addgene 39237) (Jiang et al., 2011) , NRF2-shRNA (Santa Cruz, sc-37030-SH), Control-shRNA (Santa Cruz, sc-108060) or treated with 10 µM sulforaphane (Millipore Sigma, S4441) or DMSO as control. All transfections utilized equal total DNA/shRNA quantities maintained by addition of empty vector/control shRNA into the transfection mixture. The cells were incubated for 48 hr after transfection. Renilla and Firefly luciferase activities were measured in cell lysates using the Dual-Glo Luciferase Assay System (Promega, E-2920) with a luminometer FilterMax F5 Multi-Mode Microplate Reader (Molecular Devices). Results are expressed as fold change and represent the average ± SD of at least 3 experiments, each performed in triplicate.
Site-directed Mutagenesis
Mutant promoter construct with mutated ARE (−360 bp ARE; TGACTCAGC) in PGL3Basic-Mdm2-T1 (Addgene, Plasmid# 32365), was generated by PCR amplification using the QuikChange II XL Site-Directed Mutagenesis (Agilent Technologies, #200521) and the primers listed in the Key Resources Table. Sequence was verified by GENEWIZ DNA Sequencing Services, using the oligo: GCTAGCGGCGTTCTCTCCGCGGAC.
Chromatin-immunoprecipitation (ChIP)
Cells were cross-linked for 10 min with 1% formaldehyde, and the reaction was stopped with 0.125 M glycine for 5 min. ChIP was performed as described previously (Coni et al., 2013). Cell lysates were sonicated and incubated with the specific antibodies overnight: NRF2 (Santa Cruz, sc-722), MafF/G/K (H-100) (Santa Cruz, sc-22831). Eluted DNA was analyzed by q-RT-PCR as described (Coni et al., 2013) using the primers listed in the key resources table.
RT-PCR Analysis
Total RNA was extracted from pancreatic tissue or acinar cells using RNAeasy Kit (Qiagen, 74104) following manufacturer’s manual. cDNA was then synthesized using Super Script VILO cDNA Synthesis Kit (Thermo Fisher Scientific, 11754050) and Q-PCR was performed on a CFX-96 Q-PCR machine. Gene expression levels were normalized against 18s rRNA levels. The primers are listed in Table S1.
Preparation of a Single Cell Suspension
Mouse pancreata were washed in cold PBS and cut into 2–4 mm pieces immediately following resection. Dissociation into a single cell suspension was performed using the Mouse Tumor Dissociation Kit (Miltenyi Biotec, 130-096-730). Briefly, tumor pieces were collected into gentleMACS C tubes containing RPMI 1640 with dissociation enzymes, and further homogenized using the gentleMACS Dissociator. Samples were incubated for 40 min at 37°C under continuous rotation, then passed through a 70 µm nylon mesh (Corning, 352350). Red blood cells were lysed using RBC Lysis Buffer (eBioscience, 00–4333-57), and the remaining tumor cells stained using the ALDEFLUOR kit (Stem Cell Technology, 01700). Analysis and cell sorting was carried out on a FACSAria III machine (Becton Dickinson), and data were analyzed with FlowJo software (Tree Star).
Pancreatic Tumorsphere Formation Assays
Pancreata were dissociated and FACS sorted for ALDH+ cells. 500 such cells were suspended in 100 µl DMEM F-12 (Gibco, Life Technologies) containing 1x B-27 supplement (Gibco, Life Technologies, 11320-033), 3% FBS, 100 mM β-mercaptoethanol (Gibco, Life Technologies, 21985), MEM non-essential amino acids (Thermo Fisher Scientific, 11140-050), N2 supplement (100x) (Thermo Fisher Scientific, 17502-048), 20 ng/ml EGF (Gibco, Life Technologies, PMG8041), 20 ng/ml FGF2 (Gibco, Life Technologies, PHG0266), and 10 ng/ml ESGRO mLIF (Sigma Millipore, ESG1106). Cells were plated in 96-well ultra-low adhesion culture plates (Corning, Costar, Sigma-Aldrich, CLS3474-24EA) and incubated at 37°C for 7 days. Sphere images were obtained with a Nikon80i. Sphere size was measured using ImageJ 1.47v software. The standard soft agar colony formation assay was performed on NRF2- or p62- or MDM2-ablated MIA PaCa-2 and Capan-2 cells that were transfected with either Keap1 CRISPR/Cas9 KO, Mdm2 CRISPR activation or control CRISPR/Cas9 plasmid or NICD1 expression or control vector or on cells that were transfected with p62 CRISPR/Cas9 knockout or control CRISPR/Cas9 plasmid while stably expressing shRNA specific for IKKα or control scrambled shRNA. NICD1 was sub-cloned from pENTR-NICD1 (Addgene #46048) (Fan et al., 2012) into pBabe-neo vector (Addgene #1767). IKKα-ablated or control KC and KPC cells, transfected with either NRF2- or p62- or/and control CRISPR/Cas9 KO plasmid, were treated with either 10 µM Nutlin-3 or DMSO. IKKα-ablated or control KC were transfected with p53-activation or control vector and treated with 10 µM DAPT (Notch inhibitor, Sigma #D5942) or DMSO alone. Cells were seeded at a density of 2000 cells/well in 12-well plates in 0.3% agar over a 0.6% bottom agar layer. Colonies were fed with DMEM supplemented with 10% FBS and colony formation was monitored for 14 days. Media were replaced with fresh media with supplements indicated above every 48 hr. The number of colonies/well was determined at 10 × magnification in sixplicates.
Mouse Acinar Cell Explant 3D Culture
Pancreatic acinar cells from 6- to 8-week-old male mice of indicated strains were isolated by collagenase digestion (Li et al., 2013). The cells were re-suspended in RPMI1640 media (Gibco, Life Technologies, 61870-036) supplemented with penicillin G (1000 U/ml), streptomycin (100 µg/ml) and 10% FBS. An equal volume of BD Matrigel Matrix (BD Biosciences, 356235) was added to the cell suspension. The cell/Matrigel suspension was pipetted into 6- or 12-well plates (Corning, Costar, Sigma-Aldrich, 3516 and 3513) and left at 37°C to solidify and growth medium was added. Cultures were maintained at 37°C in 5% CO2: 95% air for 3, 4 or 6 days with the medium replaced on days 1, 3 and 5. Cells were isolated by Dispase (Stemcell Technologies, 07923) from the Matrigel and processed for IB or RT-PCR analysis. In transfection experiments isolated mouse pancreatic acinar cells were transfected with empty, wild type p62 (wt-p62), p62ΔKIR or p53 expression plasmids using the Amaxa basic Nucleofactor kit for primary mammalian epithelial cells (Lonza, VPI-1005) before 3D culture.
Isolation of Acinar and Ductal Cells
A single-cell suspension from pancreata of indicated 6- to 8-week-old male mice and acinar and ductal cell labeling were performed as described previously (Reichert et al., 2013; Xiao et al., 2016). In short, isolated cells were stained with fluorescein labeled Dolichos Biflorus Agglutinin (DBA) (Vector Labs, FL-1031) and DyLight 594 labeled Ulex Europaeus Agglutinin I (UEA I) (Vector Laboratories, DL-1067) in PBS with 2% FCS for 30 min incubation at 4 °C in the dark. Cells were washed 3 times by centrifugation at 1200rpm for 5 min suspended in ice cold PBS, 2% FCS and cell sorted with a FACSJazz cell sorter.
Orthotopic PDAC Cell Implantation
Control and p62-ablated UN-KC-6141 (KC) cells (1×10⁶) were orthotopically injected in 2-month-old C57BL/6 mice as described before (Qiu and Su, 2013). In short, mice were anesthetized with Ketamine/Xylazine (100 mg/kg and 10 mg/kg body weight, respectively). After local shaving and disinfection, a 1.5 cm long longitudinal incision was made into the left upper quadrant of abdomen. The spleen was lifted and 50 µl of cell suspension in ice-cold PBS-Matrigel mixture (equal amounts) was slowly injected into the tail of the pancreas. On days 3 and 5 post-surgery mice were injected with cerulein as described above. Throughout the experiment, animals were provided with food and water ad libitum and subjected to a 12-hr dark/light cycle.
QUANTIFICATION AND STATISTICAL ANALYSIS
A 2-tailed Student’s t test was used for comparing two groups. Data are expressed as mean ± SEM. Kaplan-Meier survival curves were analyzed by log rank test. Statistical correlation between IKKα, p62, NRF2 and MDM2 expression in human PDAC and adjacent normal tissue was determined by Spearman Correlation analysis using SPSS Software Version 21 (IBM). p < 0.05 was considered significant. For all experiments * p < 0.05, ** p < 0.01, and *** p < 0.001.
Supplementary Material
SIGNIFICANCE.
PDAC is a highly aggressive malignancy that is refractory to most therapeutic interventions. Prevention and early treatment are likely to be more successful than treatment of established, metastatic tumors. Therefore, we studied how precursor PanIN lesions become fully malignant PDAC. We describe a p62-NRF2-MDM2 signaling pathway that controls malignancy in human and mouse PDAC. Inhibition of this pathway with MDM2 targeting drugs attenuates neoplastic progression and maintains acinar cellularity in stressed pancreata.
Highlights.
IKKα-deficiency-induced p62 accumulation drives PDAC progression.
MDM2 links the autophagy substrate p62 to neoplastic progression in the pancreas.
A p62-NRF2-MDM2 module acts via p53-dependent and -independent mechanisms.
A p62-NRF2-MDM2 module converts acinar cells into progenitor-like cells.
Acknowledgments
We thank R. Hruban for human PDAC samples and comments, D. Bar Sagi and D. Tuveson for advice and suggestions, V. Sheen for assistance with mouse work. The authors were supported by the Austrian Science Fund Erwin Schroedinger Fellowship (J3233), Univ. Prof. Dr. Matthias M. Müller Fellowship, ÖGLMKC, Austrian Program for Advanced Research and Technology of the Austrian Academy of Sciences (J.T); Associazione Italiana per la Ricerca sul Cancro (AIRC) Fellowship co-funded by the European Union (L.A); AIRC Fellowship (16230), Marie Curie Actions European Union (G.D.C); Susan G. Komen for the Cure (KG111506) (X.W.); Swedish Research Council (524-2011-6817), Swedish Society for Medical Research (J.B.F.); CureSearch Young Investigator Award (D.D.); NIH Minority Supplement to R01AI043477 (C.B.); The Rotary Foundation Global Grant Scholarship (25480) (A.U.). Research was supported by NIH grants to N.L. (CA167120), N.K.L. (GM007752, CA206416), M.G. (CA62924), T.R. (CA186043, CA197699), M.K. (CA163798, CA211794), J.M. (CA132847, CA172025), M.T.D.-M. (CA134530, CA030199, CA192642); D.o.D. grants to J.M. (W81XWH-13-1-0354), M.T.D-.M. (W81XWH-13-1-0353); and Lustgarten Foundation to M.K. (RFP-B-007) who holds the Ben and Wanda Hildyard Chair for Mitochondrial and Metabolic Diseases and is an American Cancer Society Research Professor.
Footnotes
Publisher's Disclaimer: This is a PDF file of an unedited manuscript that has been accepted for publication. As a service to our customers we are providing this early version of the manuscript. The manuscript will undergo copyediting, typesetting, and review of the resulting proof before it is published in its final citable form. Please note that during the production process errors may be discovered which could affect the content, and all legal disclaimers that apply to the journal pertain.
AUTHOR CONTRIBUTIONS
J.T. designed and performed most experiments. L.A., G.D.C., N.L., X.W., J.B.F., N.K.L., D.D., C.B., A.U. and H.K. performed additional experiments. D.T., M.G., R.H.H., T.R., M.D-M. and J.M. contributed essential analytic tools and edited the manuscript. M.A.V. made pathological diagnosis. M.K. conceived and supervised the study, and assisted in data interpretation. J.T., N.L. and M.K. wrote the manuscript.
References
- Antonucci L, Fagman JB, Kim JY, Todoric J, Gukovsky I, Mackey M, Ellisman MH, Karin M. Basal autophagy maintains pancreatic acinar cell homeostasis and protein synthesis and prevents ER stress. Proc Natl Acad Sci U S A. 2015;112:E6166–6174. doi: 10.1073/pnas.1519384112. [DOI] [PMC free article] [PubMed] [Google Scholar]
- Becker AE, Hernandez YG, Frucht H, Lucas AL. Pancreatic ductal adenocarcinoma: risk factors, screening, and early detection. World J Gastroenterol. 2014;20:11182–11198. doi: 10.3748/wjg.v20.i32.11182. [DOI] [PMC free article] [PubMed] [Google Scholar]
- Bray F, Ren JS, Masuyer E, Ferlay J. Global estimates of cancer prevalence for 27 sites in the adult population in 2008. Int J Cancer. 2013;132:1133–1145. doi: 10.1002/ijc.27711. [DOI] [PubMed] [Google Scholar]
- Carriere C, Young AL, Gunn JR, Longnecker DS, Korc M. Acute pancreatitis markedly accelerates pancreatic cancer progression in mice expressing oncogenic Kras. Biochem Biophys Res Commun. 2009;382:561–565. doi: 10.1016/j.bbrc.2009.03.068. [DOI] [PMC free article] [PubMed] [Google Scholar]
- Chan K, Lu R, Chang JC, Kan YW. NRF2, a member of the NFE2 family of transcription factors, is not essential for murine erythropoiesis, growth, and development. Proc Natl Acad Sci U S A. 1996;93:13943–13948. doi: 10.1073/pnas.93.24.13943. [DOI] [PMC free article] [PubMed] [Google Scholar]
- Chang CJ, Freeman DJ, Wu H. PTEN regulates Mdm2 expression through the P1 promoter. J Biol Chem. 2004;279:29841–29848. doi: 10.1074/jbc.M401488200. [DOI] [PubMed] [Google Scholar]
- Collins MA, Pasca di Magliano M. Kras as a key oncogene and therapeutic target in pancreatic cancer. Front Physiol. 2013;4:407. doi: 10.3389/fphys.2013.00407. [DOI] [PMC free article] [PubMed] [Google Scholar]
- Coni S, Antonucci L, D’Amico D, Di Magno L, Infante P, De Smaele E, Giannini G, Di Marcotullio L, Screpanti I, Gulino A, et al. Gli2 acetylation at lysine 757 regulates hedgehog-dependent transcriptional output by preventing its promoter occupancy. PLoS One. 2013;8:e65718. doi: 10.1371/journal.pone.0065718. [DOI] [PMC free article] [PubMed] [Google Scholar]
- Corcoran RB, Contino G, Deshpande V, Tzatsos A, Conrad C, Benes CH, Levy DE, Settleman J, Engelman JA, Bardeesy N. STAT3 plays a critical role in KRAS-induced pancreatic tumorigenesis. Cancer Res. 2011;71:5020–5029. doi: 10.1158/0008-5472.CAN-11-0908. [DOI] [PMC free article] [PubMed] [Google Scholar]
- Courtois-Cox S, Jones SL, Cichowski K. Many roads lead to oncogene-induced senescence. Oncogene. 2008;27:2801–2809. doi: 10.1038/sj.onc.1210950. [DOI] [PubMed] [Google Scholar]
- De La OJ, Emerson LL, Goodman JL, Froebe SC, Illum BE, Curtis AB, Murtaugh LC. Notch and Kras reprogram pancreatic acinar cells to ductal intraepithelial neoplasia. Proc Natl Acad Sci U S A. 2008;105:18907–18912. doi: 10.1073/pnas.0810111105. [DOI] [PMC free article] [PubMed] [Google Scholar]
- De La OJ, Murtaugh LC. Notch signaling: where pancreatic cancer and differentiation meet? Gastroenterology. 2009;136:1499–1502. doi: 10.1053/j.gastro.2009.03.022. [DOI] [PubMed] [Google Scholar]
- Deer EL, Gonzalez-Hernandez J, Coursen JD, Shea JE, Ngatia J, Scaife CL, Firpo MA, Mulvihill SJ. Phenotype and genotype of pancreatic cancer cell lines. Pancreas. 2010;39:425–435. doi: 10.1097/MPA.0b013e3181c15963. [DOI] [PMC free article] [PubMed] [Google Scholar]
- DeNicola GM, Karreth FA, Humpton TJ, Gopinathan A, Wei C, Frese K, Mangal D, Yu KH, Yeo CJ, Calhoun ES, et al. Oncogene-induced Nrf2 transcription promotes ROS detoxification and tumorigenesis. Nature. 2011;475:106–109. doi: 10.1038/nature10189. [DOI] [PMC free article] [PubMed] [Google Scholar]
- Denk H, Stumptner C, Fuchsbichler A, Muller T, Farr G, Muller W, Terracciano L, Zatloukal K. Are the Mallory bodies and intracellular hyaline bodies in neoplastic and non-neoplastic hepatocytes related? J Pathol. 2006;208:653–661. doi: 10.1002/path.1946. [DOI] [PubMed] [Google Scholar]
- Fahraeus R, Olivares-Illana V. MDM2’s social network. Oncogene. 2014;33:4365–4376. doi: 10.1038/onc.2013.410. [DOI] [PubMed] [Google Scholar]
- Fan B, Malato Y, Calvisi DF, Naqvi S, Razumilava N, Ribback S, Gores GJ, Dombrowski F, Evert M, Chen X, et al. Cholangiocarcinomas can originate from hepatocytes in mice. J Clin Invest. 2012;122:2911–2915. doi: 10.1172/JCI63212. [DOI] [PMC free article] [PubMed] [Google Scholar]
- Furukawa M, Xiong Y. BTB protein Keap1 targets antioxidant transcription factor Nrf2 for ubiquitination by the Cullin 3-Roc1 ligase. Mol Cell Biol. 2005;25:162–171. doi: 10.1128/MCB.25.1.162-171.2005. [DOI] [PMC free article] [PubMed] [Google Scholar]
- Guerra C, Collado M, Navas C, Schuhmacher AJ, Hernandez-Porras I, Canamero M, Rodriguez-Justo M, Serrano M, Barbacid M. Pancreatitis-induced inflammation contributes to pancreatic cancer by inhibiting oncogene-induced senescence. Cancer Cell. 2011;19:728–739. doi: 10.1016/j.ccr.2011.05.011. [DOI] [PMC free article] [PubMed] [Google Scholar]
- Guerra C, Schuhmacher AJ, Canamero M, Grippo PJ, Verdaguer L, Perez-Gallego L, Dubus P, Sandgren EP, Barbacid M. Chronic pancreatitis is essential for induction of pancreatic ductal adenocarcinoma by K-Ras oncogenes in adult mice. Cancer Cell. 2007;11:291–302. doi: 10.1016/j.ccr.2007.01.012. [DOI] [PubMed] [Google Scholar]
- Gukovsky I, Li N, Todoric J, Gukovskaya A, Karin M. Inflammation, autophagy, and obesity: common features in the pathogenesis of pancreatitis and pancreatic cancer. Gastroenterology. 2013;144:1199–1209. doi: 10.1053/j.gastro.2013.02.007. e1194. [DOI] [PMC free article] [PubMed] [Google Scholar]
- Hall PA, Lemoine NR. Rapid acinar to ductal transdifferentiation in cultured human exocrine pancreas. J Pathol. 1992;166:97–103. doi: 10.1002/path.1711660203. [DOI] [PubMed] [Google Scholar]
- Hingorani SR, Petricoin EF, Maitra A, Rajapakse V, King C, Jacobetz MA, Ross S, Conrads TP, Veenstra TD, Hitt BA, et al. Preinvasive and invasive ductal pancreatic cancer and its early detection in the mouse. Cancer Cell. 2003;4:437–450. doi: 10.1016/s1535-6108(03)00309-x. [DOI] [PubMed] [Google Scholar]
- Holzer P, Masuya K, Furet P, Kallen J, Valat-Stachyra T, Ferretti S, Berghausen J, Bouisset-Leonard M, Buschmann N, Pissot-Soldermann C, et al. Discovery of a Dihydroisoquinolinone Derivative (NVP-CGM097): A Highly Potent and Selective MDM2 Inhibitor Undergoing Phase 1 Clinical Trials in p53wt Tumors. J Med Chem. 2015;58:6348–6358. doi: 10.1021/acs.jmedchem.5b00810. [DOI] [PubMed] [Google Scholar]
- Hruban RH, Maitra A, Goggins M. Update on pancreatic intraepithelial neoplasia. Int J Clin Exp Pathol. 2008;1:306–316. [PMC free article] [PubMed] [Google Scholar]
- Jensen JN, Cameron E, Garay MV, Starkey TW, Gianani R, Jensen J. Recapitulation of elements of embryonic development in adult mouse pancreatic regeneration. Gastroenterology. 2005;128:728–741. doi: 10.1053/j.gastro.2004.12.008. [DOI] [PubMed] [Google Scholar]
- Jiang P, Du W, Wang X, Mancuso A, Gao X, Wu M, Yang X. p53 regulates biosynthesis through direct inactivation of glucose-6-phosphate dehydrogenase. Nat Cell Biol. 2011;13:310–316. doi: 10.1038/ncb2172. [DOI] [PMC free article] [PubMed] [Google Scholar]
- Jones S, Zhang X, Parsons DW, Lin JC, Leary RJ, Angenendt P, Mankoo P, Carter H, Kamiyama H, Jimeno A, et al. Core signaling pathways in human pancreatic cancers revealed by global genomic analyses. Science. 2008;321:1801–1806. doi: 10.1126/science.1164368. [DOI] [PMC free article] [PubMed] [Google Scholar]
- Kawamura T, Suzuki J, Wang YV, Menendez S, Morera LB, Raya A, Wahl GM, Izpisua Belmonte JC. Linking the p53 tumour suppressor pathway to somatic cell reprogramming. Nature. 2009;460:1140–1144. doi: 10.1038/nature08311. [DOI] [PMC free article] [PubMed] [Google Scholar]
- Kobayashi A, Kang MI, Watai Y, Tong KI, Shibata T, Uchida K, Yamamoto M. Oxidative and electrophilic stresses activate Nrf2 through inhibition of ubiquitination activity of Keap1. Mol Cell Biol. 2006;26:221–229. doi: 10.1128/MCB.26.1.221-229.2006. [DOI] [PMC free article] [PubMed] [Google Scholar]
- Komatsu M, Ichimura Y. Physiological significance of selective degradation of p62 by autophagy. FEBS Lett. 2010;584:1374–1378. doi: 10.1016/j.febslet.2010.02.017. [DOI] [PubMed] [Google Scholar]
- Komatsu M, Kurokawa H, Waguri S, Taguchi K, Kobayashi A, Ichimura Y, Sou YS, Ueno I, Sakamoto A, Tong KI, et al. The selective autophagy substrate p62 activates the stress responsive transcription factor Nrf2 through inactivation of Keap1. Nat Cell Biol. 2010;12:213–223. doi: 10.1038/ncb2021. [DOI] [PubMed] [Google Scholar]
- Komatsu M, Waguri S, Ueno T, Iwata J, Murata S, Tanida I, Ezaki J, Mizushima N, Ohsumi Y, Uchiyama Y, et al. Impairment of starvation-induced and constitutive autophagy in Atg7-deficient mice. J Cell Biol. 2005;169:425–434. doi: 10.1083/jcb.200412022. [DOI] [PMC free article] [PubMed] [Google Scholar]
- Kopp JL, von Figura G, Mayes E, Liu FF, Dubois CL, Morris JPt, Pan FC, Akiyama H, Wright CV, Jensen K, et al. Identification of Sox9-dependent acinar-to-ductal reprogramming as the principal mechanism for initiation of pancreatic ductal adenocarcinoma. Cancer Cell. 2012;22:737–750. doi: 10.1016/j.ccr.2012.10.025. [DOI] [PMC free article] [PubMed] [Google Scholar]
- Lesina M, Wormann SM, Neuhofer P, Song L, Algul H. Interleukin-6 in inflammatory and malignant diseases of the pancreas. Semin Immunol. 2014;26:80–87. [Google Scholar]
- Levy P, Dominguez-Munoz E, Imrie C, Lohr M, Maisonneuve P. Epidemiology of chronic pancreatitis: burden of the disease and consequences. United European Gastroenterol J. 2014;2:345–354. doi: 10.1177/2050640614548208. [DOI] [PMC free article] [PubMed] [Google Scholar]
- Li N, Wu X, Holzer RG, Lee JH, Todoric J, Park EJ, Ogata H, Gukovskaya AS, Gukovsky I, Pizzo DP, et al. Loss of acinar cell IKKalpha triggers spontaneous pancreatitis in mice. J Clin Invest. 2013;123:2231–2243. doi: 10.1172/JCI64498. [DOI] [PMC free article] [PubMed] [Google Scholar]
- Lister A, Nedjadi T, Kitteringham NR, Campbell F, Costello E, Lloyd B, Copple IM, Williams S, Owen A, Neoptolemos JP, et al. Nrf2 is overexpressed in pancreatic cancer: implications for cell proliferation and therapy. Mol Cancer. 2011;10:37. doi: 10.1186/1476-4598-10-37. [DOI] [PMC free article] [PubMed] [Google Scholar]
- Liu B, Xia X, Zhu F, Park E, Carbajal S, Kiguchi K, DiGiovanni J, Fischer SM, Hu Y. IKKalpha is required to maintain skin homeostasis and prevent skin cancer. Cancer Cell. 2008;14:212–225. doi: 10.1016/j.ccr.2008.07.017. [DOI] [PMC free article] [PubMed] [Google Scholar]
- Mareninova OA, Hermann K, French SW, O’Konski MS, Pandol SJ, Webster P, Erickson AH, Katunuma N, Gorelick FS, Gukovsky I, et al. Impaired autophagic flux mediates acinar cell vacuole formation and trypsinogen activation in rodent models of acute pancreatitis. J Clin Invest. 2009;119:3340–3355. doi: 10.1172/JCI38674. [DOI] [PMC free article] [PubMed] [Google Scholar]
- Marion RM, Strati K, Li H, Murga M, Blanco R, Ortega S, Fernandez-Capetillo O, Serrano M, Blasco MA. A p53-mediated DNA damage response limits reprogramming to ensure iPS cell genomic integrity. Nature. 2009;460:1149–1153. doi: 10.1038/nature08287. [DOI] [PMC free article] [PubMed] [Google Scholar]
- Matsuda Y, Kure S, Ishiwata T. Nestin and other putative cancer stem cell markers in pancreatic cancer. Med Mol Morphol. 2012;45:59–65. doi: 10.1007/s00795-012-0571-x. [DOI] [PubMed] [Google Scholar]
- Moscat J, Diaz-Meco MT. p62 at the crossroads of autophagy, apoptosis, and cancer. Cell. 2009;137:1001–1004. doi: 10.1016/j.cell.2009.05.023. [DOI] [PMC free article] [PubMed] [Google Scholar]
- Moscat J, Karin M, Diaz-Meco MT. p62 in Cancer: Signaling Adaptor Beyond Autophagy. Cell. 2016;167:606–609. doi: 10.1016/j.cell.2016.09.030. [DOI] [PMC free article] [PubMed] [Google Scholar]
- Motohashi H, Katsuoka F, Engel JD, Yamamoto M. Small Maf proteins serve as transcriptional cofactors for keratinocyte differentiation in the Keap1-Nrf2 regulatory pathway. Proc Natl Acad Sci U S A. 2004;101:6379–6384. doi: 10.1073/pnas.0305902101. [DOI] [PMC free article] [PubMed] [Google Scholar]
- Muller-Decker K, Furstenberger G, Annan N, Kucher D, Pohl-Arnold A, Steinbauer B, Esposito I, Chiblak S, Friess H, Schirmacher P, et al. Preinvasive duct-derived neoplasms in pancreas of keratin 5-promoter cyclooxygenase-2 transgenic mice. Gastroenterology. 2006;130:2165–2178. doi: 10.1053/j.gastro.2006.03.053. [DOI] [PubMed] [Google Scholar]
- Muller TD, Lee SJ, Jastroch M, Kabra D, Stemmer K, Aichler M, Abplanalp B, Ananthakrishnan G, Bhardwaj N, Collins S, et al. p62 links beta-adrenergic input to mitochondrial function and thermogenesis. J Clin Invest. 2013;123:469–478. doi: 10.1172/JCI64209. [DOI] [PMC free article] [PubMed] [Google Scholar]
- Murata K, Hattori M, Hirai N, Shinozuka Y, Hirata H, Kageyama R, Sakai T, Minato N. Hes1 directly controls cell proliferation through the transcriptional repression of p27Kip1. Mol Cell Biol. 2005;25:4262–4271. doi: 10.1128/MCB.25.10.4262-4271.2005. [DOI] [PMC free article] [PubMed] [Google Scholar]
- Murtaugh LC, Keefe MD. Regeneration and repair of the exocrine pancreas. Annu Rev Physiol. 2015;77:229–249. doi: 10.1146/annurev-physiol-021014-071727. [DOI] [PMC free article] [PubMed] [Google Scholar]
- Murtaugh LC, Stanger BZ, Kwan KM, Melton DA. Notch signaling controls multiple steps of pancreatic differentiation. Proc Natl Acad Sci U S A. 2003;100:14920–14925. doi: 10.1073/pnas.2436557100. [DOI] [PMC free article] [PubMed] [Google Scholar]
- Negrette-Guzman M, Huerta-Yepez S, Tapia E, Pedraza-Chaverri J. Modulation of mitochondrial functions by the indirect antioxidant sulforaphane: a seemingly contradictory dual role and an integrative hypothesis. Free Radic Biol Med. 2013;65:1078–1089. doi: 10.1016/j.freeradbiomed.2013.08.182. [DOI] [PubMed] [Google Scholar]
- Pettersson S, Sczaniecka M, McLaren L, Russell F, Gladstone K, Hupp T, Wallace M. Non-degradative ubiquitination of the Notch1 receptor by the E3 ligase MDM2 activates the Notch signalling pathway. Biochem J. 2013;450:523–536. doi: 10.1042/BJ20121249. [DOI] [PubMed] [Google Scholar]
- Qiu W, Su GH. Development of orthotopic pancreatic tumor mouse models. Methods Mol Biol. 2013;980:215–223. doi: 10.1007/978-1-62703-287-2_11. [DOI] [PMC free article] [PubMed] [Google Scholar]
- Reichert M, Takano S, Heeg S, Bakir B, Botta GP, Rustgi AK. Isolation, culture and genetic manipulation of mouse pancreatic ductal cells. Nat Protoc. 2013;8:1354–1365. doi: 10.1038/nprot.2013.079. [DOI] [PMC free article] [PubMed] [Google Scholar]
- Rosenfeldt MT, O’Prey J, Morton JP, Nixon C, MacKay G, Mrowinska A, Au A, Rai TS, Zheng L, Ridgway R, et al. p53 status determines the role of autophagy in pancreatic tumour development. Nature. 2013;504:296–300. doi: 10.1038/nature12865. [DOI] [PubMed] [Google Scholar]
- Sarbassov DD, Guertin DA, Ali SM, Sabatini DM. Phosphorylation and regulation of Akt/PKB by the rictor-mTOR complex. Science. 2005;307:1098–1101. doi: 10.1126/science.1106148. [DOI] [PubMed] [Google Scholar]
- Schulze K, Imbeaud S, Letouze E, Alexandrov LB, Calderaro J, Rebouissou S, Couchy G, Meiller C, Shinde J, Soysouvanh F, et al. Exome sequencing of hepatocellular carcinomas identifies new mutational signatures and potential therapeutic targets. Nat Genet. 2015;47:505–511. doi: 10.1038/ng.3252. [DOI] [PMC free article] [PubMed] [Google Scholar]
- Sczaniecka M, Gladstone K, Pettersson S, McLaren L, Huart AS, Wallace M. MDM2 protein-mediated ubiquitination of numb protein: identification of a second physiological substrate of MDM2 that employs a dual-site docking mechanism. J Biol Chem. 2012;287:14052–14068. doi: 10.1074/jbc.M111.303875. [DOI] [PMC free article] [PubMed] [Google Scholar]
- Serrano M, Lin AW, McCurrach ME, Beach D, Lowe SW. Oncogenic ras provokes premature cell senescence associated with accumulation of p53 and p16INK4a. Cell. 1997;88:593–602. doi: 10.1016/s0092-8674(00)81902-9. [DOI] [PubMed] [Google Scholar]
- Shi G, DiRenzo D, Qu C, Barney D, Miley D, Konieczny SF. Maintenance of acinar cell organization is critical to preventing Kras-induced acinar-ductal metaplasia. Oncogene. 2013;32:1950–1958. doi: 10.1038/onc.2012.210. [DOI] [PMC free article] [PubMed] [Google Scholar]
- Shibata T, Aburatani H. Exploration of liver cancer genomes. Nat Rev Gastroenterol Hepatol. 2014;11:340–349. doi: 10.1038/nrgastro.2014.6. [DOI] [PubMed] [Google Scholar]
- Soini Y, Eskelinen M, Juvonen P, Karja V, Haapasaari KM, Saarela A, Karihtala P. Nuclear Nrf2 expression is related to a poor survival in pancreatic adenocarcinoma. Pathol Res Pract. 2014;210:35–39. doi: 10.1016/j.prp.2013.10.001. [DOI] [PubMed] [Google Scholar]
- Spike BT, Wahl GM. p53, Stem Cells, and Reprogramming: Tumor Suppression beyond Guarding the Genome. Genes Cancer. 2011;2:404–419. doi: 10.1177/1947601911410224. [DOI] [PMC free article] [PubMed] [Google Scholar]
- Thomas MM, Zhang Y, Mathew E, Kane KT, Maillard I, Pasca di Magliano M. Epithelial Notch signaling is a limiting step for pancreatic carcinogenesis. BMC Cancer. 2014;14:862. doi: 10.1186/1471-2407-14-862. [DOI] [PMC free article] [PubMed] [Google Scholar]
- Umemura A, He F, Taniguchi K, Nakagawa H, Yamachika S, Font-Burgada J, Zhong Z, Subramaniam S, Raghunandan S, Duran A, et al. p62, upregulated during preneoplasia, induces hepatocellular carcinogenesis by maintaining survival of stressed HCC-initiating cells. Cancer Cell. 2016 doi: 10.1016/j.ccell.2016.04.006. In Press. [DOI] [PMC free article] [PubMed] [Google Scholar]
- Vassilev LT, Vu BT, Graves B, Carvajal D, Podlaski F, Filipovic Z, Kong N, Kammlott U, Lukacs C, Klein C, et al. In vivo activation of the p53 pathway by small-molecule antagonists of MDM2. Science. 2004;303:844–848. doi: 10.1126/science.1092472. [DOI] [PubMed] [Google Scholar]
- Waddell N, Pajic M, Patch AM, Chang DK, Kassahn KS, Bailey P, Johns AL, Miller D, Nones K, Quek K, et al. Whole genomes redefine the mutational landscape of pancreatic cancer. Nature. 2015;518:495–501. doi: 10.1038/nature14169. [DOI] [PMC free article] [PubMed] [Google Scholar]
- Wang W, Qin JJ, Voruganti S, Wang MH, Sharma H, Patil S, Zhou J, Wang H, Mukhopadhyay D, Buolamwini JK, et al. Identification of a new class of MDM2 inhibitor that inhibits growth of orthotopic pancreatic tumors in mice. Gastroenterology. 2014;147:893–902. doi: 10.1053/j.gastro.2014.07.001. e892. [DOI] [PMC free article] [PubMed] [Google Scholar]
- Wang Z, Zhang Y, Li Y, Banerjee S, Liao J, Sarkar FH. Down-regulation of Notch-1 contributes to cell growth inhibition and apoptosis in pancreatic cancer cells. Mol Cancer Ther. 2006;5:483–493. doi: 10.1158/1535-7163.MCT-05-0299. [DOI] [PubMed] [Google Scholar]
- Wienken M, Dickmanns A, Nemajerova A, Kramer D, Najafova Z, Weiss M, Karpiuk O, Kassem M, Zhang Y, Lozano G, et al. MDM2 Associates with Polycomb Repressor Complex 2 and Enhances Stemness-Promoting Chromatin Modifications Independent of p53. Mol Cell. 2016;61:68–83. doi: 10.1016/j.molcel.2015.12.008. [DOI] [PMC free article] [PubMed] [Google Scholar]
- Xiao X, Fischbach S, Fusco J, Zimmerman R, Song Z, Nebres P, Ricks DM, Prasadan K, Shiota C, Husain SZ, et al. PNA lectin for purifying mouse acinar cells from the inflamed pancreas. Sci Rep. 2016;6:21127. doi: 10.1038/srep21127. [DOI] [PMC free article] [PubMed] [Google Scholar]
- Yabuuchi S, Pai SG, Campbell NR, de Wilde RF, De Oliveira E, Korangath P, Streppel MM, Rasheed ZA, Hidalgo M, Maitra A, et al. Notch signaling pathway targeted therapy suppresses tumor progression and metastatic spread in pancreatic cancer. Cancer Lett. 2013;335:41–51. doi: 10.1016/j.canlet.2013.01.054. [DOI] [PMC free article] [PubMed] [Google Scholar]
- Yogosawa S, Miyauchi Y, Honda R, Tanaka H, Yasuda H. Mammalian Numb is a target protein of Mdm2, ubiquitin ligase. Biochem Biophys Res Commun. 2003;302:869–872. doi: 10.1016/s0006-291x(03)00282-1. [DOI] [PubMed] [Google Scholar]
- Zhang Y, Yan W, Collins MA, Bednar F, Rakshit S, Zetter BR, Stanger BZ, Chung I, Rhim AD, di Magliano MP. Interleukin-6 is required for pancreatic cancer progression by promoting MAPK signaling activation and oxidative stress resistance. Cancer Res. 2013;73:6359–6374. doi: 10.1158/0008-5472.CAN-13-1558-T. [DOI] [PMC free article] [PubMed] [Google Scholar]
Associated Data
This section collects any data citations, data availability statements, or supplementary materials included in this article.