Abstract
The internal mechanics of proteins—the coordinated motions of amino acids and the pattern of forces constraining these motions—connects protein structure to function. Here we describe a new method combining the application of strong electric field pulses to protein crystals with time-resolved X-ray crystallography to observe conformational changes in spatial and temporal detail. Using a human PDZ domain (LNX2PDZ2) as a model system, we show that protein crystals tolerate electric field pulses strong enough to drive concerted motions on the sub-microsecond timescale. The induced motions are subtle, involve diverse physical mechanisms, and occur throughout the protein structure. The global pattern of electric-field-induced motions is consistent with both local and allosteric conformational changes naturally induced by ligand binding, including at conserved functional sites in the PDZ domain family. This work lays the foundation for comprehensive experimental study of the mechanical basis of protein function.
The fundamental biological properties of proteins—binding, catalysis and allosteric communication—emerge from a global pattern of interactions between all constituent atoms. Often, this pattern is organized in the tertiary structure so as to produce the concerted motions of amino acid residues, defining transitions between a small number of functional states. This conformational cycling within proteins and protein complexes draws analogies to macroscopic machines1 and lies at the heart of many biological processes: DNA replication2, metabolism3,4, transport5, cellular motility6 and signal transduction7. Even without conformational changes, functional states of proteins can have a different pattern and extent of rigidity8,9—entropic variations that also influence state transitions10. Thus, the biology of proteins is deeply connected to their mechanics: the motions a protein can perform and the forces constraining these motions. As in macroscopic machines1, a comprehensive description of internal mechanics is the key to explaining how structure leads to function11. Unlike conventional machines, however, proteins are marginally stable evolved materials whose mechanics are governed by weak, heterogeneously cooperative interactions for which we as yet have no good physical models.
Current biophysical methods provide an incomplete basis for making mechanical models of proteins. NMR spectroscopy12 and room-temperature crystallography13 provide information on the structure and dynamics of local environments of atoms, and have been used to characterize weakly populated excited states of proteins3,13,14. However, the complexity of disentangling conformational transitions occurring on multiple timescales, the difficulty of directly seeing collective motions, and the inability to generally relate the measured parameters to physical forces limit our understanding. Single molecule force spectroscopy can relate global conformational transitions to applied forces, but is limited in providing the atomic detail required to define the underlying intramolecular mechanics15. Time-resolved crystallography (TRX) offers, in principle, a direct route to observing concerted motions with high temporal and spatial resolution16. However, TRX traditionally relies on photoexcitation of bound chromophores to induce motions in proteins17. Such excitation is not generally applicable, acts at a fixed location, is not tunable, and deposits an amount of energy that far exceeds the typical energetic changes involved in protein conformational transitions.
Here, we describe a new method for studying protein mechanics and its application to a model system—a PDZ domain—which shows both local and allosteric functional properties18. The method, electric field–stimulated X-ray crystallography (EF-X), combines the use of strong electric field pulses to drive motions within protein crystals with simultaneous readout by fast X-ray pulses. EF-X satisfies the key characteristics required for a general mechanical analysis of proteins: (1) the application of forces of controlled magnitude, direction and duration; (2) the existence of defined, well-distributed actuators (the charges) on which the forces act; and (3) readout of conformational changes with high spatial and temporal resolution. We show that EF-X can reveal protein motions associated with biological function and permits direct refinement of the atomic structures of low-lying excited states. This work initiates a path towards a full description of protein mechanics.
Theoretical and practical considerations
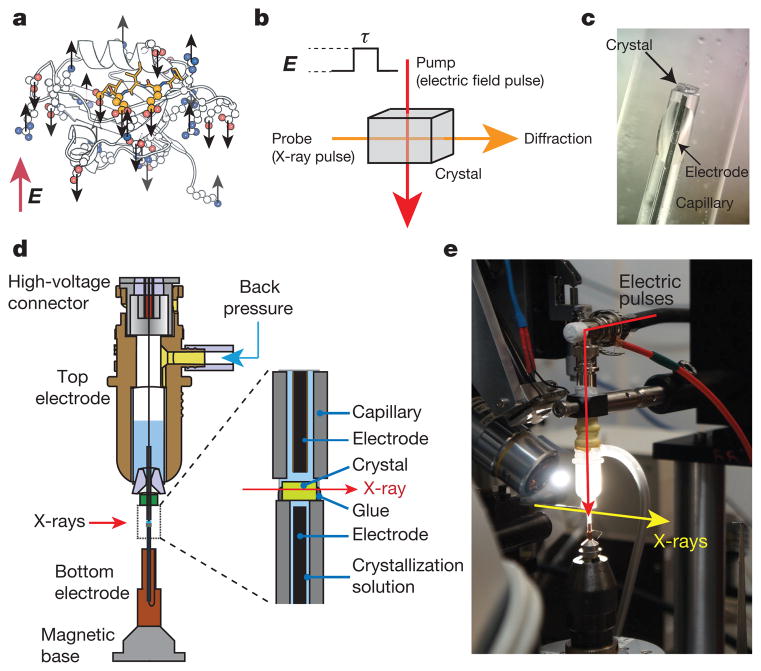
The idea of EF-X is simple; many elementary charges and local dipoles are present in proteins (Fig. 1a), and with the application of sufficiently large external electric fields, it should be possible to exert forces on them that cause motions of atoms throughout the protein structure. If the electric field can be applied in conjunction with timed X-ray diffraction in protein crystals, it should be possible to observe all of these motions in high spatial and temporal detail (Fig. 1b). To implement the idea, we began with a few design considerations. Theoretical calculations suggest that electric field strengths of ~1,000,000 V cm−1 are in the right range to drive subtle motions of atoms within proteins that can be observed through high-resolution diffraction methods (Methods and Extended Data Table 1). Fields of 1 MV cm−1 are dangerously large from a laboratory point of view, but are close to physiological; for example, 0.125 MV cm−1 corresponds to ~100 mV across a cell membrane. Such voltages influence conformational transitions in proteins such as ion channels19 and G-protein-coupled receptors20, and are consistent with biological relevance. In general, the basic premise of EF-X is that features corresponding to the biologically relevant reaction coordinate(s) of proteins are enriched in the low-lying energetic states around the ground state, and that forces imposed by ~1 MV cm−1 electric fields represent an effective strategy to bias and expose these states.
Figure 1. EF-X principles and implementation.
a, A sampling of charged residues (in CPK colours) in LNX2PDZ2 (Protein Data Bank (PDB) accession 2VWR), exemplifying potential actuators for applied electric fields (E, in red). Ligand is in yellow. b, EF-X involves stimulation of motions in protein crystals by an applied electric field (E) of duration τ (the ‘pump’), and readout by much faster X-ray pulses (the ‘probe’). c, An LNX2PDZ2 crystal mounted across the orifice of a glass capillary, filled with crystallization solution and a metal electrode. The crystal is sealed onto the capillary by an electrically insulating glue. d, The crystal is mounted on the bottom electrode and the high voltage is delivered from a top electrode through a liquid junction composed of crystallization solution. Controlled back pressure on a reservoir of solution in the top electrode keeps the crystal continuously hydrated. e, A view of the assembled experimental apparatus.
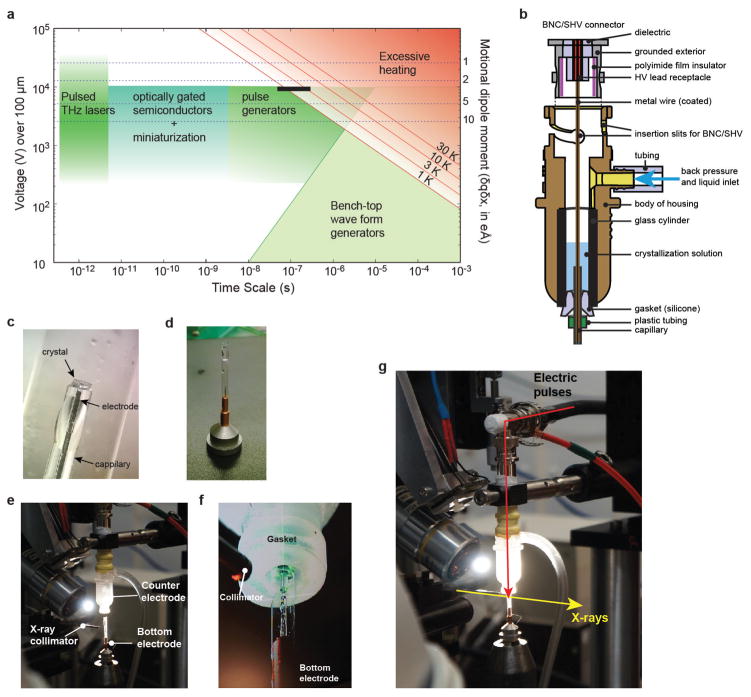
Practically, there are several experimental complications (Supplementary Information IA). Of these, the main one is crystal heating caused by electric-field-induced flow of ionic currents through solvent channels. If sufficiently large, this effect leads to dielectric breakdown, arcing, destruction of the crystal, and a dramatic end to the experiment (Supplementary Video 1). However, calculations with estimated conductivities of protein crystals21 and typical crystallization solutions suggested that electric fields on the order of 1 MV cm−1 should be tolerated for pulse durations up to microseconds (Supplementary Information IA). Together with rise-time limits of our current high-voltage system (~10 ns) and electrode design, this defines a window of timescales for these experiments at present (Extended Data Fig. 1a). These limits can be extended through further technical development.
On the basis of these considerations, we built a custom setup for room-temperature X-ray diffraction of protein crystals under strong electric field pulses on the sub-microsecond timescale (Fig. 1c–e, Methods and Extended Data Fig. 1). Protein crystals are sandwiched between two glass capillaries filled with crystallization solution and containing metal wires that serve as electrodes (Fig. 1c). The crystal is fixed by an electrically insulating glue to the bottom (ground) electrode and the high-voltage pulse is introduced from a top electrode through a liquid contact with the crystal (Fig. 1d and Supplementary Video 2). See Methods and Extended Data Fig. 1 for design details. This electrode system was integrated into a synchrotron X-ray facility designed for time-resolved crystallography (BioCARS22, Advanced Photon Source; Fig. 1e).
Application of EF-X to the PDZ domain
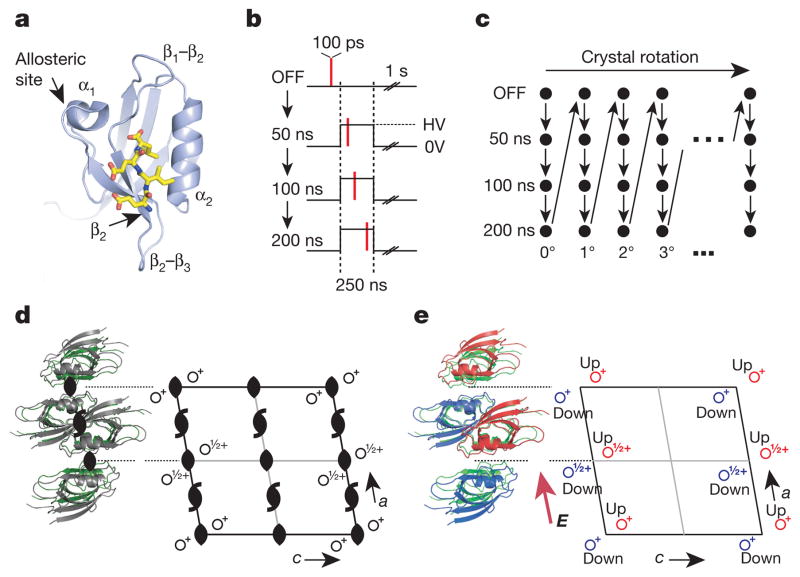
As an initial model system, we chose the second PDZ domain of the human E3 ubiquitin ligase LNX2 (LNX2PDZ2)23 (Fig. 2a). PDZ domains are 90–100-residue proteins that generally bind the C termini of target proteins between the α2 helix and β2 strand24. Previous data demonstrate the existence and functional relevance of allosteric coupling of the ligand-binding site to a few distant surfaces25, especially the α1 helix26,27 and the β2–β3 loop28 (see Supplementary Table 1). Otherwise, LNX2PDZ2 is a typical protein, with no special features that compromise the generality of this study. Specifically, LNX2PDZ2 has no known functional voltage dependence, providing a test that EF-X can be generically used in the context of randomly available formal and partial charges for analysis of protein mechanics.
Figure 2. An EF-X experiment in the LNX2PDZ2 domain.
a, LNX2PDZ2 binds target ligands (in yellow) in a groove between the β2 and α2 segments. The binding site is coupled to allosteric sites on the β2–β3 segment and the α1–β4 segment (through the β1–β2 loop and α1 helix). b, Data collection involves four sequential X-ray exposures for each crystal orientation: no voltage (OFF), and three time delays (50, 100, 200 ns) after onset of the voltage pulse. One second is allowed between pulses for crystal cooling. HV, high voltage. c, The protocol in b is repeated for a series of crystal rotations to collect a full diffraction data set. d, LNX2PDZ2 crystallizes in the C2 space group, which includes two kinds of rotational symmetry (black symbols); this results in four molecules per unit cell and one molecule per asymmetric unit. e, With the electric field E (applied along the a dimension), all rotational symmetry is broken. This results in a new unit cell with two molecules per asymmetric unit (red and blue)—one experiencing + E, and one experiencing − E.
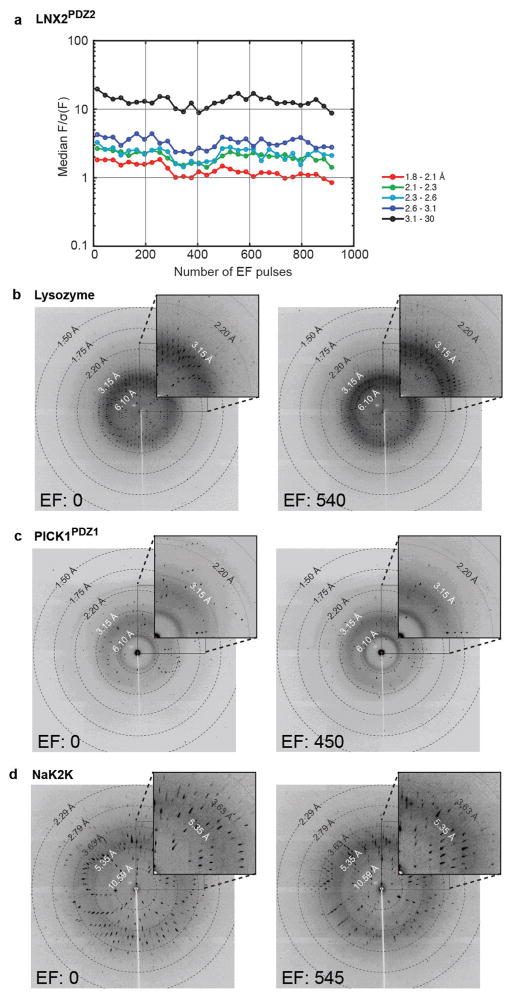
We performed EF-X experiments on LNX2PDZ2 with voltage pulses of 5–8 kV to 50–100-μm-thick crystals, resulting in field strengths of ~0.5–1 MV cm−1. The pulse durations ranged from 50 to 500 ns, and diffraction was collected with single 100 ps X-ray pulses. The pulse protocol permits us to examine the atomic structure before the electric pulse (voltage-OFF data set) and at any specified time delay after initiation of the electric pulse (voltage-ON data set) (Fig. 2b, c). The OFF data set provides a reference structure for study of electric-field-induced effects. As predicted by our calculations, LNX2PDZ2 crystals (and other protein crystals) readily tolerated hundreds of 100–500 ns electric field pulses of ~1 MV cm−1 and X-ray pulses without substantial loss of diffraction (Supplementary Table 2 and Extended Data Fig. 2). We collected a time series from a single LNX2PDZ2 crystal, consisting of an OFF data set and ON data sets at 6 kV and at 50, 100 and 200 ns delays from the rising edge of the electric field pulse (Fig. 2b, c and Supplementary Table 3); the variability in timing is less than 1 ns and is therefore negligible given the timescale of this experiment.
Breaking symmetry
An important analytic tool comes from understanding how the electric field affects the symmetry S of the crystal lattice. In general, the unit cell of a protein crystal can be constructed from a set of symmetry operations {S}—combinations of translations and rotations—that define its characteristic space group. For example, the LNX2PDZ2 crystals have space group C2, which, in addition to translational symmetry, has two kinds of rotational symmetry elements (Fig. 2d). As a consequence, there are four symmetric LNX2PDZ2 monomers per unit cell. What happens if an electric field is applied in a certain direction? Clearly, protein molecules in the crystal lattice with different orientations relative to the field will undergo different changes and will no longer be symmetric. The general rule is that any crystal symmetry operator S that does not preserve the orientation of the electric field E will be violated (‘broken’: S ° E ≠ E). For the LNX2PDZ2 experiment, the electric field breaks all the C2 rotation symmetry operators (Fig. 2e). Now, the four LNX2PDZ2 molecules in the unit cell are no longer equivalent, and symmetry is reduced such that two molecules see the field in one direction (we will refer to these molecules as ‘up’), and two see the field in the opposite direction (the ‘down’ molecules). In essence, if the up molecule experiences +6 kV, the down molecule experiences −6 kV, and so the force acting on otherwise equivalent atoms in these structures is opposite in direction. Although it need not be strictly symmetric, we would naively expect this to cause an opposite motion of atoms from their mean positions in the OFF state (Fig. 3a).
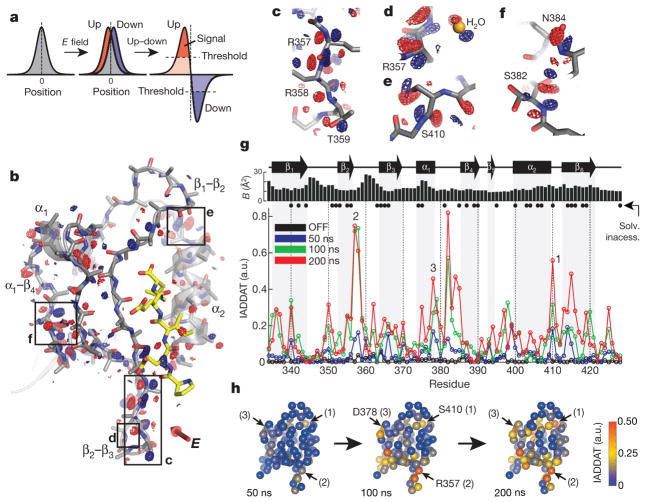
Figure 3. The up–down internal difference analysis.
a, In the simplest case, the electric field will shift the electron density distribution for an atom in the up and down molecules (red and blue, respectively) in opposite directions around its centroid in the voltage-OFF molecule (grey) (left and middle). Subtracting the up and down densities and applying a noise threshold (right), we expect peaks of positive (red) and negative (blue) difference density surrounding an atom in the OFF state—the hallmark of an electric-field-induced motion. b, The up–down internal difference map for a ‘front’ view of LNX2PDZ2, with regions highlighted in c–f boxed. The red three-dimensional arrow indicates the direction of the electric field, and bound ligand is in yellow. Maps are contoured at + 3.5 (red) and − 3.5 (blue) σOFF and, for clarity, are displayed within a 1.8 Å shell around main chain + Cβ atoms (see PyMOL session S1 for full map). c–f, Examples of electric-field-induced motions—opposing red and blue density—for main-chain, side-chain and solvent atoms. g, The IADDAT for the up–down molecules as a function of LNX2PDZ2 primary structure and time (blue, green and red traces). The OFF difference density (black) indicates the noise in the analysis. The graphs above indicate buried residues (solvent accessibility < 0.15 (Solv. inaccess.)) and refined isotropic B-factor for the voltage-OFF model. a.u., arbitrary units. h, The time evolution of the electric-field-induced effects mapped on the tertiary structure of LNX2PDZ2. Spheres indicate Cα positions and colours IADDAT.
This breaking of symmetry provides a powerful way to study the effect of the electric field on the protein structure. We can compare the up and down molecules within the unit cell, an internally controlled experiment that isolates the effect of the electric field on atoms. In contrast, artefacts due to radiation damage and heating are insensitive to the direction of the electric field and cancel out in this analysis (see Methods). In crystallographic terms, we compute an internal difference Fourier map in which we subtract the up and down electron densities (Fig. 3a). In such a map, the hallmark of an electric-field-induced structural effect is to see peaks of opposite sign around the position of an atom in the voltage-OFF state (red and blue, Fig. 3a).
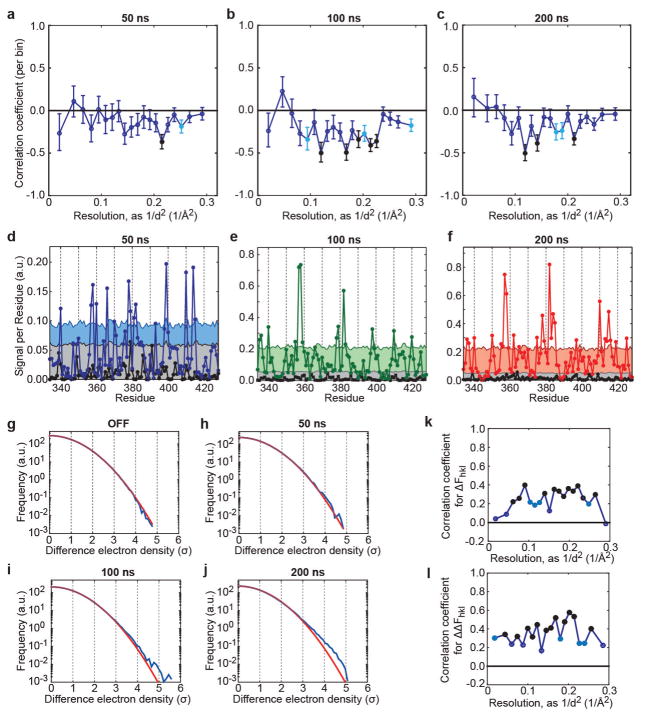
The up–down map shows pervasive evidence of electric-field-induced atomic motions (Fig. 3b–f). Just as proposed, we observe shifts of backbone, side-chain and solvent atoms in opposite directions between the up and down molecules (Fig. 3c–f). The structural response is distributed broadly over the protein tertiary structure, in both core and surface sites, with some of the strongest signals around the β2–β3, α1–β4 and α2–β6 segments (Fig. 3b). To examine the response quantitatively, we integrated the absolute difference electron density above a noise threshold (IADDAT) in a volume shell around the protein backbone29 (Fig. 3g). The up–down effect in the OFF state provides a measure of noise (black trace, Fig. 3g). By comparison, we observe a robust signal in the presence of the electric field that evolves over time from 50 ns to 200 ns (Fig. 3g, blue, green and red traces, and Fig. 3h). The electric-field-induced motions do not simply reflect solvent exposure or thermal (B) factors related to positional disorder (for all cases, P > 0.1, Fisher Z-test; see Methods) (Fig. 3g). Many of the affected residues do not have formally charged side chains, indicating that they move due to local dipoles or due to structural coupling with other charged residues. An extensive statistical validation of signal to noise is presented in Extended Data Figs 3a–c and 4, Supplementary Tables 4–6 and Supplementary Information IB.
The signal evolves heterogeneously over the structure (Fig. 3g, h), with some regions moving over the full time period (for example, peaks 1 and 3), and others complete at intermediate times (for example, peak 2). This variation in characteristic timescales of motion in different regions of the structure is a property that, with further study, could be deeply informative about the underlying pattern of forces between amino acid residues. A broad analysis of crystal growth conditions, diffraction quality and symmetry suggests that many protein crystals should be amenable to the EF-X experiment, including use of the up–down difference method (Supplementary Information ID).
Modelling of excited states
We refined atomic structures of the up and down states of the LNX2PDZ2 domain at 200 ns from the onset of the electric field. Since the field only subtly biases the ground state conformation, we carried out refinement against extrapolated structure factors (ESFs)30,31 (Extended Data Table 2). The ground state (OFF model, Extended Data Table 3) was used as a starting point, with progress supported by R factors (ΔRwork = −6.96%, ΔRfree = −5.92%; Methods, Extended Data Fig. 5 and Supplementary Information IB). Propagation of errors suggests that the ESF structures at 200 ns have an effective resolution of 2.3 Å.
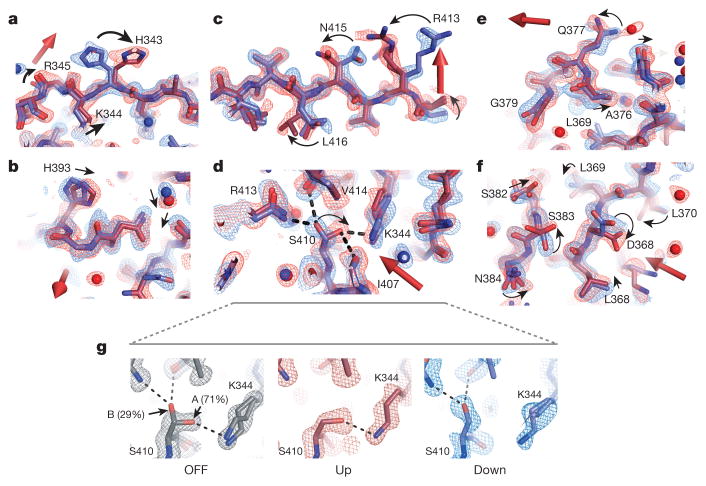
The structures demonstrate electric-field-induced perturbations of nearly every type of physical interaction throughout the protein structure—induction of side-chain rotamer flips (Fig. 4a), continuous displacement of backbone atoms, side chains and bound waters (Fig. 4b), propagated rotamer shifts suggesting collective motions through the structure (Fig. 4c), breaking and re-forming of hydrogen bonds (Fig. 4d), global motions of entire secondary structure elements (Fig. 4e), and complex coordinated changes in large regions (Fig. 4f). Extended Data Fig. 6 shows additional examples. For some residues, the electric field biases the occupancy of pre-existing alternate conformational states in the voltage-OFF structure (Fig. 4g and Extended Data Fig. 7). These residues are differentially forced into either of the alternative configurations depending on the direction of the applied field. Thus, rather than inducing non-physiological states, EF-X appears to expose low-lying conformational states that are energetically near to the ground state.
Figure 4. A gallery of electric field-induced structural effects.
a–f, Refined models and associated 2Fo − Fc electron density contoured at 1.5σ for the up (red) and down (blue) LNX2PDZ2 structures (6 kV, 200 ns delay); the direction of the electric field is indicated by the three-dimensional arrow. The data show examples of rotamer flips (H343; a), continuous displacements (H393; b), potentially coupled rotamer flips (R413, N415, L416; c), rearrangements of hydrogen bonding (S410; d), motions of secondary structure elements (the α1 helix; e), and complex combinations of these effects (f). Per sign convention, atoms coupled to a positive charge in the up model would move in the direction of the field and in the down model, against the field. Motions occur at solvent-exposed (a–c, e) and -buried (d, f) regions (PyMOL sessions S2–S4 and Extended Data Fig. 6). g, S410 shows partial occupancy in two rotameric states (marked A and B) in a 1.1 Å room-temperature ground-state structure (OFF, Extended Data Table 3). These states are biased by the electric field such that the up and down models each adopt one of the two ground-state configurations (middle and right). Maps are contoured at 1.5σ. See Extended Data Fig. 7 for more examples.
These data validate the broad goals of EF-X—to globally perturb and record subtle motions in a mechanistically unbiased manner at atomic resolution. A key feature is the ability to actively populate and directly model the structures of low-lying excited states around the ground states of protein molecules, the configurations most likely to be relevant over the functional reaction coordinate. In addition, the ability to collect data sets at various time delays after the initiation of the electric field pulse means that we can observe these motions as they happen in time and make experimental movies of the temporal evolution of protein motions17.
The biological relevance of stimulated motions
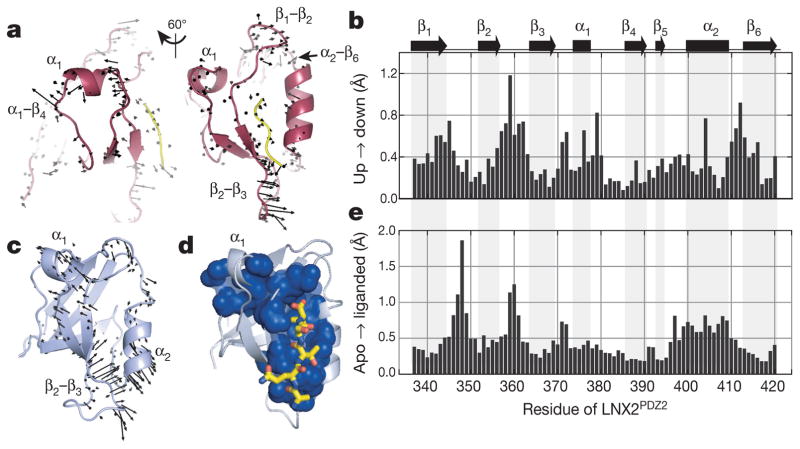
We asked what the electric-field-induced motions tell us about the biology of the PDZ domain. The backbone motions accumulate in four parts of the protein—the α1 helix and the β1–β2, β2–β3 and α2–β6 segments—all known to be functionally coupled to ligand binding (Fig. 5a, b). The partially buried α1 helix and the α1–β4 surface form the central components of allosteric communication in PDZ domains27,32–35, and residues in these regions undergo systematic electric-field-induced shifts and rotameric transitions (Figs 4f and 5a). In addition, the β1–β2 and β2–β3 segments move and become more ordered (Extended Data Fig. 6d), transitions reminiscent of ligand-induced changes in many PDZ domains24,25. Finally, the electric-field-induced switching of S410 between two hydrogen-bonding networks (α2–β6 region, Fig. 5d, g) positions a conserved buried cationic residue (K344) in the ligand-bound configuration in several PDZ homologues36 (Extended Data Fig. 6e).
Figure 5. The relationship between electric-field-induced conformational change and PDZ function.
a, Two views of the electricfield-induced structural changes in LNX2PDZ2 (6 kV, 200 ns data set), with vectors representing the displacements of main-chain atoms transitioning from the up to down models (enlarged × 5 for clarity). The motions are most prominent in the β1–β2, β2–β3, α1 and α2–β6 regions. b, The mean displacements of backbone atoms per residue between the up and down states. c, Conserved motions of backbone atoms due to ligand binding (apo to liganded) in high-resolution structures of 11 diverse homologues of the PDZ family (vectors enlarged × 10). The motions occur in similar regions as in a, but also include the α2 helix. d, The protein sector (blue spheres), a group of coevolving amino acid positions in the PDZ protein family (PFAM 27.0 (ref. 39)); the sector connects the ligand-binding pocket to the β2–β3 segment and to the α1–β4 surface through the β1–β2 loop and the α1 helix. e, The median ligand-induced displacements of backbone atoms per residue (LNX2PDZ2 numbering) in the ensemble of 11 PDZ homologues. Statistical comparison with that for the up to down transition (b) shows a significant correlation (P < 0.001, Fisher Z-test).
To test the relationship of electric-field-induced motions to PDZ function rigorously, we analysed the ligand-induced displacements of main-chain atoms averaged over 11 diverse homologues of the PDZ family (Fig. 5c, e). Ligand-induced motions shared by these homologues are most pronounced in the β1–β2, β2–β3 and α2–β6 segments, and in the α1 and α2 helices (Fig. 5c), comprising most regions with electric-field-induced motions. These regions are also linked by the protein sector26,37—a group of amino acid positions that statistically co-evolves in the entire PDZ family—suggesting that the pattern of ligand-induced motions is an evolutionarily conserved feature in the PDZ domain (Fig. 5d). Overall, the pattern of conserved apo to liganded displacements (Fig. 5e) shows a highly significant correlation (P < 0.001, Fisher Z-test) with the electric-field-induced up to down motions (Fig. 5b). This result is particularly meaningful because, in principle, ligand binding and electric fields could impose forces in a protein structure in a manner completely distinct from each other, and the comparison reflects an experiment at just one field strength, orientation, and time delay. Thus, EF-X samples motions in the protein structure that are enriched in its biologically relevant mechanical modes.
From structure to mechanics
A central missing tool in our study of proteins is a method to stimulate and record biologically relevant motions over a broad range of time-scales and with atomic resolution. We show that strong but physiological electric fields can be used to examine a wide range of functional conformational changes within a protein. With further development, we expect that EF-X can be broadly used to investigate the structural basis of protein function (see Supplementary Information ID, IE). It will be of interest to extend EF-X to broader timescales of motions (a matter of further engineering, Extended Data Fig. 1a), to characterize motions in proteins with complex multistate conformational changes, and to study the structures of membrane proteins under physiological electric fields.
However, to go beyond the descriptive level of motions to the underlying physics, it is necessary to infer the spatial distribution of forces, and energies, associated with the observed conformational transitions. In this regard, it is informative to compare EF-X with single-molecule force spectroscopy15. An electric field of 1 MV cm−1 (or 108 N C−1) exerts 16 pN per elementary charge, a force sufficient to unzip a leucine zipper protein38. Thus, an exciting prospect is to obtain direct force and free energy estimates for both gradual and discrete conformational changes as in force spectroscopy, but with the atomistic detail and temporal resolution made possible by EF-X. This goal is complicated by the cooperative action of amino acids, but EF-X provides a potential path to address this problem as well. We can collect EF-X data while varying the duration, orientation, spatial pattern and magnitude of applied forces and statistically group residues that move together into collective modes. These modes may represent the basic mechanical units underlying protein function.
This initial report of EF-X does not yet present a simple, turnkey method. Crystal handling, electrode design, data analysis and structure refinement all leave substantial room for improvement. In addition, the analysis of effects induced by one field orientation and at one time-scale is just a starting point for a full description of relevant motions. However, this work provides an experimental foundation for building good physical models for proteins, the critical link between structure and function.
METHODS
System design and safety
The design of the experimental system is based on simple physical considerations. An applied electric field E will impose a force on net charge q to cause a displacement Δx along the field. For any residue (or other group of atoms), we can associate a transition dipole moment Δμ=ΣiqiΔxi with each motion, where i is an index over atoms (in units of elementary charge times distance (eÅ); 1 eÅ ≈ 4.8 D). The energetic effect due to the electric field is −Δμ · ΔE, and its significance depends on how it compares to thermal energy kBT; for example, a weakly populated excited state increases in occupancy by ~2.7 fold when its energy relative to the ground state is lowered by 1kBT. As shown in Extended Data Table 1, fields of ~1 MV/cm are in the right range for our purpose. On the basis of this, we designed a ±10 kV power supply (Spellman HV) which charges a pulse generator (IXYS Colorado), and from which high-voltage (HV) pulses are triggered by a TTL signal from the synchrotron signal processing hardware. This establishes precise timing between X-ray and electric field (EF) pulses. Integrity of the conductive path to the tip of the capillary and its associated propagation delay were determined using an HV probe.
We designed a number of safety features. Custom RG-11 high-voltage cables (Gater Industries) were high-potential tested by the power group at the Advanced Photon Source and were approved for use up to 8 kVDC. EF pulses were generated in ‘half-bridge’ mode, where residual charge stored by the HV cables after an EF pulse is drained through a large capacitor connected to ground. The counter electrode was designed to avoid any path through air of less than 1 cm to the grounded cable connector exterior. The inhibit feature of the power supply was connected to an interlock system at the beamline facility, ensuring that the system is de-energized upon personnel entry into the beamline hutch. Power supply voltage and the counter electrode backpressure were controlled remotely using a network-connected microcontroller and custom software.
Electrode construction
The RG-11 cable is terminated on one side with an HV connector (LEMO) (for the pulse generator) and on the other side with an SHV connector (for the housing of the top counter electrode) (Extended Data Fig. 1). The housing was prototyped in-house using a three-dimensional printer (Formlabs, Somerville, MA) and custom fabricated commercially (PolyJet technology, PartSnap, Irving, TX). The housing contains a cylindrical glass insert fitted with a silicone gasket and a thin metal wire (75 μm diameter, Cooner Wire, Chatsworth, CA) with a dielectric coating, except at the tip. The wire was guided to the crystal through a glass capillary (0.5 or 1.0 λ (140 or 200 μm, respectively) orifice, Drummond Scientific, Broomall, PA). The electrode housing was filled with crystallization solution and contains a small port (blue arrow, Extended Data Fig. 1b) that allowed for computer-controlled backpressure for slow infusion of liquid through the top electrode to maintain crystal hydration. Bottom electrodes were prepared from glass capillaries (0.25 λ, Drummond Scientific) with a ~100 μm orifice, cut in half and aminosilanized at the tip surface to improve adhesive capacity. A 75 μm diameter uncoated stainless steel wire (Cooner Wire) was threaded until just below this orifice. The capillary was inserted in a reusable goniometer base (MiTeGen, Ithaca, NY) and soaked, in inverted position, in crystallization solution.
Protein expression, purification and crystallization
For LNX2PDZ2, we obtained an expression strain (BL21(DE3)-R3-pRARE2) and plasmid construct (pNIC28-LNX2PDZ2) from the Structural Genomics Consortium (SGC)40 (http://www.thesgc.org; construct identifier LNX2A-c033). pNIC28-LNX2PDZ2 includes residues 336–424 from Homo sapiens LNX2, with the F338L mutation described by the SGC, an N-terminal cloning artefact (334–335), and a C-terminal ligand motif Glu-Ile-Glu-Leu (425–428). LNX2PDZ2 protein was expressed as an N-terminal hexahistidine fusion in BL21(DE3)-R3-pRARE2 and purified by nickel affinity chromatography (Ni-NTA agarose, Qiagen), cleavage of the TEV tag by 1 U ProTEV per 50 μg protein during dialysis into 50 mM HEPES pH 7.5, 500 mM NaCl, 5% glycerol, 0.5 mM TCEP, size exclusion chromatography, and concentrated to 20 mg/ml for storage. Two protocols yielded suitable crystals. In the first, 3.5 mg/ml protein was dialysed twice (12 and 6 h) against 3 l 5% glycerol, and crystallized by the hanging drop vapour diffusion method in 19% PEG-300, 48 mM citric acid, 35 mM NaH2PO4 and 5% glycerol at 20 °C. Drops were set up by mixing 0.55 μl protein and 1.0 μl buffer. In the second protocol, concentrated protein was diluted to 3.5 mg/ml with 10% glycerol and crystallized by hanging drop vapour diffusion in 27–31% PEG-300, 43 mM citric acid and 35 mM NaH2PO4 at 20 °C (drops, 1.0 μl protein and 1.0 μl well solution).
Crystal mounting
Crystals were manually mounted under a stereomicroscope across the orifice of the pre-soaked bottom electrode, attached to a magnetic goniometer base. Sylgard 184 (Dow-Corning) was prepared to just before full curing and applied around the crystal using a piece of monofilament fishing line (Cajun Line, 0.012″ diameter, Zebco, Tulsa, OK), taking care to not overcoat the crystal. A MiTeGen polyester sleeve containing 15 μl of 50/50 crystallization solution and water at one end, was slid over the electrode to maintain suitable vapour pressure for the crystal. The mounted electrode system was placed on the goniometer and the final experimental configuration (Extended Data Fig. 1e, g), was achieved in three steps: (1) coarse relative positioning of the two electrode system using an XYZ translation stage (Thorlabs), (2) cutting the MiTeGen sleeve to expose the crystal, and (3) rapid, camera-guided approach of the top counter electrode until a liquid junction with the crystal was established (Supplementary Video 2).
Data collection and reduction
EF-X data were collected at BioCARS (14-ID) at the Advanced Photon Source, Argonne National Laboratory. The cryostream temperature was set to 289 K, and data were collected using a Rayonix MX340-HS detector with undulators U23 at 10.74 mm and U27 at 15.85 mm (wavelength range of 1.02–1.16 Å). The beam size was approximately 90 μm (h) × 60 μm (v) and slit settings were 200 μm (h) × 70 μm (v). Data collection proceeded in four 180° passes with 4°, 4°, 2° and 1° steps, respectively, and with matching offsets to maximize coverage of reciprocal space (Extended Data Fig. 3 and Supplementary Table 2). Laue data were processed by using Precognition and Epinorm software, with concurrent processing of OFF and ON frames. The data were integrated to 1.8 Å (Supplementary Table 3) and merged in space group P1 using the C2 unit cell dimensions. The orientation of the imposed electric field relative to the crystal lattice was established directly from indexed diffraction patterns.
Data for the high-resolution room-temperature (277 K) structure (Fig. 4g and Extended Data Table 3) were collected at the Stanford Synchrotron Radiation Lightsource (SSRL, 11-1) using the PILATUS 6M PAD detector from a single crystal and indexed, integrated, scaled and merged in HKL2000 (ref. 41) (HKL Research). The data showed little radiation damage (HKL2000 radiation-damage coefficients of 0.01–0.03; values > 0.1–0.15 indicate significant damage42) or non-isomorphism (coefficient 0.001).
Refinement (C2 OFF models)
We refined the structure of LNX2PDZ2 in the absence of electric field (OFF) first using the high-resolution (1.1 Å) data set collected at SSRL at 277 K, with initial phases obtained by molecular replacement using a cryo structure of LNX2PDZ2 (model PDB accession 2VWR). After early simulated annealing, a model was refined by alternating rounds of automated refinement in PHENIX43 and manual adjustments in Coot44. Alternate conformations were placed where supported by averaged kick45 and Fo − Fc maps. The final model had no Ramachandran outliers. Further refinement yielded a model without alternate conformations, also without Ramachandran outliers (Extended Data Table 3). Initial phases for the 289 K OFF data set collected at BioCARS were determined by direct placement of the high-resolution single-conformer model of LNX2PDZ, with small differences in unit cell dimensions refined by rigid-body refinement in PHENIX. Solvent molecules and alternate conformations were modelled in Coot, with real-space refinement to relieve backbone strain, and limited additional refinement in PHENIX (Extended Data Table 2). Anisotropic displacement parameters were refined only for residues with substantial difference density at atomic positions. Note that for calculation of internal difference maps, it is essential that the model used for phasing be refined in the space group of the OFF crystal lattice to guarantee exact position of symmetry elements. We subsequently expanded the refined model to the asymmetric unit of the reduced-symmetry space group using PDBSET (CCP4 6.4.0)46.
Internal difference maps
Difference map Fourier coefficients were calculated directly from merged structure factors using custom MATLAB (Mathworks Inc.) scripts performing the following operations: (1) match structure factors Fhkl and Fhkl and calculate differences ΔFhkl=Fhkl−γh̄kl̄Fh̄kl̄, where γh̄kl̄ are the correction coefficients for absorption anisotropy derived from OFF data (below); (2) obtain phases of the corresponding structure factors from the C2 OFF model expanded into C1 using PDBSET (CCP4 6.4.0); (3) calculate weights according to
as previously described29,47 and modified48 to include a term reducing the contribution of any single structure factor difference. Following Schmidt et al.29,31, the difference density maps are improved if structure factors corresponding to large lattice spacings are rejected (here dhkl > 4 Å), since EF-X typically produces small-scale electron density differences. For anisotropic absorption correction, we compute , where the tilde indicates local scaling49 as implemented in SOLVE50. Map coefficients were calculated in PHENIX (FFT) with a grid spacing of 0.3 Å. Absolute difference density was integrated in UCSF Chimera27, with calculations based on the C2 OFF model, expanded to C1.
Refinement of excited states
Since the EF breaks C2 symmetry, refinement of the up and down models was carried out in the P1 space group, with the C2 OFF model as a starting point. A P1 unit cell was chosen containing one up and one down chain, requiring a rotation around the c* axis by arctan(b/a) (here: 31.1°). To do this, the C2 OFF model was ‘expanded’ in PDBSET (CCP4 4.6.0) using symmetry operations (1) X, Y, Z, and (2) (1 − X), Y, (1 − Z) and the resulting model was rotated in PDBSET by the specified angle.
Extrapolated structure factors were calculated as , where N = 1/(1 − f) is the extrapolation factor30. For traditional pump-probe experiments, f is interpreted as the fraction of molecules excited by an optical pulse30; here, it increases the effective population of excited states, facilitating structure refinement. N was chosen as a trade-off between two criteria: map quality, which deteriorates with increasing N, and the appearance of difference electron density peaks consistent with internal difference maps, which initially increases with increasing N (systematic optimization of N in a site-specific manner will be explored in future work). Refinement was performed mostly manually in Coot with determination of R factors in PHENIX, combined with bulk solvent scaling and occupancy refinement every 5–10 modifications (Extended Data Fig. 5a). Near completion, a few rounds of overall coordinate refinement (PHENIX, 10–15 microcycles, small geometric weights) were included. Electron density maps and composite omit maps were calculated in PHENIX with 0.3 Å grid spacing and default settings. Reflections in the Rfree test set were included in final map calculations. The refinement statistics are given in Extended Data Table 2.
Comparison to homologous PDZ domains
Eleven pairs of high-resolution (≤ 2 Å) X-ray structures of PDZ domains with and without ligand were selected: NHERF-1PDZ1: PDB accessions 1G9O, 1GQ4; PALS-1PDZ: 4UU6, 4UU5; Tiam-1PDZ: 3KZD, 4GVC; ZO-1PDZ1: 4OEO, 4OEP; ErbinPDZ: 2H3L, 1MFG; DishevelledPDZ: 2F0A, 1L6O; PDZK-1PDZ3: 3R68, 3R69; ShankPDZ: 1Q3O, 1Q3P; GRIP-1PDZ6: 1N7E, 1N7F; PTP-1EPDZ2: 3LNX, 3LNY; PSD-95PDZ3 (R.R. et al., unpublished observations). Structures were aligned in PyMOL, using ‘super’ for backbone atoms, first to the down state of LNX2PDZ2, and then within each pair (Extended Data Fig. 5d legend). For backbone atoms with matching positions in LNX2PDZ2, displacements (Δ r) from unbound (apo) to bound (liganded) were then calculated. Atoms with |Δ r| < 0.1 Å were excluded from analysis. Average displacements displayed in Fig. 5c represent the median magnitude and average direction of apo to liganded displacement over homologues.
Statistics
To assess statistical significance of correlations between various experimental measures, the observed quantities were transformed to stabilize variance, reduce kurtosis and approximate a normal distribution. IADDAT values (Fig. 3) were square-root transformed, and B-factors (Fig. 3) and displacements (Fig. 5) were log-transformed. To assess the statistical significance of correlations, sample correlation coefficients were then Fisher Z-transformed, and tested for deviation from a standard normal distribution. For the statistical comparison of the data in Fig. 5b and e, individual residues can be considered independent, yielding P < 0.001. More conservatively, one can also take the shorter of the correlation length scales of B-factors and observed displacements (~ 2 residues) as a measure of internal data dependence. This yields a reduced number of independent samples and P < 0.01. Thus, the association of Fig. 5b and e is robust to local internal correlations in the data. No statistical methods were used to predetermine sample size.
Data availability
Structure factors and refined models have been deposited in the PDB under accessions 5E11, 5E1Y, 5E21 and 5E22.
Extended Data
Extended Data Figure 1. The experimental setup of EF-X.
a, A plot relating the applied voltage across a 100-μm-thick crystal (left axis) and the size of transition dipole moments of conformational changes that can be excited by 1kBT (right axis) to the duration of the applied electric field. Feasible methods of generating strong electric field pulses are indicated as green and cyan shaded areas. Waveform and pulse generators can provide pulses down to the nanosecond timescale. Faster pulses can be generated using terahertz pulsed lasers with strong electric field components51 or by optical gating of semiconductors52; such systems are already present at third-generation synchrotron and X-ray free-electron laser facilities. The black bar indicates the approximate range covered by the current experiments. The calculation of temperature jumps caused by the electric field is described in Supplementary Information IA. b, Schematic cross-section of the counter electrode. The blue arrow indicates the path by which backpressure is applied to drive flow through the capillary (see Methods). c, Crystals are mounted on top of capillaries containing a metal electrode and soaked in crystallization solution. d, The capillary with crystal is mounted in a reusable goniometer base and protected from humidity fluctuations with a polyester sleeve (MiTeGen) containing 50% (v/v) crystallization solution. This assembly forms the bottom electrode. e, The counter and bottom electrodes are assembled at the beam line to allow rotation around the capillary axis. f, Once the sleeve is trimmed to just above the level of the crystal, the counter electrode is brought in using a translation stage (camera view of the approach) (Supplementary Video 2). g, Overview of the final set up with the direction of the X-ray and electric field pulses, reproduced from Fig. 1e.
Extended Data Figure 2. Tolerance of electric field pulses in several protein crystals.
a, Diffraction quality of a LNX2PDZ2 crystal (experiment 3-35, Supplementary Table 2), measured by the ratio of structure factor amplitude to noise (F/σ(F)) as a function of number of 250 ns, 6 kV electric field pulses and as a function of resolution bin (in colours, see legend). b–d, Diffraction images for three other protein crystals before (left) and after (right) ~ 500 electric field pulses (precise value indicated). Crystal orientations are different between before and after frames. The data correspond to the following experiments in Supplementary Table 2: b, lysozyme, experiment 3-08; c, PDZ1 of PICK1, experiment 3-17; d, NaK2K, experiment 3-80. The data indicate that several protein crystals can tolerate the EF-X experiment.
Extended Data Figure 3. Internal consistency and temporal evolution of internal difference map signal.
a–c, Analysis for the data presented in Fig. 3. a, Consistency of estimated signal per residue derived from two data collection passes on the same crystal (black: OFF; blue: 50 ns; green: 100 ns; red: 200 ns). Overall correlation coefficient 0.59. Signal is defined as the integrated absolute difference density above 2.5σOFF within 1.5 Å of the protein backbone, square-root transformed to stabilize variance. Per-time-point correlation coefficients are: − 0.07 (OFF, P > 0.1), 0.23 (50 ns; P = 0.01); 0.35 (100 ns; P < 10−3) and 0.34 (200 ns; P < 10−3). b, Consistency of the obtained signal per residue between time points. Correlation coefficients are: 0.17 (OFF; P = 0.05), 0.55 (50 ns; P = 1 × 10⁻⁹) and 0.72 (100 ns; P < 10−20). The diagonal is shown for reference. Note that slight correlation in the OFF data set may indicate imperfect correction for anisotropic absorption. c, Signal integrated along the entire protein backbone in passes 1 and 2 (blue crosses and circles, respectively) and over the entire data set (squares). The red line indicates a naive expectation of a -fold increase in signal-to-noise ratio.
Extended Data Figure 4. Validation of signal in structure factors and difference maps.
a–c, A negative correlation between and is consistent with oppositely directed motions in the up and down states. Analysis is performed over 20 resolution bins to allow for statistical testing. Shown are the correlation coefficients per bin between ΔFhkl and ΔFh̄kl̄. In a linear response approximation and in the absence of measurement error, we expect ΔFhkl=−ΔFh̄kl̄. Reflections with |ΔFhkl| < σ(ΔFhkl), |ΔFh̄kl̄| < σ(ΔFh̄kl̄) or |ΔFhkl| > 10 were excluded from analysis, and likewise for ΔFh̄kl̄. Results at 50 ns (a), 100 ns (b) and 200 ns (c). To assess significance, each bin was considered statistically homogeneous, with observations considered independent. Bins with significant negative deviation from 0 (after Fisher Z-transform) are indicated as filled circles (P < 10−3: black; P < 10−2: light blue). Error bars indicate standard errors based on the assumption of a normal distribution after Fisher Z-transform. d–f, Statistical significance of Fig. 3g. Comparison of integrated absolute difference density above 2.5σ, within 1.5 Å of backbone C, N and O atoms (‘signal’; see also Fig. 3a). d, Comparison of signal in the OFF state and at 50 ns. The grey-shaded area indicates the 0–95th percentile for random sampling from the OFF map at the same probe volume (because the conformation of the backbone changes from residue to residue, the effective probe volume varies along the protein backbone) and threshold. The blue-shaded area indicates the 0–95th percentile for random sampling using the conservative sampling protocol described in test 4 of the statistical validation. e, Same analysis at 100 ns. f, Same analysis at 200 ns. Note that we were unable to scale all diffraction images at once, and instead scaled the OFF data with each time point separately. We compare each ON data set to the OFF data as scaled with that time point. As a result, there are small differences between the OFF traces in d–f. g–j, Deviations from a normal distribution for internal difference maps. Shown are voxel histograms for internal difference electron density (DED) maps without applied field (OFF) (g), and at 50 ns (h), 100 ns (i) and 200 ns (j) of applied electric field. Red lines indicate fits to a normal distribution based on calculated variance. Blue lines are histograms of voxel internal DED values (map grids of 0.3 Å). Note that by construction, for internal DED maps the positive and negative sides of the histogram are the same, apart from discretization effects. To assess statistical significance of deviations from normality, we sampled C2 asymmetric units (ASUs) at the Nyquist sampling frequency (here, 0.9 Å). For the OFF map, we find no significant deviations from normality (P > 0.1 for the Jarque–Bera test, the Anderson–Darling test, and the Lilliefors test; all using default settings in Matlab). At 200 ns, each test rejects a normal distribution with P < 0.01. At 50 and 100 ns, the results of statistical testing depend on how the internal DED map is subsampled: for a single C2 ASU, none of the tests rejects the null hypothesis, but when the same number of points is sampled from two neighbouring ASUs, the Jarque–Bera test rejects normality (P < 0.01 at 50 and 100 ns), suggesting limited deviation from normality. k, l, Reproducibility of a structural response to electric field. Correlation of data set 2 (see Supplementary Table 7) to the data set presented in the text. On the basis of ordinary differences ΔFhkl (k) and internal differences (l), reflections with |ΔFhkl| < σ(ΔFhkl)|, |ΔFh̄kl̄| < σ(ΔFh̄kl̄), or |ΔFhkl| > 10 were excluded from analysis, and likewise for ΔFh̄kl̄. The standard error of correlation coefficient estimates is ~ 0.07 in k and ~ 0.10 in l. Each bin is statistically homogeneous and observations are considered independent. Resolution bins with significant positive deviation from 0 (after Fisher Z-transform) are indicated as filled circles (P < 10−3: black; P < 10−2: light blue).
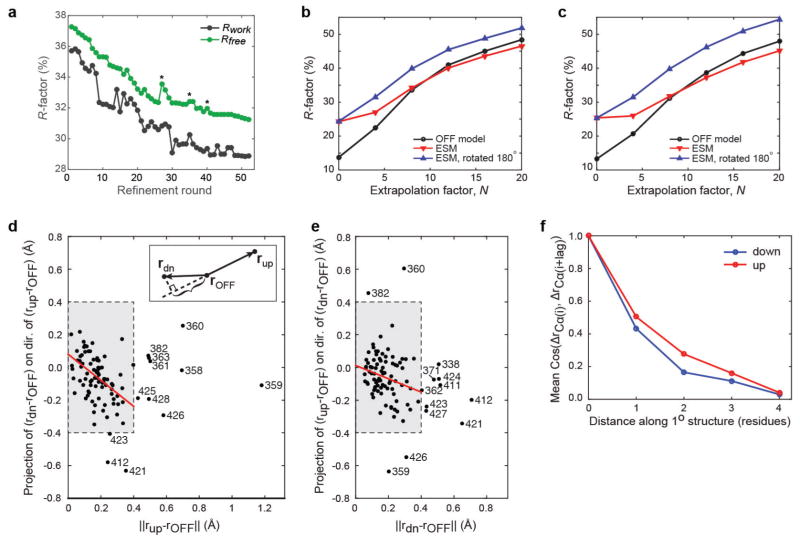
Extended Data Figure 5. Refinement, voltage-ON model at 200 ns.
a, Progress of refinement against extrapolated structure factors. Rounds marked by asterisks involved automated refinement with mild stereochemistry constraints to reduce deviations from optimal geometry due to manual refinement in Coot. Fluctuations in Rwork appear to be mostly due to the PHENIX bulk solvent scaling calculation used in R factor calculation. b, R factor for comparison of extrapolated structure factors, as a function of the degree of extrapolation, N, as derived from data set 2 (150 ns; see Supplementary Table 7), against calculated structure factors (Fc) derived from (1) the OFF model (black), (2) the excited state model (ESM) (red), and (3) an ‘upside-down’ ESM obtained by 180° rotation around the C2 two-fold rotation axis (blue), all derived from data set 1 (Extended Data Table 2). N relates to the fraction f of OFF signal subtracted as N = 1/(1 − f). No refinement against data set 2 was performed except for bulk solvent scaling. No test set was assigned. c, For comparison, the same analysis as in b, comparing the OFF model and 200 ns ESM model to the 100 ns data (from the same crystal). d–f, Relationship between Cα displacements in the up and down conformations at 200 ns. d, e, Projection of the down displacement on the direction of the up displacement (d), and the up displacement on the down displacement direction (all displacements are relative to the OFF model (e); models were superimposed using PyMOL, using C, Cα and N atoms of the protein backbone and including only residues 338–356, 362–380, 384–408 and 412–419; this excludes N- and C-terminal regions and mobile parts of the β2–β3, α1–β4 and α2–β6 loops). Shown are, for example Δrdown · Δrup/||Δrup|| versus ||Δrup||, as illustrated in the inset. For small displacements, a simple inverse dependence is expected. This is tested by robust linear regression for (projected) displacements smaller than 0.4 Å (red line fits to data in grey boxes; using default settings in Matlab). d, Slope = − 0.80 ± 0.16, intercept = 0.081 ± 0.031 Å; correlation coefficient: − 0.44. e, Slope = − 0.41 ± 0.17, intercept = 0.012 ± 0.033 Å; correlation coefficient: − 0.27. f, Average cosine between displacements of nearby Cα atoms as a function of distance along the primary structure.
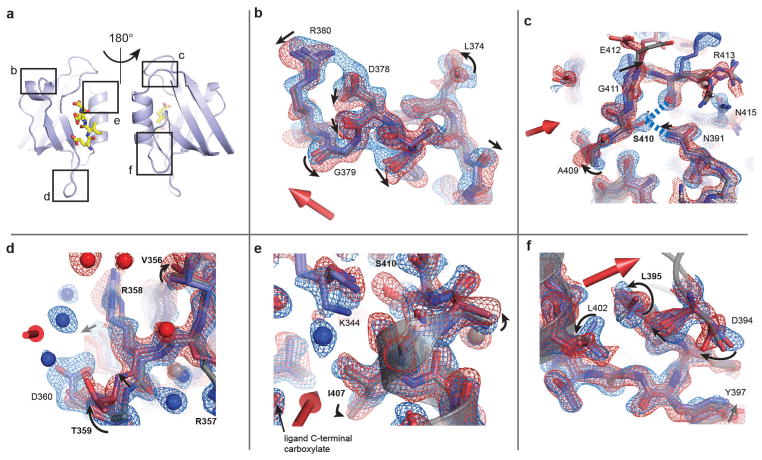
Extended Data Figure 6. Additional views of conformational changes due to the electric field.
a, Reference model indicating regions examined in b–f. b–f, Maps and models as in Fig. 4, with motions indicated by arrows and residues coupled to ligand binding in PDZ domains shown (as in Supplementary Table 1). b, Top view of the α1 helix, waters omitted and the side chain of Q377 truncated for clarity. c, Transverse shift of the α2–β6 loop, and perturbed down state of S410, forming new hydrogen bonds to R413 and N391 (dashed blue lines). d, Upward motion of the β2–β3 loop and change in dynamic disorder of protein and solvent. e, Conformational changes at the top of the ligand-binding pocket, with motion of the terminal amine of the K344 towards the ligand carboxylate group in the down state. f, Coupled rotameric changes of L402 (α2 helix), L395 and D394.
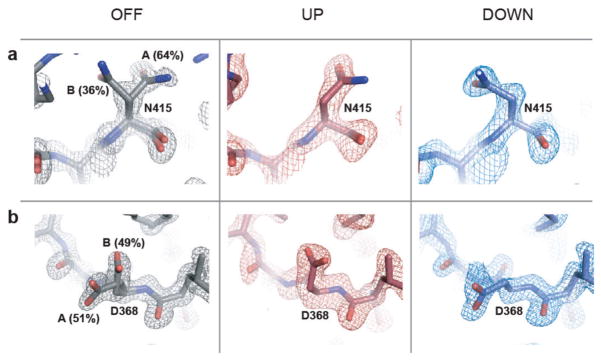
Extended Data Figure 7. Biasing pre-existing conformational heterogeneity in the LNX2PDZ2 ground state structure by the external electric field: additional examples.
a, b, A high-resolution (1.1 Å) room-temperature structure of the voltage-OFF ground state of LNX2PDZ2 (Extended Data Table 3), shows partial occupancy of N415 (a) and D368 (b) in two rotameric states (left). This pre-existing conformational equilibrium is biased in the presence of the electric field (6 kV, 200 ns delay), such that the up and down models each adopt one of the two ground state configurations (middle and right). This supports the result shown in Fig. 4g.
Extended Data Table 1.
Estimates of dipole moments associated with conformational changes
| Conformational change | Transition dipole moment (eÅ) | Electric field required for 1 kBT bias (MV/cm) |
|---|---|---|
| 180° flip of a water molecule46 | 0.8 | 3.3 |
| 180° flip of a peptide bond46 | 1.5 | 1.7 |
| Rotamer flip of a protonated histidine | 5.0 | 0.5 |
| 20° turn of a 3-turn α helix dipole46 | 5.3 | 0.5 |
| 2-ion hop in the KcsA channel49 | 7.0 | 0.4 |
| GPCR gating (net, m2R receptor) | ~20 | ~0.13 |
| Gating of a K+ channel50 | ~100 | ~0.03 |
Transition dipole moments were estimated based on the indicated references and for the histidine side chain based on measurements in PyMOL. Shown is the electric field required to bias a conformational equilibrium by 1kBT with the electric field applied parallel to the transition dipole moment.
Extended Data Table 2.
Data collection and refinement statistics for LNX2PDZ2 for EF-X experiment
| LNX2PDZ2 (OFF) | LNX2PDZ2 (200 ns) | Extrapolated Differences (8×) | |
|---|---|---|---|
| Data collection† | |||
| Space group | C2† | P1 | P1 |
| Cell dimensions | |||
| a, b, c (Å) | 65.30, 39.45, 39.01 | 38.15, 38.15, 39.01 | 38.15, 38.15, 39.01 |
| α,β,γ (°) | 90, 117.54, 90 | 113.31, 113.31,62.28 | 113.31, 113.31, 62.28 |
| Resolution (Å) | 30.08–1.80 (2.0–1.8)* | 30.08–1.80 (2.0–1.8) | 30.08–1.80 (1.86–1.80) |
| Rsym or Rmerge | 0.088 (0.051) | 0.087 (0.053) | n/a |
| I/σI | 20.7 (37.1) | 20.4 (39.9) | 6.98 (0.67) |
| Completeness (%)‡ | 75.1 (42.5) | 72.4 (38.1) | 70.2(17.8) |
| Redundancy | 5.8 (3.9) | 5.7 (3.6) | n/a |
| Refinement | |||
| Resolution (Å) | 30–1.8 (1.88–1.8) | 30–1.8 | 30–1.8 (1.88–1.8)§ |
| No. reflections¶ | 6,565 (288) | 11,568 | 11,291 (288) |
| Rwork/Rfree (%)|| | 13.2/14.8 | 28.9/31.3 | |
| No. atoms (excl. H) | 929 | 1,883 | |
| Protein | 829 | 1,712 | |
| Ligand/ion | 0 | 6 | |
| Water | 94 | 165 | |
| B-factors | 21.9 | 16.7 | |
| Protein | 19.3 | 16.0 | |
| Ligand/ion | n/a | 49.5 | |
| Water | 35.6 | 22.5 | |
| R.m.s deviations | |||
| Bond lengths (Å) | 0.020 | 0.018 | |
| Bond angles (°) | 1.63 | 1.80 | |
All data were collected from a single crystal of LNX2PDZ2 using Laue crystallography.
Highest-resolution shell is shown in parentheses. Data reduction in Precognition (Renz Research) differs from conventional data reduction in that weak spots are discarded a priori, resulting in low apparent completeness and high apparent signal and Rmerge, especially at high resolution. Note also that data statistics are reported after global scaling. Subsequent local scaling slightly affects statistics but this scaling mode does not report full last shell statistics. Extrapolated differences were assessed in Xtriage (PHENIX).
For the purpose of refinement of the OFF model, P1 reflections were merged according to C2 symmetry (merging R factor for this: 0.077).
See Supplementary Table 3 for data collection and reduction statistics as reported traditionally for Laue crystallography, including assessment of completeness in both C2 and P1. Reported data collection statistics refer to P1.
Data were retained to the resolution of the two ‘parent’ data sets (OFF and 200 ns); effective resolution based on propagation of errors is 2.3 Å; completeness over 30–2.3 Å is 89.9%.
Test sets comprised 5% and 10% of reflections for refinement of the OFF model and refinement against extrapolated structure factors, respectively.
The matching number of reflections in the high-resolution shell is coincidental.
Extended Data Table 3.
Data collection and refinement statistics for LNX2PDZ2 by room-temperature crystallography
| LNX2PDZ2 (high-resolution) | ||
|---|---|---|
| Data collection | ||
| Space group | C2 | |
| Cell dimensions | ||
| a, b, c (Å) | 64.91, 39.29, 38.80 | |
| α,β,γ (°) | 90, 117.41, 90 | |
| Resolution (Å) | 34.45–1.05 (1.05–1.01)* | |
| Rsym or Rmerge | 0.051 (0.54) | |
| I/σI | 12.84 (0.45) | |
| Completeness (%)† | 77.6 (3.0) | |
| Redundancy | 5.8 (1.2) | |
| Refinement | With alternate conformations | No alternate conformations |
| Resolution (Å) | 34.45–1.05 | 34.45–1.05 |
| No. reflections | 35,251 (137) | 35,251 (137) |
| Rwork/Rfree | 11.9/13.4 | 12.6/14.0 |
| No. atoms (non-H) | 1,039 | 824 |
| Protein | 929 | 719 |
| Ligand/ion | 0 | 0 |
| Water | 104 | 99 |
| B-factors | 19.2 | 19.7 |
| Protein | 17.1 | 17.3 |
| Ligand/ion | n/a | n/a |
| Water | 37.1 | 36.2 |
| R.m.s deviations | ||
| Bond lengths (Å) | 0.022 | 0.023 |
| Bond angles (°) | 1.86 | 1.88 |
On the basis of data collected from a single crystal.
Highest-resolution shell is shown in parentheses. Data were retained based on CC1/2 >50%. I/σI falls below 2 at 1.08 Å.
Completeness over 50–1.5 Å is 98.2%. Completeness falls below 50% (I/σI = 1) at 1.1 Å.
Supplementary Material
Acknowledgments
R.R. dedicates this paper to Alfred G. Gilman, whose contributions were profound and irreplaceable. We thank the staff at BioCARS, Stanford Synchrotron Radiation Lightsource (SSRL) and the UT Southwestern Medical Center Structural Biology Laboratory for technical support, and D. Borek, C. A. Brautigam, S. Leibler, A. Libchaber, K. Moffat, Z. Otwinowski and members of the Ranganathan laboratory for discussions. R.R. acknowledges support from National Institutes of Health (NIH) grant R01GM123456, the Robert A. Welch Foundation (I-1366), the Lyda Hill Endowment for Systems Biology, and the Green Center for Systems Biology. BioCARS is supported by NIH grant R24GM111072 and through a collaboration with P. Anfinrud (NIH/National Institute of Diabetes and Digestive and Kidney Diseases). The SSRL is supported by the US Department of Energy (Contract No. DE-AC02-76SF00515) and by the NIH (P41GM103393).
Footnotes
Supplementary Information is available in the online version of the paper.
Author Contributions D.R.H. and R.R. conceived the experimental approach. All authors contributed to the experimental design, D.R.H. and K.I.W. built the EF-X apparatus, and D.R.H., K.I.W., M.A.S. and R.R. performed experiments. D.R.H., V.S. and R.R. developed analysis methods and analysed the data. D.R.H. and R.R. wrote the manuscript with input from the other authors.
The authors declare no competing financial interests.
Readers are welcome to comment on the online version of the paper.
Online Content Methods, along with any additional Extended Data display items and Source Data, are available in the online version of the paper; references unique to these sections appear only in the online paper.
References
- 1.Alberts B. The cell as a collection of protein machines: preparing the next generation of molecular biologists. Cell. 1998;92:291–294. doi: 10.1016/s0092-8674(00)80922-8. [DOI] [PubMed] [Google Scholar]
- 2.Méndez J, Stillman B. Perpetuating the double helix: molecular machines at eukaryotic DNA replication origins. BioEssays. 2003;25:1158–1167. doi: 10.1002/bies.10370. [DOI] [PubMed] [Google Scholar]
- 3.Boehr DD, McElheny D, Dyson HJ, Wright PE. The dynamic energy landscape of dihydrofolate reductase catalysis. Science. 2006;313:1638–1642. doi: 10.1126/science.1130258. [DOI] [PubMed] [Google Scholar]
- 4.Noji H, Yasuda R, Yoshida M, Kinosita K., Jr Direct observation of the rotation of F1-ATPase. Nature. 1997;386:299–302. doi: 10.1038/386299a0. [DOI] [PubMed] [Google Scholar]
- 5.Krishnamurthy H, Gouaux E. X-ray structures of LeuT in substrate-free outward-open and apo inward-open states. Nature. 2012;481:469–474. doi: 10.1038/nature10737. [DOI] [PMC free article] [PubMed] [Google Scholar]
- 6.Vale RD, Milligan RA. The way things move: looking under the hood of molecular motor proteins. Science. 2000;288:88–95. doi: 10.1126/science.288.5463.88. [DOI] [PubMed] [Google Scholar]
- 7.Sprang SR. G protein mechanisms: insights from structural analysis. Annu Rev Biochem. 1997;66:639–678. doi: 10.1146/annurev.biochem.66.1.639. [DOI] [PubMed] [Google Scholar]
- 8.Monod J, Wyman J, Changeux JP. On the nature of allosteric transitions: a plausible model. J Mol Biol. 1965;12:88–118. doi: 10.1016/s0022-2836(65)80285-6. [DOI] [PubMed] [Google Scholar]
- 9.Popovych N, Sun S, Ebright RH, Kalodimos CG. Dynamically driven protein allostery. Nat Struct Mol Biol. 2006;13:831–838. doi: 10.1038/nsmb1132. [DOI] [PMC free article] [PubMed] [Google Scholar]
- 10.Cooper A, Dryden DT. Allostery without conformational change. A plausible model. Eur Biophys J. 1984;11:103–109. doi: 10.1007/BF00276625. [DOI] [PubMed] [Google Scholar]
- 11.Karplus M, McCammon JA. Molecular dynamics simulations of biomolecules. Nat Struct Biol. 2002;9:646–652. doi: 10.1038/nsb0902-646. [DOI] [PubMed] [Google Scholar]
- 12.Kay LE. Protein dynamics from NMR. Biochem Cell Biol. 1998;76:145–152. doi: 10.1139/bcb-76-2-3-145. [DOI] [PubMed] [Google Scholar]
- 13.Fraser JS, et al. Hidden alternative structures of proline isomerase essential for catalysis. Nature. 2009;462:669–673. doi: 10.1038/nature08615. [DOI] [PMC free article] [PubMed] [Google Scholar]
- 14.Sekhar A, Kay LE. NMR paves the way for atomic level descriptions of sparsely populated, transiently formed biomolecular conformers. Proc Natl Acad Sci USA. 2013;110:12867–12874. doi: 10.1073/pnas.1305688110. [DOI] [PMC free article] [PubMed] [Google Scholar]
- 15.Neuman KC, Nagy A. Single-molecule force spectroscopy: optical tweezers, magnetic tweezers and atomic force microscopy. Nat Methods. 2008;5:491–505. doi: 10.1038/nmeth.1218. [DOI] [PMC free article] [PubMed] [Google Scholar]
- 16.Moffat K. Time-resolved biochemical crystallography: a mechanistic perspective. Chem Rev. 2001;101:1569–1581. doi: 10.1021/cr990039q. [DOI] [PubMed] [Google Scholar]
- 17.Ren Z, et al. A molecular movie at 1.8 Å resolution displays the photocycle of photoactive yellow protein, a eubacterial blue-light receptor, from nanoseconds to seconds. Biochemistry. 2001;40:13788–13801. doi: 10.1021/bi0107142. [DOI] [PubMed] [Google Scholar]
- 18.Swain JF, Gierasch LM. The changing landscape of protein allostery. Curr Opin Struct Biol. 2006;16:102–108. doi: 10.1016/j.sbi.2006.01.003. [DOI] [PubMed] [Google Scholar]
- 19.Tao X, Lee A, Limapichat W, Dougherty DA, MacKinnon R. A gating charge transfer center in voltage sensors. Science. 2010;328:67–73. doi: 10.1126/science.1185954. [DOI] [PMC free article] [PubMed] [Google Scholar]
- 20.Ben-Chaim Y, et al. Movement of ‘gating charge’ is coupled to ligand binding in a G-protein-coupled receptor. Nature. 2006;444:106–109. doi: 10.1038/nature05259. [DOI] [PubMed] [Google Scholar]
- 21.Morozova TYa, et al. Ionic conductivity, transference numbers, composition and mobility of ions in cross-linked lysozyme crystals. Biophys Chem. 1996;60:1–16. doi: 10.1016/0301-4622(96)00007-5. [DOI] [PubMed] [Google Scholar]
- 22.Graber T, et al. BioCARS: a synchrotron resource for time-resolved X-ray science. J Synchrotron Radiat. 2011;18:658–670. doi: 10.1107/S0909049511009423. [DOI] [PMC free article] [PubMed] [Google Scholar]
- 23.Rice DS, Northcutt GM, Kurschner C. The Lnx family proteins function as molecular scaffolds for Numb family proteins. Mol Cell Neurosci. 2001;18:525–540. doi: 10.1006/mcne.2001.1024. [DOI] [PubMed] [Google Scholar]
- 24.Doyle DA, et al. Crystal structures of a complexed and peptide-free membrane protein-binding domain: molecular basis of peptide recognition by PDZ. Cell. 1996;85:1067–1076. doi: 10.1016/s0092-8674(00)81307-0. [DOI] [PubMed] [Google Scholar]
- 25.Fuentes EJ, Der CJ, Lee AL. Ligand-dependent dynamics and intramolecular signaling in a PDZ domain. J Mol Biol. 2004;335:1105–1115. doi: 10.1016/j.jmb.2003.11.010. [DOI] [PubMed] [Google Scholar]
- 26.Lockless SW, Ranganathan R. Evolutionarily conserved pathways of energetic connectivity in protein families. Science. 1999;286:295–299. doi: 10.1126/science.286.5438.295. [DOI] [PubMed] [Google Scholar]
- 27.Peterson FC, Penkert RR, Volkman BF, Prehoda KE. Cdc42 regulates the Par-6 PDZ domain through an allosteric CRIB–PDZ transition. Mol Cell. 2004;13:665–676. doi: 10.1016/s1097-2765(04)00086-3. [DOI] [PubMed] [Google Scholar]
- 28.McLaughlin RN, Jr, Poelwijk FJ, Raman A, Gosal WS, Ranganathan R. The spatial architecture of protein function and adaptation. Nature. 2012;491:138–142. doi: 10.1038/nature11500. [DOI] [PMC free article] [PubMed] [Google Scholar]
- 29.Schmidt M, et al. Ligand migration pathway and protein dynamics in myoglobin: a time-resolved crystallographic study on L29W MbCO. Proc Natl Acad Sci USA. 2005;102:11704–11709. doi: 10.1073/pnas.0504932102. [DOI] [PMC free article] [PubMed] [Google Scholar]
- 30.Genick UK, et al. Structure of a protein photocycle intermediate by millisecond time-resolved crystallography. Science. 1997;275:1471–1475. doi: 10.1126/science.275.5305.1471. [DOI] [PubMed] [Google Scholar]
- 31.Tenboer J, et al. Time-resolved serial crystallography captures high-resolution intermediates of photoactive yellow protein. Science. 2014;346:1242–1246. doi: 10.1126/science.1259357. [DOI] [PMC free article] [PubMed] [Google Scholar]
- 32.Feng W, Shi Y, Li M, Zhang M. Tandem PDZ repeats in glutamate receptor-interacting proteins have a novel mode of PDZ domain-mediated target binding. Nat Struct Biol. 2003;10:972–978. doi: 10.1038/nsb992. [DOI] [PubMed] [Google Scholar]
- 33.Im YJ, et al. Crystal structure of GRIP1 PDZ6–peptide complex reveals the structural basis for class II PDZ target recognition and PDZ domain-mediated multimerization. J Biol Chem. 2003;278:8501–8507. doi: 10.1074/jbc.M212263200. [DOI] [PubMed] [Google Scholar]
- 34.Long J, et al. Supramodular nature of GRIP1 revealed by the structure of its PDZ12 tandem in complex with the carboxyl tail of Fras1. J Mol Biol. 2008;375:1457–1468. doi: 10.1016/j.jmb.2007.11.088. [DOI] [PubMed] [Google Scholar]
- 35.van den Berk LC, et al. An allosteric intramolecular PDZ–PDZ interaction modulates PTP-BL PDZ2 binding specificity. Biochemistry. 2007;46:13629–13637. doi: 10.1021/bi700954e. [DOI] [PubMed] [Google Scholar]
- 36.Kang BS, Cooper DR, Devedjiev Y, Derewenda U, Derewenda ZS. Molecular roots of degenerate specificity in syntenin’s PDZ2 domain: reassessment of the PDZ recognition paradigm. Structure. 2003;11:845–853. doi: 10.1016/s0969-2126(03)00125-4. [DOI] [PubMed] [Google Scholar]
- 37.Halabi N, Rivoire O, Leibler S, Ranganathan R. Protein sectors: evolutionary units of three-dimensional structure. Cell. 2009;138:774–786. doi: 10.1016/j.cell.2009.07.038. [DOI] [PMC free article] [PubMed] [Google Scholar]
- 38.Gebhardt JC, Bornschlögl T, Rief M. Full distance-resolved folding energy landscape of one single protein molecule. Proc Natl Acad Sci USA. 2010;107:2013–2018. doi: 10.1073/pnas.0909854107. [DOI] [PMC free article] [PubMed] [Google Scholar]
- 39.Finn RD, et al. Pfam: the protein families database. Nucleic Acids Res. 2014;42:D222–D230. doi: 10.1093/nar/gkt1223. [DOI] [PMC free article] [PubMed] [Google Scholar]
- 40.Savitsky P, et al. High-throughput production of human proteins for crystallization: the SGC experience. J Struct Biol. 2010;172:3–13. doi: 10.1016/j.jsb.2010.06.008. [DOI] [PMC free article] [PubMed] [Google Scholar]
- 41.Otwinowski Z, Minor W. Processing of X-ray diffraction data collected in oscillation mode. Methods Enzymol. 1997;276:307–326. doi: 10.1016/S0076-6879(97)76066-X. [DOI] [PubMed] [Google Scholar]
- 42.Borek D, Dauter Z, Otwinowski Z. Identification of patterns in diffraction intensities affected by radiation exposure. J Synchrotron Radiat. 2013;20:37–48. doi: 10.1107/S0909049512048807. [DOI] [PMC free article] [PubMed] [Google Scholar]
- 43.Adams PD, et al. PHENIX: a comprehensive Python-based system for macromolecular structure solution. Acta Crystallogr D. 2010;66:213–221. doi: 10.1107/S0907444909052925. [DOI] [PMC free article] [PubMed] [Google Scholar]
- 44.Emsley P, Lohkamp B, Scott WG, Cowtan K. Features and development of Coot. Acta Crystallogr D. 2010;66:486–501. doi: 10.1107/S0907444910007493. [DOI] [PMC free article] [PubMed] [Google Scholar]
- 45.Pražnikar J, Afonine PV, Guncar G, Adams PD, Turk D. Averaged kick maps: less noise, more signal… and probably less bias. Acta Crystallogr D. 2009;65:921–931. doi: 10.1107/S0907444909021933. [DOI] [PMC free article] [PubMed] [Google Scholar]
- 46.Winn MD, et al. Overview of the CCP4 suite and current developments. Acta Crystallogr D. 2011;67:235–242. doi: 10.1107/S0907444910045749. [DOI] [PMC free article] [PubMed] [Google Scholar]
- 47.Ursby T, Bourgeois D. Improved estimation of structure-factor difference amplitudes from poorly accurate data. Acta Crystallogr A. 1997;53:564–575. [Google Scholar]
- 48.Srajer V, et al. Protein conformational relaxation and ligand migration in myoglobin: a nanosecond to millisecond molecular movie from time-resolved Laue X-ray diffraction. Biochemistry. 2001;40:13802–13815. doi: 10.1021/bi010715u. [DOI] [PubMed] [Google Scholar]
- 49.Matthews BW, Czerwinski EW. Local scaling method to reduce systematic errors in isomorphous replacement and anomalous scattering measurements. Acta Crystallogr A. 1975;31:480–487. [Google Scholar]
- 50.Terwilliger TC, Berendzen J. Automated MAD and MIR structure solution. Acta Crystallogr D. 1999;55:849–861. doi: 10.1107/S0907444999000839. [DOI] [PMC free article] [PubMed] [Google Scholar]
- 51.Hoffmann MC. Intense ultrashort terahertz pulses: generation and applications. J Phys D. 2011;44:083001. [Google Scholar]
- 52.Lefur P, Auston DH. A kilovolt picosecond optoelectronic switch and Pockel’s cell. Appl Phys Lett. 1976;28:21–23. [Google Scholar]
Associated Data
This section collects any data citations, data availability statements, or supplementary materials included in this article.
Supplementary Materials
Data Availability Statement
Structure factors and refined models have been deposited in the PDB under accessions 5E11, 5E1Y, 5E21 and 5E22.


