Abstract
Objective
The goal of this study is to investigate the performance, merits and limitations of source imaging using intracranial EEG (iEEG) recordings and to compare its accuracy to the results of EEG source imaging. Accuracy in this study, is measured both by determining the location and inter-nodal connectivity of underlying brain networks.
Methods
Systematic computer simulation studies are conducted to evaluate iEEG-based source imaging vs. EEG-based source imaging, and source imaging using both EEG and iEEG. To test the source imaging models, networks of inter-connected nodes (in terms of activity) are simulated. The location of the network nodes is randomly selected within a realistic geometry head model and a connectivity link is created among these nodes based on a multi-variate auto-regressive (MVAR) model. Then the forward problem is solved to calculate the potentials at the electrodes and noise (white and correlated) is added to these simulated potentials to simulate realistic measurements. Subsequently, the inverse problem is solved and an algorithm based on principle component analysis is performed on the estimated source activities to determine the location of the simulated network nodes. The activity of these nodes (over time), is then extracted, and used to estimate the connectivity links among the mentioned nodes using Granger causality analysis.
Results
Source imaging based on iEEG recordings may or may not improve the accuracy in localization, depending on the number and location of active nodes relative to iEEG electrodes and to other nodes within the network. However, our simulation results suggest that combining EEG and iEEG modalities (simultaneous scalp and intracranial recordings) can improve the imaging accuracy significantly.
Conclusions
While iEEG source imaging is useful in estimating the exact location of sources near the iEEG electrodes, combining EEG and iEEG recordings can achieve a more accurate imaging due to the high spatial coverage of the scalp electrodes and the added near field information provided by the iEEG electrodes.
Significance
The present results suggest the feasibility of localizing brain electrical sources from iEEG recordings and improving EEG source localization using simultaneous EEG and iEEG recordings to cover the whole brain. The hybrid EEG and iEEG source imaging can assist the clinicians when unequivocal decisions about determining the epileptogenic zone cannot be reached using a single modality.
Keywords: Scalp recording, Intracranial recording, EEG, iEEG, Electromagnetic source imaging (ESI), Inverse problem, Networks, Epilepsy
1 Introduction
Functional brain imaging aims at studying the function and dysfunction of the brain by monitoring its functional dynamics over time. Such modalities include, for instance, functional magnetic resonance imaging (fMRI) (Bandettini et al., 1992; Kwong et al., 1992; Ogawa et al., 1992), positron emission tomography (PET) (Ter-Pogossian et al., 1975), electroencephalography (EEG) (He et al., 1987; Michel and He, 2011; Niedermeyer and da Silva, 2005), and magnetoencephalography (MEG) (Cohen, 1972; Hämäläinen et al., 1993). Among these modalities, EEG is noninvasive, inexpensive, easy to set up and is readily available in most clinical settings (Niedermeyer and da Silva 2005). Such properties make it an appropriate tool for clinical and research studies on human brain. Particularly, the high temporal resolution of EEG, makes it well suited to study brain dynamics (He et al., 2011b; Edelman et al., 2015). This is essential in studying the brain where the physiological states can vary at a high pace. Additionally, EEG directly measures the instantaneous potentials generated at the scalp due to neuronal excitation inside the brain, while for example fMRI detects the magnetization caused by changes in blood flow and blood oxygenation; an indirect consequence of neuronal activity (Edelman et al., 2015; He et al., 2013).
The goal of solving the electrophysiological source imaging (ESI) is to project the EEG (or MEG) signals back onto the source space, where the EEG signals are originated from (He et al., 1987; He and Ding, 2013; Michel et al., 2004; Michel and He, 2011). In other words, the ESI aims at finding the underlying brain electrical activities using EEG (or MEG) signals, rather than only perceiving and interpreting the recordings over the sensor space, i.e. surface scalp recordings. Over the past decades, a number of approaches have been developed for ESI imaging which show promises of more accurate localization and imaging of brain activity and connectivity (Ding and He, 2013; He and Ding, 2013). However, the scalp EEG-based methods face challenges in localizing deep brain activities compared to sources that are more superficial. In such cases, using intracranial recording electrodes could provide more information about deeper sources (Zhang et al., 2008). More recently, the implantation of deep electrodes in the brain for Parkinson’s disease (Benabid et al., 2009), as well as the responsive cortical stimulation systems for controlling medically intractable epilepsy (Morrell, 2011) indicate that even long term implantation of deep and cortical electrodes is clinically applicable in many cases. Deep brain stimulation (DBS) electrodes, which were once used for stimulation only, are now capable of recording and stimulating concurrently (Stanslaski et al., 2012). Stereo electroencephalography (sEEG) (Talairach et al., 1974) is another example where the electrodes are placed in deep and far-from-scalp brain tissues with the purpose of sensing and monitoring deeper brain activity.
About 30% of the patients with epilepsy do not respond to any medication treatment (Annegers et al., 1979; Cockerell et al., 1995; Hauser and Kurland, 1975; Kwan and Sander, 2004). These patients are potential candidates of receiving surgery for the resection of the epileptogenic zone with the hope of becoming seizure-free (Engel, 2008). To minimize the risks and side effects of the resection and to improve surgical outcomes at the same time, clinicians need to come to certain and decisive conclusions about the exact origins and sites of the epileptic activity in the brain. To this end, patients might undergo multiple procedures before receiving the surgery. Occasionally and depending on the patient’s conditions, noninvasive imaging techniques may fail to achieve any conclusive results about the epileptogenic zone (Rosenow and Lüders, 2001). In such conditions, clinicians may opt for more invasive techniques; for example by implanting sEEG electrodes directly into the regions where they assume epileptic sources are situated with high probability (Gavaret et al., 2009; McGonigal et al., 2007). It should be emphasized that in clinical practice, iEEG recordings are generally used as mapping devices where the activity recorded at an electrode is assumed to have been generated from the vicinity of the recorded electrode (Gavaret et al., 2009; McGonigal et al., 2007; Alarcon et al., 1995). In reality, this might not be the case and iEEG recordings can be due to sources located at further distances that will affect the electrode recordings through volume conduction. Thus applying ESI at recordings from iEEG, could potentially shed some light into the matter. There are some works in the literature where possibility of source imaging using intracranial recordings has been demonstrated (Cam et al., 2017; Caune et al., 2014; Chang et al., 2005; Dümpelmann et al., 2009; Gharib et al., 1995; Ramantani et al., 2013; Yvert et al., 2005; Zhang et al., 2008).
The goal of this study is to investigate the possibility, merits and limitations of source imaging using iEEG recordings (with a focus on sEEG and DBS lead recordings) in comprehensive computer simulations. To this end, we exploit distributed source models to solve the inverse problem, subsequently to determine the source locations, and to identify the inter-nodal connectivity associated with underlying brain networks. We conduct systematic simulations to investigate the efficacy of ESI techniques applied to iEEG and combined EEG and iEEG recordings to determine underlying brain networks (location of network nodes and their inter-nodal links and connections). Specifically, the network geometry, i.e. the distance of sources (nodes of the network) from electrodes and distance of nodes from each other, is studied in detail to determine the accuracy of estimated underlying brain networks. In brief, we investigate source imaging based on surface and intracranial measurements, individually or simultaneously. Preliminary results were presented previously on use of deep intracranial electrodes for source localization (Sohrabpour and He, 2015).
2 Methods
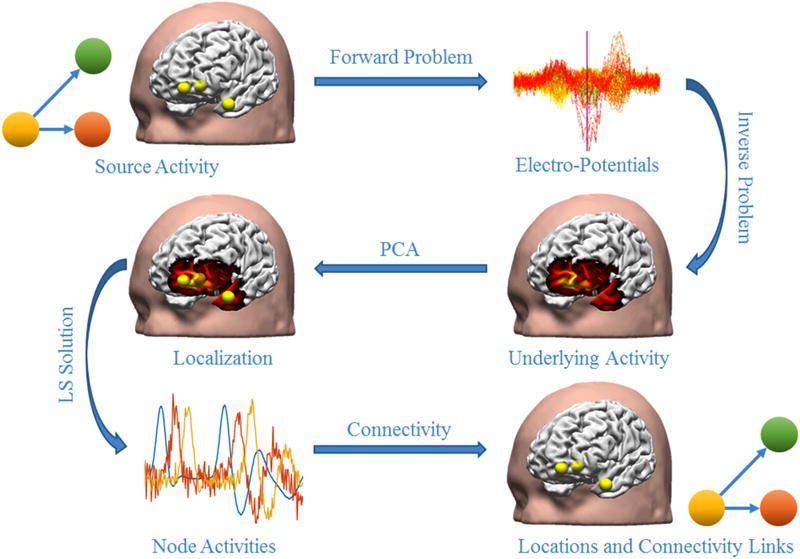
Computer simulations were conducted to test the hypothesis that applying ESI to intra-cranial recordings will produce more accurate results for deep brain activity. To give an overview of the whole procedure, we start by explaining how the EEG and sEEG electrodes were positioned; a standard 128-channel EEG cap was used for simulating scalp recordings. The head model used in this study was the Montreal Neurological Institute Colin brain (Holmes et al., 1998). Ten electrode shanks each containing 13 electrode contacts were manually positioned in regions located in the left frontal and temporal lobes. The positioning of these electrodes was based on a real epileptic patient undergoing a sEEG study, adapted from a study performed by Nobili and colleagues (Nobili et al., 2006). To model the head volume conductor, a boundary element method (BEM) model (Hamalainen and Sarvas, 1989; He et al., 1987) was used for EEG simulations, consisting of three layers modelling the scalp, the skull and the brain with electrical conductivities of 0.33 S/m, 0.0165 S/m and 0.33 S/m, respectively (Lai et al., 2005; Oostendorp et al., 2000; Zhang et al., 2006b). An infinitely homogeneous model was used for sEEG simulations with a connectivity of 0.33 S/m. Computer simulations were performed using 500 different cortical source configurations. Two network configurations were modeled and tested in these simulations. One configuration consisted of networks with a single node (250 cases) and another configuration where networks had three nodes (250 cases). The simulated sources were modeled as point dipoles and placed randomly on the cortex with a fixed orientation, perpendicular to the cortical surface. The activities of the nodes in the 3-node source configuration were co-dependent and one node was chosen as the central node to drive and control the activities of the other two nodes through a multi-variate autoregressive (MVAR) model (Eq. 1). The forward problem was then solved to obtain the potentials sensed by the scalp EEG and iEEG electrodes. In order to study the effect of noise on the process of estimating underlying brain networks, two noise models were used; an additive white Gaussian noise or an additive colored Gaussian noise. Different grid sizes were used for modeling the forward and inverse lead field matrices (1mm and 2.5 mm equivalent to a total of ~131,000 and ~28,000 voxels, respectively). The noisy maps were then used to solve the inverse problem using the standardized low resolution electromagnetic tomography (sLORETA) (Pascual-Marqui, 2002) to estimate the underlying activities. The results of the inverse problem which are spatio-temporal distributions showing the activity of different brain regions over time, were then processed using a principal component analysis (PCA) technique to localize major nodes of activity among all source locations (to identify the location of the single node or the three nodes within the underlying networks). The PCA algorithm is efficient in separating incoherent components (Wold et al., 1987). While the simulated sources are constructed through an MVAR model, the spatial separation of the simulated networks creates a distinct spatio-temporal pattern in the dipole source, which enables the PCA to determine the nodes of the network efficiently (Sohrabpour et al., 2016b). The location of the recovered major nodes of activity is then compared to the simulated nodes. A causality and connectivity analysis was further conducted on the time course of activity extracted from the estimated network nodes to determine how they are interconnected and driving each other. To this end, the dimension of the problem was primarily reduced to only include node locations estimated from the PCA algorithm to only extract time course activity of the major nodes. Then, a further step was taken to solve the inverse problem again using a least square (LS) operator on the mentioned reduced size problem. The goal of the aforementioned step was to generate more accurate time course of the underlying activities, to later feed as input into the connectivity analysis (Sohrabpour et al., 2016b). A measure of connectivity error was also used (detailed explanations to follow) to make a comparison between recovered inter-nodal connectivity and those of the original simulated network. Fig. 1 provides an overview of the simulation procedure.
Figure 1. An overview of the simulation procedures.
After EEG electrodes and iEEG electrodes are placed within a realistic head geometry, the location of the network nodes is randomly selected and a connectivity link is created among these nodes based on MVAR models (here node 1 is driving nodes 2 and 3). Then the forward problem is solved to calculate the potentials at the electrodes and noise (AWGN and ACGN) is added to these simulated potentials. The inverse problem is then solved and PCA is performed on the estimated source activities to determine the location of the simulated network nodes. Consequently, the activity of these nodes over time is extracted. These activities are then used to detect the connectivity links among the mentioned nodes.
2.1 Electrode setup
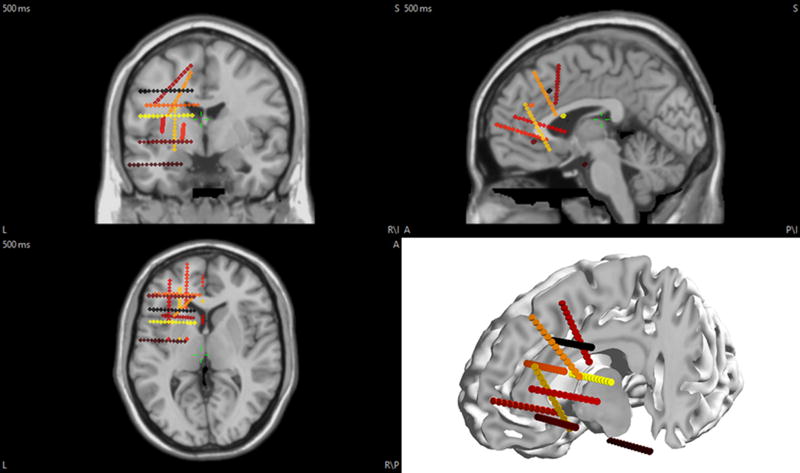
The EEG electrodes were positioned on the scalp based on a 128-channel configuration (similar to a BioSemi electrode cap). Unlike scalp EEG, sEEG does not benefit from any standardized technique to implant the electrodes in the brain tissue as it varies from case to case and patient to patient. Thus, electrode placement for sEEG is individualized and subject-dependent. Implantation strategy involves the preimplantation hypothesis that takes into consideration the visible lesions in patient’s anatomical images such as magnetic resonance imaging (MRI) images, the more likely structure(s) of ictal onset, the early and late spread regions and the interactions with the functional networks (Alomar et al., 2016). Therefore, an adequate number of recording channels is required to have an informative sEEG system. On the other hand, excessive number of electrodes could increase the risks and expenses associated with implantation. It is usually rare to have more than 15 deep shanks implanted in the brain tissue (Alomar et al., 2016). Based on these considerations, we have simulated 10 sEEG electrode shanks mostly in the left frontal lobe and part of the left temporal lobe, following an example presented in (Nobili et al. 2006). Each shank consists of 13 contacts with a constant inter-contact distance of 3.5 mm. There is a typical distance of 3.5 mm between the centers of adjacent contacts on a sEEG electrode shank, which justifies our choice of electrode spacing. Fig. 2 illustrates the sEEG electrode shanks used in the present simulation study.
Figure 2. The position of the electrodes in the brain for this study.
EEG electrodes are on the scalp (not shown here), while sEEG electrodes are inside the brain tissue in the left frontal lobe and part of the left temporal lobe.
2.2 Source activity
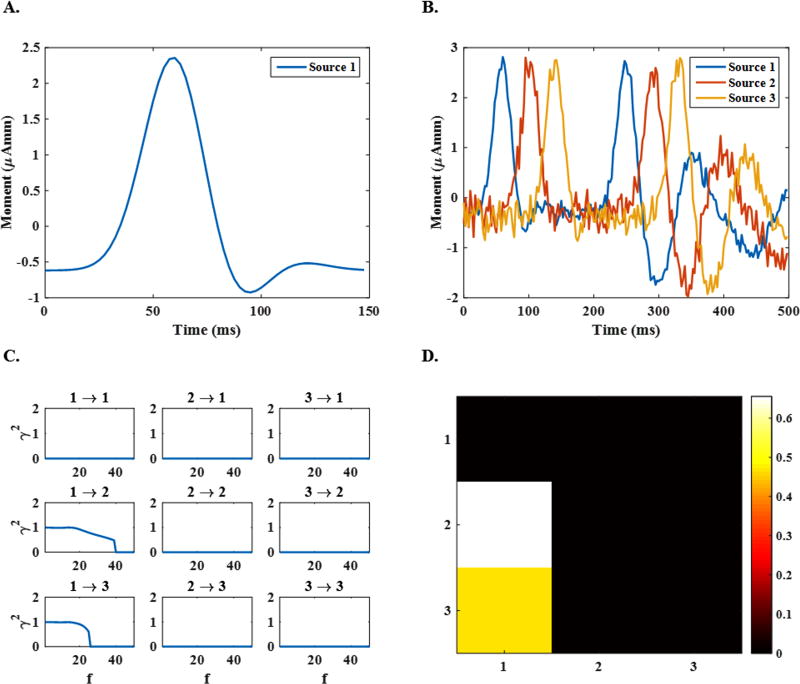
The location of the aforementioned sources was chosen randomly to be on the cortex within a distance of 3 to 30 mm from sEEG electrodes. The rationale behind this simulation setting is that sEEG electrodes are inserted in the areas with a higher probability of activities and thus are closer to underlying sources. It should be noted that with this choice of source location, the simulated sources can still be situated in deep regions such as the thalamus. To mimic the behavior of a realistic inter-ictal spike, a time course activity was constructed by summing eight Gaussian time courses (see Fig. 3 (A)) with an equivalent sampling frequency of 400 Hz. Although the assumption of a single dominant source was suggested to be reasonable in modeling epileptic activity in some cases (Koessler et al., 2010), it may not be enough for all epilepsy cases. In a second attempt, 250 three-node source configurations were simulated to more realistically model epileptic activity. To this end, the general criteria of setting locations, orientations and frequency remained the same as the single-node sources. The time course of activity assigned to each node (see Fig. 3 (B)) was generated through the MVAR model presented here:
Figure 3. The configuration of the simulated networks.
(A) The time course assigned to the dipole in single-node sources, (B) the time courses assigned to dipoles in 3-node sources, (C) the connectivity links between nodes recovered by directed transfer function (DTF) at different frequencies in the range 1–50 Hz and (D) the recovered connectivity links averaged over all frequencies in the mentioned range.
In the model above, the first node is the central node, which controls the activity of the other two nodes, mimicking seizure onset in focal epilepsy. The activity of this node is driven by the Gaussian waveform (Φ(t)) which models the inter-ictal spike activity. The directed transfer function (DTF) values of the estimated networks were then calculated to perform the Granger causality analysis (Ding et al., 2007; Granger, 1980; Kamiński et al., 2001; Kaminski and Blinowska, 1991). The statistical significance of the obtained DTF values was validated by a surrogating scheme, where surrogate time series with random phase were generated based on the estimated time series1 (Palus and Hoyer, 1998; Theiler et al., 1992).The DTF values were recalculated from these surrogate time series and served as a comparison to determine if the original calculated DTF values are statistically significant or not (Ding et al., 2007; Lu et al., 2012; Wilke et al., 2008). As it can be observed in Fig. 3 (C), the strength of connectivity links changes as a function of frequency depending on spectral properties determined by the MVAR model (Kaminski and Blinowska, 1991). The outputs of the connectivity analysis can be averaged over different frequency bands to obtain a two-dimensional connectivity matrix as in Fig. 3 (D). It should be mentioned that while MVAR parameters dictate how sources are activated and consequently how they interact with each other, we have observed that slightly changing the parameters would not change the whole connectivity links significantly. The methodological framework could be applied to any MVAR model regardless, and qualitatively no major difference is expected.
2.3 Forward problem
Neuronal activities inside the brain can be modeled as current densities (He and Ding, 2013; He and Lian, 2005). According to this model, a dipole is assigned to each voxel with components along different Cartesian axes x̂, ŷ and ẑ. The forward problem establishes the relation between the dipole current density and the potentials at the electrodes. It can be reasonably assumed that this relation is instantaneous and linear as the Maxwell’s equations are being solved in a quasi-static regime (Malmivuo and Plonsey, 1995). More specifically, it can be shown that
| (2) |
where ne and nv are the number of electrodes and voxels respectively, J(3nv)×1 is the current density vector at each voxel, Kne×(3nv) is called the lead field matrix, Φne×1 is the vector of generated or recorded potentials and Nne×1 models measurement noise. In this study, two noise models are considered for both scalp and intracranial measurements. First, additive white Gaussian noise (AWGN) which models measurement noise and additive colored Gaussian noise (ACGN) which models the background neuronal activities as well as the measurement noise. To generate ACGN, a source of white Gaussian noise was assumed at every voxel, which was then projected onto the electrodes (by solving the forward problem) to form a correlated noise at the electrodes, which we refer to as the colored noise. Both the additive white noise at electrode level and the background source-space noise were used (with equal power at the electrodes) to create the ACGN noise model. The obtained noise (in AWGN or ACGN) was then scaled to get either a 5 or 20 dB signal to noise ratio (SNR) at the electrodes. SNR in this study is defined as the ratio of the average signal power (over channels and over time) over average noise power (expressed in a log-scale, hence the dB). It should also be emphasized that in the figures where the results of combined EEG and sEEG electrodes are presented, the same background activity is used (to model background noise in sEEG and EEG). In the combined sEEG and EEG simulations, the SNR level at the sEEG was set to 20dB (the white and colored noise were present at the sEEG electrodes with equal power). For EEG, however, white noise was added in such a manner to achieve a total SNR of 5 dB, since the same background noise was used for EEG and sEEG (thus the power of white and colored noise present in EEG electrodes were not equal for combined simulation cases).
2.4 Inverse problem
The term ESI is used to denote the procedure of recovering underlying source activities from sets of electromagnetic measurements. In other words, ESI aims at finding current density vector J by using the potential vector Φ. Since the number of the knowns in the inverse problem is generally much less than the number of the unknowns (less electrodes than dipoles), ESI is an underdetermined inverse problem, and has to be regularized (He and Lian, 2005). Regularization is imposing an extra condition over the solution, which enforces some constraints on the solution based on some a priori information. In this study, a Tikhonov regularization technique was used to regularize the inverse problem (Bauer and Lukas, 2011; Hansen, 1994; He and Lian, 2005). Mathematically speaking, the following optimization problem was solved to obtain the solution:
| (3) |
where Σ is the covariance matrix of the noise estimated from baseline or noise-dominated segments, (Φ−KJ)T Σ−1 (Φ−KJ) is called the fitting term and determines how well the obtained solution can generate the recorded potentials, λ is the regularization parameter ∥J∥2 and is the regularization term. To obtain more stable solutions, only the diagonal elements of Σ were kept. The covariance matrix can also be approximated with a unity matrix of appropriate size, if the baseline is not available (Engemann and Gramfort, 2015). However, when recordings are contaminated with different levels of noise (similar to the case of combined EEG and iEEG), estimating Σ from baseline improves results significantly. This fact can be demonstrated in the following formulation:
| (4) |
where N is the noise vector. In other words, the matrix is used to whiten the noise. The inverse problem is then solved using the covariance matrix of the whitened noise, which is now a unity matrix. The regularization parameter λ makes a balance between our a priori knowledge about the solution (regularization term) and what measurements bring in (fitting term). There are various types of regularization parameter selection techniques such as the L-curve (LCV), generalized cross validation (GCV) and discrepancy principle (DCP) (Hansen, 1994; He and Lian, 2005). Unfortunately, a single parameter selection technique with universally optimal performance does not exist. A selected technique’s performance may change from problem to problem and from condition to condition (Bauer and Lukas, 2011). We have observed that for the problem in this study, DCP outperforms the other two methods (see Figure S1 in the Supplementary Material), thus, it was used as a method for selecting λ in the rest of this study. Note that λ could be estimated either at each time point or once for an interval of interest. Since the former is more time consuming, λ was estimated based on the time point at which maximum SNR was achieved (at peak time). After current density vectors at different time points were obtained, a further step was taken and the solution was standardized according to the covariance matrix of the estimated current density vector (Pascual-Marqui, 2002). This technique is known as sLORETA in the literature. Finally, it is necessary to mention that to accelerate the recovery procedure, only the initial 200 ms of the solutions were used to localize the network nodes.
2.5 Source localization
Although monitoring the dynamics of the whole brain can be useful in understanding its networks, finding major active regions in the brain provides valuable information. To find these foci of activity, we followed a procedure based on PCA (Sohrabpour et al., 2016b). The outputs of the inverse algorithm were input to the PCA unit. After taking the principal components, only one component was kept in single-node sources and three components were kept in 3-node sources. This can be justified based on the fact that the singular values of the recordings generally demonstrate either one or three dominant singular values corresponding to the two simulated network configurations. The source locations with locally higher activities in the selected principal components are reasonable candidates for dominant sources, and thus the network node. Once these local maxima were found, the algorithm did not look for any other local maxima near such locations. The reason for such a strategy is twofold. Firstly, the activity of a single active node can leak to multiple components (in the PCA), and secondly, at each component the location might be jittered to slightly different positions in the vicinity of the local maxima while still pertaining to the same location. In this study, a radius of 12.5 mm was chosen as the threshold (to avoid selecting the same nodes multiple times in different components). The recovered nodes were then matched up with original ones using the Hungarian assignment algorithm (Kuhn, 1955). Consequently, the localization errors were calculated in terms of Euclidian distance, based on this matching.
2.6 Connectivity analysis
In order to investigate the ability of the imaging algorithm in identifying brain networks, a connectivity analysis technique was applied to the temporal activities of dominant nodes (He et al., 2011a). In order to further improve the accuracy of the estimated time courses, the inverse problem was solved again (after the initial attempt, which determines nodes of major activity) only for the dipoles located at the identified nodes (from the PCA process). Effectively, such a procedure downsizes the problem to estimating activity at nodes of interest and major activity. The results of the inverse problem are basically dipole moments (volume vector) along the x̂, ŷ and ẑ axis. To use them as inputs for connectivity analysis, one can simply calculate the amplitude of each dipole (norm 2 of the components along each axis). However, the information about the polarity will be lost in this manner (dipoles pointing inward and outward). To maintain the aforementioned information, which is particularly important in connectivity assessment using Granger causality, and to make the time series more compatible with the true time series (simulated), the polarity information was included in the amplitude. This was achieved by considering the angle between the dipole’s orientation at each time point and its orientation at the time of the maximum activity. In simple words, the orientation of the dipole at peak time was set as the reference. Whenever the angle between a node’s orientation and its reference orientation rose to more than 90 degrees, a negative polarity was assigned to its amplitude at that time point and a positive polarity otherwise. The revised time series were then used for connectivity analysis and calculation of DTF values. The Frobenius matrix norm of the difference between the recovered and the original connectivity matrices was calculated to measure the degree of similarity between estimated and simulated networks.
3 Results
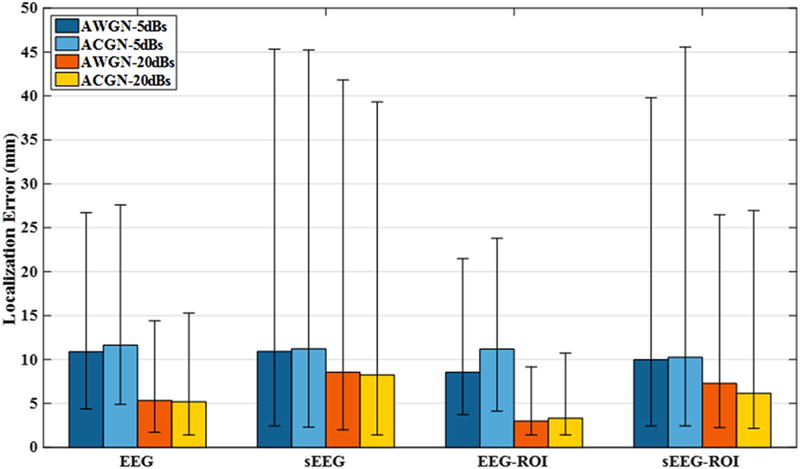
Fig. 4 depicts the median localization error from EEG and sEEG for the 3-node source configurations. While we could use standard deviations to present the uncertainties, we decided to report the second and third quartiles of data as error bars (throughout the figures presented in this paper), as, it is more consistent with our report of median for localization error. When solving for the inverse solution two approaches were considered. First, all the grids on the cortex were considered equally probable candidates of being active nodes. In the second scenario, we used only the cortical locations lying in the space residing within the distance of 3 to 30 mm away from sEEG electrodes. This is the space, from which original source nodes were randomly chosen. Although the second scenario, which is denoted by ROI (region of interest) in Fig. 4, may result in a more accurate source localization, we do not report the results of this method in the figures presented afterwards, as it was observed that such an approach did not improve results much. Additionally, such an a priori knowledge is not generally available and one of the purposes of ESI is to estimate source location (not to assume it). Fig. 4 also suggests that imaging using EEG recordings is more accurate than sEEG. Although this is generally true, we will later show that under some conditions, sEEG can do better than EEG. However, a combination of sEEG and EEG will always outperform using each modality, individually.
Figure 4. Median localization error for 3-node network configurations.
Error bars refer to the first and third quartiles (of localization error distribution). Two noise types, namely, additive white Gaussian noise (AWGN) and additive colored Gaussian noise (ACGN) with SNRs of 5 dB and 20 dB are simulated. The simulations are repeated for both EEG and sEEG electrodes and with a region of interest (ROI) assumption (refer to section 2 for more details). As it can be seen, the ROI assumption can improve the source localization, however it requires some extra information, which is not generally available.
3.1 Source localization
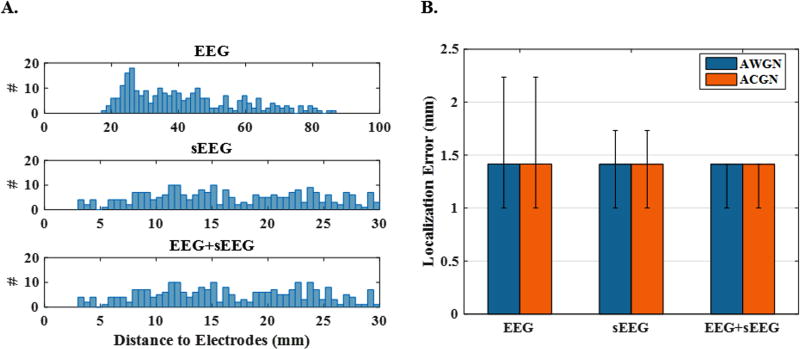
In Fig. 5, localization error for 250 single-node network configurations using EEG only electrodes, sEEG only electrodes and a combination of both (denoted as EEG+sEEG) is compared. Fig. 5 (A) demonstrates the histogram of minimum source-to-electrode distance in each modality. In other words, while each source is in a certain distance from each electrode, we report the distance to the nearest electrode. For the combined EEG+sEEG scheme, we have both scalp and intracranial electrodes in the brain. Since scalp EEG electrodes are generally further away from sources, we expect the nearest electrodes to be among the intracranial electrodes. Thus, the minimum distance range (or the horizontal axis values) are very similar to the sEEG scheme. In Fig. 5 (B), the median localization error (with the first and third quartiles presented as error bars) are reported. Since signals need to pass through skull and skin to reach the scalp EEG electrodes, it is expected for these signals to be subject to more severe noise (in terms of SNR) compared to sEEG. Therefore, in Fig. 5 (B) and all the figures hereafter, we have assumed an SNR of 5 dB for EEG signals recorded at scalp electrodes and 20 dB for sEEG signals recorded at deep electrodes. It should be emphasized that these settings were also applied to the EEG+sEEG setup. Besides, to generate ACGN, the same background activity has been simulated for both EEG and sEEG in all the figures to follow. As it can be seen in Fig. 5 (B), small error was perceived for EEG with greater variance, though, it should be mentioned that the sources were further away from EEG electrodes than sEEG electrodes and thus the signals recorded at the EEG electrodes were inherently weaker. However, source localization is generally less sensitive to the noise (including its level and type) in this case. This is due to the fact that single sources of activity can be detected pretty well and some previous literature (Pascual-Marqui, 2002; Pascual-Marqui et al., 1994) have claimed almost perfect results as also confirmed in this work.
Figure 5. Localization error and histogram of source distance to electrodes for 1-node networks.
(A) The histogram of the source-to-nearest electrode distance for 250 single-node sources in the three recording schemes EEG, sEEG and EEG+sEEG. It is obvious that sources are generally further away from EEG electrodes. (B) The median localization error for the same source configurations and for white (AWGN) and colored (ACGN) noise. EEG recordings are subject to the noise with an SNR of 5 dB, while this is 20 dB for sEEG. These values are maintained in the combined version (EEG+sEEG), as well.
Fig. 6 (A) shows the simulated electrical potential recordings for a single 3-node source configuration in both EEG and sEEG setups. As the figure indicates, there are stronger spikes in sEEG recordings. This is because the sources can be close to the electrodes in sEEG. Although this is an advantage for closer nodes, it can mask the activity of nodes situated further away from sEEG electrodes (this will be further discussed in section 4). In Fig. 6 (B), the recovered activity using EEG+sEEG recordings is shown. By comparing the recovered time-courses to the simulated time-courses in Fig. 3 (B), it can be observed that the time courses for each active node are recovered accurately. Besides, the connectivity links estimated are identical to simulated networks, in the presented example (compare these to original connectivity links presented in Fig. 3 (D)).
Figure 6. An example of a 3-node network.
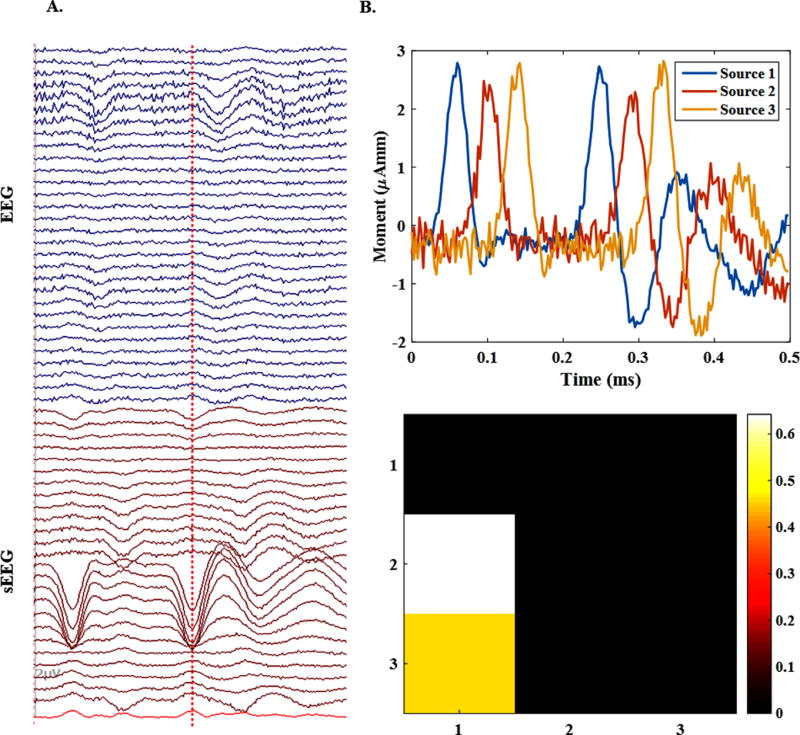
(A) The simulated electrical potential recordings for a single 3-node source configuration in both EEG and sEEG setups. sEEG contains stronger spikes than EEG. (B) The accuracy of the source imaging for the same source using EEG+sEEG recordings. It can be seen that the time courses for each active node of the source are recovered precisely. Besides, the connectivity links are identified truly in the sense that source 1 is driving sources 2 and 3, as expected.
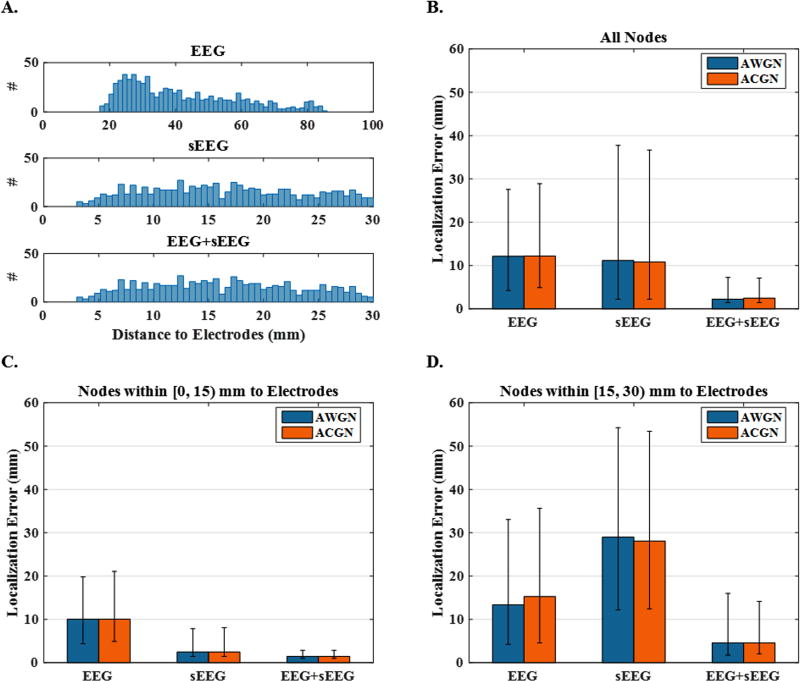
Fig. 7 provides a statistical inference of the localization error with respect to distance, for the three node network configurations (250 cases). In Fig. 7 (A), the histogram of the distances between active nodes and the nearest electrode to each source is shown. This figure indicates how nodes are distributed in each different electrode setup, i.e. EEG, sEEG or EEG+sEEG. Fig. 7 (B) plots the median localization errors using EEG, sEEG and EEG+sEEG recordings under AWGN and ACGN noise conditions. While the colored noise models can generally impact source imaging more negatively, this plot implies that once noise covariance is dealt with appropriately, results of ACGN contaminated source imaging is as good as AWGN contaminated source imaging results. This plot also indicates that in spite of nodes being closer to sEEG electrodes, EEG-based localization yields even more accuracy generally. However, this is not true for the sufficiently close sources (within ~ 15mm of sEEG electrodes). The next two plots (C and D) show that for the sources that lie within the distance of 0–15 mm from an sEEG electrode, using sEEG recordings can reduce the localization error significantly, as compared to EEG. However, for the sources located more than 15 mm away, the localization error increases very steeply. Note that distances reported in these two plots, are based on sEEG electrodes not EEG (the distance between sources and the closest sEEG electrode). Besides, it can be seen that combining EEG and sEEG reduces the localization error significantly in all cases.
Figure 7. Localization error and histogram of source distance to electrodes for 3-node networks.
(A) The histogram of the distances between active nodes and the nearest electrode to them. This figure depicts the results of different electrode set-ups, i.e., EEG, sEEG and EEG+sEEG. (B) The median localization errors using EEG, sEEG and EEG+sEEG recordings under AWGN and ACGN noisy conditions. (C and D) The same plot only for the sources that lie within a distance of 0–15 mm and 15–30 mm from sEEG electrodes, respectively.
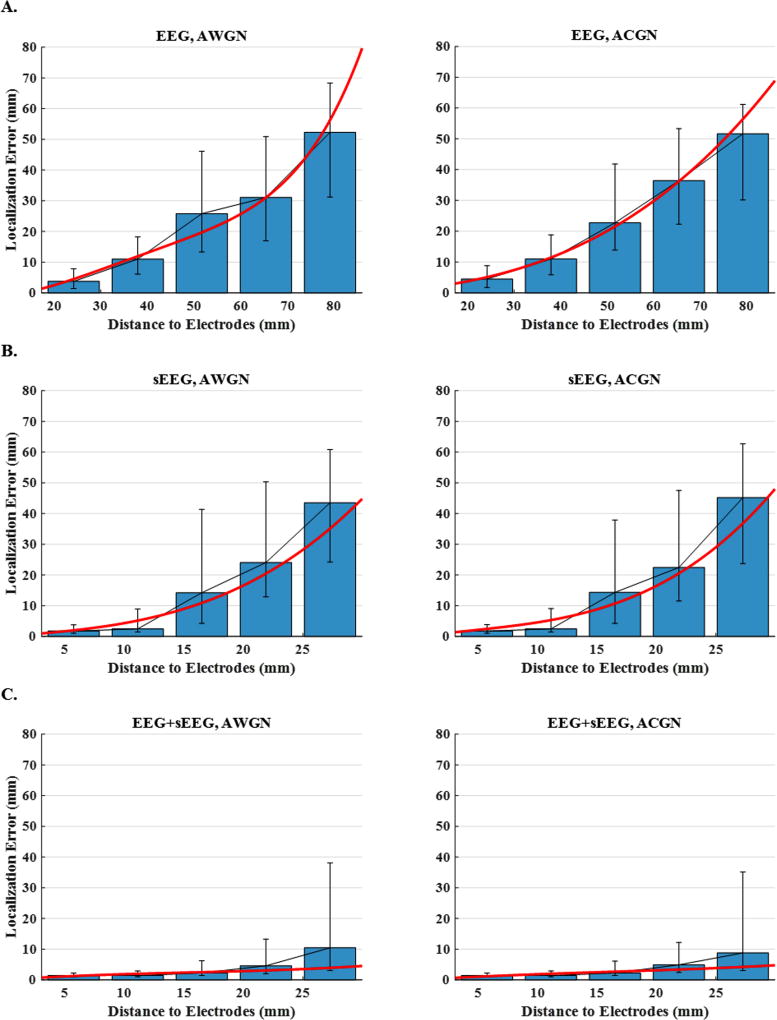
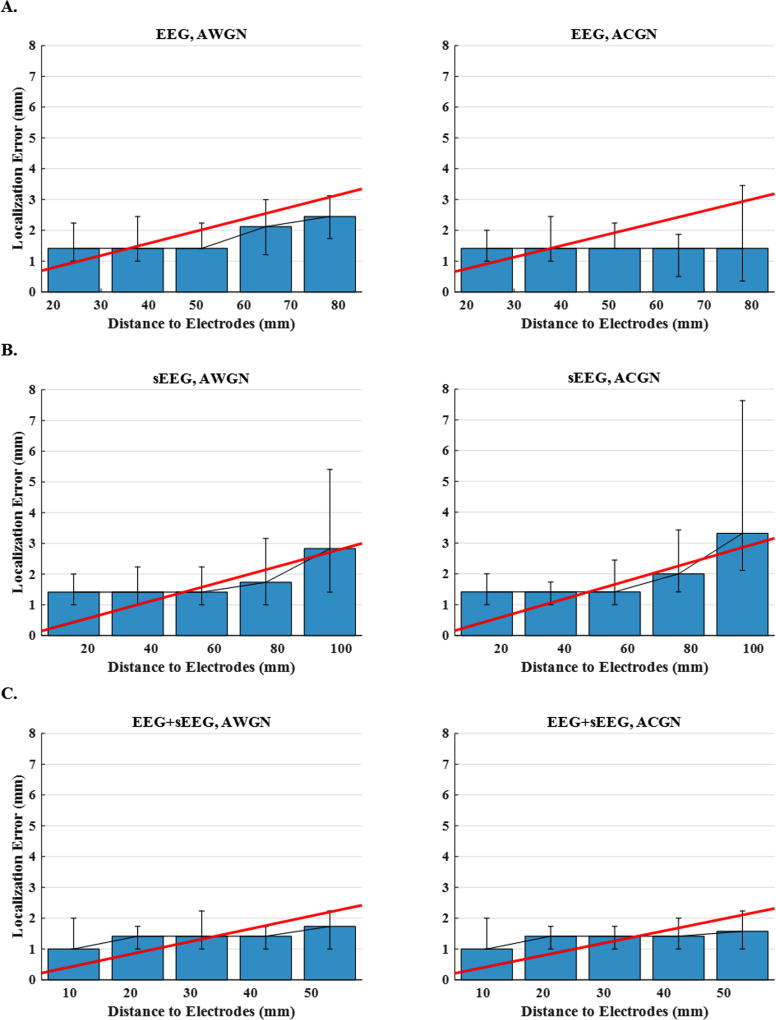
Fig. 8 depicts the localization error as a function of distance for the same data as in Fig. 7. The plots display the median localization errors over five intervals (distance to the nearest electrode) for EEG, sEEG and EEG+sEEG schemes and for AWGN and ACGN noise types. In order to observe the trend more clearly, the scattered points are regressed with a polynomial of a degree determined using cross validation. Multiple observations can be made; first, the nodes are generally further away from EEG electrodes. This is a unique feature that sEEG electrodes have, as they are placed deep in the brain, supposedly closer to underlying sources. The second observation is that, source localization using sEEG recordings can be more accurate than EEG-based localization, if the active nodes are close enough to the electrodes (<15 mm). The bar plots and the fitted regression lines for sEEG suggest that localization error grows very fast for nodes situated further away (>15 mm). This demonstrates the high sensitivity of the sEEG-based imaging to source distance from electrode location. The third and the most important observation of this figure is that combining EEG and sEEG (EEG+sEEG) improves the source localization accuracy significantly on one hand and reduces the sensitivity to distance on the other. It seems that by combining EEG and sEEG, one can make a recording paradigm which benefits from the strengths of both modalities.
Figure 8. Localization error versus distance to electrodes for 3-node network configurations.
The plots display the median localization errors over five intervals (distance to the nearest electrode) for (A) EEG, (B) sEEG and (C) EEG+sEEG schemes and for AWGN and ACGN noise types. In order to make the trends more detectable, the scattered points are regressed with a polynomial of a degree determined by cross validation.
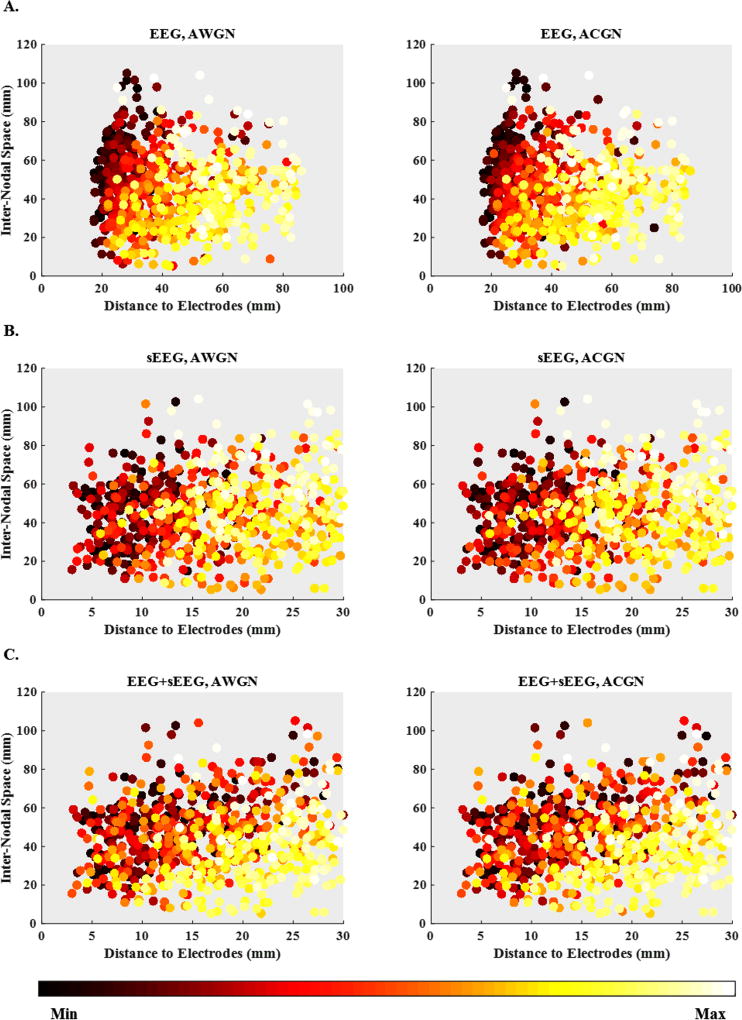
Generally, if the active nodes of a source configuration are closer to each other, their activities are more likely to interfere with each other (orientation of sources also plays an important role). To assess the effect of distance from electrodes and inter-nodal space on the localization accuracy, Fig. 9 depicts a set of 3D scatter plots. The horizontal axis in all the subplots of this figure is the distance from electrodes, while the vertical axis measures the distance of each node from the nearest other active nodes. In this figure, lighter colors imply higher localization errors, while darker colors denote lower errors. As it can be seen, the general trend is high localization errors at the lower right corner of the plots (higher node-to-electrode distance and lower inter-nodal space) to the low errors at the upper left corners (lower node-to-electrode distance and higher inter-nodal space). Therefore, the closer the active nodes are to the electrodes and the further they are from each other, the more accurate is the source localization.
Figure 9. Localization error scatter plots.
Localization error scatter plots versus distance to electrodes and inter-nodal space for (A) EEG, (B) sEEG and (C) EEG+sEEG recording set-ups under AWGN and ACGN noisy conditions. The horizontal axis and the vertical axis are respectively, the distance to electrodes for every single node and the distance to the nearest other active nodes in the same source configuration (inter-nodal space). The localization errors, the third axis (not shown), are represented with colors.
3.2 Connectivity analysis
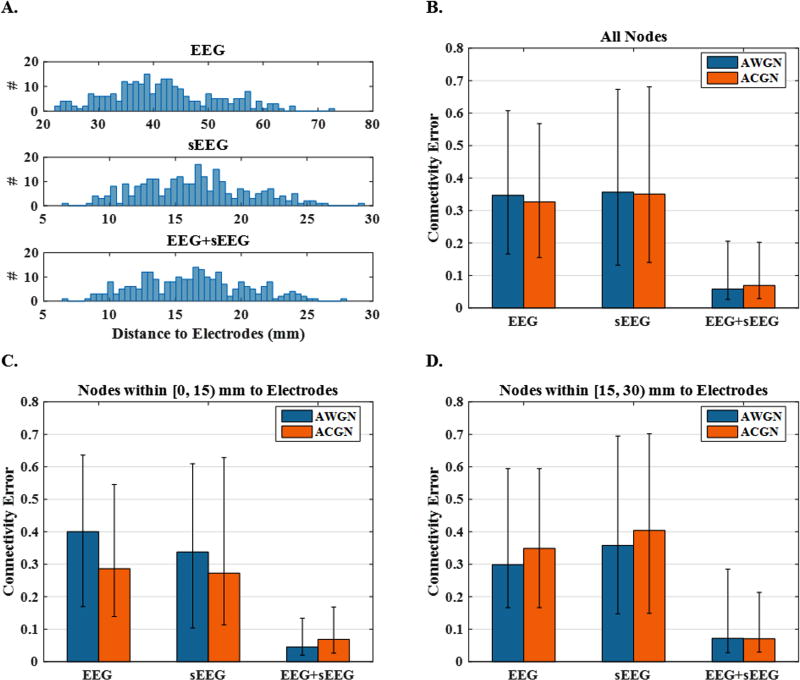
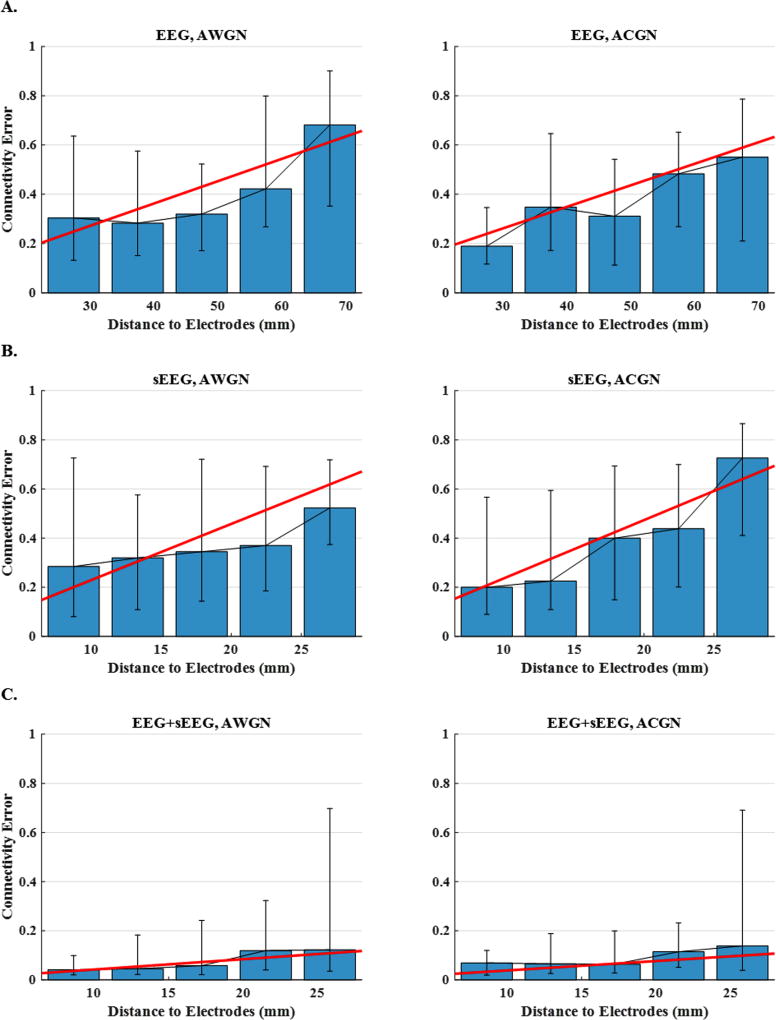
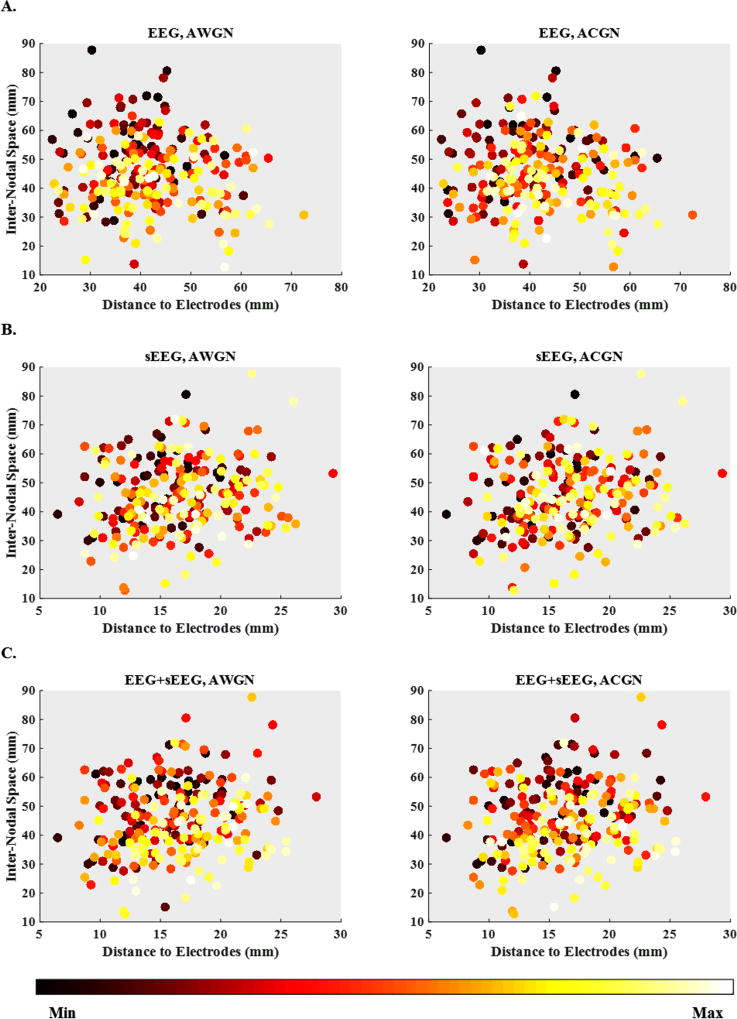
In order to further evaluate the source imaging performance and investigate its ability in identifying brain networks, connectivity links were analyzed, as explained in section 2. Fig. 10, Fig. 11 and Fig. 12, which are in parallel with Fig. 7, Fig. 8 and Fig. 9, focus on connectivity error rather than localization error as the measure of performance. In these figures, distance is defined for the whole source configuration. To this end, we simply averaged the node-to-nearest-electrode distances for all the active nodes in the network to obtain a single distance measure for each case. Same approach was followed to define a single inter-nodal space for every network, i.e. by averaging the inter-nodal distances of all the nodes in a network. Connectivity analysis is not possible for the cases where two nodes are missed, but if only a single node is lost, it is still possible to match them with the corresponding two nodes in the simulated network and compare the relevant links. Fig. 10 provides statistical analysis of the connectivity errors. Based on the data presented in this figure, it is observed that connectivity analysis based on EEG+sEEG recordings can improve the accuracy significantly as compared to only EEG or only sEEG based source imaging. The bar plots of Fig. 11 suggest that although the connectivity error increases with increasing distance, its overall trend is not similar to the localization error trend observed in Fig. 8. In other words, it seems that while the dependency of the connectivity error on distance is not zero, it still is much less than the dependency of localization error on distance. This phenomenon is also observed for inter-nodal space in Fig. 12.
Figure 10. Connectivity error and histogram of source distance to electrodes for 3-node networks.
(A) The histogram of the average distances between active nodes and the nearest electrode to them. This figure depicts results of different electrode set-ups, i.e., EEG, sEEG and EEG+sEEG. (B) The median connectivity errors using EEG, sEEG and EEG+sEEG recordings under AWGN and ACGN noisy condition. (C and D) The same plot only for the sources that lie within a distance of 0–15 mm and 15–30 mm from sEEG electrodes respectively.
Figure 11. Connectivity error versus distance to electrodes for 3-node network configurations.
The plots display the median connectivity errors over five intervals (average distance to the nearest electrode) for (A) EEG, (B) sEEG and (C) EEG+sEEG set-ups and for AWGN and ACGN noise types. In order to make the trends easier to detect, the scattered points are regressed with a line.
Figure 12. Connectivity error scatter plots.
Connectivity error scatter plots versus distance to electrodes and inter-nodal space for (A) EEG, (B) sEEG and (C) EEG+sEEG recording schemes under AWGN and ACGN noisy conditions. The horizontal axis and the vertical axis are respectively, the average distance to electrodes for every single node and the average inter-nodal space in the same source configuration. The connectivity errors, the third axis (not shown), are represented with colors.
Based on the results provided so far, distance of ~15mm seems to be a break point for recovering nodes in 3-node networks using sEEG recordings. This shows that the choice of 30mm as the maximum distance between sources and sEEG electrodes has been sufficiently large. However, it is still interesting to observe how increasing the distance between sources and electrodes can affect the performance of imaging for single-node configurations. Fig. 13, which is in parallel with Fig. 8 except that 250 single-node sources are distributed over the entire brain, shows that both EEG and sEEG are quite successful in localizing single dominant activities regardless of their distance to the recording sites. According to this figure, the median of localization error is less than 4mm in all schemes and for all distances.
Figure 13. Localization error versus distance to sEEG electrodes for sources distributed over the entire brain.
The plots display the median localization errors over five ranges intervals (distance to the nearest electrode) for (A) EEG, (B) sEEG and (C) EEG+sEEG schemes and for AWGN and ACGN noise types. In order to make the trends more detectable, the scattered points are regressed with a line.
3.3 DBS Electrode Leads
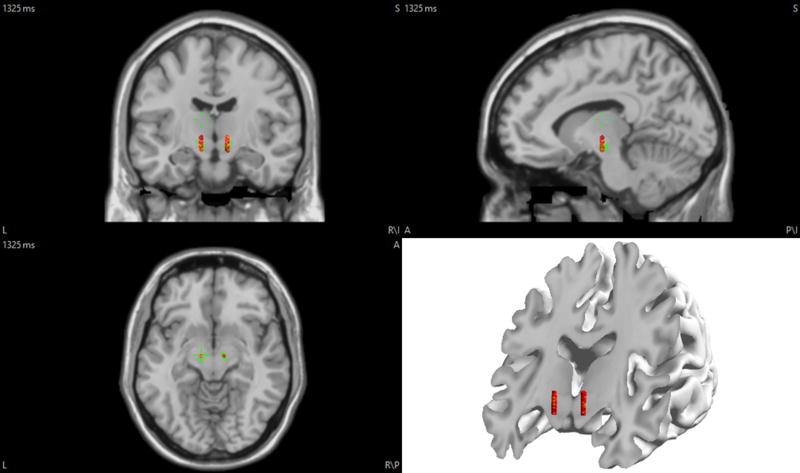
The implantation of DBS (deep brain stimulation) electrodes in the brain for Parkinson’s disease and other brain disorders such as epilepsy, indicates that long term implantation of deep electrodes is clinically applicable (Benabid et al., 2009; Fisher et al., 2010; Johnson et al., 2013). DBS electrodes, which were once used for stimulation only, are now capable of recording and stimulating concurrently. Therefore, we previously proposed to perform source localization on DBS electrode recordings (Sohrabpour and He, 2015). While DBS electrodes are capable of being implanted chronically (like in Parkinson’s disease), sEEG electrodes are used for short-term recordings to determine the seizure onset zone (SOZ). Thus, each modality is used in different settings and under different conditions; as a result, we wanted to study these two important sub-sets of iEEG recordings separately. To this end, two leads of electrodes were manually positioned in the subthalamic nucleus, which is marked with green in Fig. 14. Each lead consisted of 64 channels including 16 rows of 4 equally spaced contacts. The diameter of each lead was set to be 1.27mm spanning a length of ~12mm based on a design proposed by (Martens et al., 2011). The results for 250 single-node sources distributed over the entire brain are presented in Fig. 15. Unlike sEEG, source imaging based on DBS electrodes is more sensitive to distance from electrodes for both single (compare Figs. 13 (B) and 15 (B)) and multiple-node sources (results not included in this paper). This is because the number of DBS leads is less than sEEG shanks, which is also more limited in spatial coverage, even though the numbers of channels are almost the same for both modalities.
Figure 14. The position of the DBS electrodes in the brain.
EEG electrodes are on the scalp (not shown here), while DBS electrodes are implanted inside the brain tissue. The green area shows the subthlamic nucleus.
Figure 15. Localization error versus distance to DBS electrodes for sources distributed over the entire brain.
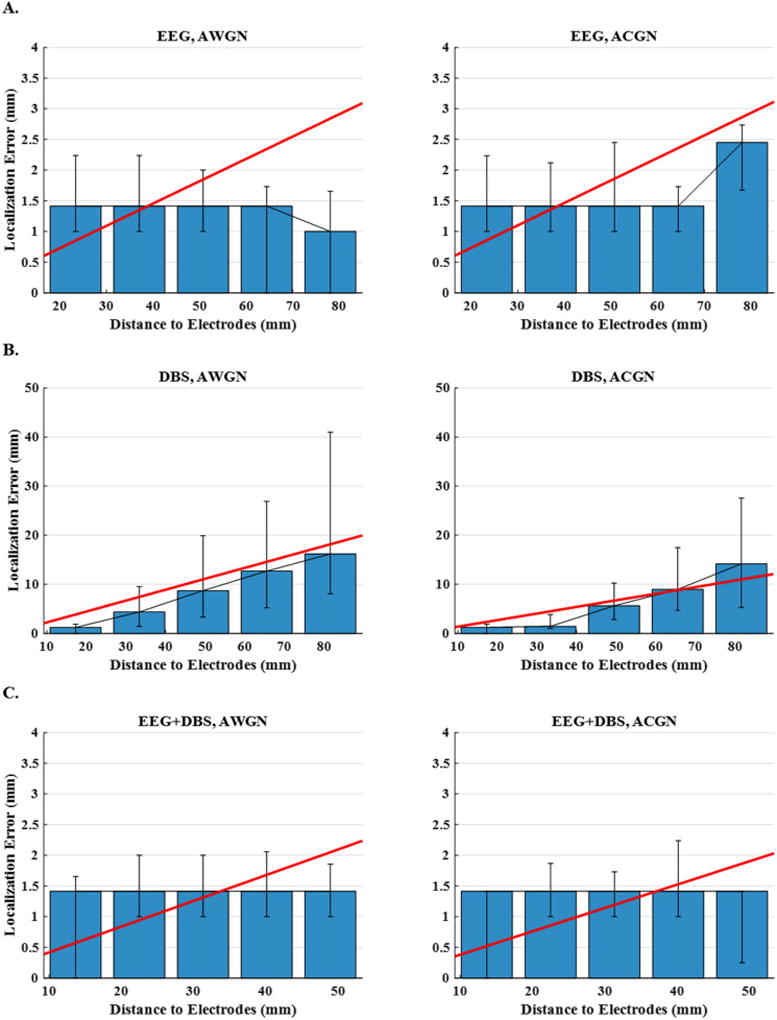
The plots display the median localization errors over five intervals (distance to the nearest electrode) for (A) EEG, (B) DBS and (C) EEG+DBS schemes and for AWGN and ACGN noise types. In order to make the trends more detectable, the scattered points are regressed with a line.
4 Discussion
We have investigated the possibility, merits and limitations of source imaging using intracranial EEG (iEEG) recordings (which includes sEEG and DBS schemes) and compared its accuracy to the results of EEG source imaging. In this work, the underlying sources were modeled as networks of inter-connected nodes of activity, and the localization error as well as the accuracy of the estimated networks in identifying connectivity patterns, were calculated to assess the performance of imaging brain networks. This feature is particularly important, since we know that physiological and pathological brain processes in the brain are thought to be network phenomenon (Bullmore and Sporns, 2009; Ding et al., 2007), specifically for epileptic activities (Mogul and van Drongelen, 2014; Oluigbo et al., 2012; Stam, 2014; Wilke et al., 2011, 2010, 2009, 2008). Besides, while most of the previous works have not been negligent about the effect of network geometry on source imaging results (Cam et al., 2017; Caune et al., 2014; Chang et al., 2005; Yvert et al., 2005), only a few of them have provided statistical analysis on how the mentioned parameters affect the accuracy (Zhang et al., 2008, 2006a). Moreover, the initial purpose in those papers has been to demonstrate the possibility of source imaging using intracranial recordings, not providing a benchmark to compare imaging based on deep recordings versus scalp recordings.
We initially placed the sources in the gray matter but finally, decided to place them on the cortical surface. Since, in this manner source orientation could be defined more easily (the source orientations were set to be perpendicular to the cortex surface). However, the results were very close in both cases. It should be noted, that this choice does not remove deep regions from the source space. To demonstrate this visually, we have prepared Figure S2, which is included in the Supplementary Material. The red spheres in this figure show the sEEG electrodes and the blue spheres show the source space from which source locations are selected. While sources are confined to the cortex, they can be very deep.
EEG is an effective tool to study the dynamics and temporal characteristics of the electrical activity in the human brain. Its high temporal resolution besides being noninvasive and easy to set up has made it among the popular techniques for human brain functional imaging. Despite the merits, EEG usually has difficulty to perform well in localizing deep brain activities due to low SNR compared to cortical source localization. When the results of EEG source imaging are not decisive enough, clinicians may opt for an invasive method such as sEEG. To the best of our knowledge, sEEG recordings are not currently used with the purpose of performing source imaging, in the clinical practice (Gavaret et al., 2009; McGonigal et al., 2007). Clinicians use the electrodes only to locally monitor the activities in the pathological regions of interest, usually pre-determined before electrode placement based on patient history and other relevant clinical data and possible imaging studies.
Imaging based on sEEG recordings share most of the major properties of EEG. The major difference, as the name may suggest, is that the electrodes are distributed in the regions with a higher probability of seizure activity rather than over the scalp. In other words, the electrodes are closer to major active nodes, which can compensate for the low coverage of deep and far-from-scalp sources in EEG. Despite this advantage, there are several reasons leading the sEEG-based imaging not to perform as well as it may seem at the first glance. Although our results indicate that, it can perform better than EEG under some conditions (if there is only a single dominant activity or if sources are close enough to the sEEG electrodes). When there are multiple active nodes in the vicinity, the nodes that are closer to the electrodes leave a much stronger impact on the recording electrodes than the further ones. Therefore, the distant sources may be totally masked by the activity of the closer sources. This is indeed the same issue as the low coverage of deep and far-from-scalp sources in EEG, which may be even more severe in this case, since some sources might be located very close to the electrodes (depending on the electrode placement and the actual location of the underlying epileptic sources). The high sensitivity to distance is the direct consequence of the mentioned issue. Our simulation results demonstrate that the threshold for the break point is around 15 mm, implying that for the active nodes, which are closer than 15 mm to the electrodes, we can expect an accurate localization. While for the nodes located further than 15 mm to the closest electrode, there is rarely any merit using sEEG recordings, for imaging purposes.
Additionally, the spatial location of the scalp EEG electrodes allows them to see the sources with a larger angle, which leads to a better coverage of the brain. Besides, the lead field matrix obtained for sEEG modality may be a worse conditioned matrix thus making it more difficult to obtain stable solutions compared to EEG. This is probably because the contacts of each electrode either collect redundant information about the source (depending on how similar their relative location and orientation with respect to the source is), or sense nothing due to far distance between source and electrode. However, the mentioned issue is highly dependent on the relative location of the electrodes, how distributed they are and how close the contacts of each electrode are to each other. Therefore, it is hard to make a general remark regarding the lead field matrix of sEEG electrodes compared to that of EEG electrodes, inexplicably. The interested readers are referred to (Bryan and Leise, 2013) for a comprehensive discussion of which properties of a sensing matrix make it more appropriate and desired, from an inverse-problem point of view.
Another important contribution of this study to the literature is that we have shown how combining EEG and iEEG can improve the functional imaging accuracy in different ways, especially for source configurations of multiple nodes. In order to solve the problem with more confidence, more constraints, equations or information about the inverse solution are desirable. The combination of EEG and iEEG, can serve this purpose by increasing the number of measurements. The combination of information from EEG and iEEG also improves the performance by reducing the number of blind spots in the brain, which are not covered by either of the setups, individually. In the new scheme, one can really hope that regions in the brain, which are considered deep, relative to some surface electrodes, are positioned closely with respect to deeply implanted electrodes and vice versa. It should be emphasized that by combing EEG and iEEG, we do not imply that EEG and iEEG recordings are measured separately and then compared to each other, but rather, we refer to a unified inverse algorithm, which incorporates EEG and iEEG recordings measured simultaneously. Fig. 7 and Fig. 10 support this claim, well. According to Fig. 7, we can expect median localization error of less than 5 mm, which seems to be quite favorable. Fig. 10 suggests that by combining EEG and sEEG, one can detect the connectivity links between network nodes much better, which is essential in studying brain networks.
In this study, we have assumed different noise levels for EEG and iEEG recordings to simulate a more realistic situation; more severe conditions for EEG recordings (5 dB SNR) and more favorable ones for iEEG recordings (20 dB SNR). While SNR can vary significantly depending on the location, orientation and strength of brain activities, one can generally expect scalp recordings to be noisier than intracranial recordings, since electrical signals need to pass through skull, skin and brain tissue to reach scalp electrodes. Moreover, since the origins of deeper activities are further away from the scalp, EEG measurements are weaker at the scalp electrodes. Since the placement of deeper electrodes (by the physician) usually suggests that epileptic sources are not superficial (most probably), in most of our simulations we have placed the sources near the iEEG electrodes and thus have adopted this lower SNR for EEG recordings. It is obvious that if sources are more superficial and closer to scalp electrodes, then the EEG signal will have a better SNR and much improved results can be achieved for EEG source imaging. We have observed in simulations that by simply changing the depth (distance to closest scalp electrode) of sources, the SNR could change by 8dB. It should be emphasized that the reported SNRs are average values and not necessarily the peak SNR. Therefore, in practice we have a range of SNR values at different times.
This study has not been limited to imaging based on sEEG recordings. The long term implantation of DBS electrodes in treatment of different brain disorders such as Parkinson’s disease and epilepsy (Benabid et al., 2009; Fisher et al., 2010; Johnson et al., 2013) and the recording capability of current DBS electrodes, poses the question of whether brain functional imaging can be improved using DBS recordings or not. Based on our study, the answer to this question depends on different factors such as the number and relative location of nodes of activity in the brain. While imaging based on DBS recordings share most of the features of an sEEG-based scheme, the fewer number of electrodes and their distribution in a smaller area can make it a more vulnerable modality against sources located further away from DBS electrodes compared to sEEG. This might be a far-field phenomenon; to a far-field observer, where sources are situated far away from DBS electrodes, all the DBS electrodes might be perceived as a single super-electrode. This is foreseeable, as the distance between DBS electrodes is less than the distance between sEEG electrodes and DBS shanks are placed near each other and not as distributed as sEEG electrodes. However, if the placement of DBS electrodes were optimized for individual patients so that they are placed near the active sources, improvement can be expected.
The significance of these results stems from the fact that detecting the epileptogenic zone plays an important role in the treatment of about one third of the epilepsy patients, who do not respond to any type of medication. Therefore, receiving surgery for removal of the epileptogenic zone could be justified for these patients. Any error in determining the epileptogenic zone may lead to either unsatisfactory surgery outcomes or lifetime irreversible side effects for the patients (Alomar et al., 2016). As already mentioned, clinicians combine the results of different imaging modalities before they finalize their decision on determining the epileptogenic zone. On the other hand, the simple use of intracranial recordings without applying ESI to it, may lead to overseeing of some active sites located further away. In these situations, combining EEG and iEEG recordings can achieve a more accurate imaging of the whole brain. Furthermore, as simulation results suggest, the sensitivity of imaging to source distance (from recording site) is reduced in the combined scheme. The conclusions regarding the combined modality can also extend to more realistic scenarios, where sources of activity are assumed to have an extent rather than being focal and encompassing just a few active nodes (Sohrabpour et al., 2016a).
Finally, head volume conduction modeling (for iEEG recordings) is one of the limitations of this work, which can be improved in future works. Currently, we have used an infinitely homogeneous model for the deep iEEG electrodes. Caune et al have demonstrated (Caune et al., 2014) that an infinitely homogeneous modeling for deep electrodes can lead into reasonable results. In spite of that, one can always expect to improve the accuracy and predictability of the simulations for real clinical data by taking into consideration the geometry and electrical conductivity of the cranial tissues in more sophisticated and realistic models such as finite element method (FEM). Additionally, by assuming point-sensing contacts, the effect of iEEG electrodes located in the medium is not considered in this study. This assumption has been made based on the fact that perturbation produced in the intracranial electric potential distributions due to the presence of the depth electrodes is negligible, if source of electrical activity is located more than 1 mm away from the electrode (von Ellenrieder et al., 2012). To comply fully with this finding, the active nodes in this study have been located such that the minimum distance from the electrodes is 3 mm. Finally, validation of the conclusions stated in this paper on real clinical data, is a natural extension of this work and the next step of this research.
Supplementary Material
Highlights.
Investigating intracranial EEG (iEEG) source imaging alone or in combination with simultaneous EEG.
iEEG source imaging pinpoints the location of sources which are near the iEEG electrodes (~15 mm).
Simultaneous EEG and iEEG source imaging can significantly improve accuracy for near and far sources.
Acknowledgments
This work was supported in part by NIH R01NS096761, R01EB021027, R01AT009263, U01HL117664, and NSF CBET-1450956 and CBET-1264782.
Footnotes
Publisher's Disclaimer: This is a PDF file of an unedited manuscript that has been accepted for publication. As a service to our customers we are providing this early version of the manuscript. The manuscript will undergo copyediting, typesetting, and review of the resulting proof before it is published in its final citable form. Please note that during the production process errors may be discovered which could affect the content, and all legal disclaimers that apply to the journal pertain.
Only when creating Fig. 3C/D where we wanted to show, as an example, that Granger causality can determine and show the intended directionality, did we use the simulated time series for the surrogating scheme. Throughout the paper and for the all our results, we have estimated the time series by solving the ESI problem, as indicated throughout the paper.
Conflict of Interest Statement
None of the authors have potential conflicts of interest to be disclosed.
References
- Alarcon G, Binnie CD, Elwes RDC, Polkey CE. Power spectrum and intracranial EEG patterns at seizure onset in partial epilepsy. Electroencephalogr. Clin. Neurophysiol. 1995;94:326–337. doi: 10.1016/0013-4694(94)00286-T. [DOI] [PubMed] [Google Scholar]
- Alomar S, Jones J, Maldonado A, Gonzalez-Martinez J. The stereo-electroencephalography methodology. Neurosurg. Clin. N. Am. 2016;27:83–95. doi: 10.1016/j.nec.2015.08.003. [DOI] [PubMed] [Google Scholar]
- Annegers JF, Hauser WA, Elveback LR. Remission of seizures and relapse in patients with epilepsy. Epilepsia. 1979;20:729–737. doi: 10.1111/j.1528-1157.1979.tb04857.x. [DOI] [PubMed] [Google Scholar]
- Bandettini PA, Wong EC, Hinks RS, Tikofsky RS, Hyde JS. Time course EPI of human brain function during task activation. Magn. Reson. Med. 1992;25:390–397. doi: 10.1002/mrm.1910250220. [DOI] [PubMed] [Google Scholar]
- Bauer F, Lukas MA. Comparing parameter choice methods for regularization of ill-posed problems. Math. Comput. Simul. 2011;81:1795–1841. [Google Scholar]
- Benabid AL, Chabardes S, Mitrofanis J, Pollak P. Deep brain stimulation of the subthalamic nucleus for the treatment of Parkinson’s disease. Lancet Neurol. 2009;8:67–81. doi: 10.1016/S1474-4422(08)70291-6. [DOI] [PubMed] [Google Scholar]
- Bryan K, Leise T. Making Do with Less: An Introduction to Compressed Sensing. SIAM Rev. 2013;55:547–566. doi: 10.1137/110837681. [DOI] [Google Scholar]
- Bullmore E, Sporns O. Complex brain networks: graph theoretical analysis of structural and functional systems. Nat. Rev. Neurosci. 2009;10:186–198. doi: 10.1038/nrn2575. [DOI] [PubMed] [Google Scholar]
- Cam SL, Ranta R, Caune V, Korats G, Koessler L, Maillard L, Louis-Dorr V. SEEG dipole source localization based on an empirical Bayesian approach taking into account forward model uncertainties. NeuroImage. 2017;153:1–15. doi: 10.1016/j.neuroimage.2017.03.030. [DOI] [PubMed] [Google Scholar]
- Caune V, Ranta R, Le Cam S, Hofmanis J, Maillard L, Koessler L, Louis-Dorr V. Evaluating dipolar source localization feasibility from intracerebral SEEG recordings. NeuroImage. 2014;98:118–133. doi: 10.1016/j.neuroimage.2014.04.058. [DOI] [PubMed] [Google Scholar]
- Chang N, Gulrajani R, Gotman J. Dipole localization using simulated intracerebral EEG. Clin. Neurophysiol. 2005;116:2707–2716. doi: 10.1016/j.clinph.2005.07.002. [DOI] [PubMed] [Google Scholar]
- Cockerell OC, Sander J, Hart YM, Shorvon SD, Johnson AL. Remission of epilepsy: results from the National General Practice Study of Epilepsy. The Lancet. 1995;346:140–144. doi: 10.1016/s0140-6736(95)91208-8. [DOI] [PubMed] [Google Scholar]
- Cohen D. Magnetoencephalography: detection of the brain’s electrical activity with a superconducting magnetometer. Science. 1972;175:664–666. doi: 10.1126/science.175.4022.664. [DOI] [PubMed] [Google Scholar]
- Ding L, Worrell GA, Lagerlund TD, He B. Ictal source analysis: localization and imaging of causal interactions in humans. Neuroimage. 2007;34:575–586. doi: 10.1016/j.neuroimage.2006.09.042. [DOI] [PMC free article] [PubMed] [Google Scholar]
- Ding M, He B. Neural Engineering. Springer; 2013. Exploring functional and causal connectivity in the brain; pp. 545–564. [Google Scholar]
- Dümpelmann M, Fell J, Wellmer J, Urbach H, Elger CE. 3D source localization derived from subdural strip and grid electrodes: a simulation study. Clin. Neurophysiol. 2009;120:1061–1069. doi: 10.1016/j.clinph.2009.03.014. [DOI] [PubMed] [Google Scholar]
- Edelman BJ, Johnson N, Sohrabpour A, Tong S, Thakor N, He B. Systems Neuroengineering: Understanding and Interacting with the Brain. Engineering. 2015;1:292–308. doi: 10.15302/j-eng-2015078. [DOI] [PMC free article] [PubMed] [Google Scholar]
- Engel J. Surgical treatment for epilepsy: too little, too late? Jama. 2008;300:2548–2550. doi: 10.1001/jama.2008.756. [DOI] [PubMed] [Google Scholar]
- Engemann DA, Gramfort A. Automated model selection in covariance estimation and spatial whitening of MEG and EEG signals. NeuroImage. 2015;108:328–342. doi: 10.1016/j.neuroimage.2014.12.040. [DOI] [PubMed] [Google Scholar]
- Fisher R, Salanova V, Witt T, Worth R, Henry T, Gross R, Oommen K, Osorio I, Nazzaro J, Labar D, Kaplitt M, Sperling M, Sandok E, Neal J, Handforth A, Stern J, DeSalles A, Chung S, Shetter A, Bergen D, Bakay R, Henderson J, French J, Baltuch G, Rosenfeld W, Youkilis A, Marks W, Garcia P, Barbaro N, Fountain N, Bazil C, Goodman R, McKhann G, Babu Krishnamurthy K, Papavassiliou S, Epstein C, Pollard J, Tonder L, Grebin J, Coffey R, Graves N the SANTE Study Group. Electrical stimulation of the anterior nucleus of thalamus for treatment of refractory epilepsy. Epilepsia. 2010;51:899–908. doi: 10.1111/j.1528-1167.2010.02536.x. [DOI] [PubMed] [Google Scholar]
- Gavaret M, Trébuchon A, Bartolomei F, Marquis P, Mcgonigal A, Wendling F, Regis J, Badier JM, Chauvel P. Source localization of scalp-EEG interictal spikes in posterior cortex epilepsies investigated by HR-EEG and SEEG. Epilepsia. 2009;50:276–289. doi: 10.1111/j.1528-1167.2008.01742.x. [DOI] [PubMed] [Google Scholar]
- Gharib S, Sutherling WW, Nakasato N, Barth DS, Baumgartner C, Alexopoulos N, Taylor S, Rogers RL. MEG and ECoG localization accuracy test. Electroencephalogr. Clin. Neurophysiol. 1995;94:109–114. doi: 10.1016/0013-4694(94)00276-q. [DOI] [PubMed] [Google Scholar]
- Granger CW. Testing for causality: a personal viewpoint. J. Econ. Dyn. Control. 1980;2:329–352. [Google Scholar]
- Hämäläinen M, Hari R, Ilmoniemi RJ, Knuutila J, Lounasmaa OV. Magnetoencephalography—theory, instrumentation, and applications to noninvasive studies of the working human brain. Rev. Mod. Phys. 1993;65:413. [Google Scholar]
- Hamalainen MS, Sarvas J. Realistic conductivity geometry model of the human head for interpretation of neuromagnetic data. IEEE Trans. Biomed. Eng. 1989;36:165–171. doi: 10.1109/10.16463. [DOI] [PubMed] [Google Scholar]
- Hansen PC. Regularization tools: A Matlab package for analysis and solution of discrete ill-posed problems. Numer. Algorithms. 1994;6:1–35. [Google Scholar]
- Hauser WA, Kurland LT. The epidemiology of epilepsy in Rochester, Minnesota, 1935 through 1967. Epilepsia. 1975;16:1–66. doi: 10.1111/j.1528-1157.1975.tb04721.x. [DOI] [PubMed] [Google Scholar]
- He B, Coleman T, Genin GM, Glover G, Hu X, Johnson N, Liu T, Makeig S, Sajda P, Ye K. Grand challenges in mapping the human brain: NSF workshop report. IEEE Trans. Biomed. Eng. 2013;60:2983–2992. doi: 10.1109/TBME.2013.2283970. [DOI] [PubMed] [Google Scholar]
- He B, Dai Y, Astolfi L, Babiloni F, Yuan H, Yang L. eConnectome: A MATLAB toolbox for mapping and imaging of brain functional connectivity. J. Neurosci. Methods. 2011a;195:261–269. doi: 10.1016/j.jneumeth.2010.11.015. [DOI] [PMC free article] [PubMed] [Google Scholar]
- He B, Ding L. Electrophysiological mapping and neuroimaging. In: He B, editor. Neural Engineering. Springer; 2013. pp. 499–543. [Google Scholar]
- He B, Lian J. Electrophysiological Neuroimaging. In: He B, editor. Neural Engineering, Bioelectric Engineering. Springer; US: 2005. pp. 221–261. [Google Scholar]
- He B, Musha T, Okamoto Y, Homma S, Nakajima Y, Sato T. Electric dipole tracing in the brain by means of the boundary element method and its accuracy. IEEE Trans. Biomed. Eng. 1987:406–414. doi: 10.1109/tbme.1987.326056. [DOI] [PubMed] [Google Scholar]
- He B, Yang L, Wilke C, Yuan H. Electrophysiological imaging of brain activity and connectivity—challenges and opportunities. IEEE Trans. Biomed. Eng. 2011b;58:1918–1931. doi: 10.1109/TBME.2011.2139210. [DOI] [PMC free article] [PubMed] [Google Scholar]
- Holmes CJ, Hoge R, Collins L, Woods R, Toga AW, Evans AC. Enhancement of MR images using registration for signal averaging. J. Comput. Assist. Tomogr. 1998;22:324–333. doi: 10.1097/00004728-199803000-00032. [DOI] [PubMed] [Google Scholar]
- Johnson MD, Lim HH, Netoff TI, Connolly AT, Johnson N, Roy A, Holt A, Lim KO, Carey JR, Vitek JL, He B. Neuromodulation for Brain Disorders: Challenges and Opportunities. IEEE Trans. Biomed. Eng. 2013;60:610–624. doi: 10.1109/TBME.2013.2244890. [DOI] [PMC free article] [PubMed] [Google Scholar]
- Kamiński M, Ding M, Truccolo WA, Bressler SL. Evaluating causal relations in neural systems: Granger causality, directed transfer function and statistical assessment of significance. Biol. Cybern. 2001;85:145–157. doi: 10.1007/s004220000235. [DOI] [PubMed] [Google Scholar]
- Kaminski MJ, Blinowska KJ. A new method of the description of the information flow in the brain structures. Biol. Cybern. 1991;65:203–210. doi: 10.1007/BF00198091. [DOI] [PubMed] [Google Scholar]
- Koessler L, Benar C, Maillard L, Badier J-M, Vignal JP, Bartolomei F, Chauvel P, Gavaret M. Source localization of ictal epileptic activity investigated by high resolution EEG and validated by SEEG. Neuroimage. 2010;51:642–653. doi: 10.1016/j.neuroimage.2010.02.067. [DOI] [PubMed] [Google Scholar]
- Kuhn HW. The Hungarian method for the assignment problem. Nav. Res. Logist. Q. 1955;2:83–97. [Google Scholar]
- Kwan P, Sander JW. The natural history of epilepsy: an epidemiological view. J. Neurol. Neurosurg. Psychiatry. 2004;75:1376–1381. doi: 10.1136/jnnp.2004.045690. [DOI] [PMC free article] [PubMed] [Google Scholar]
- Kwong KK, Belliveau JW, Chesler DA, Goldberg IE, Weisskoff RM, Poncelet BP, Kennedy DN, Hoppel BE, Cohen MS, Turner R. Dynamic magnetic resonance imaging of human brain activity during primary sensory stimulation. Proc. Natl. Acad. Sci. 1992;89:5675–5679. doi: 10.1073/pnas.89.12.5675. [DOI] [PMC free article] [PubMed] [Google Scholar]
- Lai Y, Van Drongelen W, Ding L, Hecox KE, Towle VL, Frim DM, He B. Estimation of in vivo human brain-to-skull conductivity ratio from simultaneous extra-and intra-cranial electrical potential recordings. Clin. Neurophysiol. 2005;116:456–465. doi: 10.1016/j.clinph.2004.08.017. [DOI] [PubMed] [Google Scholar]
- Lu Y, Yang L, Worrell GA, He B. Seizure source imaging by means of FINE spatio-temporal dipole localization and directed transfer function in partial epilepsy patients. Clin. Neurophysiol. 2012;123:1275–1283. doi: 10.1016/j.clinph.2011.11.007. [DOI] [PMC free article] [PubMed] [Google Scholar]
- Malmivuo J, Plonsey R. Bioelectromagnetism: principles and applications of bioelectric and biomagnetic fields. Oxford University Press; USA: 1995. [Google Scholar]
- Martens HCF, Toader E, Decré MMJ, Anderson DJ, Vetter R, Kipke DR, Baker KB, Johnson MD, Vitek JL. Spatial steering of deep brain stimulation volumes using a novel lead design. Clin. Neurophysiol. 2011;122:558–566. doi: 10.1016/j.clinph.2010.07.026. [DOI] [PubMed] [Google Scholar]
- McGonigal A, Bartolomei F, Régis J, Guye M, Gavaret M, Trébuchon-Da Fonseca A, Dufour H, Figarella-Branger D, Girard N, Péragut J-C, et al. Stereoelectroencephalography in presurgical assessment of MRI-negative epilepsy. Brain. 2007;130:3169–3183. doi: 10.1093/brain/awm218. [DOI] [PubMed] [Google Scholar]
- Michel CM, He B. EEG mapping and source imaging. Niedermeyer’s Electroencephalogr. 2011;6:1179–1202. [Google Scholar]
- Michel CM, Murray MM, Lantz G, Gonzalez S, Spinelli L, de Peralta RG. EEG source imaging. Clin. Neurophysiol. 2004;115:2195–2222. doi: 10.1016/j.clinph.2004.06.001. [DOI] [PubMed] [Google Scholar]
- Mogul DJ, van Drongelen W. Electrical control of epilepsy. Annu. Rev. Biomed. Eng. 2014;16:483–504. doi: 10.1146/annurev-bioeng-071813-104720. [DOI] [PubMed] [Google Scholar]
- Morrell MJ. Responsive cortical stimulation for the treatment of medically intractable partial epilepsy. Neurology. 2011;77:1295–1304. doi: 10.1212/WNL.0b013e3182302056. [DOI] [PubMed] [Google Scholar]
- Niedermeyer E, da Silva FL. Electroencephalography: basic principles, clinical applications, and related fields. Lippincott Williams & Wilkins; 2005. [Google Scholar]
- Nobili L, Sartori I, Terzaghi M, Stefano F, Mai R, Tassi L, Parrino L, Cossu M, Russo GL. Relationship of epileptic discharges to arousal instability and periodic leg movements in a case of nocturnal frontal lobe epilepsy: a stereo-EEG study. Sleep. 2006;29:701–704. doi: 10.1093/sleep/29.5.701. [DOI] [PubMed] [Google Scholar]
- Ogawa S, Tank DW, Menon R, Ellermann JM, Kim SG, Merkle H, Ugurbil K. Intrinsic signal changes accompanying sensory stimulation: functional brain mapping with magnetic resonance imaging. Proc. Natl. Acad. Sci. 1992;89:5951–5955. doi: 10.1073/pnas.89.13.5951. [DOI] [PMC free article] [PubMed] [Google Scholar]
- Oluigbo CO, Salma A, Rezai AR. Deep brain stimulation for neurological disorders. IEEE Rev. Biomed. Eng. 2012;5:88–99. doi: 10.1109/RBME.2012.2197745. [DOI] [PubMed] [Google Scholar]
- Oostendorp TF, Delbeke J, Stegeman DF. The conductivity of the human skull: results of in vivo and in vitro measurements. IEEE Trans. Biomed. Eng. 2000;47:1487–1492. doi: 10.1109/TBME.2000.880100. [DOI] [PubMed] [Google Scholar]
- Palus M, Hoyer D. Detecting nonlinearity and phase synchronization with surrogate data. IEEE Eng. Med. Biol. Mag. 1998;17:40–45. doi: 10.1109/51.731319. [DOI] [PubMed] [Google Scholar]
- Pascual-Marqui RD. Standardized low-resolution brain electromagnetic tomography (sLORETA): technical details. Methods Find Exp Clin Pharmacol. 2002;24:5–12. [PubMed] [Google Scholar]
- Pascual-Marqui RD, Michel CM, Lehmann D. Low resolution electromagnetic tomography: a new method for localizing electrical activity in the brain. Int. J. Psychophysiol. 1994;18:49–65. doi: 10.1016/0167-8760(84)90014-x. [DOI] [PubMed] [Google Scholar]
- Ramantani G, Cosandier-Rimélé D, Schulze-Bonhage A, Maillard L, Zentner J, Dümpelmann M. Source reconstruction based on subdural EEG recordings adds to the presurgical evaluation in refractory frontal lobe epilepsy. Clin. Neurophysiol. 2013;124:481–491. doi: 10.1016/j.clinph.2012.09.001. [DOI] [PubMed] [Google Scholar]
- Rosenow F, Lüders H. Presurgical evaluation of epilepsy. Brain. 2001;124:1683–1700. doi: 10.1093/brain/124.9.1683. [DOI] [PubMed] [Google Scholar]
- Sohrabpour A, He B. Selective Sensing and Modulation of Brain Networks using High Density Intracranial Electrode Arrays. Presented at the Minnesota Neuromodulation Symposium; Minneapolis, MN, USA. 2015. [Google Scholar]
- Sohrabpour A, Lu Y, Worrell G, He B. Imaging brain source extent from EEG/MEG by means of an iteratively reweighted edge sparsity minimization (IRES) strategy. NeuroImage. 2016a;142:27–42. doi: 10.1016/j.neuroimage.2016.05.064. [DOI] [PMC free article] [PubMed] [Google Scholar]
- Sohrabpour A, Ye S, Worrell GA, Zhang W, He B. Noninvasive Electromagnetic Source Imaging and Granger Causality Analysis: An Electrophysiological Connectome (eConnectome) Approach. IEEE Trans. Biomed. Eng. 2016b;63:2474–2487. doi: 10.1109/TBME.2016.2616474. [DOI] [PMC free article] [PubMed] [Google Scholar]
- Stam CJ. Modern network science of neurological disorders. Nat. Rev. Neurosci. 2014;15:683–695. doi: 10.1038/nrn3801. [DOI] [PubMed] [Google Scholar]
- Stanslaski S, Afshar P, Cong P, Giftakis J, Stypulkowski P, Carlson D, Linde D, Ullestad D, Avestruz A-T, Denison T. Design and validation of a fully implantable, chronic, closed-loop neuromodulation device with concurrent sensing and stimulation. IEEE Trans. Neural Syst. Rehabil. Eng. 2012;20:410–421. doi: 10.1109/TNSRE.2012.2183617. [DOI] [PubMed] [Google Scholar]
- Talairach J, Bancaud J, Szikla G, Bonis A, Geier S, Vedrenne C. New approach to the neurosurgery of epilepsy. Stereotaxic methodology and therapeutic results. 1. Introduction and history [Article in French] Neurochirurgie. 1974;20(Suppl 1):1–240. [PubMed] [Google Scholar]
- Ter-Pogossian MM, Phelps ME, Hoffman EJ, Mullani NA. A Positron-Emission Transaxial Tomograph for Nuclear Imaging (PETT) 1. Radiology. 1975;114:89–98. doi: 10.1148/114.1.89. [DOI] [PubMed] [Google Scholar]
- Theiler J, Eubank S, Longtin A, Galdrikian B, Farmer JD. Testing for nonlinearity in time series: the method of surrogate data. Phys. Nonlinear Phenom. 1992;58:77–94. [Google Scholar]
- von Ellenrieder N, Beltrachini L, Muravchik CH. Electrode and brain modeling in stereo-EEG. Clin. Neurophysiol. 2012;123:1745–1754. doi: 10.1016/j.clinph.2012.01.019. [DOI] [PubMed] [Google Scholar]
- Wilke C, Ding L, He B, et al. Estimation of time-varying connectivity patterns through the use of an adaptive directed transfer function. IEEE Trans. Biomed. Eng. 2008;55:2557–2564. doi: 10.1109/TBME.2008.919885. [DOI] [PMC free article] [PubMed] [Google Scholar]
- Wilke C, Drongelen W van, Kohrman M, He B. Identification of epileptogenic foci from causal analysis of ECoG interictal spike activity. Clin. Neurophysiol. 2009;120:1449–1456. doi: 10.1016/j.clinph.2009.04.024. [DOI] [PMC free article] [PubMed] [Google Scholar]
- Wilke C, Van Drongelen W, Kohrman M, He B. Neocortical seizure foci localization by means of a directed transfer function method. Epilepsia. 2010;51:564–572. doi: 10.1111/j.1528-1167.2009.02329.x. [DOI] [PMC free article] [PubMed] [Google Scholar]
- Wilke C, Worrell G, He B. Graph analysis of epileptogenic networks in human partial epilepsy. Epilepsia. 2011;52:84–93. doi: 10.1111/j.1528-1167.2010.02785.x. [DOI] [PMC free article] [PubMed] [Google Scholar]
- Wold S, Esbensen K, Geladi P. Principal component analysis. Chemom. Intell. Lab. Syst. 1987;2:37–52. [Google Scholar]
- Yvert B, Fischer C, Bertrand O, Pernier J. Localization of human supratemporal auditory areas from intracerebral auditory evoked potentials using distributed source models. Neuroimage. 2005;28:140–153. doi: 10.1016/j.neuroimage.2005.05.056. [DOI] [PubMed] [Google Scholar]
- Zhang Y, Ding L, Drongelen W van, Hecox K, Frim D, He B. A Cortical Potential Imaging Study from Simultaneous Extra- and Intra-cranial Electrical Recordings by Means of the Finite Element Method. NeuroImage. 2006a;31:1513–1524. doi: 10.1016/j.neuroimage.2006.02.027. [DOI] [PMC free article] [PubMed] [Google Scholar]
- Zhang Y, Van Drongelen W, He B. Estimation of in vivo brain-to-skull conductivity ratio in humans. Appl. Phys. Lett. 2006b;89:223903. doi: 10.1063/1.2398883. [DOI] [PMC free article] [PubMed] [Google Scholar]
- Zhang Y, van Drongelen W, Kohrman M, He B. Three-dimensional brain current source reconstruction from intra-cranial ECoG recordings. NeuroImage. 2008;42:683–695. doi: 10.1016/j.neuroimage.2008.04.263. [DOI] [PMC free article] [PubMed] [Google Scholar]
Associated Data
This section collects any data citations, data availability statements, or supplementary materials included in this article.


