Abstract
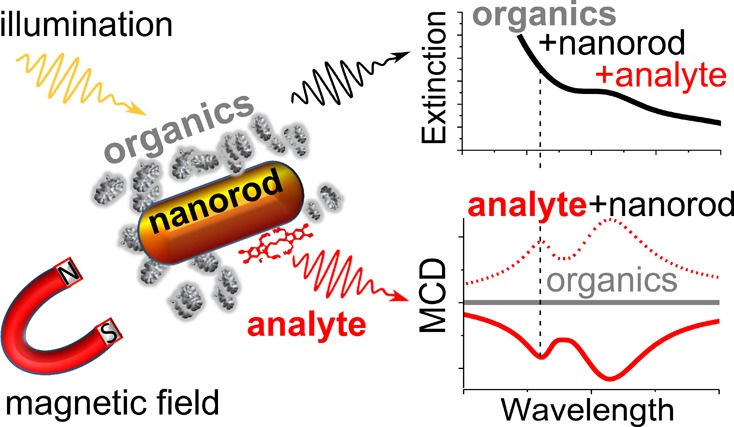
Plasmonic nanoparticles (PNPs) can significantly modify the optical properties of nearby organic molecules and thus present an attractive opportunity for sensing applications. However, the utilization of PNPs in conventional absorption, fluorescence, or Raman spectroscopy techniques is often ineffective due to strong absorption background and light scattering, particularly in the case of turbid solutions, cell suspensions, and biological tissues. Here we show that nonmagnetic organic molecules may exhibit magneto-optical response due to binding to a PNP. Specifically, we detect strong magnetic circular dichroism signal from supramolecular J-aggregates, a representative organic dye, upon binding to silver-coated gold nanorods. We explain this effect by strong coupling between the J-aggregate exciton and the nanoparticle plasmon, leading to the formation of a hybrid state in which the exciton effectively acquires magnetic properties from the plasmon. Our findings are fully corroborated by theoretical modeling and constitute a novel magnetic method for chemo- and biosensing, which (upon adequate PNP functionalization) is intrinsically insensitive to the organic background and thus offers a significant advantage over conventional spectroscopy techniques.
Keywords: Sensing, magneto-optical activity, magneto-plasmonics, J-aggregates, plexciton, strong coupling
Resonant plasmonic nanoparticles produce a large electromagnetic field in their neighborhood that greatly enhances the optical response of nearby molecules. Strong field confinement around the particle allows for the selective enhancement of processes only for molecules in close proximity to the particle surface. Functionalized PNPs thus play a central role in advanced optical spectroscopies based on Raman scattering,1,2 fluorescence,3,4 and Förster resonance energy transfer5 and have already found applications in medicine, biology, and pharmacology for sample identification and characterization.6−9 However, most PNP-based optical spectroscopy techniques have limited applicability in the case of turbid solutions, including among others cell suspensions and biological tissues, due to strong absorption background and light scattering.
Methods based on magneto-optical (MO) activity measurements, such as magnetic circular dichroism (MCD) spectroscopy and magneto-optic Kerr effect (MOKE), take an important place in the battery of tools for materials identification and characterization.10,11 However, direct MCD or MOKE measurements are rarely utilized in biosciences due to the usually very low magneto-optical response of biomolecules, thus requiring high magnetic fields and low temperatures for their detection. Instead, magnetic methods for chemo- and biosensing typically rely on magneto-plasmonic effects,10−17 such as the high MO activity exhibited by plasmonic nanoparticles near their localized surface plasmon resonance (LSPR). Strong dependence of LSPR on the dielectric environment allows for the detection of biomolecules in MOKE or MCD measurements.10−12,18−23 However, aggregates or different organic compounds that have similar dielectric permittivity are nearly indistinguishable, therefore preventing the simultaneous quantitative detection of different types of proteins or organic molecules.
Here we demonstrate that the MO activity of an organic compound itself can be greatly enhanced by coupling to a resonant PNP. Specifically, we show that supramolecular J-aggregates (a good model system for assemblies in biological complexes) linked to core–shell Au@Ag nanorods (NRs) produce strong MCD signal when the LSPR of the NRs is tuned to the J-band of the aggregates, while exhibiting no MCD upon detuning. We explain such an enhancement of the MO activity by strong coupling of the J-band exciton and the nanoparticle plasmon and fully support our experimental findings by theoretical modeling. Strong-field confinement around the nanoparticle selectively enhances the MO activity only in those molecules that are bound to the particle surface. The near-complete absence of MO background from other molecular components could allow for the molecule detection even in the case of strong absorption background or light scattering. Thus, our work creates a new paradigm in sensing, which can make a large impact in materials science, medicine, biology, and pharmacology.
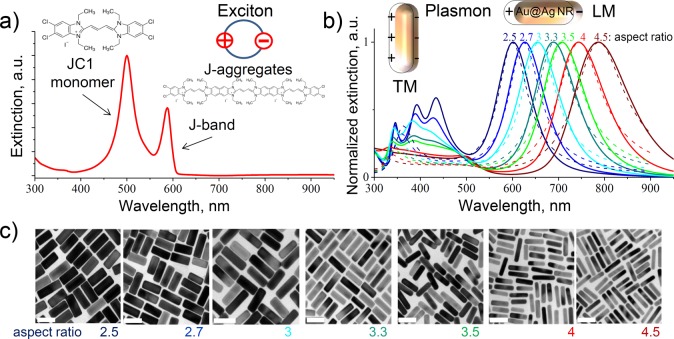
As a nonmagnetic organic compound for the investigation of MO activity, we utilize the well-studied cyanine dye JC1 (5,5′,6,6′-tetrachloro-1,1′,3,3′-tetraethyl-imidacarbocyanine iodide, Sigma-Aldrich), widely used in biology to monitor mitochondrial health and the functional status of cells.24−26 The optical properties of JC1 at visible frequencies are determined by the S0 → S1 transition, yielding a monomer peak at 500 nm in the extinction spectrum (left peak in Figure 1a).24 Upon dissolution in water or surface adsorption, JC1 spontaneously aggregates, forming so-called J-aggregates.27,28 The extinction spectrum of JC1 J-aggregates exhibits a characteristic narrow exciton peak (J-band peak at 590 nm in Figure 1a) caused by the delocalization and migration of the excitonic energy over a large number of aggregated dye molecules.29
Figure 1.
Experimental extinction spectra of the aqueous solution of (a) JC1 dye (inset: chemical structure of JC1 dye, sketch of J-aggregates and J-band exciton) and (b) bare core–shell Au@Ag nanorods of varying aspect ratios (solid lines), overlaid with theoretical predictions (dashed lines). The multiple peaks below 500 nm, caused by the excitation of transverse dipolar and higher-order plasmon modes of Au@Ag nanorods, are not fully captured by our quasistatic model, which treats them as simple spheroids.31,32 (Inset) Sketch of the transverse and longitudinal plasmon modes of core–shell Au@Ag nanorods. (c) TEM images of core–shell Au@Ag nanorods with aspect ratios varying from 2.5 to 4.5 from which the extinction spectra in panel b were obtained; scale bars are 50 nm.
To obtain PNPs with an LSPR at the characteristic energies of JC1, we selected core–shell Au@Ag nanorods. The NRs were synthesized in an aqueous solution using benzyldimethylhexadecylammonium chloride (BDAC) as the capping and growth-regulating agent.30 Each nanorod essentially exhibits two types of resonant modes: the transverse modes (TM), related to the electron oscillations perpendicular to the long NR axis, and the longitudinal modes (LM), caused by the oscillations along the long NR axis (see insets in Figure 1b). The spectral positions of resonances of both mode types can be controlled by the NR aspect ratio (here, the ratio of the rod length to its width) with the LM resonance offering the widest tunability range from visible to near-IR frequencies. We varied the aspect ratio of our NRs by depositing Ag on the Au NR core. Silver grows preferentially on the NR sides, making the rod thicker and thus decreasing its aspect ratio. This way, by increasing the Ag deposition, we obtained NRs with aspect ratios ranging from 4.5 to 2.5 (see TEM images, Figure 1c), which changes the spectral position of LM LSPR from 785 to 600 nm (see extinction spectra in Figure 1b) and allows for the investigation of the MO activity as a function of spectral detuning (δ) between resonances of the longitudinal plasmon of a bare NR and the exciton of J-aggregates.
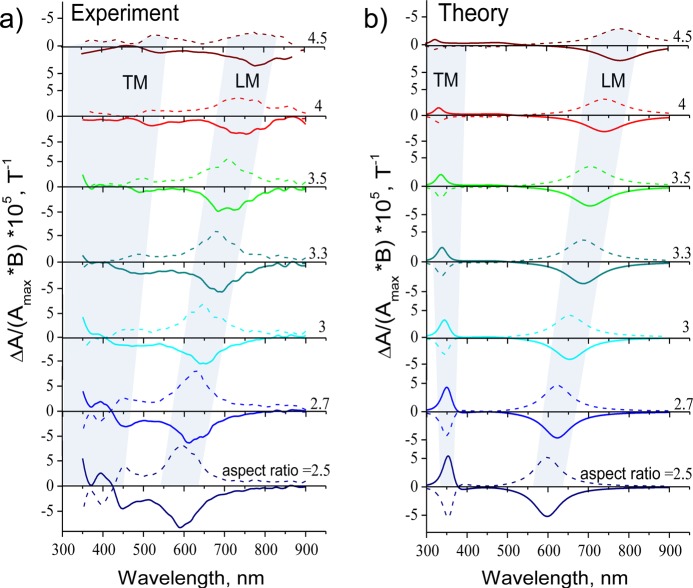
Figure 2a shows the MCD spectra (the difference between the absorbance of left- and right-hand polarized light, ΔA(λ)) measured on bare NRs of different aspect ratios under the applied magnetic field of ±1 T (all spectra are normalized to the magnetic field magnitude and the extinction maximum Amax for the corresponding aspect ratio). MCD spectra were recorded using a Jasco J-815 spectropolarimeter equipped with a water cooled GMW 3470 electromagnet providing a static magnetic field of up to 1 T (see SI for details). As expected, we registered strong signals of magnetic circular dichroism at the TM and LM resonances of core–shell Au@Ag nanorods for both polarities of the magnetic field.12,18,33 We find a slightly decreased MO activity at the LM resonance for nanorods with higher aspect ratios due to broadening34 of the longitudinal plasmon peak, as confirmed by theoretical calculations (Figure 2b). In our theoretical model, we regard the Au@Ag nanorods as concentric spheroidal shells and describe the MO response of NRs solution using the effective medium approach as described in refs (35 and 36) (see SI).
Figure 2.
Experimental (a) and theoretical (b) magnetic circular dichroism spectra, ΔA, (defined as the difference between absorbance for left- and right-hand circularly polarized light in the presence of a magnetic field) for bare core–shell Au@Ag nanorods of different aspect ratios, normalized to the corresponding extinction maxima, Amax, and the magnitude of the magnetic field, B. All spectra were measured at room temperature under applied magnetic fields of B = ±1 T (solid and dashed lines for plus and minus, respectively).
Note that the recorded MCD spectra are markedly different from those reported for spherical nanoparticles12 and nanodiscs,37 where the application of a magnetic field yields the splitting of the degenerate (left- and right-hand polarized) plasmon modes. This results in the classical “butterfly” or dispersive spectral profile of MCD at the plasmon resonance band, similar to the spectral response due to Zeeman effect in molecular systems.38,39 In nanorods, the degeneracy between the LM and TM modes is lifted by the particle asymmetry. Thus, instead of the energy splitting, the application of the magnetic field results in different “mixing” of the two plasmon modes for left- and right-hand circularly polarized light. This yields the MCD signal of opposite signs at LM and TM resonances, yet each with a “bell-shaped” or absorptive spectral profile, and is analogous to the MCD due to a douplet of closely related nondegenerate states in molecular systems.38,39
By using simple methods described in our previous works28,40 we created highly stable hybrid structures of core–shell Au@Ag nanorods and J-aggregates (further called hybrid NRs/J-aggregates system). Leftover monomers and free J-aggregates not bound to the particle surface were filtered out by centrifuging (see SI).
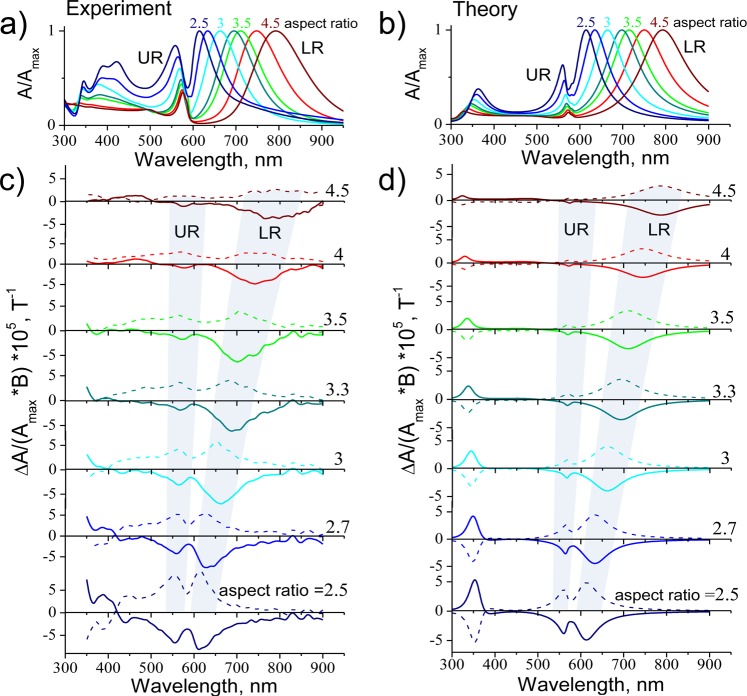
The optical response of the hybrid NRs/J-aggregates system at short wavelengths (300–500 nm, see Figure 3a), where the TM resonances of core–shell Au@Ag nanorods are located, is nearly unaffected by the presence of J-aggregates. In contrast, at long wavelengths (550–800 nm) we now observe two extinction peaks for each NR aspect ratio (one at 557–575 nm and the other at 615–794 nm, see Figure 3a), which we further refer to as upper resonance (UR) and lower resonance (LR), respectively. The monomer peak at 500 nm (see Figure 1a) is not present in the measured extinction spectra due to its absence in the samples (see details on the preparation method in the SI). We see that for high aspect ratios (4–4.5) of the hybrid NRs/J-aggregates system (Figure 3a), the position of the LR peak tends to the longitudinal LSPR mode of bare NRs and the UR band tends to the J-band of J-aggregates. Note that even for the highest aspect ratio of hybrid NRs/J-aggregates system, the UR peak is blue-shifted by 15 nm as compared to the extinction peak of J-aggregates in aqueous solution (Figure 1a), which could be explained by changes in the microenvironment of the molecule (Lamb shift) upon adsorption of J-aggregates onto the NR surface.40 For small aspect ratios in the hybrid NRs/J-aggregates system, the LR peak redshifts with respect to the LM resonance of the pure nanorods, while the UR peak blueshifts away from the J-band resonance, thereby leaving a pronounced dip in its place (Figure 3a,b).
Figure 3.
Experimental (a) and theoretical (b) extinction spectra of the hybrid system of J-aggregates and core–shell Au@Ag nanorods for different aspect ratios; all spectra are normalized to their maxima, Amax. Experimental (c) and theoretical (d) MCD spectra, ΔA, normalized to the magnitude of the magnetic field B and to the corresponding extinction maxima, Amax. MCD spectra were measured under the applied magnetic fields of B = ±1T (solid and dashed lines for positive and negative, respectively). All spectra were obtained at room temperature.
The most interesting behavior, however, is exhibited by the hybrid NRs/J-aggregates system in the MO response. For the highest aspect ratio, 4.5, (brown curve in Figure 3c,d) we only observe a pronounced MCD within the LR absorption band and an insignificant MCD in the UR band. This is expected because J-aggregates, as well as other organic materials, are known to exhibit no significant MO activity (see Figure S1). Yet remarkably, for smaller aspect ratios we detect a strong MCD signal at the UR (aspect ratios from 2.5 to 4 in Figure 3c). The reversal of the sign of MCD by changing the polarity of the magnetic field confirms the magnetic nature of the detected signal. Our experimental data (Figure 3a,c) are also accurately reproduced by theoretical modeling (see Figure 3b,d), thus eliminating the possibility of experimental error.
To understand the origin of MO activity near the absorption line of a nonmagnetic organic material in the hybrid NRs/J-aggregates system, we plotted the spectral position of UR and LR as a function of detuning δ in Figure 4a. At large detunings, the spectral position of LR (blue dots) approaches that of the LM plasmon of the pure Au@Ag rods (dashed blue line), while the UR (red dots) tends to that of the J-aggregate exciton (dashed red line). However, at smaller detuning we see a clear anticrossing behavior, which is a good indication of strong coupling between the nanorods plasmon and the J-aggregates exciton. Large Rabi splitting of ℏΩR ≈ 175 meV and strong exciton–plasmon coupling constant, g, with respect to the plasmonic loss, κ, (g/κ ≈ 0.4 > 0.25) confirm the strong coupling regime.40 ΩR was calculated by extrapolating the experimental data (symbols in Figure 4a) to zero detuning based on our theoretical model (solid curves in Figure 4a) and taking the difference between the UR and LR energies. g was then estimated using models from refs (40 and 41) and the experimental broadening of the LSPR for bare Au@Ag NRs for 2.5 aspect ratio (i.e., for δ ≈ 0).
Figure 4.
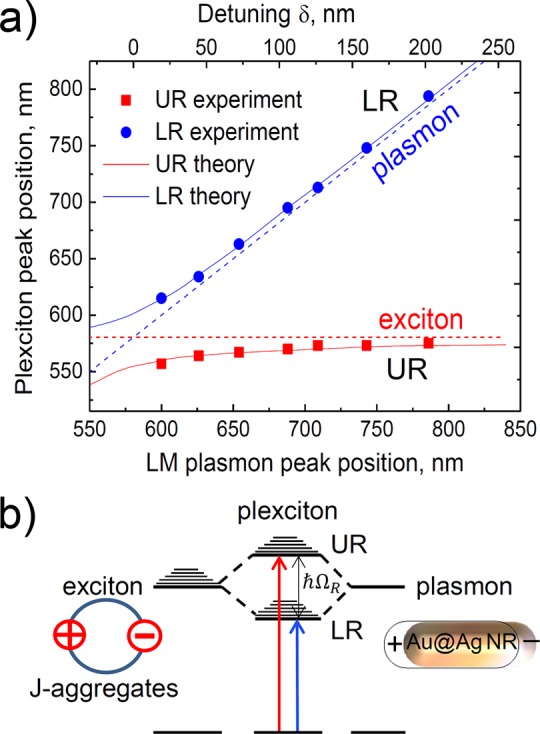
(a) Upper resonance (red squares) and lower resonance (blue circles) peak positions in the experimental extinction spectra of the hybrid core–shell Au@Ag nanorods and J-aggregates system, as a function of plasmon peak position in the spectrum of bare NRs and as a function of detuning δ. Red and blue solid curves show the theoretical UR and LR peak positions, respectively. The horizontal red dashed line indicates the spectral position of the J-band. The diagonal blue dashed line marks the position of the plasmon resonance of longitudinal modes of bare core–shell Au@Ag nanorods. (b) Schematic representation of strong coupling between J-aggregates exciton (left) and the NR plasmon (right) yielding two hybrid plexciton states.
The origin of strong MO activity in J-aggregates now becomes clear. The strong coupling leads to the formation of two hybrid plexciton states (further called upper and lower plexcitons), each exhibiting both excitonic and plasmonic properties (see Figure 4b).41−43 Thus, the exciton effectively acquires the MO activity from the plasmon, yielding strong MCD upon tuning in the NR LSPR and the J-band exciton. This conclusion is further supported by the identical linear dependence of the measured MCD (in a hybrid NRs/J-aggregates system) on the magnetic field at both UR and LR for the smallest detuning (NR aspect ratio of 2.5, see Figure S2).
To quantify how the MO activity of plexcitons in hybrid NRs/J-aggregates system depends on detuning, we normalized the MCD signal on the corresponding absorption spectra at each wavelength (see Figure S3), which accounts for the variation of optical density of our samples. In Figure 5, we plot the ratio, f, of such normalized MCD spectra of hybrid NRs/J-aggregates system and bare NRs taken at UR (red dots) and LR (blue dots), as a function of detuning between the exciton and the plasmon
where ΔA(λ) and A(λ) stand for the MCD and absorption spectra, respectively. We see that the MO activity of the lower plexciton state (blue line in Figure 5) does not vary significantly and is the same as that of the LM plasmon for bare NRs. In contrast, the MO activity of the upper plexciton (red line) grows exponentially with the decrease of detuning and reaches that of the NR plasmon at δ → 0, which can be utilized for the investigation of exciton–plasmon interaction in hybrid organic/inorganic systems. Note that we also obtained strong enhancement of the magneto-optical response of supramolecular J-aggregates of another cyanine dye S-46 upon linking them to plasmonic nanostructures (see Figures S1 and S4), indicating that the enhancement of the MO activity of the organic material is not unique to this specific compound but seems to be universal. Such universality may allow for the detection of different types of organic compounds, including polymers and proteins, provided that the resonances of the compound and PNP are in the same spectral range. For compounds with resonances beyond the plasmon tunability range (such as many proteins with absorption bands typically located in the UV), a specific dye can be attached and then detected in a similar fashion as demonstrated here for J-aggregates. Note that, as inferred from our theoretical modeling (Figure S5), the large values of the coupling constant g are beneficial for the UR peak visibility but not essential for the compound detection. This suggests the possibility of detecting nonagglomerated molecules and further supports the wide applicability of the proposed concept.
Figure 5.
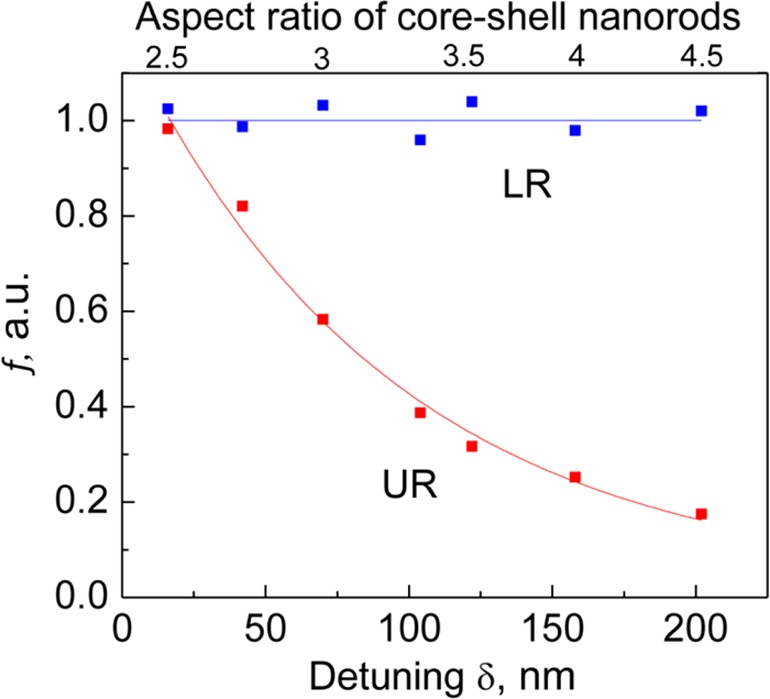
Ratios of the magneto-optical activity of hybrid NR/J-aggregates system and bare core–shell Au@Ag nanorods evaluated at the spectral positions of upper resonance (red) and lower resonance (blue), as a function of detuning between the exciton and the plasmon frequencies. The upper axis shows the corresponding NR aspect ratio. Solid blue and red curves are linear and an exponential fits to the experimental data, respectively.
In summary, we demonstrated that plasmonic nanostructures may strongly enhance the magneto-optical activity of nonmagnetic organic compounds linked to their surfaces, allowing for their MO detection at room temperature and weak magnetic fields (<1 T). Formation of coupled hybrid systems, where specific molecules are coupled to plasmonic nanostructures and acquire magnetic properties, paves the way toward the development of novel magnetic methods for sensing, which are intrinsically insensitive to the (organics) scattering background and thus offer a significant advantage over conventional spectroscopy techniques. We further showed that the MO activity enhancement strongly depends on the detuning between the LSPR of the nanostructure and the characteristic excitation in the organic compound, yielding the MO activity of the latter at zero detuning as strong as that of the plasmon. This means that the MO activity could be utilized for the fundamental investigation of properties of hybrid organic/inorganic systems in the strong coupling regime. We envision a great impact of our work onto biological research, pharmacology, materials science, and organic semiconductor industry with applications in sensing and biosensing, optical magnetic data storage, communications systems, and quantum computing.
Acknowledgments
We thank Professor P. Vavassori, Dr. A.Y. Nikitin (CIC nanoGUNE), and Dr. R. Esteban (Donostia International Physics Center) for helpful discussions. We acknowledge financial support from Project Fis2016.80174-P (PLASMOQUANTA) from MINECO (Ministerio de Economía y Competitividad). L.L.-M. acknowledges funding from the European Research Council (ERC Advanced Grant 267867, Plasmaquo).
Supporting Information Available
The Supporting Information is available free of charge on the ACS Publications website at DOI: 10.1021/acs.nanolett.6b05128.
Methods: synthesis of Au@Ag core–shell nanorods, preparation of hybrid core–shell Au@Ag nanorods and J-aggregates system, MCD measurements. Description of the theoretical model for calculations of absorption and MCD of a nanorods solution. S1: Experimental extinction and magnetic circular dichroism spectra of pure JC1 and S-46 J-aggregates and hybrid core–shell Au@Ag nanorods and J-aggregates of JC1 and S-46 dyes. S2: Dependence of MCD signal on the value of the magnetic field for plexcitons. S3: Comparison of MCD spectra normalized to the absorption spectra for bare core–shell Au@Ag nanorods and for hybrid core–shell Au@Ag and J-aggregates system. S4: Chemical structure of JC1 and S-46 dyes. S5: The theoretical extinction and MCD spectra of the hybrid system of J-aggregates and core–shell Au@Ag nanorods with smaller value of coupling constant (PDF)
Author Contributions
D.M. and A.G. contributed equally to this work. D.M., L.L.-M., and Y.R, designed the experiments. M.G., A.S.–I., and D.M. prepared samples. D.M. performed the experiments. A.G. performed the theoretical modeling. D.M and A.G. analyzed the data. D.M. and A.G. wrote the manuscript with the contribution from Y.R. All authors contributed to the scientific discussions and manuscript revisions.
The authors declare no competing financial interest.
Supplementary Material
References
- Fleischmann M.; Hendra P. J.; Mcquillan A. J. Chem. Phys. Lett. 1974, 26 (2), 163–166. 10.1016/0009-2614(74)85388-1. [DOI] [Google Scholar]
- Anker J. N.; Hall W. P.; Lyandres O.; Shah N. C.; Zhao J.; Van Duyne R. P. Nat. Mater. 2008, 7 (6), 442–453. 10.1038/nmat2162. [DOI] [PubMed] [Google Scholar]
- Tam F.; Goodrich G. P.; Johnson B. R.; Halas N. J. Nano Lett. 2007, 7 (2), 496–501. 10.1021/nl062901x. [DOI] [PubMed] [Google Scholar]
- Bardhan R.; Grady N. K.; Cole J. R.; Joshi A.; Halas N. J. ACS Nano 2009, 3 (3), 744–752. 10.1021/nn900001q. [DOI] [PubMed] [Google Scholar]
- Komarala V. K.; Bradley A. L.; Rakovich Y. P.; Byrne S. J.; Gun’ko Y. K.; Rogach A. L. Appl. Phys. Lett. 2008, 93 (12), 123102. 10.1063/1.2981209. [DOI] [Google Scholar]
- Langer J.; Novikov S. M.; Liz-Marzan L. M. Nanotechnology 2015, 26 (32), 322001. 10.1088/0957-4484/26/32/322001. [DOI] [PubMed] [Google Scholar]
- Rodriguez-Lorenzo L.; de la Rica R.; Alvarez-Puebla R. A.; Liz-Marzan L. M.; Stevens M. M. Nat. Mater. 2012, 11 (7), 604–607. 10.1038/nmat3337. [DOI] [PubMed] [Google Scholar]
- Beuwer M. A.; Prins M. W. J.; Zijlstra P. Nano Lett. 2015, 15 (5), 3507–3511. 10.1021/acs.nanolett.5b00872. [DOI] [PubMed] [Google Scholar]
- Banin U. Nat. Mater. 2007, 6 (9), 625–626. 10.1038/nmat1993. [DOI] [PubMed] [Google Scholar]
- Armelles G.; Cebollada A.; Garcia-Martin A.; Gonzalez M. U. Adv. Opt. Mater. 2013, 1 (1), 10–35. 10.1002/adom.201200011. [DOI] [Google Scholar]
- Maksymov I. S. Reviews in Physics 2016, 1, 36–51. 10.1016/j.revip.2016.03.002. [DOI] [Google Scholar]
- Pineider F.; Campo G.; Bonanni V.; Fernandez C. J.; Mattei G.; Caneschi A.; Gatteschi D.; Sangregorio C. Nano Lett. 2013, 13 (10), 4785–4789. 10.1021/nl402394p. [DOI] [PubMed] [Google Scholar]
- Kruglyak V. V.; Demokritov S. O.; Grundler D. J. Phys. D: Appl. Phys. 2010, 43 (26), 260301. 10.1088/0022-3727/43/26/260301. [DOI] [Google Scholar]
- Temnov V. V. Nat. Photonics 2012, 6 (12), 872–872. 10.1038/nphoton.2012.326. [DOI] [Google Scholar]
- Inoue M.; Levy M.; Baryshev A. V.. Magnetophotonics From Theory to Applications; Springer: Berlin, Germany, 2013; Vol. 178. [Google Scholar]
- Maksymov I. S. Nanomaterials 2015, 5 (2), 577–613. 10.3390/nano5020577. [DOI] [PMC free article] [PubMed] [Google Scholar]
- Bossini D.; Belotelov V. I.; Zvezdin A. K.; Kalish A. N.; Kimel A. V. ACS Photonics 2016, 3 (8), 1385–1400. 10.1021/acsphotonics.6b00107. [DOI] [Google Scholar]
- Sepulveda B.; Calle A.; Lechuga L. M.; Armelles G. Opt. Lett. 2006, 31 (8), 1085–1087. 10.1364/OL.31.001085. [DOI] [PubMed] [Google Scholar]
- Bonanni V.; Bonetti S.; Pakizeh T.; Pirzadeh Z.; Chen J.; Nogues J.; Vavassori P.; Hillenbrand R.; Akerman J.; Dmitriev A. Nano Lett. 2011, 11 (12), 5333–5338. 10.1021/nl2028443. [DOI] [PMC free article] [PubMed] [Google Scholar]
- Manera M. G.; Montagna G.; Ferreiro-Vila E.; Gonzalez-Garcia L.; Sanchez-Valencia J. R.; Gonzalez-Elipe A. R.; Cebollada A.; Garcia-Martin J. M.; Garcia-Martin A.; Armelles G.; Rella R. J. Mater. Chem. 2011, 21 (40), 16049–16056. 10.1039/c1jm11937k. [DOI] [Google Scholar]
- Regatos D.; Sepulveda B.; Farina D.; Carrascosa L. G.; Lechuga L. M. Opt. Express 2011, 19 (9), 8336–8346. 10.1364/OE.19.008336. [DOI] [PubMed] [Google Scholar]
- Maccaferri N.; Gregorczyk K. E.; de Oliveira T. V. A. G.; Kataja M.; van Dijken S.; Pirzadeh Z.; Dmitriev A.; Akerman J.; Knez M.; Vavassori P. Nat. Commun. 2015, 6, 7431. 10.1038/ncomms8431. [DOI] [PubMed] [Google Scholar]
- Herreno-Fierro C. A.; Patino E. J.; Armelles G.; Cebollada A. Appl. Phys. Lett. 2016, 108 (2), 021109. 10.1063/1.4939772. [DOI] [Google Scholar]
- Smiley S. T.; Reers M.; Mottolahartshorn C.; Lin M.; Chen A.; Smith T. W.; Steele G. D.; Chen L. B. Proc. Natl. Acad. Sci. U. S. A. 1991, 88 (9), 3671–3675. 10.1073/pnas.88.9.3671. [DOI] [PMC free article] [PubMed] [Google Scholar]
- Reers M.; Smith T. W.; Chen L. B. Biochemistry 1991, 30 (18), 4480–4486. 10.1021/bi00232a015. [DOI] [PubMed] [Google Scholar]
- Perelman A.; Wachtel C.; Cohen M.; Haupt S.; Shapiro H.; Tzur A. Cell Death Dis. 2012, 3, e430. 10.1038/cddis.2012.171. [DOI] [PMC free article] [PubMed] [Google Scholar]
- Melnikau D.; Savateeva D.; Gun’ko Y. K.; Rakovich Y. P. J. Phys. Chem. C 2013, 117 (26), 13708–13712. 10.1021/jp4037777. [DOI] [Google Scholar]
- Melnikau D.; Savateeva D.; Susha A.; Rogach A. L.; Rakovich Y. P. Nanoscale Res. Lett. 2013, 8, 134. 10.1186/1556-276X-8-134. [DOI] [PMC free article] [PubMed] [Google Scholar]
- Kirstein S.; Daehne S. Int. J. Photoenergy 2006, 2006, 1. 10.1155/IJP/2006/20363. [DOI] [Google Scholar]
- Gomez-Grana S.; Goris B.; Altantzis T.; Fernandez-Lopez C.; Carbo-Argibay E.; Guerrero-Martinez A.; Almora-Barrios N.; Lopez N.; Pastoriza-Santos I.; Perez-Juste J.; Bals S.; Van Tendeloo G.; Liz-Marzan L. M. J. Phys. Chem. Lett. 2013, 4 (13), 2209–2216. 10.1021/jz401269w. [DOI] [Google Scholar]
- Cortie M. B.; Liu F. G.; Arnold M. D.; Niidome Y. Langmuir 2012, 28 (24), 9103–9112. 10.1021/la300407u. [DOI] [PubMed] [Google Scholar]
- Jiang R. B.; Chen H. J.; Shao L.; Li Q.; Wang J. F. Adv. Mater. 2012, 24 (35), Op200–Op207. 10.1002/adma.201201896. [DOI] [PubMed] [Google Scholar]
- Artemyev M.; Krutokhvostov R.; Melnikau D.; Oleinikov V.; Sukhanova A.; Nabiev I. Proc. SPIE 2012, 845729. 10.1117/12.929860. [DOI] [Google Scholar]
- Juve V.; Cardinal M. F.; Lombardi A.; Crut A.; Maioli P.; Perez-Juste J.; Liz-Marzan L. M.; Del Fatti N.; Vallee F. Nano Lett. 2013, 13 (5), 2234–2240. 10.1021/nl400777y. [DOI] [PubMed] [Google Scholar]
- Hui P. M.; Stroud D. Appl. Phys. Lett. 1987, 50 (15), 950–952. 10.1063/1.97996. [DOI] [Google Scholar]
- Abe M.; Suwa T. Phys. Rev. B: Condens. Matter Mater. Phys. 2004, 70 (23), 235103. 10.1103/PhysRevB.70.235103. [DOI] [Google Scholar]
- Sepulveda B.; Gonzalez-Diaz J. B.; Garcia-Martin A.; Lechuga L. M.; Armelles G. Phys. Rev. Lett. 2010, 104, 14. 10.1103/PhysRevLett.104.147401. [DOI] [PubMed] [Google Scholar]
- Sutherland J. C.; Holmquist B. Annu. Rev. Biophys. Bioeng. 1980, 9, 293–326. 10.1146/annurev.bb.09.060180.001453. [DOI] [PubMed] [Google Scholar]
- Mason W. R.A practical guide to magnetic circular dichroism spectroscopy; Wiley-Interscience: Hoboken, N.J., 2007. [Google Scholar]
- Melnikau D.; Esteban R.; Savateeva D.; Sánchez-Iglesias A. S.; Grzelczak M.; Schmidt M. K.; Liz-Marzan L. M.; Aizpurua J.; Rakovich Y. P. J. Phys. Chem. Lett. 2016, 7 (2), 354–362. 10.1021/acs.jpclett.5b02512. [DOI] [PubMed] [Google Scholar]
- Schlather A. E.; Large N.; Urban A. S.; Nordlander P.; Halas N. J. Nano Lett. 2013, 13 (7), 3281–3286. 10.1021/nl4014887. [DOI] [PubMed] [Google Scholar]
- Fofang N. T.; Park T. H.; Neumann O.; Mirin N. A.; Nordlander P.; Halas N. J. Nano Lett. 2008, 8 (10), 3481–3487. 10.1021/nl8024278. [DOI] [PubMed] [Google Scholar]
- Fofang N. T.; Grady N. K.; Fan Z. Y.; Govorov A. O.; Halas N. J. Nano Lett. 2011, 11 (4), 1556–1560. 10.1021/nl104352j. [DOI] [PubMed] [Google Scholar]
Associated Data
This section collects any data citations, data availability statements, or supplementary materials included in this article.


