

Abstract
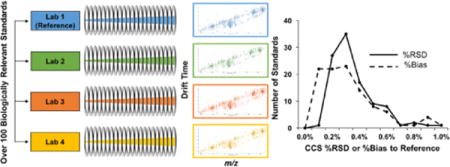
Collision cross section (CCS) measurements resulting from ion mobility – mass spectrometry (IM-MS) experiments provide a promising orthogonal dimension of structural information in MS based analytical separations. As with any molecular identifier, interlaboratory standardization must precede broad range integration into analytical workflows. In this study we present a reference drift tube ion mobility mass spectrometer (DTIM-MS) where improvements on the measurement accuracy of experimental parameters influencing IM separations provide standardized drift tube, nitrogen CCS values (DTCCSN2) for over 120 unique ion species with the lowest measurement uncertainty to date. The reproducibility of these DTCCSN2 values are evaluated across three additional laboratories on a commercially-available DTIM-MS instrument. The traditional stepped field CCS method performs with a relative standard deviation (RSD) of 0.29% for all ion species across the three additional laboratories. The calibrated single field CCS method, which is compatible with a wide range of chromatographic inlet systems, performs with an average, absolute bias of 0.54% to the standardized stepped field DTCCSN2 values on the reference system. The low RSD and biases observed in this interlaboratory study illustrate the potential of DTIM-MS for providing a molecular identifier for a broad range of discovery based analyses.
Keywords: Drift Tube Ion Mobility Spectrometry, Collision Cross Sections, Interlaboratory Comparison, Mason-Schamp Equation, Stepped Field CCS, Single Field CCS
Graphical abstract
Introduction
Mass spectrometry (MS) based analytical techniques are widely used in studies ranging from human health to environmental assessments.1–5 While MS measures the mass-to-charge ratio of ions, it is often coupled to additional separation dimensions such as liquid chromatography (LC) or gas chromatography (GC) to further understand physiochemical properties of the molecules or reduce ionization suppression in complex mixtures. Ion mobility spectrometry (IM) is another separation dimension that can be combined with mass spectrometry (IM-MS) to partition signal from interferences while providing structural information on molecules of interest. As structural separation facilitated by IM is unique from MS information, IM-MS has been utilized in applications ranging from structural biology analyses, isomeric separations, to molecular class differentiation. Further, IM separations occur on a millisecond timescale such that they are readily coupled between chromatographic and MS stages,6 facilitating information-dense multidimensional separations based on LC-IM-MS methodologies.7–10
In a conventional drift tube ion mobility (DTIM) experiment, ions transverse a uniform electric field region in the presence of a neutral buffer gas such as nitrogen, the ion-neutral interactions provide structurally-selective retention of analyte ions within the drift tube. The measured drift time is primarily a function of experimental parameters such as drift tube length, drift gas pressure, temperature, electric field strength, and masses of both buffer gas species and analyte molecule. Using these parameters, measured drift times in DTIM can be converted into a collision cross section (CCS) value via the fundamental low field IM relationship, referred to as the Mason-Schamp equation as shown below in Eqn (1).11,12
| (1) |
The parameters of this equation are: kb - Boltzmann’s constant, T - drift tube temperature, z – ion charge state, e - charge of an electron, mi – ion mass, mB - buffer gas mass, tA - measured arrival time, E - electric field, L - drift tube length, P - drift tube pressure, and N - buffer gas number density at standard temperature and pressure. A fundamental assumption in Eqn (1) is that the separation is performed under so-called low-field conditions, or that ion heating is not appreciable between collisions.11,13,14 When this assumption is satisfied, the resulting CCS value represents an orientationally-averaged cross sectional area of the molecule and drift gas interaction which is related to the microscopic size and shape of the molecule. Because the Mason-Schamp equation defines CCS as a function of several experimental parameters, these parameters must be well-characterized in order to obtain CCS values with high confidence, necessitating the use of uniform field DTIM instrumentation constructed under rigid mechanical tolerances and operated with high purity gases with well-defined pressure and temperature conditions. With well-characterized experimental parameters and careful experimental design, CCS measurements have been reported with an intralaboratory repeatability of approximately 2% relative standard deviation (RSD) in several large-scale DTIM studies.15–18 In general, CCS reproducibility across multiple laboratories has not been well-studied. Notable exceptions are two recent studies by Astarita and coworkers which have demonstrated ~2% reproducibility of CCS measurements on commercially-available traveling wave instruments (i.e., TWCCSN2).19,20 While this level of precision has been demonstrated to be sufficient for correlation of large molecule experimental values to theoretical candidate structures, e.g., macromolecular complexes and protein assemblies,21–24 recent studies have demonstrated that a significant portion of isomeric structures present in peptides and small molecule systems less than ca. 500 Da exhibit CCS differences within 2% of one another,25,26 necessitating a higher level of CCS precision for differentiation. Thus, in order to have CCS function as a molecular descriptor, the measurement uncertainty needs to be as low as possible to increase the confidence in correlating measurements of unknowns to accepted standard values obtained from database searching.
In this study, we evaluate the reproducibility of DTCCSN2 values from four separate laboratories based in the US and Europe using a commercially-available uniform field DTIM-MS platform. One of the systems, termed the Reference System, was modified with the purpose of achieving an unprecedented level of accuracy in assessing the drift tube length, temperature, and voltage, thus allowing derivation of conditional CCS values which were stringently assessed to understand the major factors that contributed to total uncertainty of drift time measurement. The conditional CCS values were defined as the best estimate of the true value and were used to determine the bias of CCS values obtained for three other DTIM-MS instruments. The CCS values obtained on the Reference System can be extended beyond this study for calibration purposes as they represent DTIM CCS values with the lowest measurement uncertainty to date. Additionally, CCS value reproducibility was explored across the three other DTIM-MS instruments through analysis of chemical standards including metabolites, lipids, peptides, and proteins, which collectively represent a varied range of mass, chemical composition, and structure. The resulting interlaboratory evaluation provides reference CCS values for a wide range of molecules as well as important insights regarding precision in terms of DTIM measurement repeatability and reproducibility across different instruments and laboratories, respectively.
Experimental Section
Materials
Sixty-five chemical standards including metabolites, lipids (fatty acids), peptides (both tryptic and biologically derived), and proteins were obtained from Sigma-Aldrich (St. Louis, MO). Common name and product number are included in Tables S1 and S2. An amino acid standard mix and an ESI low concentration tune mix were obtained from Agilent Technologies (Santa Clara, CA). High purity solvents (methanol, water, isopropyl alcohol, acetonitrile, and acetic acid) were purchased separately from Fisher Scientific (Waltham, MA) or Sigma Aldrich (Vienna, Austria). Additionally, ammonium bicarbonate, iodoacetamide (Fisher) and sequencing grade modified trypsin (Promega, Madison, WI or Sigma Aldrich, Vienna, Austria) were used for cytochrome C protein digestion.
Uniform Field IM-MS Instrumentation
Four commercial DTIM-MS instruments (6560, Agilent Technologies) were utilized for all experimental CCS measurements. The instrument configuration has been described previously,27,28 and is based on a DTIM-MS platform initially developed by Smith and coworkers.29–32 An instrument schematic containing details relevant to this current study is provided in Figure 1. Briefly, this instrument consists of a uniform field IM spectrometer positioned between two ion funnel stages. The forward ion funnel operates as a trapping device which stores and releases ions for the time-correlated drift tube experiment, and following IM separations under uniform electric field conditions, the rear ion funnel subsequently refocuses radially diffuse ions for transmission to the quadrupole time-of-flight (QTOF) mass spectrometer. All CCS measurements in this manuscript were obtained using nitrogen buffer gas.
Figure 1.
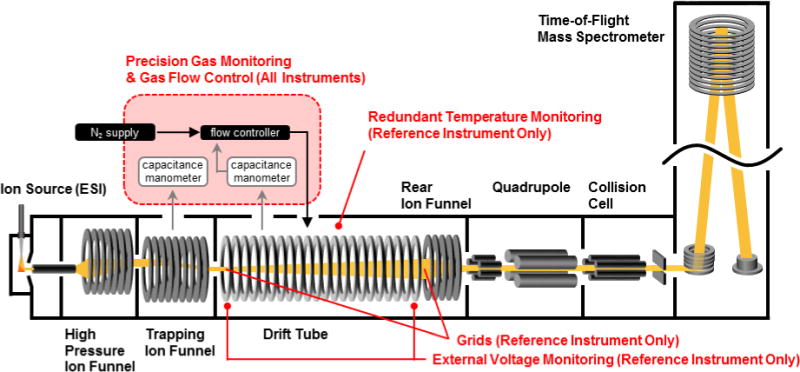
A schematic representation of the commercial IM-MS used in this study. Components labeled in red are specific to the current study.
Four primary design considerations were utilized in the DTIM-MS platform construction to improve measurement precision and control experimental parameters which may contribute to CCS uncertainty. Specifically, (1) measurement and regulation of drift gas pressure was improved by using a commercially available gas kit (Alternate Gas Kit, Agilent) with a precision flow controller (640B, MKS Instruments) that makes adjustments in real time based on absolute pressure readings of the drift tube pressure using a capacitance manometer (CDG 500, Agilent). This capacitance manometer provides a pressure reading accuracy of 0.2% as opposed to the standard Pirani gauge (~5%) configured without the gas kit accessory. (2) The thermocouple used to monitor drift gas temperature (Type K, Omega Engineering) was repositioned to the center of the drift tube to more accurately reflect the mean drift tube temperature. (3) The software was updated to read back the voltage at higher precision and, (4) a standard method was used by each laboratory to acquire CCS data.
IM-MS Reference System
In addition to the modifications made on all DTIM-MS instruments in this study, the instrument housed in the Agilent research and development laboratory at Santa Clara, referred to as the “Reference System”, was further adapted by placing gridded wire mesh at the entrance and exit of the drift tube. By confining with grids, the geometric length of the drift region can be precisely constrained while simultaneously shielding the uniform field drift region from fringing electric fields which otherwise perturb ions as they enter and exit the IM stage. The geometric length of this Reference System was determined to be 78.302 +/− 0.05 cm by precision metrology using a height gauge referenced against a granite surface. In addition to internal instrument readbacks, drift tube temperature of the Reference System was profiled with an external temperature probe (1.1% °C, Fluke 52 II, Fluke Co., Everett, WA) and drift field voltages were independently measured with external digital multimeters (0.025% V+5cnts, U1280, Keysight Technologies, Santa Clara, CA).
Stepped Field CCS Method
The measured arrival time (tA) of ions traversing through the DTIM-MS instrument is a composite of the time ions spend in all regions of the instrument (including ion transfer optics and mass spectrometer) as shown by Eqn (2).33 In addition to the terms introduced in Eqn (1), t0 is the time ions spend outside of the drift region, therefore the time spent exclusively in the drift region needs to be determined (tA-t0).
| (2) |
The conventional method for determining the contribution of t0 in a uniform field DTIM-MS instrument is to perform a linear regression analysis by varying one of the experimental parameters such as L, P, or V. Classically, this was achieved by varying L,34,35 however, it is more straightforward and accurate to vary the electric field used for ion mobility dispersion, which is referred to here as a stepped field method.14 The choice of electric fields used in the time correction will affect both the magnitude and precision of the resulting CCS since at low electric fields the ion mobility distribution is spread across a broad range of times, whereas high electric fields result in narrow ion mobility distributions which may not be adequately sampled. For this study, optimal CCS determination (highest reproducibility with minimal RSD) was observed when utilizing seven electric fields ranging from 10.9–18.5 V/cm, with the field in the rear funnel set as the average field in this range to minimize fringing field effects (step 4 in Tables S3 and S4). Data was acquired for 30 seconds at each field, resulting in a total acquisition time of 210 seconds for the stepped field CCS method. These electric fields and acquisition times were evaluated for nitrogen drift gas pressure of 3.95 Torr in the drift tube and room temperature (ca. 25°C).
Single Field CCS Method
In support of CCS values based on a single electric field, a calibration equation is needed to convert the full arrival time (tA) to a CCS value. Eqn (3) accomplishes this, in which the slope (β) and intercept (tfix) can be determined from the regression of standardized CCS values for tune mix calibrant ions.
| (3) |
The calibration function terms derived from linear regression of Eqn (3) can then be applied to calculate CCS values of unknown compounds measured at the same electric field as long as corresponding m/z and z values are available. This single field calibration derived from the Mason-Schamp equation is analyte and charge state independent, meaning it can be used for any sample as long as both tune mix and analyte ions are acquired under the same experimental settings. In this interlaboratory assessment, both tune mix calibrant ions and chemical standards were acquired at an electric field of 17.3 V/cm for 30 seconds. Further instrument parameters for single field measurements are provided in Table S5.
Estimation of Expanded Uncertainty of Drift Times Measured by the Agilent Reference System
The model equations, error propagation, calculation, and budgeting of total combined uncertainties were based on the official EURACHEM/CITAC guide Quantifying Uncertainty in Analytical Measurement (QUAM).36 A Monte Carlo simulation (n = 50 000 simulations) was used for the propagation of distributions of influence factors utilizing the @RISK Risk Analysis Add-in for Microsoft Excel (Version 7.5.0, Palisade Corporation, Ithaca, USA). Eqn (1) was rearranged into Eqn (4) to set up the model equation for estimating the uncertainty of drift time measurement using the stepped field method.
| (4) |
After a pre-evaluation of all input quantities given in Eqn (4), the parameters in bold, red letters, i.e. L (drift tube length), P (drift tube pressure), T (drift tube gas temperature) and V (drift tube voltage) were identified as major input quantities with regard to their contribution to the uncertainty associated with tA. Table 1 lists the standard uncertainties and distributions of the parameters propagated using the Monte Carlo method.
Table 1.
Experimental parameters considered as input quantities for error propagation via Monte Carlo simulation.
| Parameter | Value | Uncertainty | Unit | Distribution |
|---|---|---|---|---|
| L | 0.78302 | 0.000132 | m | uniform |
| T | 299.4 | 1.1 | K | normal |
| P | 3.945 | 0.00789 | Torr | normal |
| V | 1250.0 | 0.3 | V | uniform |
Results and Discussion
The tune mix and biologically-relevant chemical standards were analyzed to determine the precision under repeatability and reproducibility conditions of measurement of the corresponding CCS values in an international interlaboratory study of the DTIM-MS platform. In the presented study, repeatability conditions entailed performing repeated measurements of a sample on one instrument, whereas reproducibility conditions concerned the measurements of equal samples on different instruments situated in different laboratories.37
In addition to the Reference System located at Agilent Technologies (Santa Clara, CA), the three additional laboratories participating in this study were the University of Natural Resources and Life Sciences (BOKU, Vienna, Austria), Pacific Northwest National Laboratory (PNNL, Richland, WA), and Vanderbilt University (VU, Nashville, TN). Stepped and single field CCS measurements obtained on all instruments will be discussed along with theoretical insight from a Monte Carlo simulation for error propagation.
Establishing the Reference System and Tune Mix Ion CCS Values
Errors in all experimental parameters of the DTIM-MS Reference System were assessed in order to evaluate the upper limits of experimental precision. The weighted average temperature profile of the drift tube was found to have a 1.1°C shift versus the temperature obtained from an independent thermocouple placed at the center of the drift tube, so this shift was applied as a 1.0019 correction factor. Independently measured drift tube potentials in both positive and negative ion modes, yielded a 1.00284 correction factor for positive ions and 1.0013 for negative due to differences in voltage accuracy for the distinct modes. The higher accuracy of drift tube length, temperature and voltage characteristics of the Reference System were subsequently combined to obtain CCS values for all components present in the tune mix in both positive and negative ion modes as shown in Table S6.
To ensure the most comprehensive assessment, CCS measurements of the tune mix were performed using four possible operational modes supported by the DTIM-MS instrument which include: 50–250 m/z stable ion, 50–250 m/z fragile ion, 50–1700 m/z and 100–3200 m/z modes. Measurements were made on three different days with the four different instrument settings resulting in 9–36 CCS measurements for each tune mix ion (as some ions are not present in every operational mode) and the results are provided in Table 2. The corresponding RSD for CCS values obtained under repeatability conditions of measurement on the Reference System (Tables 2, S8 and S9) was found to be less than 0.22% for all tune mix ions. Due to thorough error evaluation, these CCS reference values represent the lowest measurement uncertainty and highest accuracy to date for DTIM analyses. Accordingly, these tune mix ion CCS values were defined as the best estimates of the true value and were subsequently used as reference values in evaluating instrument performance in terms of trueness in this study. This thorough evaluation was undertaken with a view to use these reference CCS values as calibrants for universal single-field measurements and are presented as reference values to support broad CCS standardization. Therefore, these DTIM CCS values not only standardize single field CCS measurements made on the IM platform used in this study, but can be extended to homebuilt DTIM instruments as a reference and to non DTIM platforms where CCS calculations require DTIM CCS measurements as a basis for calibration.
Table 2.
Reference System CCS Values for Tune Mix Ions
| Tune Mix Ions – Positive Mode | |||
|---|---|---|---|
| m/z | CCS (Å2) | %RSD (intralab.) | n |
| 118 | 121.30 ± 0.20 | 0.17% | 27 |
| 322 | 153.73 ± 0.23 | 0.15% | 36 |
| 622 | 202.96 ± 0.27 | 0.14% | 36 |
| 922 | 243.64 ± 0.30 | 0.12% | 36 |
| 1222 | 282.20 ± 0.47 | 0.17% | 36 |
| 1522 | 316.96 ± 0.60 | 0.19% | 36 |
| 1822 | 351.25 ± 0.62 | 0.18% | 9 |
| 2122 | 383.03 ± 0.64 | 0.17% | 9 |
| 2422 | 412.96 ± 0.58 | 0.14% | 9 |
| 2722 | 441.21 ± 0.59 | 0.13% | 9 |
| Tune Mix Ions – Negative Mode | |||
| m/z | CCS (Å2) | %RSD (intralab.) | n |
| 113 | 108.23 ± 0.20 | 0.19% | 9 |
| 302 | 140.04 ± 0.29 | 0.21% | 36 |
| 602 | 180.77 ± 0.21 | 0.12% | 36 |
| 1034 | 255.34 ± 0.32 | 0.13% | 36 |
| 1334 | 284.76 ± 0.31 | 0.11% | 36 |
| 1634 | 319.03 ± 0.70 | 0.22% | 36 |
| 1934 | 352.55 ± 0.27 | 0.08% | 9 |
| 2234 | 380.74 ± 0.31 | 0.08% | 9 |
| 2534 | 412.99 ± 0.31 | 0.07% | 9 |
| 2834 | 432.62 ± 0.35 | 0.08% | 9 |
As only the Reference System benefited from a precise determination of drift tube length, it was necessary to arrive at a calibrated or “effective” length for the three other systems. To establish this effective length stepped field results of these calibrant ions from BOKU, PNNL, and VU were compared and normalized against the Reference System (Agilent). This correction was accomplished by calculating an effective length based on the average of 1413 discrete CCS measurements of all tune mix ions obtained from the three laboratories on three different days across the four different tuning modes, and is thus considered applicable to all versions of this instrument produced under the respective model number (G6560A). The resulting effective length was determined to be 78.24 ± 0.16 cm, which differs from the specified production length (78.12 cm) by 0.12 cm; and is in general agreement with the anticipated forward field penetration into the tube lens prior to ions reaching thermal equilibrium.38 More details on the effective length determination for the three laboratories are included in Figure S1 and Table S7.
CCS values obtained from BOKU, PNNL, and VU for the tune mix ions are listed in Table S8 and all values are characterized by an interlaboratory reproducibility of better than 0.50% RSD. Bias from CCS measurements obtained on the Reference System was found to be within 0.74% for all 20 tune mix ions. For the 10 tune mix ions between 300–1700 m/z which are observed using all four instrument modes, reproducibility is within 0.22% RSD and bias from the Reference System within 0.44% across the three laboratories. CCS values from each laboratory using all studied tuning modes can be found in Tables S9 and S10.
Theoretical Assessment of Expanded Uncertainty of Drift Time Measurement
One aim of this study was the assessment of conditional CCS reference values derived from stepped field measurements on the Reference System, as these values are used for the single field CCS workflow and suggested as standard CCS values for the broader IM community. Uncertainty estimation is a central element for identifying the major factors (i.e. input quantities) influencing the total uncertainty of a measurement process and the derived values. Eqn (4) was utilized as a model equation for assessment of the contribution of all input quantities to the uncertainty of drift time measurement by the stepped field CCS method. Applying Eqn (4) to a given DTCCSN2 value of 152.78 Å2 revealed a drift time of 16.84 ms under specified experimental parameters. The Monte Carlo simulation yielded in a normal distribution with a combined uncertainty of 0.05 ms corresponding to a relative uncertainty of 0.27%. In the theoretical concept of measurement uncertainty budgeting, an additional coverage factor of 2 is introduced to capture a 95% (2σ) level of confidence resulting in an expanded uncertainty of 0.54%. Essential information which can be derived from this uncertainty assessment via error propagation is the uncertainty budget which quantifies the relative contribution of each input quantity to the total combined uncertainty of the measurement. Drift gas pressure and temperature are found to be the primary input quantities which contribute to the uncertainty in the IM measurement (48% and 44%, respectively). Since the contribution of the drift tube voltage and the length of the drift tube is minor (both 4%) the uncertainty budgeting indicates that further reduction of the distribution of P and T in the drift tube can lead to a significant reduction of the experimental uncertainty of the DTCCS. It should be noted that complete CCS uncertainty is influenced additionally by assumptions with the Mason-Schamp equation, but 0.54% represents the td uncertainty and is a reflection of the instrument parameters that influence CCS measurements.
Stepped Field CCS Precision and Trueness of Biological Standards
Following evaluation of the tune mix ions and establishment of the standardized effective length parameter, DTCCSN2 values for a set of biological standards were evaluated across all four laboratories using the stepped field method. When selecting analytes for this study, the focus was to look at a broad range of analytes from small metabolites to large proteins. While all the analytes have biological origin, the results should extend to other classes of molecules as Mason-Schamp theory is not class specific. Both positive and negative ions were examined, corresponding to protonated, sodiated and deprotonated species. Figure 2 maps the conformational space (m/z versus CCS) of the molecules surveyed in this study, using CCS averaged from three laboratories (BOKU, PNNL, and VU). Independent results for all four laboratories can be found in Table S11. In Figure 2A, higher charge state ions observed for peptides are enclosed with grey regions to highlight their respective conformational space trends. Tune mix ions span a large mass range from 113–2834 Da, with a CCS range from 108.2–441.2 Å2. These molecules tend to adopt compact conformations in the gas phase and thus fall within a low region of conformational space as previously observed.39 Peptides and proteins in Figure 2A and 2B exhibit cross sectional expansion with higher charge states as has been consistently observed for anhydrous peptides and proteins. Figure 2C is an expansion of the low mass region which contains the small mass ions. Fatty acids fall within a higher region of conformational space due to their adoption of extended structures in the gas phase. However, metabolite CCS values do not exhibit any generalized conformational space trends due to their relatively small size and heterogeneous atomic compositions.
Figure 2.
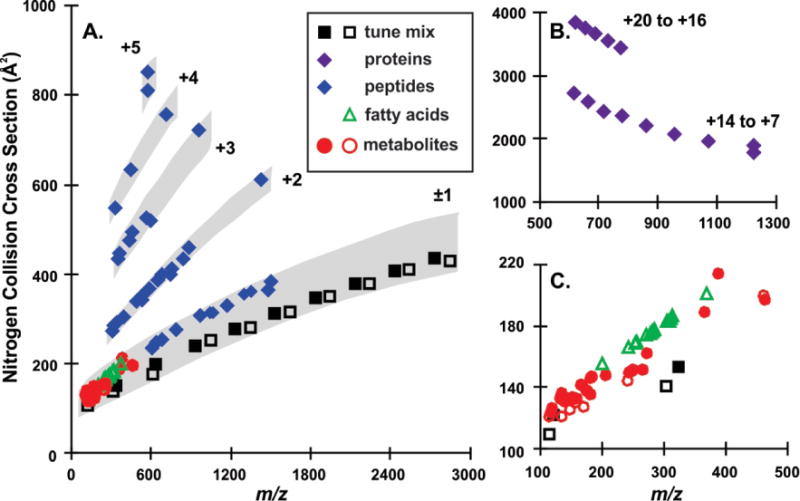
A conformational space map of the stepped field CCS values for the biological standards and calibrant ions. In A. tune mix ions and peptides are shown with insets in B. for the proteins and in C. for the smaller ions including fatty acids and metabolites. Positive ions are represented with filled symbols and negative ions with open symbols.
Regarding interlaboratory precision under reproducibility conditions, an average of 0.30 ± 0.16% RSD across all biological samples was achieved for the three laboratories in this study. The distribution of RSD across the standards analyzed in this study is shown in Figure 3A. The majority of standards demonstrate RSD values within 0.4% for metabolites, fatty acids, peptides, and proteins. Average RSD results for each biological classes are presented in Figure 3B. Fatty acid samples have the lowest RSD at 0.24 ± 0.07%, while tryptic peptides exhibit the highest RSD at 0.48 ± 0.22%. The tryptic peptides show a higher RSD in comparison to the commercially available peptide standards ostensibly owing to variations arising from the digestion of cytochrome c at each of the three laboratories. The average reproducibility of 0.35 ± 0.12% RSD determined for proteins and 0.26 ± 0.14% for peptide standards is a surprisingly favorable result despite their large size and conformational diversity.
Figure 3.

Distribution plots and bar graphs are used to analyze the results of the stepped field CCS work. In A. the distribution of relative standard deviation (RSD) across the standards analyzed in this study is plotted according to biological class and in B. the average RSD for each class is shown. In C. the distribution of bias to the reference system is shown for each laboratory (green for BOKU, orange for PNNL, and yellow for Vanderbilt). The bar graph in D. shows the average bias for each biological class for each lab.
Combining results from all 3 laboratories, CCS values for biomolecules have an average bias of 0.34 ± 0.28% when compared to the values obtained from the Reference System. An overlay of individual laboratory results is presented in the distribution plot in Figure 3C where results for BOKU are shown in green, PNNL in orange, and Vanderbilt in yellow. The trends observed in this plot are similar for all three laboratories with both BOKU and Vanderbilt having over 80% of the standards within 0.5% bias from the reference system while PNNL was only slightly lower at 70%. The average biases in Figure 3D show that the tryptic peptides showed the greatest variation across the three labs. While BOKU, PNNL, and Vanderbilt all performed the digest separately, the digest from Vanderbilt was used to determine CCS values on the Reference System. Therefore these variations most likely arise from the sample preparation as opposed to the measurement system. Fatty acids and positive metabolite ions exhibit the smallest average bias when compared to the Reference System, with percent errors of 0.26 ± 0.05% and 0.25 ± 0.05%, respectively. Negative metabolite ions and proteins exhibit larger observed deviations from the Reference System at 0.33 ± 0.05% and 0.51 ± 0.06% respectively, but still have low error. Both metabolites (low mass) and proteins (high mass) represent CCS measurements which fall on the lower and upper ends of the range used for CCS normalization and thus it is expected to see larger deviations in their CCS from the Reference System. Comparison of these results with theoretically calculated CCS values based on conformational sampling is provided in Figures S6–20. Emerging numerical methods such as data-intensive machine learning approaches offer promising avenues to address CCS prediction of small molecules.40,41 Future improvements in numerical methods and traditional approaches that provide structural insight rely on highly accurate experimental CCS values illustrated here to improve parametrization for a wider molecular space.
Single Field CCS Precision and Trueness of Biological Standards
Samples in analytical workflows are typically present in complex matrices which often benefit from, if not require, chromatographic separations prior to analysis by IM-MS. When chromatographic separations are preformed prior to IM-MS analysis, traditional stepped field CCS methods are not practically feasible. A calibrated single field CCS method is needed to interface with GC and LC separations and is therefore critical for utilizing CCS values as an additional identifier in analytical workflows. As this single field method requires calibration, comparison of single field CCS values to traditional stepped field CCS values are presented in this section.
Results from the single field CCS method (Table S12) demonstrated an overall average interlaboratory RSD of 0.38 ± 0.19% for the three laboratories. Figure 4 compares the agreement between single field CCS values from each laboratory to stepped field CCS values from the Reference System across different biological classes. Results for each individual analyte for each laboratory are shown in Figure 4A and absolute differences between single and stepped field results are plotted in Figure 4B. In general, a positive bias was observed for singly charged ions and a negative bias for higher charged ions, although it is noted here that the bias is not dependent on the magnitude of the charge state as similar biases are observed for ions ranging from +2 to +20 charge states. For the fatty acids and positive metabolite ions, an average bias of 0.27 ± 0.18% and 0.44 ± 0.28% were observed, respectively. For peptides and proteins, the bias between single and stepped field results is higher at 0.53 ± 0.44% and 0.68 ± 0.36% and is attributed to multiple unresolved conformations that affect peak centroiding. Additionally, the higher biases for peptides at PNNL mimics the stepped field results for tryptic peptides and has been previously attributed to variations arising from individual peptide digestions. Negative metabolite ions exhibited the greatest average bias of 0.79 ± 0.34%, which was expected as the lowest negative ion tune mix component used in the reference set is m/z 301 in contrast to the positive ion tune mix components, which contain reference values as low as m/z 118. Although TFA (which is present in the tune mix) is commonly utilized for mass calibration in negative ion mode (m/z 113), TFA was observed in the DTIM analysis to form multiple resolved clusters which are sensitive to instrument settings and isolation of the monomer proved challenging. Thus TFA was not utilized as a reference CCS component for the single field calibration parameters. It is also interesting to note that the same bias trends were observed across all three laboratories in this study with an average, absolute bias of 0.55%, 0.58%, and 0.50% for BOKU, PNNL, and Vanderbilt, respectively. The overall excellent agreement between single and stepped field CCS values supports the use of the single field method for large-scale determination of CCS using analytical methods such as LC and GC separations. With a mean bias and RSDs of less than 1% observed for a broad range of compound classes (Figure 3B), the single field calibration method and equation can be deployed across a broad range of compound classes, an attribute which is key for unknown identification workflows. It is, however, acknowledged that the DTIM stepped field method is still the most accurate means of determining analyte CCS.
Figure 4.
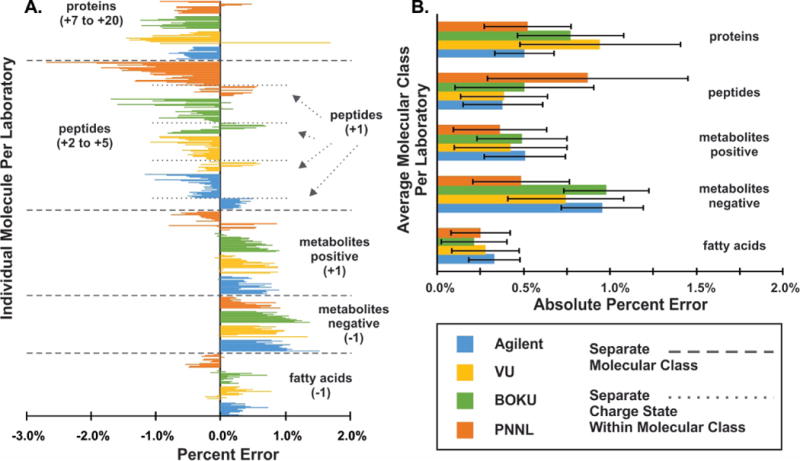
These bar graphs show the bias of single field CCS values obtained on all instruments when compared to the stepped field CCS values obtained on the Reference System. In A. the average absolute percent error for each class of biomolecules is shown for the four laboratories and in B. the percent error is shown for each biological standard for each lab.
Conclusions
This study demonstrates that interlaboratory DTCCSN2 RSD of 0.29% is achievable with current DTIM-MS technologies and instrumentation for a wide range of molecular classes, masses, and charge states in both positive and negative modes. While interlaboratory reproducibility is necessary in promoting CCS as a molecular identifier in analytical workflows, standardization to CCS values with low measurement uncertainty is also critical. The highly characterized Reference System described in this work offers fundamental insight towards achieving higher levels of precision as well as a basis for trueness in CCS values. Traditional stepped field DTCCSN2 values and calibrated single field DTCCSN2 values were reported with average biases of 0.34% and 0.54%, respectively, to the standardized conditional DTCCSN2 values from the Reference System. This significant improvement over previously reported 2% reproducibility for CCS measurements demonstrates the high precision possible with DTIM and directly benefits the use of CCS as a molecular descriptor for numerous applications including untargeted screening workflows. Finally, the CCS values presented in this work from the Reference DTIM System support broad CCS standardization for calibrated single field methods across all ion mobility separation technologies.
Supplementary Material
Acknowledgments
S.M.S, J.C.M. and J.A.M greatfully acknowledge the Center for Innovative Technology at Vanderbilt University for use of their instrumentation and resources. Financial support for this work at Vanderbilt was provided by the National Institutes of Health (NIH R01GM092218), U.S. Army Research Office and Defense Advanced Research Projects Agency (DARPA) under Cooperative Agreement Number W911 NF-14-2-0022, and U.S. Environmental Protection Agency (EPA) under Assistance Agreement No. 83573601. This work has not been formally reviewed by EPA and EPA does not endorse any products or commercial services mentioned in this publication. The views expressed in this document are solely those of the authors and should not be interpreted as representing the official policies, either expressed or implied, of the EPA, the Army Research Office, DARPA, or the U.S. Government. Additionally, we acknowledge the Vanderbilt Center for Structural Biology for computational support. E.S.B. would like to acknowledge support from the National Institute of Environmental Health Sciences of the NIH (R01 ES022190). PNNL work was performed in the W. R. Wiley Environmental Molecular Sciences Laboratory (EMSL), a DOE national scientific user facility at the Pacific Northwest National Laboratory (PNNL). PNNL is operated by Battelle for the DOE under contract DE-AC05-76RL0 1830. T.J.C., T.M. and S.H. would like to thank the Vienna Business Agency for funding, as well as EQ BOKU VIBT GmbH for providing mass spectrometry instrumentation.
Footnotes
Supporting Information Available: Sample information, detailed instrument settings, CCS values for each individual laboratory for tune mix and biological standards, in-depth RSD and bias analysis of CCS results, and theoretical CCS modeling results
References
- 1.Wilcken B, Wiley V, Hammond J, Carpenter K. N Engl J Med. 2003;348:2304–2312. doi: 10.1056/NEJMoa025225. [DOI] [PubMed] [Google Scholar]
- 2.Gros M, Petrović M, Barceló D. Talanta. 2006;70:678–690. doi: 10.1016/j.talanta.2006.05.024. [DOI] [PubMed] [Google Scholar]
- 3.Dettmer K, Aronov PA, Hammock BD. Mass Spectrom Rev. 2007;26:51–78. doi: 10.1002/mas.20108. [DOI] [PMC free article] [PubMed] [Google Scholar]
- 4.Addona TA, Abbatiello SE, Schilling B, Skates SJ, Mani DR, Bunk DM, Spiegelman CH, Zimmerman LJ, Ham AJL, Keshishian H, Hall SC, Allen S, Blackman RK, Borchers CH, Buck C, Cardasis HL, Cusack MP, Dodder NG, Gibson BW, Held JM, et al. Nat Biotech. 2009;27:633–641. doi: 10.1038/nbt.1546. [DOI] [PMC free article] [PubMed] [Google Scholar]
- 5.Lebedev AT. Ann Rev Anal Chem. 2013;6:163–189. doi: 10.1146/annurev-anchem-062012-092604. [DOI] [PubMed] [Google Scholar]
- 6.May JC, McLean JA. Anal Chem. 2015;87:1422–1436. doi: 10.1021/ac504720m. [DOI] [PMC free article] [PubMed] [Google Scholar]
- 7.Valentine SJ, Kulchania M, Barnes CAS, Clemmer DE. Int J Mass Spectrom. 2001;212:97–109. [Google Scholar]
- 8.McLean JA, Ruotolo BT, Gillig KJ, Russell DH. Int J Mass Spectrom. 2005;240:301–315. [Google Scholar]
- 9.Causon TJ, Hann S. J Chromatogr A. 2015;1416:47–56. doi: 10.1016/j.chroma.2015.09.009. [DOI] [PubMed] [Google Scholar]
- 10.May JC, McLean JA. Annu Rev Anal Chem. 2016;9:387–409. doi: 10.1146/annurev-anchem-071015-041734. [DOI] [PMC free article] [PubMed] [Google Scholar]
- 11.Mason, E. A.; McDaniel, E. W.; John Wiley & Sons: New York, 1988.
- 12.Siems WF, Viehland LA, Hill HH. Anal Chem. 2012;84:9782–9791. doi: 10.1021/ac301779s. [DOI] [PubMed] [Google Scholar]
- 13.McDaniel EW, Mason EA. The Mobility and Diffusion of Ions in Gases (Wiley Series in Plasma Physics) John Wiley & Sons; New York: 1973. p. 384. [Google Scholar]
- 14.McLean JA, Schultz Jackson A, Woods Amina S. Electrospray and MALDI mass spectrometry: fundamentals, instrumentation, practicalities, and biological applications. 2nd. John Wiley & Sons: New York: 2011. [Google Scholar]
- 15.Valentine SJ, Counterman AE, Clemmer DE. J Am Soc Mass Spectrom. 1999;10:1188–1211. doi: 10.1016/S1044-0305(99)00079-3. [DOI] [PubMed] [Google Scholar]
- 16.Fenn LS, Kliman M, Mahsut A, Zhao SR, McLean JA. Anal Bioanal Chem. 2009;394:235–244. doi: 10.1007/s00216-009-2666-3. [DOI] [PMC free article] [PubMed] [Google Scholar]
- 17.Dilger JM, Valentine SJ, Glover MS, Ewing MA, Clemmer DE. Int J Mass Spectrom. 2012:330–332. 35–45. [Google Scholar]
- 18.May JC, Morris CB, McLean JA. Anal Chem. 2016;89:1032–1044. doi: 10.1021/acs.analchem.6b04905. [DOI] [PMC free article] [PubMed] [Google Scholar]
- 19.Paglia G, Williams JP, Menikarachchi L, Thompson JW, Tyldesley-Worster R, Halldoŕsson Sd, Rolfsson O, Moseley A, Grant D, Langridge J, Palsson BO, Astarita G. Anal Chem. 2014;86:3985–3993. doi: 10.1021/ac500405x. [DOI] [PMC free article] [PubMed] [Google Scholar]
- 20.Paglia G, Angel P, Williams JP, Richardson K, Olivos HJ, Thompson JW, Menikarachchi L, Lai S, Walsh C, Moseley A, Plumb RS, Grant DF, Palsson BO, Langridge J, Geromanos S, Astarita G. Anal Chem. 2015;87:1137–1144. doi: 10.1021/ac503715v. [DOI] [PMC free article] [PubMed] [Google Scholar]
- 21.Anderson SE, Baker ES, Mitchell C, Haddad TS, Bowers MT. Chem Mater. 2005;17:2537–2545. [Google Scholar]
- 22.Ruotolo BT, Benesch JLP, Sandercock AM, Hyung S-J, Robinson CV. Nat Protocols. 2008;3:1139–1152. doi: 10.1038/nprot.2008.78. [DOI] [PubMed] [Google Scholar]
- 23.Jurneczko E, Barran PE. Analyst. 2011;136:20–28. doi: 10.1039/c0an00373e. [DOI] [PubMed] [Google Scholar]
- 24.Zhong Y, Hyung S-J, Ruotolo BT. Expert Rev Proteomic. 2012;9:47–58. doi: 10.1586/epr.11.75. [DOI] [PMC free article] [PubMed] [Google Scholar]
- 25.Wu C, Siems WF, Klasmeier J, Hill HH., Jr Anal Chem. 2000;72:391–395. doi: 10.1021/ac990601c. [DOI] [PubMed] [Google Scholar]
- 26.Dodds JN, May JC, McLean JA. Anal Chem. 2017;89:952–959. doi: 10.1021/acs.analchem.6b04171. [DOI] [PMC free article] [PubMed] [Google Scholar]
- 27.May JC, Goodwin CR, Lareau NM, Leaptrot KL, Morris CB, Kurulugama RT, Mordehai A, Klein C, Barry W, Darland E, Overney G, Imatani K, Stafford GC, Fjeldsted JC, McLean JA. Anal Chem. 2014;86:2107–2116. doi: 10.1021/ac4038448. [DOI] [PMC free article] [PubMed] [Google Scholar]
- 28.May JC, Dodds JN, Kurulugama RT, Stafford GC, Fjeldsted JC, McLean JA. Analyst. 2015;140:6824–6833. doi: 10.1039/c5an00923e. [DOI] [PMC free article] [PubMed] [Google Scholar]
- 29.Tang K, Shvartsburg AA, Lee H-N, Prior DC, Buschbach MA, Li F, Tolmachev AV, Anderson GA, Smith RD. Anal Chem. 2005;77:3330–3339. doi: 10.1021/ac048315a. [DOI] [PMC free article] [PubMed] [Google Scholar]
- 30.Ibrahim YM, Tang K, Tolmachev AV, Shvartsburg AA, Smith RD. J Am Soc Mass Spectrom. 2006;17:1299–1305. doi: 10.1016/j.jasms.2006.06.005. [DOI] [PMC free article] [PubMed] [Google Scholar]
- 31.Ibrahim YM, Baker ES, Danielson WF, 3rd, Norheim RV, Prior DC, Anderson GA, Belov ME, Smith RD. Int J Mass Spectrom. 2015;377:655–662. doi: 10.1016/j.ijms.2014.07.034. [DOI] [PMC free article] [PubMed] [Google Scholar]
- 32.Baker ES, Clowers BH, Li F, Tang K, Tolmachev AV, Prior DC, Belov ME, Smith RD. J Am Soc Mass Spectrom. 2007;18:1176–1187. doi: 10.1016/j.jasms.2007.03.031. [DOI] [PMC free article] [PubMed] [Google Scholar]
- 33.Mason EA, McDaniel EW. Transport Properties of Ions in Gases. Wiley; New York: 1988. [Google Scholar]
- 34.McDaniel EW, Martin DW, Barnes WS. Rev Sci Instrum. 1962;33:2–7. [Google Scholar]
- 35.Moseley JT, Gatland IR, Martin DW, McDaniel EW. Phys Rev. 1969;178:234. [Google Scholar]
- 36.Ellison SLR, Williams A. 2012 Available from www.eurachem.org. accessed on 04/10/2017.
- 37.Bipm IEC, Ifcc I, Iso I, Iupap O. Joint Committee for Guides in Metrology, JCGM. 2008:100. accessed on 04/10/2017. [Google Scholar]
- 38.Kemper PR, Bowers MT. J Am Soc Mass Spectrom. 1990;1:197–207. [Google Scholar]
- 39.Hines KM, May JC, McLean JA, Xu L. Anal Chem. 2016;88:7329–7336. doi: 10.1021/acs.analchem.6b01728. [DOI] [PMC free article] [PubMed] [Google Scholar]
- 40.Zhou Z, Shen X, Tu J, Zhu Z-J. Anal Chem. 2016;88:11084–11091. doi: 10.1021/acs.analchem.6b03091. [DOI] [PubMed] [Google Scholar]
- 41.Metz TO, Baker ES, Schymanski EL, Renslow RS, Thomas DG, Causon TJ, Webb IK, Hann S, Smith RD, Teeguarden JG. Bioanalysis. 2017;9:81–98. doi: 10.4155/bio-2016-0244. [DOI] [PMC free article] [PubMed] [Google Scholar]
Associated Data
This section collects any data citations, data availability statements, or supplementary materials included in this article.