

Abstract
The human apical sodium dependent bile acid transporter (ASBT) is a validated drug target and can be employed to increase oral bioavailability of various drug conjugates. The aim of the present study was to investigate the chemical space around the 24-position of bile acids that influences both inhibition and uptake by the transporter. A series of 27 aminopyridine and aminophenol conjugates of glutamyl-chenodeoxycholate were synthesized and their ASBT inhibition and transport kinetics (parameterized as Ki, Kt, and Jmax) measured using stably transfected ASBT-MDCK cells. All conjugates were potent ASBT inhibitors. Monoanionic conjugates exhibited higher inhibition potency than neutral conjugates. However, neutral conjugates and chloro-substituted monoanionic conjugates were not substrates, or at least not apparent substrates. Kinetic analysis of substrates indicated that similar values for Ki and Kt implicate substrate binding to ASBT as the rate-limiting step. Using 3D-QSAR, four inhibition models and one transport efficiency model were developed. Steric fields dominated in CoMFA models, whereas hydrophobic fields dominated CoMSIA models. The inhibition models showed that a hydrophobic or bulky substitute on 2 or 6 position of a 3-aminopyridine ring enhanced activity, while a hydrophobic group on 5 position was detrimental. Overall, steric and hydrophobic features around the 24 position of the sterol nucleus strongly influenced bile acid conjugates’ interaction with ASBT. The relative location of the pyridine nitrogen and substituent groups also modulated binding.
Keywords: ASBT, SLC10A2, Bile acid Transporter, 3D-QSAR, CoMFA, CoMSIA
INTRODUCTION
Bile acids are primarily absorbed in the terminal ileum via the apical sodium-dependent bile acid transporter (ASBT; SLC10A2) (1,2), which displays high transport capacity and efficiency (3). This transporter may also be employed as a prodrug target for enhancing oral drug bioavailability of poorly permeating compounds, where drug is conjugated to bile acid and bile acid allows for the conjugate to be taken up by ASBT (3). However, the lack of knowledge of ASBT substrate requirements has impeded progress in rational prodrug design to target ASBT. Structure-activity studies have largely employed ASBT inhibition rather than substrate uptake, perhaps due to inhibition studies being more facile. Various transport studies have been performed over 30 years using animal tissues and organs, but the interpretability of the bile acid transport by ASBT has been confounded by other intestinal and hepatic transporters (4).
Our laboratory previously developed a stably transfected ASBT-MDCK monolayer to evaluate ASBT-mediated transport of solutes (5). Using a series of native bile acids to evaluate ASBT binding properties, we found that chenodeoxycholate (CDCA) was the most potent inhibitor among native bile acids and conjugation through C-24 of CDCA with taurine or glycine enhanced binding affinity (6). A series of C-24 CDCA conjugates were then synthesized using glutamic acid or lysine as a linker, and the results showed that only conjugates with one negative charge and a single bulky ester substituent proximal or distal to the C-24 region were ASBT substrates (7). Furthermore, a C-24 bile acid prodrug of valacyclovir enhanced oral bioavailability by 2-fold, compared to acyclovir in rats (8). Overall, ASBT permits bile acid conjugates with substitutions at the C-24 side chain region, but the chemistry space extending beyond the C-24 region needs to be further explored, especially for ASBT substrates. In fact, several quantitative structure-activity relationships studies have been reported for general ASBT inhibition. Thus, we sought to apply 3D-QSAR approaches to elucidate the substrate requirements in the space extending beyond C-24 region using Comparative Molecular Field Analysis (CoMFA) (9) and Comparative Molecular Similarity Indices Analysis (CoMSIA) (10). These algorithms are particularly useful when the structure of a target protein is unknown and may be applied for lead compound optimization (11).
The objective of this study was to synthesize and characterize substrate uptake and inhibition properties of C-24 bile acid probe moiety conjugates, and subsequently develop comprehensive 3D-QSAR models to elucidate the substrate requirements on positions beyond C-24 region. Pyridine and phenol are common chemical scaffolds in drug structures (12). Therefore, C-24 aminopyridine and aminophenol conjugates of glutamyl-CDCA were synthesized and their inhibition and uptake kinetics were evaluated. Pyridine and phenol probes were functionalized using different ring substitutions in order to study chemical substituent effect on ASBT inhibition and uptake. Using a combination of inhibition and uptake studies, we differentiate ASBT inhibitors from substrates and developed 3D-QSAR models for both classes of bile analogs. These studies provide new insight into the substrate requirements for ASBT uptake and shed light on the design of bile acid conjugates that can increase intestinal drug permeability and bioavailability.
EXPERIMENTAL PROCEDURES
Materials
[3H]-Taurocholic acid was purchased from Perkin Elmer (Waltham, MA). Taurocholic acid was purchased from Sigma (St. Louis, MO). CDCA was obtained from TCI America (Portland, OR). Protected glutamic acid analogs were from Novabiochem (Gibbstown, NJ). Aminopyridine analogs were purchased from Sigma Aldrich (St. Louis, MO) and Matrix Scientific (Columbia, SC). Fetal bovine serum (FBS), trypsin, and Dulbecco’s modified Eagle’s medium (DMEM) were purchased from Invitrogen Corporation (Carlsbad, CA). All other reagents and chemicals were of the highest purity commercially available.
Synthetic Procedures
A series of aminopyridines were conjugated to CDCA using glutamic acid as a linker. Two synthetic approaches were employed (Scheme 1). Among the native bile acids, CDCA was selected on the basis of its favorable transport across ASBT-MDCK monolayers (6).
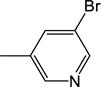
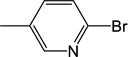
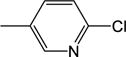
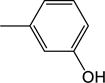
Scheme 1.
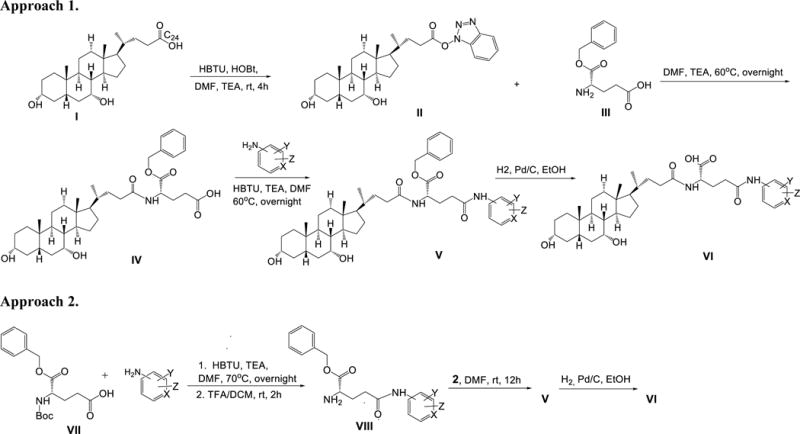
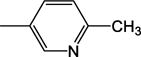
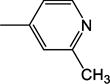
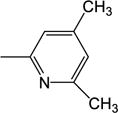
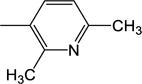
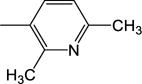
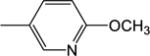
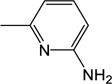
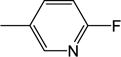
General synthetic approaches to obtain CDCA-glutamyl-pyridine or CDCA-glytamyl-phenol conjugates. X=N, H; Y=H, CH3, OCH3, NH2, OH, Cl, F, Br; Z=H, CH3
N-hydroxybenzotriazole (HOBT) Esters of CDCA (II)
CDCA I (5g) was activated with HOBT (0.5 eq) and HBTU (1.2 mmol) in 20 mL of anhydrous dimethylformamide (DMF) along with 1.2 eq of triethylamine (TEA) at RT for 4 h to form CDCA-OBt ester II. The reaction was terminated by adding 50 mL of water. Subsequently, the reaction mixture was extracted with ethyl acetate (EtOAc) (3×). The combined organic layer was washed with brine (1×), dried with anhydrous sodium sulfate, filtered, and evaporated under vacuum to yield a white fluffy solid CDCA-OBt ester II (90% yield). Mass spectrometry (MS) showed appropriate peaks: [M+H]+ 510.81, [M+Na]+ 532.81. II was used in approach A and B.
Synthesis of CDCA-α-Benzyl-Glutamyl-probe (V)
Approach 1 was applied as shown in Scheme 1. II (5.0 g) was reacted with to 0.8 eq of L-α-benzyl glutamic acid III in 30 mL of anhydrous DMF along with 1 eq of TEA at 60 °C overnight. Reaction was terminated by adding 50 mL of water. The reaction mixture was extracted with EtOAc (3×). The combined organic layer was washed with 1N HCl (3x), and brine (1x). Then the organic extract was dried with anhydrous sodium sulfate, filtered, and evaporated under vacuum to yield off-white solid glutamyl-CDCA conjugates IV (75% yield). MS showed appropriate peaks: [M+H]+ 612.81, [M+Na]+ 634.81.
IV (1.0 g) was activated with 1.2 eq of HBTU in 15 mL of anhydrous DMF along with 1.2 eq of TEA for 10 min followed by addition of appropriate aminopyridine or aminophenol probes at 60 °C overnight. Reaction was terminated by adding 30 mL of water. The reaction mixture was extracted with EtOAc (3x). The combined organic layer was washed with 1N HCl (3x), 1N NaOH (3x), and brine (1x). Then the organic extract was dried with anhydrous sodium sulfate and filtered. The EtOAc extract was evaporated under vacuum to yield thick yellow oil. The crude product was further purified by silica gel column chromatography using a mobile phase of EtOAc and hexane (95:5). Fractions were collected and solvent evaporated to yield the neutral conjugate V. Purity of the conjugate was characterized by TLC and MS techniques.
Approach 2 was applied as shown in Scheme 1. First, 2.0 g of N-boc-α-benzyl-glutamic acid VII was coupled to aminopyridine or aminophenol probes (1.1 eq) using HBTU (1.2 eq) as coupling reagents in 10 mL of anhydrous DMF along with of 2.2 eq of TEA at 70 °C for overnight. Reaction was terminated by adding 30 mL of water. The reaction mixture was extracted with EtOAc (3x). The combined organic layer was washed with 1N HCl (3x), 1 N NaOH (3×), and brine (1×). Then the organic extract was dried with anhydrous sodium sulfate, filtered, and evaporated under vacuum to yield orange oil. The crude product was further purified by silica gel column chromatography using a mobile phase of EtOAc and hexane (90:10). Fractions were collected and solvent evaporated to give a solid white intermediate. Purity of the intermediate conjugates was characterized by TLC and MS techniques. The intermediate was then selectively N-deprotected using 25% trifluoroacetic acid (TFA) in anhydrous dichloromethane (DCM) at RT for 1–2 h. Solvent was evaporated under vacuum to yield off-white solid VIII.
VIII (1.0 g) were reacted with 1.2 eq of CDCA-OBt ester II, along with 1 eq of TEA in 15 mL of anhydrous DMF at RT overnight. Reaction was terminated by adding 50 mL of water. The reaction mixture was purified as described above (see synthetic approach I) to yield the neutral conjugate V.
Synthesis of CDCD-Glutamyl-probe (VI)
The neutral conjugates V were subjected to catalytic hydrogenation for the removal of the benzyl ester using 10% Pd/charcoal in ethanol at 50 psi overnight. Suspension was filtered through Celite® and solvent evaporated under vacuum to yield the final conjugates VI. For chloro and bromo substituted neutral conjugates V, the benzyl ester was removed in 10 mL 33% hydrobromic acid in acetic acid at RT for 2 h. Reaction was terminated by adding 30 mL of EtOAc. The reaction mixture was extracted with water (3x). The organic layer was washed with brine (1×), dried with anhydrous sodium sulfate, filtered, and evaporated under vacuum to yield the final conjugates VI.
Characterization of Conjugates
Identity and purity of bile acid conjugates was characterized by TLC, MS, and 1H-NMR (proton, COSY). MS was performed on a LCQ ESI-MS (Thermo Fisher Scientific Inc., Waltham, MA). 1H-NMR spectra were recorded on a Varian Inova 500 MHz (Varian Inc., Palo Alto, CA). The mass spectra in all cases gave a molecular ion in agreement with the calculated mass of the conjugates. No CDCA impurity was detected in any final conjugate (13). LC-MS/MS and 1H-NMR results are compiled in Supporting Information Table S1. The chemical shifts are reported in parts per million (ppm) relative to tetramethylsilane (TMS) (δ=0.0 ppm).
Cell Culture
Stably transfected ASBT-MDCK cells were grown as previously described (14). Briefly, cells were grown at 37 °C, 90% relative humidity, 5% CO2 atmosphere, and fed every two days. Media comprised DMEM supplemented with 10% FBS, 50 units/mL penicillin, and 50 μg/mL streptomycin. Cells were passaged after reaching 90% confluency.
Inhibition Study
To characterize compound binding affinities to ASBT, cis-inhibition studies of taurocholate uptake were conducted as previously described (15). Briefly, cells were seeded in 12 well cluster plates (Corning; NY) at a density of 1.5 million cells/well. Inhibition studies were performed on the fifth day in Hank’s Balance Salts Solution (HBSS). Cells were exposed to donor solution containing 2.5 μM taurocholate (spiked with 0.5 μCi/mL [3H]-taurocholate) in the presence of a conjugate at eight concentrations (0–100 μM) for 10 min. Cells were lysed using NaOH. Cell lysate was counted for taurocholate radioactivity using a liquid scintillation counter (Beckmann Instruments, Inc., Fullerton, CA). For neutral conjugates, 2.5% DMSO was included in transport buffer, which has been shown to not affect ASBT kinetics (16).
Uptake Study
The uptake of conjugates by ASBT, representing cellular absorption mediated by the transporter, was evaluated. Cells were seeded as above for inhibition studies. Uptake studies employed HBSS buffer or modified HBSS buffer (i.e. sodium-free). Since ASBT is a sodium-dependent transporter, studies using sodium-free buffer enabled passive permeability measurement of conjugate. Cells were exposed to donor solution contain eight different conjugate concentrations (1–500 μM). Subsequently, cells were lysed as previous described (16) by adding 0.25 mL acetonitrile to each well, following evaporation at RT. A solution (1 mL) containing 50% water and 50% acetonitrile was added to each well for 10 min. Sample was stored in −80°C until analyzed by LC-MS/MS. Taurocholate uptake was measured on each study occasion as a control.
Analytical Methods
The conjugate was quantified by LC-MS on a Thermo Finnigan Surveyor HPLC system, equipped with a Thermo Finnigan Surveyor autosampler and a Thermo TSQ quantum mass spectrometer (Thermo Fisher Scientific Inc., Waltham, MA). The column used was a Phenomenex Luna C8 (50×2.0 mm, 3 μm; Phenomenex; Torrance, CA, USA) heated to 45 °C. The mobile phase was A, 0.1% formic acid in water; and B, 0.1% formic acid in acetonitrile, with a flow rate of 0.4 mL/min. The injection volume was 10 μL. Detection was achieved under positive ion electrospray tandem mass spectrometry using [M+H]+ peak for all conjugates. The mobile phase and retention time for each conjugate are detailed in Supporting Information Table S1. The limit of quantification for all conjugates was between 1-2.5 nM.
Kinetic Analysis
Inhibition data was analyzed in terms of inhibition constant Ki and used a modified Michaelis–Menten competitive inhibition model, as previously described, taking into account aqueous boundary layer (ABL) resistance (17).
Uptake data was analyzed in terms of Kt, Jmax, normJmax and Pp, where Jmax is the transport capacity; normJmax is normalized conjugate Jmax against taurocholate Jmax from the same occasion; Kt is the Michaelis–Menten coefficient for ASBT-mediated transport; Pp is the conjugate passive permeability coefficient. For 18, estimated Kt was less than 0.1 μM, such that Kt was assigned a value of 0.1 μM, due to the limited ability to accurately estimate potent Kt values (17). Data were analyzed using WinNonlin Professional (Pharsight Corporation; Mountain View, CA).
3D-QSAR Analysis
3D-QSAR models were developed for Ki and normJmax/Kt. The inhibition constant Ki reflects compound binding affinity to ASBT, with smaller values denoting greater binding. normJmax/Kt reflects the efficiency of conjugate translocation by ASBT.
The implementation of the CoMFA and CoMSIA techniques was performed as described previously (18,19). Briefly, conjugates were sketched with SYBYL 7.2 (Tripos Inc., St. Louis, MO). Each structure was minimized using the Powell method and Tripos force field (20)with maximum iterations of 2000 steps and termination gradient of 0.001 kcal/mol. Partial atomic charges were computed by the Gasteiger-Hückel method (21). Conjugates were aligned via “database alignment” based on a template structure in Figure 1. The reference compound during alignment was 12 for Ki models and 15 for the normJmax/Kt model. A regularly placed grid of 2.0 Å was created around aligned molecules. An sp3 carbon atom with charge +1.00 was used as a probe atom. The steric and electrostatic fields were truncated at +30.00 kcal/mol. In contour maps of models, areas with above 80% favorability among the fields being viewed were regarded as beneficial for the biological activity, while those with field values below 20% were regarded as detrimental. The attenuation factor was 0.3. Models were obtained using the partial-least-square (PLS) analysis (22). Leave-one-out cross validation (LOO) was performed to determine the optimum number of components, and non-validation PLS was applied to obtain the final model. Models were evaluated by the cross-validated standard coefficient q2 and correlation coefficient r2. A model with high q2 (above 0.5), high r2, low standard error of prediction (SEP), and low standard error of estimate (SEE) was considered to possess good predictability. Models were also evaluated using a test set of four randomly selected conjugates.
Figure 1.
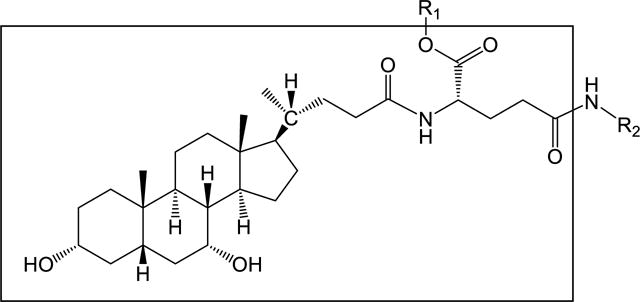
General structure of CDCA-glutamyl-probe (pyridines, phenol) conjugates. Substructure in the square box was the template structure used for “database alignment”.
RESULTS AND DISCUSSION
Synthesis
A series of aminopyridine and aminophenol conjugates of glutamyl-CDCA were synthesized. The general structure is depicted in Figure 1 and all conjugate structures are drawn in Table 1. The synthetic strategy was based on coupling the carboxyl group at the C-24 position of CDCA to the amino group of the common drug scaffolds pyridine or phenol, using glutamic acid as a linker (Scheme 1). A negative charge around the C-24 region was designed to promote ASBT translocation (7,23). The corresponding neutral analogues with α-benzyl protection on the glutamic acid linker were also synthesized. Unsubstituted, mono-substituted, and di-substituted pyridine and phenol were employed as functioned probe moieties that yielded conjugates with varying chemistry in the region beyond C-24.
Table 1.
Structures and the biological activities of the bile acid conjugates.
| Comp | R1 | R2 |
Ki (μM) |
Kt (μM) |
normJmaxa |
normJmax/Kt (μM−1) |
Pp × 107 (cm/s) |
ClogP |
|---|---|---|---|---|---|---|---|---|
| 1 | −H |

|
5.28 (±0.84) |
9.88 (±2.33) |
0.616 (±0.033) |
0.0620 (±0.0151) |
5.36 (±0.26) |
2.87 |
| 2b | −H |

|
1.51 (±0.24) |
1.06 (±0.71) |
0.298 (±0.010) |
0.281 (±0.189) |
2.01 (±0.21) |
2.87 |
| 3 | −H |

|
8.73 (±1.49) |
21.6 (±4.8) |
0.435 (±0.029) |
0.0201 (±0.0047) |
2.28 (±0.22) |
2.87 |
| 4 | −H |
|
7.13 (±118) |
17.4 (±3.0) |
0.330 (±0.074) |
0.0190 (±0.0054) |
1.70 (±0.15) |
1.90 |
| 5 | −H |

|
4.66 (±0.53) |
11.2 (±3.6) |
0.0791 (±0.0097) |
0.00705 (±0.00243) |
1.19 (±0.09) |
2.72 |
| 6 | −H |

|
11.1 (±1.1) |
77.3 (±26.7) |
0.300 (±0.043) |
0.00388 (±0.00146) |
2.57 (±0.28) |
2.72 |
| 7 | −H |
|
23.6 (±14) |
21.2 (±4.4) |
0.413 (±0.036) |
0.0195 (±0.0044) |
2.16 (±0.21) |
3.37 |
| 8 | −H |
|
7.87 (±1.00) |
24.6 (±4.4) |
0.293 (±0.013) |
0.0119 (±0.0022) |
2.01 (±0.13) |
3.37 |
| 9 | −H |
|
2.81 (±0.21) |
9.80 (±3.83) |
0.196 (±0.012) |
0.0200 (±0.0079) |
4.65 (±0.29) |
3.37 |
| 10 | −H |

|
6.61 (±0.98) |
7.44 (±2.20) |
0.716 (±0.042) |
0.0962 (±0.0290) |
4.45 (±0.54) |
3.87 |
| 11 | −CH2C6H5 |
|
122 (±19) |
NDc | ND | ND | ND | 5.21 |
| 12 | −H |
|
1.91 (±0.41) |
92.2 (±14.7) |
0.511 (±0.034) |
0.00554 (±0.00096) |
1.55 (±0.21) |
3.22 |
| 13 | −CH2C6H5 |
|
28.1 (±4.43) |
ND | ND | ND | ND | 4.56 |
| 14 | −H |
|
8.94 (±1.11) |
1.20 (±0.38) |
0.242 (0.013) |
0.202 (±0.065) |
3.53 (±0.16) |
3.71 |
| 15 | −H |
|
13.2 (±2.2) |
4.44 (±0.42) |
1.44 (±0.017) |
0.324 (±0.031) |
3.78 (±0.19) |
2.54 |
| 16 | −H |

|
3.07 (±0.36) |
2.80 (±1.19) |
0.404 (0.025) |
0.144 (±0.062) |
2.57 (±0.33) |
3.39 |
| 17 | −CH2C6H5 |

|
17.8 (±2.0) |
NMd | NM | NM | 62.3 (±4.1) |
4.73 |
| 18b | −H |

|
5.80 (±0.68) |
0.1 | 2.67 (±0.24) |
26.7 | 8.77 (±4.83) |
2.53 |
| 19 | −H |

|
6.84 (±0.76) |
4.30 (±1.21) |
0.361 (±0.052) |
0.0840 (±0.0265) |
11.6 (±0.5) |
3.13 |
| 20 | −H |
|
5.74 (±1.02) |
11.7 (± 2.4) |
0.307 (±0.023) |
0.0262 (±0.0057) |
4.40 (±0.18) |
3.13 |
| 21 | −H |
|
21.1 (±3.13) |
33.0 (±28.1) |
0.670 (±0.050) |
0.0203 (±0.017) |
48.9 (±2.5) |
3.85 |
| 22b | −H |
|
4.96 (±0.77) |
83.6 (±43.2) |
3.47 (±0.63) |
0.0415 (±0.0227) |
100 (±4) |
3.85 |
| 23 | −H |
|
7.92 (±1.4) |
NM | NM | NM | 33.8 (±0.9) |
3.7 |
| 24 | −H |

|
7.87 (±1.72) |
NM | NM | NM | 39.7 (±0.7) |
2.85 |
| 25b | −H |

|
3.54 (±0.50) |
5.57 (±1.09) |
1.46 (±0.06) |
0.262 (±0.052) |
6.01 (±0.34) |
3.1 |
| 26 | −H |
|
2.43 (±0.39) |
3.29 (±1.15) |
0.464 (0.151) |
0.141 (±0.067) |
7.95 (±0.80) |
2.87 |
| 27 | −H |
|
7.18 (±0.98) |
15.3 (±2.4) |
0.437 (0.027) |
0.0286 (±0.0036) |
7.65 (±0.73) |
2.87 |
Data were summarized as mean (±SEM) of three measurements.
To correct for variation in ASBT expression levels across studies, Jmax of each bile acid was normalized against taurocholate Jmax from the same occasion.
2, 18, 22, and 25 were used as the test set. The other 23 compounds were used as the training set.
Not determinable owing to high passive permeability.
Not measurable due to lack of transportation by ASBT.
ASBT Inhibition
Table 1 lists Ki values of the 27 conjugates, which included 24 pyridine-based conjugates and three phenol-based conjugates. Neutral conjugates with α-benzyl protection on C-24 were poorly water soluble. Therefore, among the 24 neutral conjugates that were synthesized, only 11, 13, and 17 allowed Ki to be measured.
All 24 monoanionic conjugates were potent inhibitors with Ki ranging from 1.51 to 23.6 μM with CDCA-glutamyl-3-aminopyridine 2 being the most potent inhibitor. They are in the range of native bile acids. The three neutral conjugates were less potent than their corresponding monoanionic conjugates by approximately 10–20 fold.
ASBT Uptake
While all 27 conjugates exhibited high inhibition potency, only 22 showed to be substrates. Table 1 lists kinetic parameters Kt, normJmax, normJmax/Kt, and Pp. Kt represents transporter affinity. To accommodate variation in ASBT expression levels across studies, Jmax of each bile acid was normalized against taurocholate Jmax from the same occasion yielding normJmax. The normJmax/Kt value represents the ASBT mediated transport efficiency. Neutral compound 17 exhibited a high passive permeability, such that it was not able to be assessed as a substrate or not. The other two neutral compounds, 11 and 13, were not further evaluated. Results from 17 were consistent with previous findings that a negative charge around C-24 region is required for translocation (7).
Kt values ranged from 0.1 μM for 18 to 92.2 μM for 12. normJmax ranged from 0.0791 for 5 to 2.67 for 18. normJmax/Kt ranged from 0.00388 μM−1 for 6 to 26.7 μM−1 for 18. Pp ranged from 1.19×10⁻⁷ cm/s for 5 to 100×10−7 cm/s for 22. Figure 2A shows the uptake profile of 18, which was the most potent substrate in terms of both Kt and normJmax; Figure 2B shows the non-substrate 23.
Figure 2.
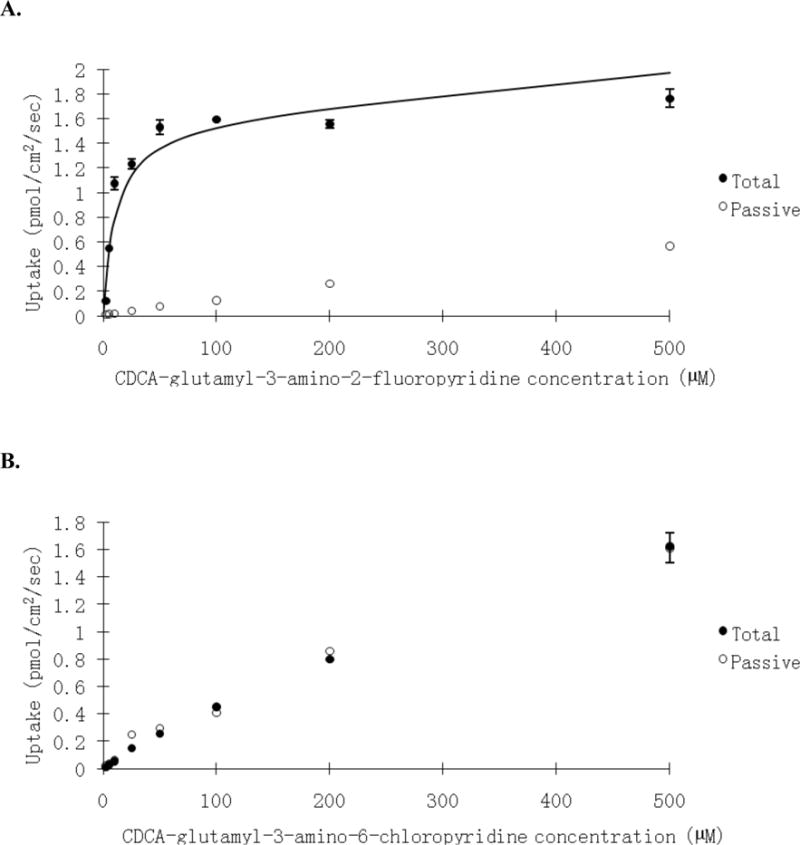
Concentration-dependent uptake of (A) CDCA-glutamyl-3-amino-2-fluoropyridine 18, and (B) CDCA-glutamy-3-amino-6-chloropyridine 23 into ASBT-MDCK monolayers. The conjugate was measured at varying concentrations (2.5–500 μM) in the presence and absence of sodium to delineate ASBT-mediated and passive uptake components. Data indicate total uptake in the presence of sodium (●) and passive uptake in the absence of sodium (○). 18 uptake was several fold higher in the presence of sodium than in the absence of sodium, reflecting ASBT-mediated uptake. 23 uptake was the same in the presence and absence of sodium; passive uptake was high, such that the compound was either not a substrate or not measurable as a substrate due to high passive permeability.
Ring substituent position played an important effect on transport efficiency. For example, for 3-aminopyridine conjugates, substitution at position 2 led to more potent substrate compared to other positions, e.g. 5 (11.2 μM) vs. 7 (21.2 μM), and 18 (0.1 μM) vs. 19 (4.30 μM) when substitution is moved from 2 to 5 position. Substitution at position 6 significantly decreased activity, when 8 (24.6 μM) is compared with 5, and 7; 20 (11.7 μM) is compared with 18 and 19; 12 (92.2 μM) is compared with 5; 22 (83.6 μM) is compared with 21 (33.0 μM). Type of substituent group also influenced Kt. For example, all fluoro substituted conjugates were potent substrates, bromo-substituted conjugates were weak substrates, while chloro-substitution abolished uptake.
Comparison of Inhibition Kinetics vs. Transporter Kinetics
Transporter mediated translocation minimally involves substrate binding to the transporter, transporter conformation changes involving substrate translocation, dissociation of substrate from transporter, and transporter conformation restoration. The initial binding step is assessed by Ki. Results show that ASBT inhibition requirements were different from the ASBT-mediated transport requirements. A potent inhibitor may be a weak substrate, such as 6, 12, and 22. Figure 3A illustrates the relationship of transporter affinity Kt and inhibition potency Ki for all 22 substrates. Figure 3B excludes 6, 12, and 22, where Kt was notably weaker than Ki. For these 19 conjugates in Figure 3B, there was a modest association between Kt and Ki with linear slope=0.995, r2=0.403, and p=0.003. Qualitatively, most conjugates yielded similar potency of Kt and Ki, suggesting conjugate binding was broadly the slow kinetic step for conjugate translocation. These results agree with previous native bile acid findings (6). It should be noted that 14 and 18 yielded Kt that were over 7-fold more potent than Ki although they both were potent inhibitors and substrates (e.g. Ki and Kt <10 μM). For 6, 12, and 22, where Kt was far less potent than Ki, post-binding events were rate-limiting.
Figure 3.
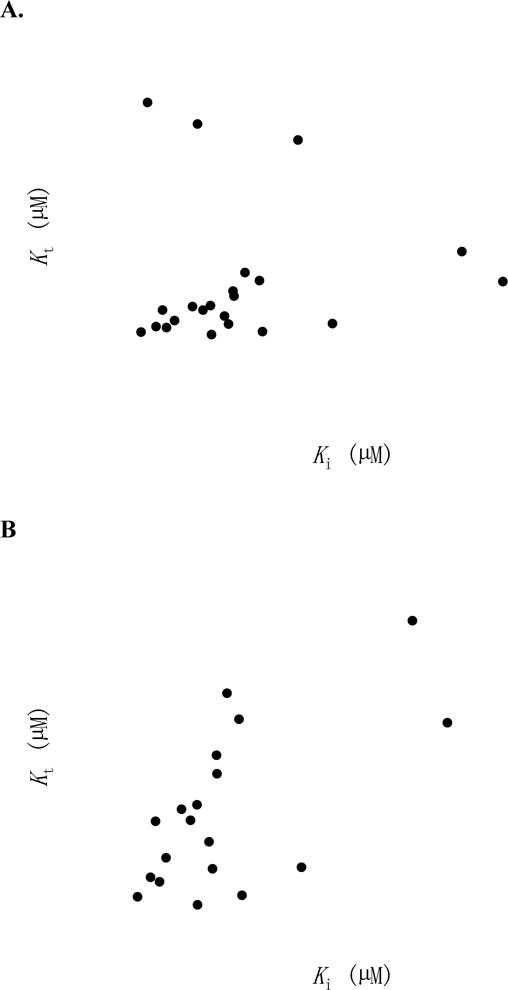
Relationship of Kt and Ki. (A) For all 22 bile acid conjugates that were substrates, Kt vs. Ki are plotted. 6, 12, and 22 exhibited several-fold higher Kt values than Ki values. (B) With 6, 12, and 22 removed, most conjugates yielded similar Kt and Ki. Linear regression showed a slope=0.995, r2=0.403, and p=0.003. 14 and 18 yielded Kt << Ki although all were <10 μM.
Figure 4 shows that transport capacity was not associated with inhibitory potency. Capacities of most conjugates spanned a narrow range, and were less than taurocholate. However, normJmax of 15, 18, 22, and 25 were higher than that of taurocholate. Supporting Information Figures S1 and S2 show transport capacity and transport efficiency were not related to Kt or Ki, respectively.
Figure 4.
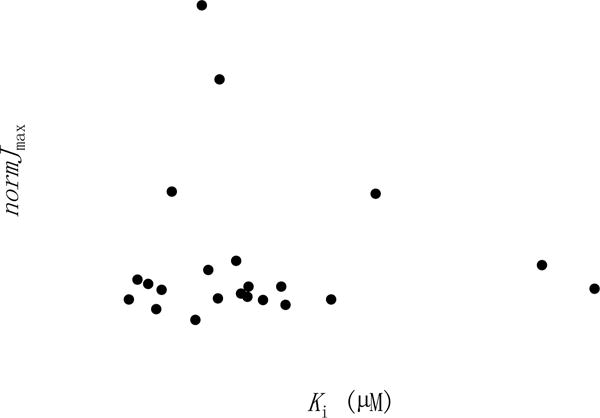
Relationship between normJmax and Ki. Transporting capacity was not associated with inhibition potency. Linear regression showed a slope of −0.008 μM−1 and r2=0.003. 15, 18, 22, and 25 yielded Jmax higher than taurocholate. All other conjugates exhibited Jmax less than taurocholate Jmax, and ranged from 0.0791 to 0.716.
ASBT Inhibition 3D-QSAR Models
Figure 5 shows the superimposition of all 27 compounds for inhibition model development. Twenty-three compounds were included in the training set. The remaining, randomly selected four compounds (i.e. 2, 18, 22, and 25) were used as the test set. Four 3D-QSAR models, including one CoMFA and three CoMSIA models, were developed using pKi data (Table 2). CoMSIA-1 included electrostatic and steric fields, whereas CoMSIA-2 included an additional hydrophobic field. CoMSIA-3 included the three molecular descriptors from models 1 and 2, as well as hydrogen bond donor and acceptor fields.
Figure 5.
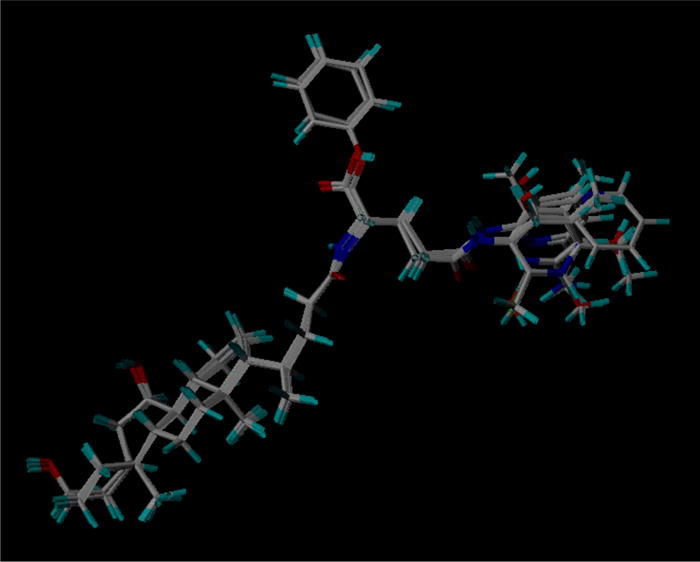
Superimposition of training set and test set compounds for inhibition model development.
Table 2.
Result from CoMFA and CoMSIA analysis.
| CoMFA-1a | CoMSIA-1a | CoMSIA-2a | CoMSIA-3a | CoMFA-2b | |
|---|---|---|---|---|---|
| q2 | 0.675 | 0.388 | 0.572 | 0.612 | 0.538 |
| SEPc | 0.255 | 0.349 | 0.292 | 0.278 | 0.550 |
| r2 | 0.965 | 0.879 | 0.959 | 0.958 | 0.999 |
| SEEc | 0.004 | 0.155 | 0.091 | 0.091 | 0.025 |
| NOCc | 5 | 5 | 5 | 5 | 9 |
|
| |||||
| Fraction | |||||
|
| |||||
| steric | 0.731 | 0.377 | 0.120 | 0.084 | 0.612 |
| Electronic | 0.269 | 0.623 | 0.378 | 0.202 | 0.388 |
| Hydrophobic | 0.502 | 0.408 | |||
| Donor | 0.131 | ||||
| Acceptor | 0.173 | ||||
Models for pKi.
Model for log(normJmax/Kt).
SEP: standard error of prediction; SEE: standard error of estimate; NOC: number of components.
CoMFA and CoMSIA models were comparable in terms of their predictability of pKi, with CoMFA-1 (q2 = 0.675, r2 = 0.965) and CoMSIA-3 (q2 = 0.612, r2 = 0.958) being the best inhibition models (Table 2). Figure 6 shows the relationship of observed versus predicted pKi for training set and test set of CoMFA-1 and CoMSIA-3. The corresponding data are listed in Supporting Information Table S2. Both models accurately predicted activities of three out of the four test compounds. 2 was underpredicted by both models, where the observed Ki was 1.51 μM and predicted Ki were 8.13 μM and 11.7 μM by CoMFA-1 and CoMSIA-3, respectively.
Figure 6.
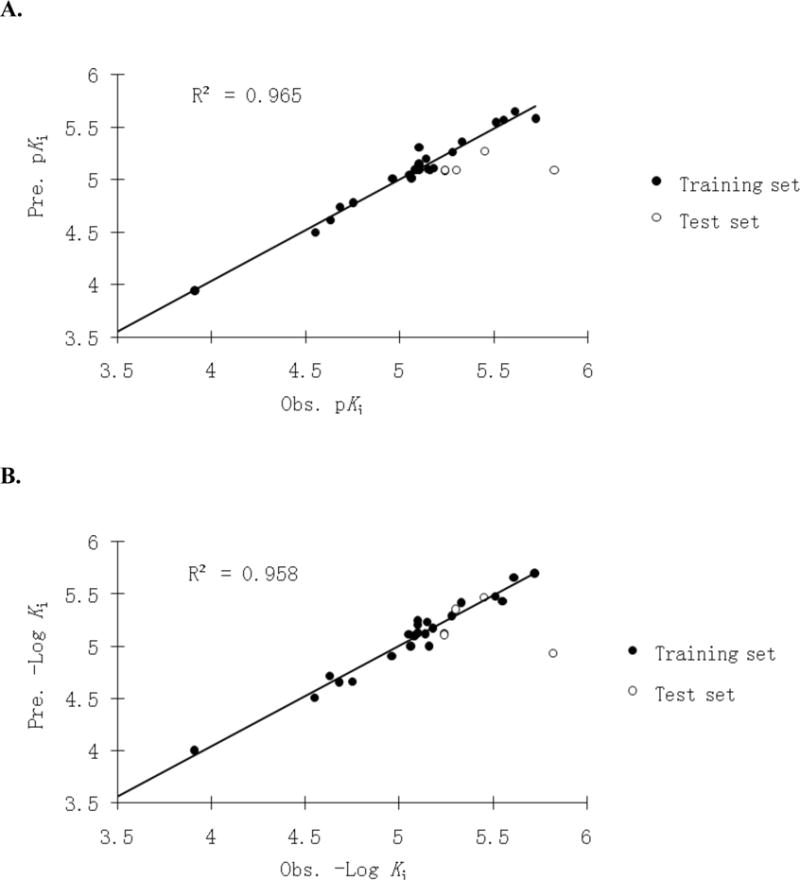
Observed versus predicted pKi plot of the CoMFA-1 (A) and CoMSIA-3 (B) using 23 training set conjugates (●) and 4 test set conjugates (○). The solid line is the regression for the training set. The regression line has a slope=0.965 and r−2=0.965 for CoMFA-1, and 0.959 and 0.958 for CoMSIA-3, respectively.
Table 2 also shows the relative contributions of specific fields to the inhibition activities. For CoMFA-1, the steric feature dominated (73.1% contribution) the electrostatic feature. For all CoMSIA models, the steric feature was less important than the electrostatic feature. For example, the contributions of steric and electrostatic features in CoMSIA-1 were 37.7% and 62.3%, respectively. The different effects of steric and electrostatic fields between CoMFA and CoMSIA are attributed to their energy function forms. The contribution of steric feature in CoMSIA is further reduced when the hydrophobic field was added, with 12.0% and 8.4% for CoMSIA-2 and CoMSIA-3, respectively. For these two models, the hydrophobic was the most determining feature that contributed 50.2% and 40.8%, respectively. Considering the improved q2 in CoMSIA-2 and CoMSIA-3 vs. CoMSIA-1, the hydrophobic feature was the major contributor to improve pKi predictability. Hydrogen bond donor and acceptor in CoMSIA-3 contributed 13.1% and 17.3%, respectively, and account for the slight q2 increase from 0.572 in CoMSIA-2 to 0.612 in CoMSIA-3.
3D-QSAR Contour Maps for Inhibition
Figure 7 and 8 illustrate features of the CoMFA-1 and CoMSIA-3 models, respectively. Contour maps were drawn relative to CDCA-glutamyl-3-amino-2,6-dimethylpyridine 12.
Figure 7.
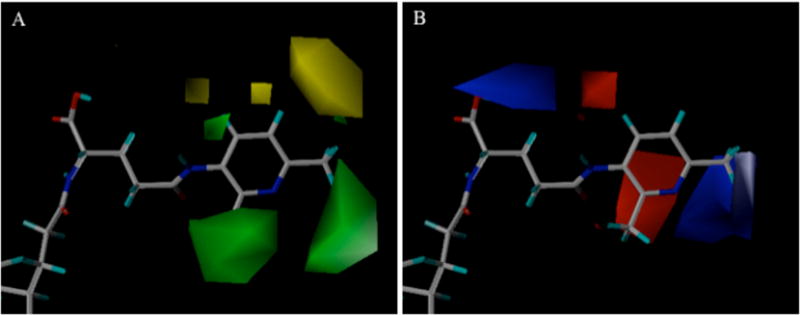
Steric (A) and eletrostatic (B) contour maps around compound CDCA-glutamyl-3-amino-2,6-dimethylpyridine 12 for CoMFA-1 inhibition model. In panel A, green contours show where bulky substitute favored inhibition, while yellow contours were disfavored. In panel B, blue region represents favorable electropositive interaction for inhibition, while red show disfavored electropositive character.
Figure 8.
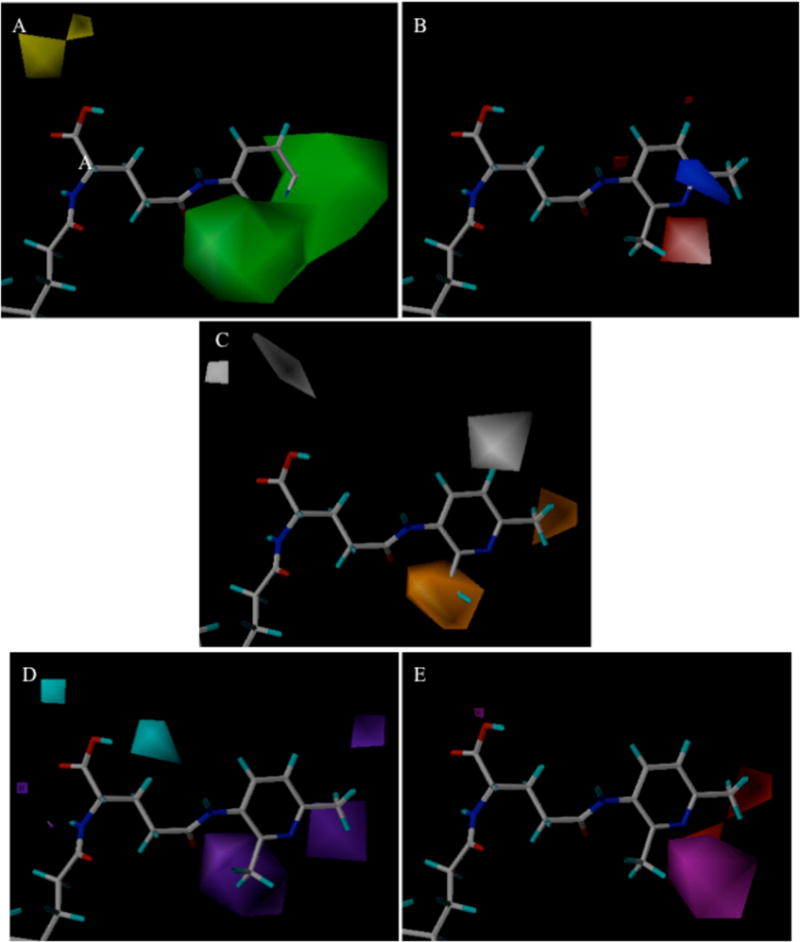
Steric (A), electrostatic (B), hydrophobic (C), hydrogen bond donor (D), and hydrogen bond acceptor (E) contour maps around CDCA-glutamyl-3-amino-2,6-dimethylpyridine 12 for CoMSIA-3 inhibition model. In panel A, green and yellow contours represent favorable and unfavorable bulky substituent interaction regions for inhibition. In panel B, blue and red contours represent regions that favor electropositive and electronegative groups, respectively. In panel C, orange and white contours are areas where hydrophobic groups enhance and diminish activity. In panel D, cyan and purple contours indicate regions where an inhibitor’s hydrogen bond donor is favored and disfavored, respectively. In panel E, magenta and red contours represent favorable and unfavorable hydrogen-bond acceptor regions, respectively.
CoMFA Contour Maps
The steric contours from CoMFA-1 (Fig. 7A) reveal that bulky groups at the 2 or 6 position (green region) of 3 aminopyridine affords beneficial steric interactions for inhibition, whereas bulky substitutes on position 5 (yellow region) is detrimental. The contours explain the higher activity of 2,6-dimethyl substituted 1b2 (Ki = 1.94 μM) over 2-methyl substituted 8 (7.87 μM) and 6-methyl substituted 5 (4.66 μM). The two green regions also accounted for the higher activity of 5 and 8 than 6 (11.1 μM) and 7 (23.64 μM), where the methyl group is moved from 2 or 6 to 4 or 5. The same pattern is evident for bromo substitution. When bromine is moved from position 6 in 22 to 5 in 21, the activity decreased from 4.96 to 21.1 μM. The electrostatic contour from CoMFA-1 (Fig. 7B) indicates that an electropositive group near the −COO (blue region) will be favorable. Considering hydroxyl hydrogen on a carboxylic group bears a positive charge, this blue area reflects that a carboxylic acid near C-24 improved inhibition than the corresponding conjugates with α-benzyl protection. Inhibition potency decreased from 6.61 to 122 μM comparing 10 to 11, from 1.94 to 28.1 μM comparing 12 to 13, and from 3.07 to 17.78 μM comparing 16 to 17. These findings agree with previous observations that a negative charge near C24 region is preferred (7). In Figure 7B, the red contour region behind the 2 position and a blue contour region near the 6 position of the 3-aminopyridine ring indicate that an electronegative or electropositive group enhanced inhibition.
CoMSIA Contour Maps
Steric contour maps from CoMSIA-3 (Fig. 8A) reveals that the green regions are patterned similarly to those from CoMFA-1 (Fig. 7A). However, CoMSIA-3 provides two additional yellow contours above the carboxylate group indicating that a steric interaction near −COO is unfavorable. The yellow areas are consistent with the blue electrostatic contour of CoMFA-1 (Fig. 7B), where α-benzyl protection of the carboxylate decreased the inhibition potency (i.e. 10 vs. 11, 12 vs. 13, and 16 vs. 17). Electrostatic contours (Fig. 8B) are consistent with the patterns observed in CoMFA-1 (Fig. 7B), e.g. red and blue regions around 2 and 6 position of the 3-aminipyridine ring. Hydrophobic contour plots (Fig. 8C) indicate that hydrophobic substitution on the 2 or 6 position enhances inhibition (orange regions) whereas such substitution on the 5 position reduces potency (white contour). This result is consistent with steric contour of CoMFA-1 (Fig. 7A). Hydrogen bond donor contours (Fig. 8D) suggest that a −OH in the carboxyl group can be regarded as a hydrogen bond donor. The cyan area near −COO group agrees with the steric (Fig. 8A) and hydrophobic contours (Fig. 8C), indicating α-benzyl group on −COO remarkably reduced the inhibition activities. The purple area near the pyridine ring indicates that a hydrogen-bond donor behind the 2 and 6 position of the 3-aminopyridine ring is detrimental. Hydrogen bond acceptor contours (Fig. 8E) determine favorable (magenta) areas near the pyridine nitrogen and a red (disfavored) area around the 6 position on 3-aminopyridine ring, reflecting the decreased activity from 2.43 to 7.18 μM when a hydroxyl group is moved from the meta position in 26 to the para in 27 on the phenol ring.
Comparison of CoMFA and CoMSIA Models for Inhibition
CoMFA-1 possessed slightly greater predictability than CoMSIA-3 in terms of q2 (0.675 and 0.612, respectively). However, the advantage of CoMSIA is the employment of a Gaussian-type energy calculation and additional molecular descriptors, including hydrophobic fields, hydrogen bond acceptor, and hydrogen bond donor. For example, the influence of α-benzyl group is not accommodated by the steric contour of CoMFA-1 (Fig. 7A), but is accommodated by the steric and hydrophobic contours of CoMSIA-3 (Figs. 8A and 8B). The hydrophobic contour of CoMSIA-3 had a similar pattern to the steric contour of CoMFA-1, indicating the hydrophobic field of CoMSIA-3 may share common features with the steric field of CoMFA-1. The similarity is not surprising because a large hydrophobic substitution may have significant steric effects.
ASBT Transport Efficiency Model
As with the inhibition models, 2, 18, 22, and 25 were reserved as test compounds for transport efficiency modeling. Figure 9 shows the superimposition of all 22 compounds for transport efficiency model development. No QSAR model was derived from Kt data with significant q2.
Figure 9.
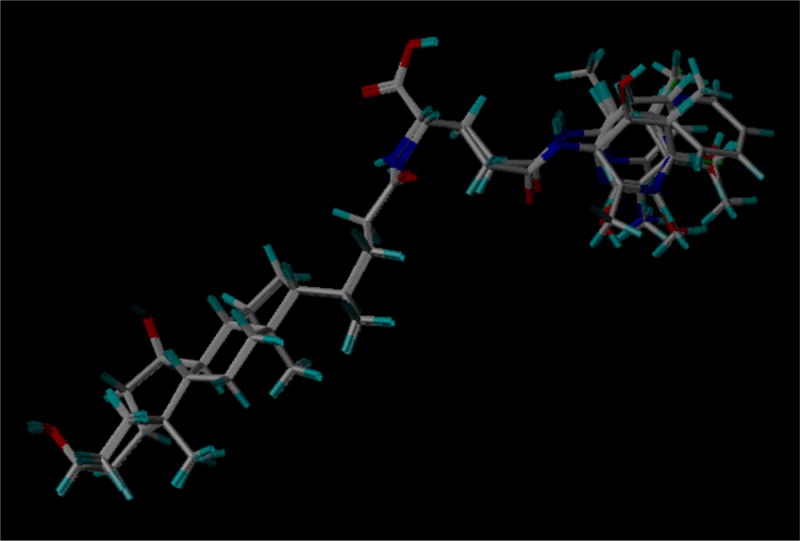
Superimposition of training set and test compounds for transport efficiency model development.
A comprehensive CoMFA model (CoMFA-2) was derived from log(normJmax/Kt) (Table 2). The q2 and r2 values were 0.538 and 0.999, respectively. Similar to CoMFA-1, steric fields dominated the electrostatic fields for transport efficiency with contributions of 61.2% and 38.8%, respectively. Figure 10 shows the relationship between observed and predicted uptake efficiencies of the training and test set (corresponding data in Supporting Information Table S2). The uptake efficiencies of test set 22 and 25 were under-estimated by 2 and 6 fold, respectively. 2 and 18 were significantly underestimated by approximately 9 and 400 fold, respectively. A potential contributing factor to the prediction error of 18 is that its uptake efficiency was over 100-fold greater than all other conjugates. The underestimated activity of compound 2 might be due to chemical or physical features beyond the predictive capacity of CoMFA and CoMSIA models.
Figure 10.
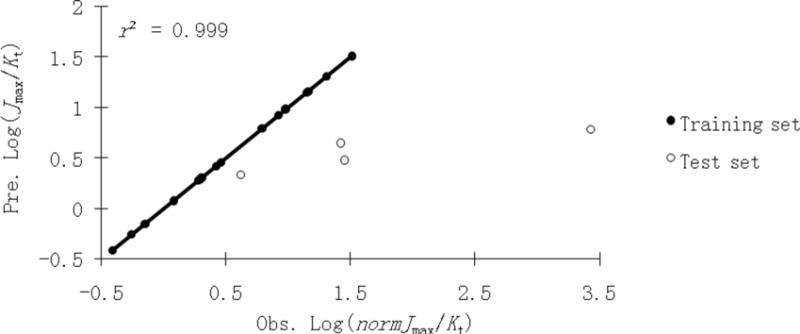
Observed vs. predicted log(normJmax/Kt) plot of the CoMFA-2 using 18 training set conjugates (●) and 4 test set conjugates (○). The solid line is the regression for the training set. The regression line has a slope=1.00 and r2=0.999.
CoMFA model contours for transport efficiency
Figure 11 shows steric and electrostatic contours of CoMFA-2 relative to CDCA-glutamyl-2,6-diaminopyridine 15, the most efficient ASBT substrate within the training set (normJmax/Kt = 0.324 μM−1). As above, a large green contour near positions 5 and 6 on the pyridine ring in Figure 11A indicates that bulky group is beneficial. Compared to other position 6 substituents, transport efficiency of 14 with methoxy group at position 6 on the 3-aminopyridine ring (normJmax/Kt = 0.202 μM−1) was high compared to 8 (methyl substituted, 0.0119 μM−1), 20 (fluoro, 0.0262 μM−1), and 22 (bromo, 0.0415 μM−1). The other green region near 1 and 6 positions on pyridine ring of 15 indicates steric interaction is favorable. A yellow contour between 4 and 5 positions indicates a steric substituent will decrease efficiency. For example, fluoro substitution exhibited higher efficiencies than corresponding bromo substitution (19 vs. 21). Figure 11B shows the electrostatic contour. The large blue region near the 4 and 5 positions on 2, 6-aminopyridine ring reflects the para hydroxyl in 27 lower efficiency compared to ortho hydroxyl in 25 or meta hydroxyl in 26. The small blue region under the 6 position of 15 agrees with its high efficiency, compared to compounds lacking a 6-amino substitute such as 1. The red region near the 4 position of 15 indicates that an electronegative substitute at 4 position on 2-aminopyridine could enhance the transport efficiency.
Figure 11.
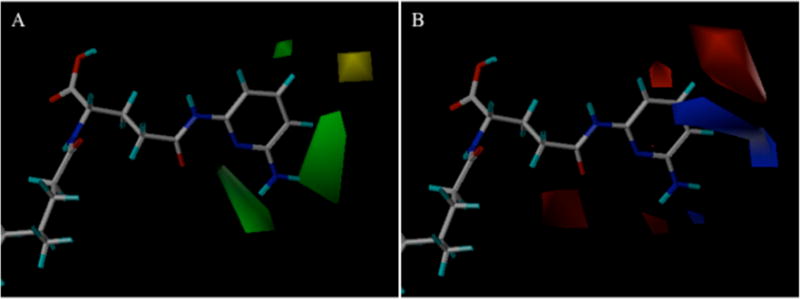
Steric (A) and eletrostatic (B) contour maps around CDCA-glutamyl-2,6-diaminopyridine 15 for CoMFA-2 transport efficiency model. In panel A, green contours show where bulky substitute favored inhibition, while yellow contours were disfavored. In panel B, blue region represents favorable electropositive interaction for inhibition, while red show disfavored electropositive character.
LogP Effects on ASBT Inhibition and Transport
Partition coefficient (LogP) is a measurement of compound solubility and lipophilicity (24). Since CoMFA and CoMSIA models indicated that steric and hydrophobic features strongly influenced conjugate interaction with ASBT, LogP may explain inhibition or transport efficiency. Calculated LogP (CLogP) was computed using SYBYL according to Hansch and colleagues (24,25) (Table 1). Plots of observed pKi vs. CLogP (Fig. 12A) shows a fairly negative correlation between pKi and CLogP with r2=0.367 and p=0.0008 (i.e. lipophilicity reduced binding potency). Comparison of α-benzyl substituted conjugates to their non-substituted counterparts (11 vs. 10, 13 vs. 12, and 17 vs. 16) essentially accounted for this trend. However, elimination of these three neutral conjugates (open circles in Fig. 12A) leads to no relationship between pKi and CLogP (r2=0.021) among the 24 monoanionic conjugates (filled circles in Fig. 12A). This lack of simple correlation between inhibition and CLogP is supportive of COMFA and COMSIA findings that hydrophobicity played differing roles in conjugate binding (i.e. hydrophobic or bulky substitute on 2 or 6 position of a 3-aminopyridine ring enhanced activity, while a hydrophobic group on 5 position was detrimental).
Figure 12.
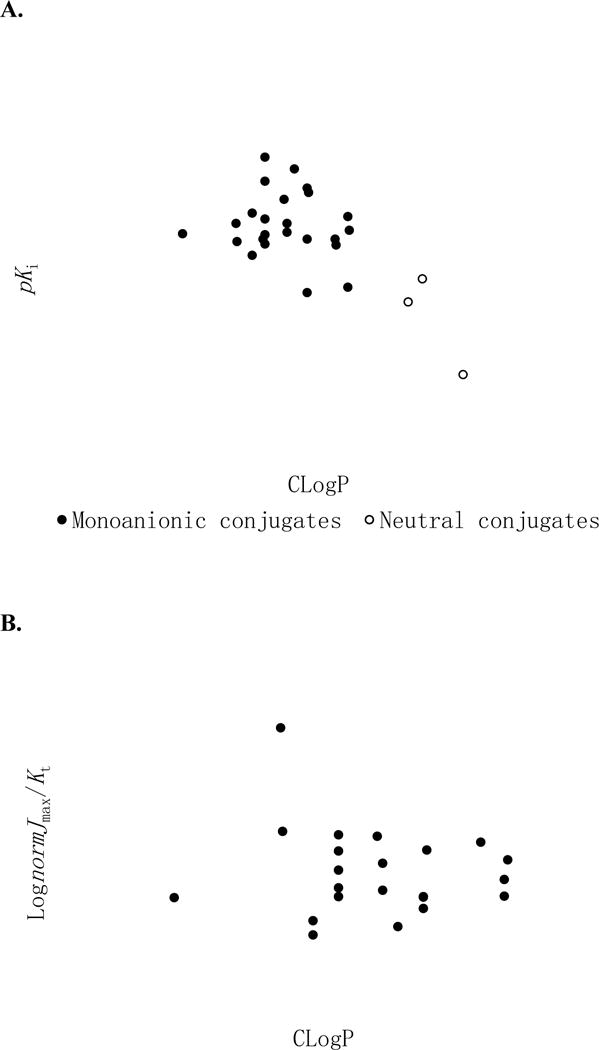
Influence of LogP on ASBT inhibition (A) and transport efficiency (B). Panel A, observed pKi vs., ClogP shows a fairly negative correlation between pKi and CLogP (slope=−0.331, r2=0.367, and p=0.0008). However, there was no simple correlation (r2=0.021) among the 24 monoanionic conjugates when the three neutral conjugates (i.e. the α-benzyl substituted conjugates 11, 13, and 17) were eliminated. Panel B, observed log(normJmax/Kt) vs. ClogP, shows no relationship was between log(normJmax/Kt) and CLogP with r2=0.015 and p=0.586.
There was no correlation between Log(normJmax/Kt) and CLogP, with r2=0.015 (Fig. 12B). Additionally, no correlation was observed between Kt vs. CLogP and normJmax vs. CLogP as well with r2=0.037 and 0.005, respectively. The lack of correlation between transport parameters and CLogP indicates other physicochemical and structural variables impact transport beyond hydrophobicity, and further suggests a greater complexity in conjugate translocation compared to conjugate binding.
Comparison to Previous ASBT models
Several computational models have been developed to study structural requirement of ASBT inhibition. Baringhaus and co-workers (26) explored the chemical features of ASBT inhibitors with 3D pharmacophore using structurally diverse molecules. 3D pharmacophore and Bayesian models were derived and applied by our lab to identify novel ASBT inhibitors among commercial drugs (15). However, above studies do not systemically involve C-24 conjugated bile acids analogs, nor do they address the more complex process of ASBT-mediated uptake. Swaan and colleagues (27) applied CoMFA analysis on a series of bile acid-peptide analogs and found that inhibition was favored by an electron donor group between C-24 and C-27 and steric bulk at the end of the side chain. These results corroborate our present findings.
3D-QSAR models using a conformationally sampled pharmacophore (CSP) approach was developed for inhibition requirements using C-24 bile acid conjugates that employed piperidines as probe moieties (28). Results here using pyridines and phenols as probe moieties in part agree with these piperidine findings, where hydrophobicity favored inhibition activity. In contrast to piperidine findings, the results showed a position effect, where the relative location of the pyridine nitrogen and substituent groups modulated the conjugates ASBT inhibition and translocation.
C-24 bile acid conjugates have previously been shown to be ASBT substrates (7,29–31). One of these studies was a SAR study involving a series of C-24 cholic acid conjugates and found that the C-24 side chain can be 14 Å in length or longer for translocation, and that large hydrophobic moieties increase binding to ASBT (29). In another study, C-24 conjugation with glutamic acid and lysine also found that charge and hydrophobicity around the 24 position influenced translocation (7). Results of this study are in agreement with these prior findings, that a negative change near C-24 promotes substrate translocation, and that steric bulk at certain positions of aminopyridine ring beyond C-24 also favors translocation.
CONCLUSION
With a view that bile acid conjugates can serve as prodrugs that target ASBT to increase oral drug permeability and bioavailability, a series of aminopyridine or aminophenol conjugates of glutamyl-bile acids were synthesized. Their ASBT inhibition and transport efficiency were evaluated to investigate their interaction beyond the C-24 region of CDCA with ASBT. Similar values for Ki and Kt indicate that substrate binding to ASBT was generally the rate-limiting step in overall substrate transport. 3D-QSAR models were developed for ASBT inhibition. The steric field dominated in the CoMFA model, whereas the hydrophobic field dominated other features in the CoMSIA models. Monoanionic conjugate exhibited higher inhibition potency than neutral conjugate. A hydrophobic or bulky substitute on 2 or 6 positions of a 3-aminopyridine ring enhanced inhibition, while a hydrophobic group on the 5 position was detrimental. Both inhibition models predicted test set inhibition. Recently, the value of inhibition-only QSAR models for drug transporters has been questioned (32), which prompted us to also develop ASBT models for transport efficiency. 3D-QSAR has not previously been applied to ASBT substrate studies. Similar to the inhibition models, the steric field was the predominant contributor; however, we demonstrate that steric contributions to ASBT transport cannot be explained simply by lipophilicity. Overall, these 3D-QSAR models provide new insight into the substrate requires for ASBT uptake and shed light on the design of bile acid conjugates that can increase intestinal drug permeability and bioavailability.
Supplementary Material
Acknowledgments
This work was support in part by National Institutes of Health grants DK67530 (to JEP) and DK61425 (to PWS). The author gratefully acknowledges Dr. Gasirat Tririya and Rana Rais for their assistance in chemical synthesis and Dr. Guoyun Bai for NMR assignment assistance.
Footnotes
Supporting Information Available: Additional related tables and figures. This material is available free of charge via the Internet at http://pubs.acs.org.
LITERATURE CITED
- 1.Dawson PA, Oelkers P. Bile acid transporters. Curr Opin Lipidol. 1995;6:109–114. doi: 10.1097/00041433-199504000-00009. [DOI] [PubMed] [Google Scholar]
- 2.Dawson PA, Lan T, Rao A. Bile acid transporters. J Lipid Res. 2009 doi: 10.1194/jlr.R900012-JLR200. [DOI] [PMC free article] [PubMed] [Google Scholar]
- 3.Balakrishnan A, Polli JE. Apical sodium dependent bile acid transporter (ASBT, SLC10A2): a potential prodrug target. Mol Pharmaceutics. 2006;3:223–230. doi: 10.1021/mp060022d. [DOI] [PMC free article] [PubMed] [Google Scholar]
- 4.Lack L. Properties and biological significance of the ileal bile salt transport system. Environ Health Perspect. 1979;33:79–89. doi: 10.1289/ehp.793379. [DOI] [PMC free article] [PubMed] [Google Scholar]
- 5.Balakrishnan A, Sussman DJ, Polli JE. Development of stably transfected monolayer overexpressing the human apical sodium-dependent bile acid transporter (hASBT) Pharm Res. 2005;22:1269–1280. doi: 10.1007/s11095-005-5274-8. [DOI] [PubMed] [Google Scholar]
- 6.Balakrishnan A, Wring SA, Polli JE. Interaction of native bile acids with human apical sodium-dependent bile acid transporter (hASBT): influence of steroidal hydroxylation pattern and C-24 conjugation. Pharm Res. 2006;23:1451–1459. doi: 10.1007/s11095-006-0219-4. [DOI] [PMC free article] [PubMed] [Google Scholar]
- 7.Balakrishnan A, Wring SA, Coop A, Polli JE. Influence of charge and steric bulk in the C-24 region on the interaction of bile acids with human apical sodium-dependent bile acid transporter. Mol Pharmaceutics. 2006;3:282–292. doi: 10.1021/mp0600135. [DOI] [PMC free article] [PubMed] [Google Scholar]
- 8.Tolle-Sander S, Lentz KA, Maeda DY, Coop A, Polli JE. Increased acyclovir oral bioavailability via a bile acid conjugate. Mol Pharmaceutics. 2004;1:40–48. doi: 10.1021/mp034010t. [DOI] [PubMed] [Google Scholar]
- 9.Cramer RD, Patterson DE, Bunce JD. Comparative Molecular-Field Analysis (Comfa). 1. Effect of Shape on Binding of Steroids to Carrier Proteins. J Am Chem Soc. 1988;110:5959–5967. doi: 10.1021/ja00226a005. [DOI] [PubMed] [Google Scholar]
- 10.Klebe G, Abraham U, Mietzner T. Molecular Similarity Indexes in a Comparative-Analysis (Comsia) of Drug Molecules to Correlate and Predict Their Biological-Activity. J Med Chem. 1994;37:4130–4146. doi: 10.1021/jm00050a010. [DOI] [PubMed] [Google Scholar]
- 11.Martin YC. 3D QSAR: current state, scope, and limitations. perspectives in Drug Discovery and Design. 1998;12:3–23. [Google Scholar]
- 12.Bemis GW, Murcko MA. The properties of known drugs. 1. Molecular frameworks. J Med Chem. 1996;39:2887–2893. doi: 10.1021/jm9602928. [DOI] [PubMed] [Google Scholar]
- 13.Gonzalez P, Polli JE. Impact of impurity on kinetic estimates from transport and inhibition studies. J Pharmacol Exp Ther. 2008;326:296–305. doi: 10.1124/jpet.107.135863. [DOI] [PMC free article] [PubMed] [Google Scholar]
- 14.Balakrishnan A, Sussman DJ, Polli JE. Development of stably transfected monolayer overexpressing the human apical sodium-dependent bile acid transporter (hASBT) Pharm Res. 2005;22:1269–1280. doi: 10.1007/s11095-005-5274-8. [DOI] [PubMed] [Google Scholar]
- 15.Zheng X, Ekins S, Raufman JP, Polli JE. Computational models for drug inhibition of the human apical sodium-dependent bile acid transporter. Mol Pharmaceutics. 2009;6:1591–1603. doi: 10.1021/mp900163d. [DOI] [PMC free article] [PubMed] [Google Scholar]
- 16.Rais R, Gonzalez PM, Zheng X, Wring SA, Polli JE. Method to screen substrates of apical sodium-dependent bile acid transporter. AAPS J. 2008;10:596–605. doi: 10.1208/s12248-008-9069-9. [DOI] [PMC free article] [PubMed] [Google Scholar]
- 17.Balakrishnan A, Hussainzada N, Gonzalez P, Bermejo M, Swaan PW, Polli JE. Bias in estimation of transporter kinetic parameters from overexpression systems: Interplay of transporter expression level and substrate affinity. J Pharmacol Exp Ther. 2007;320:133–144. doi: 10.1124/jpet.106.107433. [DOI] [PubMed] [Google Scholar]
- 18.McKay DB, Chang C, Gonzalez-Cestari TF, McKay SB, El-Hajj RA, Bryant DL, Zhu MX, Swaan PW, Arason KM, Pulipaka AB, Orac CM, Bergmeier SC. Analogs of methyllycaconitine as novel noncompetitive inhibitors of nicotinic receptors: pharmacological characterization, computational modeling, and pharmacophore development. Mol Pharmacol. 2007;71:1288–1297. doi: 10.1124/mol.106.033233. [DOI] [PubMed] [Google Scholar]
- 19.Kaler G, Truong DM, Khandelwal A, Nagle M, Eraly SA, Swaan PW, Nigam SK. Structural variation governs substrate specificity for organic anion transporter (OAT) homologs. Potential remote sensing by OAT family members. J Biol Chem. 2007;282:23841–23853. doi: 10.1074/jbc.M703467200. [DOI] [PMC free article] [PubMed] [Google Scholar]
- 20.Clark M, Cramer RD, Vanopdenbosch N. Validation of the General-Purpose Tripos 5.2 Force-Field. J Comput Chem. 1989;10:982–1012. [Google Scholar]
- 21.Gasteiger J, Marsili M. Iterative partial equalization of orbital electronegativity: A rapid access to atomic charges. Tetrahedron. 1980;36:3219–3228. [Google Scholar]
- 22.Wold S, Ruhe A, Wold H, Dunn W. Collinearity problem in linear regression. The partial least squares (pls) approach to generalized inverses. SIAM J Sci Stat Comput. 1984;5:735–743. [Google Scholar]
- 23.Lack L, Weiner IM. Intestinal bile salt transport: structure-activity relationships and other properties. Am J Physiol. 1966;210:1142–1152. doi: 10.1152/ajplegacy.1966.210.5.1142. [DOI] [PubMed] [Google Scholar]
- 24.Leo A, Hoekman DH, Hansch C. Exploring QSAR, hydrophobic, electronic, and steric constants. American Chemical Society; Washington, DC: 1995. [Google Scholar]
- 25.Leo A, Hansch C, Ekins D. Partition coefficients and their uses. Chem Rev. 1971;71:525–616. [Google Scholar]
- 26.Baringhaus KH, Matter H, Stengelin S, Kramer W. Substrate specificity of the ileal and the hepatic Na(+)/bile acid cotransporters of the rabbit. II. A reliable 3D QSAR pharmacophore model for the ileal Na(+)/bile acid cotransporter. J Lipid Res. 1999;40:2158–2168. [PubMed] [Google Scholar]
- 27.Swaan PW, Szoka FC, Jr, Oie S. Molecular modeling of the intestinal bile acid carrier: a comparative molecular field analysis study. J Comput Aided Mol Des. 1997;11:581–588. doi: 10.1023/a:1007919704457. [DOI] [PubMed] [Google Scholar]
- 28.Gonzalez PM, Acharya C, Mackerell AD, Jr, Polli JE. Inhibition requirements of the human apical sodium-dependent bile acid transporter (hASBT) using aminopiperidine conjugates of glutamyl-bile acids. Pharm Res. 2009;26:1665–1678. doi: 10.1007/s11095-009-9877-3. [DOI] [PMC free article] [PubMed] [Google Scholar]
- 29.Kagedahl M, Swaan PW, Redemann CT, Tang M, Craik CS, Szoka FC, Jr, Oie S. Use of the intestinal bile acid transporter for the uptake of cholic acid conjugates with HIV-1 protease inhibitory activity. Pharm Res. 1997;14:176–180. doi: 10.1023/a:1012044526054. [DOI] [PubMed] [Google Scholar]
- 30.Mills CO, Milkiewicz P, Saraswat V, Elias E. Cholyllysyl fluroscein and related lysyl fluorescein conjugated bile acid analogues. Yale J Biol Med. 1997;70:447–457. [PMC free article] [PubMed] [Google Scholar]
- 31.Swaan PW, Hillgren KM, Szoka FC, Jr, Oie S. Enhanced transepithelial transport of peptides by conjugation to cholic acid. Bioconjug Chem. 1997;8:520–525. doi: 10.1021/bc970076t. [DOI] [PubMed] [Google Scholar]
- 32.Giacomini KM, Huang SM, Tweedie DJ, Benet LZ, Brouwer KL, Chu X, Dahlin A, Evers R, Fischer V, Hillgren KM, Hoffmaster KA, Ishikawa T, Keppler D, Kim RB, Lee CA, Niemi M, Polli JW, Sugiyama Y, Swaan PW, Ware JA, Wright SH, Yee SW, Zamek-Gliszczynski MJ, Zhang L. Membrane transporters in drug development. Nat Rev Drug Discov. 2010;9:215–236. doi: 10.1038/nrd3028. [DOI] [PMC free article] [PubMed] [Google Scholar]
Associated Data
This section collects any data citations, data availability statements, or supplementary materials included in this article.