

Abstract
DNA methylation is a well-known epigenetic modification that plays a crucial role in gene regulation, but genome-wide analysis of DNA methylation remains technically challenging and costly. DNA methylation-dependent restriction enzymes can be used to restrict CpG methylation analysis to methylated regions of the genome only, which significantly reduces the required sequencing depth and simplifies subsequent bioinformatics analysis. Unfortunately, this approach has been hampered by complete digestion of DNA in CpG methylation-dense regions, resulting in fragments that are too small for accurate mapping. Here, we show that the activity of DNA methylation-dependent enzyme, LpnPI, is blocked by a fragment size smaller than 32 bp. This unique property prevents complete digestion of methylation-dense DNA and allows accurate genome-wide analysis of CpG methylation at single-nucleotide resolution. Methylated DNA sequencing (MeD-seq) of LpnPI digested fragments revealed highly reproducible genome-wide CpG methylation profiles for >50% of all potentially methylated CpGs, at a sequencing depth less than one-tenth required for whole-genome bisulfite sequencing (WGBS). MeD-seq identified a high number of patient and tissue-specific differential methylated regions (DMRs) and revealed that patient-specific DMRs observed in both blood and buccal samples predict DNA methylation in other tissues and organs. We also observed highly variable DNA methylation at gene promoters on the inactive X Chromosome, indicating tissue-specific and interpatient-specific escape of X Chromosome inactivation. These findings highlight the potential of MeD-seq for high-throughput epigenetic profiling.
Execution and maintenance of specific gene expression patterns in eukaryotic cells rely on epigenetic mechanisms, of which DNA methylation is the best studied (for review, see Smith and Meissner 2013). Normal methylation is essential for embryonic development, aging, and phenotype; aberrant methylation is closely associated with disease. Mammalian DNA methylation is mainly restricted to cytosines in the context of a CpG dinucleotide (Ramsahoye et al. 2000). Many gene regulatory regions, including promoters and enhancers, show a relative high density of CpG dinucleotides. These CpG islands are often devoid of CpG methylation and can become targets of de novo methyltransferases, resulting in inactivation of the associated gene(s) (Deaton and Bird 2011). CpG island methylation represents a crucial epigenetic mechanism in development, tissue maintenance, and disease development.
Despite huge efforts to understand the role of DNA methylation, only a few studies describe genome-wide methylation profiles of human tissues and cell types due to technological challenges and high costs associated with establishing these methylomes (Zhang et al. 2013; Roadmap Epigenomics Consortium et al. 2015; Schultz et al. 2015). These technologies are not well suited for high-throughput analysis and consist of several methods, many based on chemical conversion of nonmethylated cytosines into thymidines (for review, see Stirzaker et al. 2014). This bisulphite conversion step is either followed by sequencing (whole-genome bisulfite sequencing [WGBS]) (Mill et al. 2006) or by hybridization of the converted material to a chip with a specific set of probes that cover a wide range of CpG islands (e.g., the Infinium 450K technology) (Sandoval et al. 2011). Alternatively, bisulfite conversion and sequencing is preceded by a size selection step (reduced representation bisulfite sequencing [RRBS]) (Meissner et al. 2005). Unfortunately, WGBS requires that the genome is sequenced at 10 times coverage and necessitated the development of a demanding bioinformatics pipeline to align all possible sequence combinations. In addition, Infinium 450K and RRBS technologies only provide data for a limited subset of methylated CpGs. Alternative enrichment technologies, such as MeDIP and Methyl-cap technologies are based on me-CpG recognizing antibodies or methyl-binding proteins (Wilson et al. 2006; Brinkman et al. 2010). Although the bisulphite conversion step is omitted for these methods, pull down of methylated material introduces noise and an unwanted bias toward detection of CpG dense regions (Methyl-cap), or toward CpG poor regions (MeDIP); additionally, these methods do not allow single-nucleotide resolution (Bock et al. 2010; Carvalho et al. 2012).
Here, we present a novel method to perform DNA methylation analysis genome wide that provides single-nucleotide resolution without the need for deep sequencing. This method makes use of a DNA methylation-dependent restriction enzyme, LpnPI, which specifically cuts 16 bp downstream from methylated and/or hydroxymethylated CpGs, thereby focusing the sequencing resources to methylated regions only. Previous attempts applying methyl-dependent restriction enzymes to study genome-wide methylation were hampered by complete digestion of methylated CpG-dense regions, resulting in fragments too small for accurate mapping (Huang et al. 2013). In contrast, we found that LpnPI activity is restricted by a short template size, generating fragments that are consistently ≥32 bp, allowing accurate identification of DNA methylation in both CpG dense and CpG sparse regions genome wide. This Methylated DNA sequencing (MeD-seq) assay interrogates DNA methylation of >50% of all CpGs genome wide, providing a robust, convenient, and reliable alternative for existing technologies that can be implemented in standard high-throughput pipelines for determining the DNA methylome.
Results
Whole-genome DNA methylation analysis using LpnPI, MspJI, and FspEI
The MspJI family of Mrr-like modification-dependent restriction endonucleases cleave DNA after recognition of modified cytosines in a sequence-specific manner (Zheng et al. 2010; Cohen-Karni et al. 2011). Cleavage occurs at a fixed position (N12/N16) downstream from the methylated and/or hydroxymethylated cytosine, leading to around 32-bp DNA fragments, if symmetrically methylated at the CpG dinucleotide. In previous studies, MspJI and FspEI have been applied to interrogate DNA methylation genome wide, but implementation of these assays in high-throughput pipelines failed due to complete digestion, and therefore underrepresentation, of methylated CpG-rich templates. Here, we tested a third MspJI family member, LpnPI, and compared genome-wide DNA methylation maps and characteristics with MspJI and FspEI. This analysis encompasses restriction enzyme digestion and adaptor ligation, size selection, PCR amplification, and sequencing (Fig. 1A), followed by in silico analysis involving a CG filter, to retrieve the correct fragments and reduce noise, subsequent alignment, and DMR calling (Fig. 1B).
Figure 1.

MeD-seq wet laboratory and bioinformatics platform. (A) Genomic DNA is digested with LpnPI, followed by DNA repair, adaptor ligation to 32-bp fragments, size fractionation, amplification, and sequencing. (B) Sequencing reads are trimmed, filtered based on the CpG sequence, and aligned to the genome. (C) Nucleotide frequency plotted against the position in the sequencing reads, showing enrichment of CG nucleotides around 16–17 bp from the start. (D) Alignment of LpnPI, MspJI, and FspEI CpG-filtered MeD-seq reads obtained using fibroblast DNA. (E) Sequencing read profiles of the HOXA and KCNQ1 loci obtained with fibroblast DNA using LpnPI, MspJI, and FspEI. (F) Pearson correlation analysis of MeD-seq read counts of TSSs for LpnPI-MspJI (left), LpnPI-FspEI (middle), and FspEI-MspJI (right) comparisons. (G) Pearson correlation analysis of read counts of TSSs for technical replicates digested with LpnPI (left) and MspJI (right).
DNA obtained from human fibroblasts was digested and fragments blunted, followed by adaptor ligation and amplification (10 cycles after library preparation). Isolated fragments were sequenced on an Illumina HiSeq 2500 platform resulting in at least 2×10⁷ reads per digest (Supplemental Table S1). As expected, MspJI/FspEI/LpnPI recognition sites were enriched at the sixteenth base pair position in the single-ended reads, and only reads with a CpG dinucleotide at this position were aligned (Fig. 1B,C). For all restriction enzymes, ∼37%–44% of the reads could be mapped to unique sequences; only ∼1% could not be aligned (Fig. 1D). Close inspection of our sequencing data in loci with known differentially methylated regions (DMRs), indicated a clear loss of reads emanating from CpG-dense regions in MspJI and FspEI digested samples (Fig. 1E), as has been reported before (Huang et al. 2013; Wang et al. 2015). Importantly, complete digestion of heavily methylated regions was not observed for LpnPI. This difference in digestion characteristics was observed for CpG islands, and also for 2-kb regions surrounding the transcription start site (TSS) (Fig. 1F; Supplemental Fig. S1A). Comparison of LpnPI, MspJI, and FspEI read counts indicated an increase in LpnPI reads from medium and highly methylated CpG islands and TSSs, and many more hypermethylated CpG island and TSS DMRs in LpnPI digested compared to MspJI or FspEI digested samples (Fig. 1F; Supplemental Fig. S1A). In less densely methylated gene body sequences, the correlation between the different enzymes was much higher for all comparisons (Supplemental Fig. S1B). Comparison of two technical LpnPI replicates, revealed a very high correlation in CpG island, TSS, and gene body methylation (Fig. 1G; Supplemental Fig. S1C,D), which was much less pronounced for MspJI replicates, suggesting that MspJI digestion is variable and less reproducible. This analysis again indicated a reduction in CpG island and TSS reads from highly methylated regions for MspJI relative to LpnPI, which was not observed in gene bodies (Supplemental Fig. S1E). We conclude that methylated DNA sequencing with LpnPI (MeD-seq) leads to reproducible detection of DNA methylation in CpG-dense and CpG-sparse regions genome wide. In contrast, use of MspJI, and to a lesser extent FspEI, leads to complete digestion of methylated CpG-dense regions and underrepresentation of these regions in genome-wide DNA methylation analyses. We therefore continued our MeD-seq studies with LpnPI.
LpnPI digestion produces templates >32 bp
Close examination of CpG-filtered and aligned reads indicated that LpnPI recognized more CpG sequences than MspJI and FspEI. Interestingly, reads were also identified at places where the previously reported LpnPI recognition sequence SmCDS (S = C/G and D = A/T/G) was absent (Cohen-Karni et al. 2011). To determine the exact recognition sequence, we therefore applied tetranucleotide filters and by visual inspection identified LpnPI recognition motifs, which can be summarized as CmCG, mCGG, and GmCGC (Supplemental Fig. S2). No low or intermediate levels of enrichment were found for other sequences. LpnPI-mediated MeD-seq therefore detects CpG methylation at more than 16.5 million sites of the approximately 30 million CpG sites present in hg38 from UCSC.
Applying this CmCG, mCGG, and GmCGC (LpnPI) filter on reads obtained from LpnPI-digested fibroblast DNA, we also observed fragments that were significantly larger than the expected 32 bp (Fig. 2A). Close examination of these fragments indicated a second LpnPI recognition site positioned 16 bp of the 3′ end of the same fragment, thus retaining LpnPI sites on both 5′ and 3′ ends (Fig. 2B). These longer fragments are observed much more frequently than fragments <32 bp, indicating that LpnPI digestion is inhibited when fragments become smaller than 32 bp. Based on these findings, we included shorter or larger fragments than the expected 32–33 bp containing two LpnPI sites in our studies. Alignment of sequencing reads that passed our LpnPI filter showed that 34% could be mapped to unique sequences; only 3% could not be aligned (Fig. 2C). In addition, reproducibility was high, with a Pearson's correlation of 0.95 and 0.94 for technical and biological replicates examining CpG islands (Fig. 2D), and 0.92 and 0.91, respectively, for a 2-kb region surrounding transcriptional start sites (TSSs) (Supplemental Fig. S3A).
Figure 2.

Detection of DNA methylation genome wide. (A) Histogram showing sequencing read size of all reads (dark blue) and reads that passed the LpnPI filter (light blue) obtained with MeD-seq applied on human fibroblast DNA. (B) Sequencing reads larger (top) or shorter (bottom) than 32–33 bp shown in F display two LpnPI recognition sequences 16–17 bp from the end. (C) Alignment of LpnPI-filtered MeD-seq reads obtained using fibroblast DNA (left) and 100% methylated DNA (right). (D) Pearson correlation analysis of MeD-seq read counts of CpG islands for technical (left) and biological (right) replicates. (E) MeD-seq DNA methylation profiles of the HOXA cluster obtained with fibroblast DNA (top two panels) and 100% methylated control DNA (bottom two panels). (F) Ratio of digested LpnPI sites in CpG islands and TSSs for 100% methylated control DNA (top) and fibroblast DNA (bottom). (G) Overview and characteristics of LpnPI sites in CpG islands, TSSs (2 kb), gene bodies, and repetitive elements genome wide. Detection percentages are based on 100% methylated DNA. (H) Gene density plots showing distribution of LpnPI sites and CpG dinucleotides shown in 100 bins before the TSS, in the gene body, and behind the transcription stop.
To test the efficiency of LpnPI digestion on methylated templates, the analysis was repeated with 100% methylated DNA, generating 50 million reads, of which almost 70% passed the LpnPI filter. Alignment of these reads resulted in an even higher percentage of 45% uniquely aligned reads; only 2% could not be mapped (Fig. 2C). Genome-wide examination of the distribution of mapped reads revealed CpG methylation patterns specific for fibroblasts, different from profiles obtained with 100% methylated DNA, indicating regions, such as the HOXA cluster, showing reduced methylation in fibroblasts (Fig. 2E; Supplemental Fig. S3B). Our data demonstrate that 75% of all 16.5 million LpnPI sites are recognized using 100% methylated DNA (Fig. 2F). The presence of LpnPI sites that are not digested might be explained by the coverage or localization of these sites in close proximity to other LpnPI sites, where digestion is prevented by the use of flanking LpnPI sites. Consistent with this last hypothesis, we found an increase in nondigested LpnPI sites in CpG-dense regions around the TSS, which was higher than expected based on chance (Supplemental Fig. S3C). Examination of our digestion products also revealed a digestion bias toward preferential digestion of methylated CCGG over the other recognition sequences (Supplemental Fig. S3E). This bias was observed independent from the number of PCR cycles used for the library amplification, explaining the peaks observed in our analysis by an enzyme digestion bias together with prevention to digest fragments smaller than 32 bp (Supplemental Fig. S3D).
We conclude that LpnPI recognizes ∼50% of 30 million possible methylated CpG and detects most of the CpG islands and TSSs (Fig. 2G). For gene body methylation, this number is lower due to loss of small genes with overlapping TSS windows. Repeat elements like LINEs, SINEs, and LTRs contain LpnPI sites in variable amounts (40%−70% contain at least one site) and, if methylated, can be detected although less efficiently then CpG islands and TSSs. CpG dinucleotides recognized by LpnPI are distributed similarly to all CpG dinucleotides, showing strong enrichment near gene promoters and CpG islands (Fig. 2H). MeD-seq therefore robustly detects DNA methylation genome wide, facilitating detection of differential DNA methylation in CpG islands, transcriptional start sites (TSSs), and gene bodies.
MeD-seq versus other methods
Whole-genome methylation profiles have been established with different methodologies. WGBS examines >95% of the CpGs genome wide, whereas MeDIP and the 450K Infinium bead-chip interrogate 16% and 2% of the CpGs genome wide, respectively (Bock et al. 2010; Stirzaker et al. 2014). To validate our findings and compare MeD-seq to the WGBS, MeDIP, and Infinium 450K technologies, we performed MeD-seq on LpnPI-digested DNA isolated from human ES cells (HUES8). More than 30 million reads were generated, of which a minimum of 15 million filtered reads were aligned to the genome (Supplemental Table S1).
WGBS examines twice the number of CpGs present in the genome, but visual inspection of the methylation tracks, in densely and sparsely methylated regions in the genome, revealed comparable profiles of our data set with published WGBS and MeDIP sequencing and 450K data sets obtained with DNA of huES-H1 (Fig. 3A; Supplemental Fig. S4A; Schultz et al. 2015). MeD-seq coverage of CpG islands and TSS was high (Supplemental Fig. S4B). MeD-seq only detects methylated templates; therefore, the lack of reads in a significant percentage of CpG islands and TSS in HUES8 DNA likely represents biological activity of these elements (Supplemental Fig. S4B). Indeed, MeD-seq reads on fully methylated DNA revealed a much higher coverage, with a distribution better than most alternative techniques (Bock et al. 2010). Comparing MeD-seq and WGBS, we found a very high correlation for both CpG islands (Pearson 0.87) and TSS (Pearson 0.76) (Fig. 3B–D). In contrast, especially for CpG islands, both MeD-seq:MeDIP and WGBS:MeDIP comparisons revealed a lower correlation, which is likely the consequence of a preference of MeDIP to detect gene-poor regions (Fig. 3D; Supplemental Fig. S4C; Bock et al. 2010).
Figure 3.

MeD-seq versus WGBS, MeDIP, and the Infinium 450K technology. (A) MeD-seq, WGBS, and MeDIP DNA methylation profiles and Infinium 450K scores for a representative locus on Chromosome 19, obtained with human ES cell DNA. MeD-seq and MeDIP read count or relative DNA methylation level (0–1) is shown for all CpG sites. Infinium 450K scores: (dark blue) high CpG methylation; (light blue) intermediate DNA methylation; (green) low DNA methylation (based on B-value scores). (B) Correlation plots for MeD-seq:WGBS (left) and MeD-seq:MeDIP (right) comparison of CpG islands. (C) As in B, but now for TSS. (D) Overview of Pearson (P) and Spearman (S) correlation scores for different comparisons. (E) MeD-seq reads in a 100-bp window plotted against Infinium 450K scores binned in 10 different groups with increasing methylation scores for ES cell DNA. (F) As in B, but now with MeD-seq reads obtained from 100% methylated control DNA using 450K bins obtained with ES cell DNA.
We also compared MeD-seq to the Infinium 450K technology platform (Fig. 3A; Supplemental Fig. S4A). As the 450K technology only examines a few CpGs per CpG island or TSS, we divided the 450K counts into 10 different bins according to the methylation ratio obtained. MeD-seq read counts in a 100-bp window around CpGs, with at least 10 LpnPI sites, examined by the 450K technology were then plotted per bin. This analysis indicated a strong correlation between the 450K and MeD-seq technologies (Fig. 3E; Supplemental Fig. S4E). In contrast, this correlation was absent when MeD-seq read counts obtained with 100% methylated DNA were plotted against binned 450K scores obtained with DNA from huES1 (Fig. 3F). These results indicate that MeD-seq provides high-coverage genome-wide DNA methylation profiles.
DNA methylation profiling of human tissues
Examination of our data after in silico dilution of our data obtained for iPS cells and fibroblasts indicated that we approach saturation in DMR detection using between 73 and 53 million LpnPI-filtered reads. Interestingly, a 10-fold reduction in LpnPI-filtered reads still results in a Pearson's correlation above 0.77 for all TSS and CpG island comparisons, indicating that even at a very low sequencing depth, we were able to call DMRs with high confidence between different samples (Fig. 4A; Supplemental Fig. S5A). This indicated that a sequencing depth of a few million reads will be sufficient to detect the most significant differentially methylated CpG islands and TSSs. To test applicability of MeD-seq at low sequencing depth for genome-wide DMR detection, we performed MeD-seq on blood, saliva, thymus, ovary, liver, and brain from 10 female individuals, for which most tissues or organs were available (Fig. 4B). Per sample, 15 million reads were generated, of which a minimum of 7 million filtered reads were aligned to the genome (Supplemental Table S1).
Figure 4.

Tissue-specific DMRs. (A) DMR counts for TSSs and CpG islands and Pearson correlation analysis of TSSs upon in silico dilution starting with 150 million reads. (B) DNA was collected of available organs (green) from 10 different female patients. (C) Correlation analysis of TSS read counts between blood samples of different patients. (D) Correlation analysis of TSS read counts between different organs of the same patients. (E) MeD-seq tracks of ribosomal RNA cluster in DNA of blood and thyroid from patients 8, 3, and 4. (F) Unsupervised hierarchical clustering of tissues based on differentially methylated CpG islands. Statistical significance was called by χ2 testing and Bonferroni correction, the Z-scores of the read count are shown in the heatmap. (G) MeD-seq tracks of the HOXB and HOXD loci displaying differential methylation in TSS and CpG islands in different tissues.
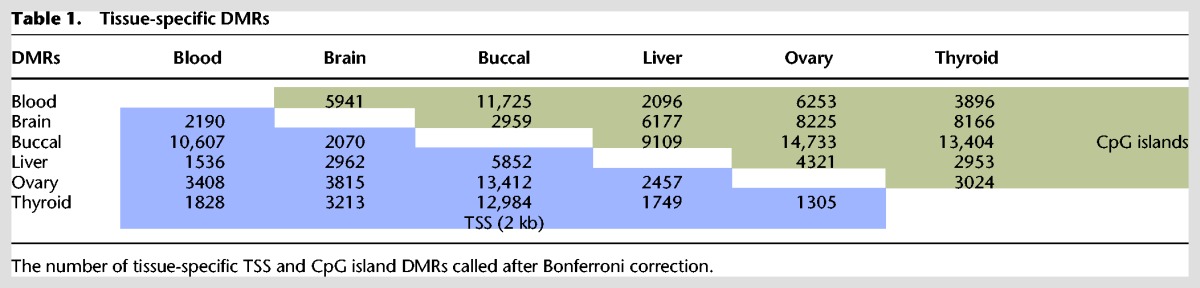
Inter-tissue DMRs were identified by calling CpG island and TSS-specific DMRs in between tissues, combining all filtered and mapped reads per tissue (Supplemental Table S1). Significant DMRs were called by using χ2 test values followed by Bonferroni or FDR-Benjamini-Hochberg (P < 0.05) correction, revealing a high number of DMRs (Table 1). This analysis revealed many more DMRs for buccal DNA compared to all other combinations analyzed. Interestingly, interpatient comparison of CpG island and TSS methylation in the same organs and tissues indicated prominent patient-specific hypermethylation of several regions in the genome. Hypermethylated CpG islands and TSSs were observed between patients and to a lesser extent in intra-patient comparisons (Fig. 4C,D; Supplemental Fig. S5B). These patient-specific differentially hypermethylated TSSs and CpG islands represented methylated ribosomal RNA gene clusters, including 5S, 28S rRNA, pRNA, and micro-RNA genes located to Chromosomes 1 and 21, likely representing copy number variations of ribosomal RNA gene clusters (Fig. 4E). Other differentially methylated regions include the DUX4 gene clusters, which are located in highly repetitive regions on several chromosomes, known to be subject to copy number variations (Caburet et al. 2005; Leidenroth et al. 2012).
Table 1.
Tissue-specific DMRs
CpG island or TSS-specific DMRs were used to test whether differential DNA methylation profiles can direct unsupervised hierarchical clustering of tissues. To limit the number of DMRs, we excluded buccal-specific DMRs, and only included DMRs showing a 10-fold difference in DNA methylation levels or more. In addition, we excluded CpG islands and TSSs with more than 1000 and 200 reads, respectively, to exclude patient-specific DMRs associated with repetitive DNA. This approach revealed 1987 differentially methylated CpG islands. Unsupervised cluster analysis, using differentially methylated CpG islands, clustered most tissues and organs together as separate groups, with some notable exceptions, possibly related to patient-specific methylation profiles (blood and liver) or differences in the composition of cell types within an organ (Fig. 4F). Examination of DNA methylation tracks confirmed the presence of DMRs in important loci, such as the HOX and TBX loci, both involved in segmentation of the early embryo (Fig. 4G; Acampora et al. 1987). Unsupervised clustering using read counts observed in a 2-kb TSS window of all HOX and TBX genes revealed a picture nearly identical to experiments including all CpG islands, showing preferred clustering of the same tissues, with the exception of some, that show clustering of organs of the same patients (Supplemental Fig. S5C). This indicates that MeD-seq provides a robust and sensitive methodology to study the methylome at a low sequencing depth.
DNA methylation profiles of accessible versus inaccessible tissues
Several studies have investigated whole-genome DNA methylation analysis on easily accessible tissues such as blood or saliva (van Dongen et al. 2015; Boström et al. 2016; Houtepen et al. 2016; Montano et al. 2016; Li et al. 2017). However, it is unclear how well changes in methylation in these tissues correspond to changes in other tissues or organs in the body (Huang et al. 2016). Tissue-specific DMR analysis indicated that many DMRs are tissue specific and might not be useful in predicting DNA methylation in other organs. Nevertheless, interpatient comparison of DMRs in the same organs also revealed a variable but high number of patient-specific DMRs in all organs tested (Supplemental Fig. S6A–D). To better understand the interdependence of these patient-specific DNA methylation patterns between organs, we identified interpatient-specific DMRs by first establishing pooled data files from all available tissues per patient (Fig. 5A). For this analysis, we excluded buccal samples as these samples showed many more hypermethylated DMRs compared to other tissues. We made a distinction between TSS and CpG islands with more or less than 200 and 1000 reads, respectively, resulting in 0–1644 patient unique DMRs consistent in all tissues (Fig. 5B,C). As this number is dependent on the number of patients included, we also determined patient-specific DMRs that showed consistent DMRs in all tissues but were not unique. This analysis revealed between 1500 and 3500 differentially methylated TSSs, and between 1100 and 14,000 differentially methylated CpG islands (Fig. 5B,C). Interestingly, in contrast to TSS DMRs, many more differentially methylated CpG islands were found in the group with fewer than 1000 reads, indicating that most patient-specific DMRs are found in unique nonrepetitive CpG islands that do not overlap with TSSs.
Figure 5.

Patient-specific and unique DMRs. (A) MeD-seq data was pooled per patient to call interpatient-specific and unique TSS and CpG island DMRs that show differential methylation consistent in all tested tissues. (B) Overview showing the number of patient-specific and patient-unique TSS and CpG island DMRs identified. TSS and CpG island DMRs with a read count of more or less than 200 and 1000, respectively, are shown separately. (C) MeD-seq tracks showing patient-specific differential methylation of the ADAM3A TSS and patient-unique methylation of two CpG islands. (D) Patient-specific TSS DMRs were determined for blood that showed consistent DMRs in other organs tested. (E) Percentage of blood-specific TSS DMRs also present in liver, ovary, and thyroid in patient comparisons. (F) Percentage of blood-specific CpG island DMRs also present in liver, ovary, and thyroid in patient comparisons. (G) MeD-seq tracks showing blood-specific DMRs present in all organs (left), no other tested organ (ZNF529, middle), or some organs (DUSP22, right). (H) Percentage of CpG island DMRs present both in blood and buccal and also present in liver, ovary, and thyroid. (I) Correlation plots showing blood TSS DMRs also present in buccal (top) and blood CpG island DMRs also present in buccal (bottom) for patients 3 and 4.
For many studies, DNA isolated from blood is the only source for genetic and epigenetic profiling in relation to disease. To test how predictive interpatient-specific blood DMRs were for the presence or absence of DNA methylation in the inaccessible tissues, thyroid, liver, and ovary, we first determined interpatient-specific DMRs in blood and related these to DMRs present in other organs (Fig. 5D). This analysis indicated a wide variability of blood-predicted TSS and CpG island-associated DMRs in other tissues ranging between 4% and 73% (Fig. 5E–G). This variability was present in all tested tissues and was unrelated to blood as source material, as similar variability was observed in inter-organ comparisons (Supplemental Fig. S6E,F). To test whether we could enhance prediction of blood DMRs present in other tissues, we also determined buccal DMRs for patients for which both blood and buccal samples were available. This indicated that TSS DMRs present in DNA obtained from buccal swabs predict DMRs in other tissues more reliably than blood (Supplemental Fig. S6G–J). By selecting blood-specific DMRs also present in buccal samples of the same patients, prediction of patient-specific DMRs increased to percentages between 42% and 98% (Fig. 5H; Supplemental Fig. S6K–M). For TSSs, most of these highly predictive DMRs represented multicopy gene loci, suggesting that most of the patient-specific DMRs represent copy number variations (Fig. 5I). In contrast, CpG island DMRs present in tissues and organs predicted by overlapping DMRs in blood and buccal represent nonrepetitive unique regions and might represent patient-specific differential regulation of gene expression. We conclude that most interpatient-specific DMRs are also tissue specific, and therefore unreliable predictors for DNA methylation profiles in other tissues in the human body. Nevertheless, use of DMRs detected in two accessible tissues facilitates reliable prediction of DMRs present in other tissues and organs.
Escape of X Chromosome inactivation
In all female mammalian cells, one of the two X Chromosomes is inactivated. X Chromosome inactivation (XCI) involves a multitude of epigenetic mechanisms in gene silencing, including DNA methylation of TSSs and/or CpG islands on the inactive X Chromosome (Xi). In human fibroblasts, up to 15% of genes located on the Xi escape XCI to some degree, categorized in 203 genes that are completely or near completely silenced (groups 0–1), 69 genes showing different degrees of partial escape (groups 2–7), and 40 genes that display near complete or complete escape to XCI (groups 8–9) (Carrel and Willard 2005). It has been shown that these levels of escape correlated with increased gene body methylation and reduced CpG methylation at TSSs (Schultz et al. 2015). Our MeD-seq studies on organs and tissues were performed on female material to be able to study XCI escape in different tissues. Analysis of TSS and gene body methylation with expression levels of genes ranked in four different expression groups, using available expression data, confirmed an anti-correlation between TSS methylation and gene expression genome wide, although this anti-correlation did not discriminate between genes expressed at middle and high expression levels (Fig. 6A; Supplemental Fig. S7A). Previous studies showed that genes escaping XCI are expressed at reduced levels (<50%) compared to the copy located on the active X, and expression of escaping genes might therefore mostly fall in the lower and middle expression classes (Carrel and Willard 2005). Indeed, comparison of the TSS MeD-seq read counts between groups 0–1, 2–7, and 8–9 confirms an anti-correlation between XCI escape and DNA methylation (Fig. 6B). In contrast, gene body methylation appeared variable, showing tissue-specific profiles with no clear relationship between methylation and expression, indicating that gene body methylation cannot be used as a reliable readout for gene expression in all tissues. Analysis of TSS methylation of all X-linked genes, and close examination of genes known to be subject to XCI (HPRT, MECP2, and RNF12 [RLIM]), showing partial (PHF6) or full (USP9X, KDM5C) escape of XCI, confirms the correlation between TSS methylation and XCI in male and female fibroblasts (Fig. 6C,D; Supplemental Fig. S7C), absent for gene body methylation (Supplemental Fig. S7B). We also detected TSS methylation of all three human RHOX homeobox genes (RHOX1, RHOX2, and RHOX2B), which are very difficult to analyze by arrays due to their repetitive nature (Supplemental Fig. S7C). In addition, TSS-specific DNA methylation profiling detected X Chromosome loss and break point detection with DNA obtained from a fibroblast cell line harboring a MLPA mapped 50 megabase deletion of the inactive X Chromosome (Fig. 6E), indicating that TSS methylation can be used as a benchmark for the XCI status of X-linked genes (Barakat et al. 2015).
Figure 6.

Organ and patient-specific escape of XCI. (A) Gene density plots showing DNA methylation profiles for genes of four different expression groups for liver (top) and brain (bottom). DNA methylation level is shown in 100 bins before the TSS, the gene body, and behind the transcriptional stop. (B) TSS-specific MeD-seq reads (Log2) for genes subject to XCI (group 0–1), partially escaping XCI (groups 2–7), and nearly completely escaping XCI (groups 8–9) in liver. (C) Bar graph showing the ratio of TSS methylation of X-linked genes, subject to XCI (group 0–1), partially escaping XCI (groups 2–7), and nearly completely escaping XCI (groups 8–9), in female versus male fibroblasts. (D) MeD-seq tracks displaying DNA methylation in genes subject to XCI (HPRT, top), partially escaping XCI (PHF6, middle), and escaping XCI (USP9X, bottom). (E) Ratio of TSS read counts for female X12 deletion and male control fibroblasts along the X Chromosome. The sliding average of 10 TSSs is shown, and the exact break point determined by MLPA analysis is shown below (light blue). (F) Inter-organ DMRs were called and displayed according to the escape group. TSS DMRs are shown that were significant for all tissues by Bonferroni testing, colored according to the Z-score. (G) MeD-seq tracks of TSS-specific DMRs for PHF6 and GLA that show hypomethylation in brain. (H) Z-scores for TSSs of genes selected based on a brain-specific methylation pattern of 0–1, 2–7, and 8–9 genes shown in organs of individual patients.
To study tissue-specific escape of XCI, MeD-seq reads were combined per tissue and grouped according to escape groups. Overall, completely and near completely silenced genes showed the highest TSS DNA methylation levels (group 0–1), partially methylated genes showed lower levels of DNA methylation (groups 2–7), whereas escaping genes showed the lowest level of methylation (groups 8–9) (Fig. 6F). Intra-tissue comparison revealed 126 (88 group 0–1; 27 group 2–7; 11 group 8–9) genes that showed changes in methylation in all tissues, and 290 (191 group 0–1; 63 group 2–7; 36 group 8–9) genes showing changes in at least one tissue (Fig. 6F–H; Supplemental Fig. S7C). In brain we observed many more TSSs with decreased DNA methylation, indicating more prominent escape of XCI in brain compared to all other tissues analyzed. Our findings suggest that escape of XCI can be modulated and is likely associated with expression changes as brain-specific genes are reported to be enriched on the X Chromosome. Close inspection of DNA methylation levels of TSSs of genes expressed in brain, and showing brain-specific methylation profiles, confirmed brain-specific hypomethylation in individual patients, but also revealed heterogeneity in methylation levels in brain and other tissues or organs (Fig. 6H). This indicates that the level of escape of XCI is, at least to some degree, patient and tissue specific, which might have important implications with respect to manifestation of X-linked diseases in women.
Discussion
We developed MeD-seq, a novel technology to interrogate CpG methylation profiles genome wide that produces better coverage and is more accurate and cost effective. MeD-seq has the potential to be adapted for high-throughput analysis, and because of its simplicity, can alleviate the burden of large-scale computational analysis. Studies have attempted to apply methyl-dependent restriction enzymes to establish genome-wide CpG methylation profiles, but failed due to complete digestion of CpG-dense hypermethylated templates (Huang et al. 2013; Wang et al. 2015). In this study we show that, in contrast to MspJI and FspEI, LpnPI activity is limited by a small template size, possibly by steric hindrance, thereby producing fragments of at least 32 bp in size. This enzyme is therefore suitable for detecting DNA methylation profiles in CpG-dense and CpG-poor regions. In addition, both MspJI and FspEI have more specific recognition sites than LpnPI, and therefore recognize fewer CpGs genome wide. Also, in contrast to LpnPI, not all MspJI and FspEI recognition sites are palindromic, leading to a significant percentage of large fragments that are more difficult to capture and analyze. In silico, LpnPI detects approximately 55% of CpGs present in the genome; experimentally, 41% of all CpGs were interrogated. Loss of methylated CpGs detected was found to increase in CpG-dense regions. In addition, we found a preference for digestion of CCGG over other LpnPI recognition sequences, indicating that in hypermethylated regions, LpnPI prefers digestion of specific methylated CpGs. Nevertheless, our studies indicate that MeD-seq is very reproducible and this preference is consistent. Although this study focused on CpG methylation profiles, MeD-seq can also be applied to study other forms of methylation. LpnPI digests hydroxymethylated CpGs and also recognizes non-CpG methylation in the context CCWGG, a common form of methylation in plants.
Due to cell-to-cell variability in the methylation state of any given CpG site, whole-genome bisulfite sequencing (WGBS) requires a daunting 10-fold sequencing coverage of the full genome in order to provide a reliable assessment of CpG methylation. MeD-seq provides a more cost effective alternative to WGBS since fewer sites, only 16.5 million potentially methylated CpGs, need to be interrogated in order to create an accurate profile. This means that in a mammalian cell with 70% methylation of all CpGs, approximately 11.6 million reads represent the equivalent of a 1× genome-wide coverage when all LpnPI sites are recognized. Bisulfite treatment of LpnPI fragments prior to sequencing could even further increase complexity and depth of the data and would limit the WGBS technology to methylated CpGs only. The present study indicates that for general interpatient and inter-organ comparisons, a coverage of 1× appeared to be sufficient to reliably detect DMRs with high confidence. In fact, in silico analysis indicates that reduction of the number of reads to 7 million still results in a Pearson score of 0.89 when comparing different data sets. Although this sequencing depth will be sufficient to call the most significant DMRs for a thorough analysis of all DMRs or allele-specific DNA methylation analysis based on associated SNPs a higher sequencing depth of about 150 million reads is required.
The percentage of reads that passed the filter and could eventually be mapped was variable. We found this to be directly related to DNA quality, dependent on the presence of degraded DNA. Quality was low for most frozen material samples; in contrast, samples obtained from fresh material (fibroblasts) resulted in >70% reads that passed the filter and were mapped. In addition to cost-effectiveness, MeD-seq also represents a simpler method, omits noise and the need for pull down or bisulfite conversion steps, as well as the need for additional software packages to analyze the data as required for WGBS or RRBS. MeD-seq provides read count–based data similar to RNA-seq, and succeeded in recapitulating ratio-based data obtained with WGBS, and the Infinium 450K technology. Using a fully methylated reference and imprinted gene loci, we were able to transform MeD-seq read counts into a percentage of methylation for CpG islands or TSSs. However, for DMR calling, analyzing read counts proved more robust than using percentages of methylation. Similarly to enrichment-based genome-wide techniques detecting relative DNA methylation changes, MeD-seq also requires downstream validation for biological relevance of detected DMRs. Since LpnPI is methylation dependent, unmethylated regions remain undetected. Therefore, a modified LpnPI, recognizing unmethylated DNA or DNA irrespective of the methylation status, will be very useful, either to improve methylation quantification from MeD-seq data or to prevent false positive DMR detection based on aneuploidy, e.g., in the field of cancer research. Alternatively, DNA methylation insensitive restriction enzymes could be applied in conjunction with LpnPI, to provide reference sequences for normalization.
MeD-seq analysis of tissues of different patients revealed patient-specific DNA methylation profiles of highly repetitive genes and regions such as ribosomal RNA and DUX clusters. Previous work has shown that ribosomal RNA genes are located, as tandem arrays, on the five acrocentric chromosomes in humans (Caburet et al. 2005). A large subset of these genes are transcriptionally repressed by DNA methylation and specific post-translational histone modifications, and our patient-specific DNA methylation profiles of these repetitive gene loci likely represent copy number variations (Grummt and Längst 2013). In addition, we found that MeD-seq can detect DNA repeat elements like LINEs, SINEs, and LTRs when they are methylated; however, due to the low average number of LpnPI sites, these short elements contain a higher sequence coverage that is required to detect DMRs at the loci than currently used.
Our study also revealed many patient-specific DMRs present in all tested organs. Most of these DMRs represented CpG islands and suggest that most of the variability in CpG methylation is confined to distal gene regulatory regions rather than TSSs, despite the fact that 60% of TSSs are overlapping with CpG islands (Illingworth et al. 2010). This is consistent with several other studies that indicate that variation and evolution of gene regulatory landscapes is mostly related to genetic changes in enhancer elements and not in genic sequences (Andersson et al. 2014; Villar et al. 2014). Differential DNA methylation is likely to contribute to this variation by affecting enhancer activity. The nature of this variation is unclear, but could be genetically or environmentally instructed, and several of the identified DMRs might likely represent metastable epi-alleles. Interestingly, interpatient comparison also revealed a subset of patient-specific DMRs that are present in all tissues and organs. Using blood and buccal samples, we were even able to reliably predict DMRs in other organs and tissues. Although for TSS DMRs, this mostly revealed repetitive genes, many CpG island DMRs predicted using a blood–buccal comparison represented single-copy genes, reiterating that patient-specific variability in DNA methylation is mostly found in CpG islands and not TSSs.
DNA methylation and XCI are tightly linked, and the present study supports previous findings indicating that DNA methylation levels of TSSs of X-linked genes correlate directly with gene expression and the degree of escape (Schultz et al. 2015). Interestingly, with the exception of liver, no consistent relationship between gene body methylation and gene expression was found, contrasting a previous study that concluded that gene body DNA methylation provided the best readout for XCI escape (Schultz et al. 2015). TSS methylation levels should therefore be preferred to predict gene expression levels and predict escape of XCI. This study also reveals a high tissue and patient-specific variability in DNA methylation of TSSs of X-linked genes, indicating that escape of XCI is variable but is most pronounced in the brain. This finding is likely related to the fact that many X-linked genes are brain specific and indicates that escape can be modulated, which has important implications for our understanding of X-linked diseases.
These present studies illustrate the power of MeD-seq as a cost effective, high coverage, accurate and reproducible DNA methylation detection platform. It provides the right technology to perform large population studies or extensive epigenomic profiling that can be easily incorporated into the laboratory without significant infrastructure or bioinformatics. With simple modifications, this technology will also be amendable to retrieve DNA methylation profiles of FFPE-treated material or single cells, providing a new exciting platform to address a wide range of biological questions.
Methods
Human samples
All samples used in this study were obtained from the Erasmus MC Tissue Bank, in accordance with the Dutch Law on Medical Research and autopsy materials, and were only used for research after permission was obtained through signed informed consent from the next of kin. Tissue samples were collected during autopsies performed at the Erasmus Medical Centre in Rotterdam, between June 2012 and August 2014 (de Hoon et al. 2015). Tissue samples were snap frozen, and DNA was extracted using phenol-chloroform purification. Blood samples could not be extracted by peripheral vein puncture and were therefore obtained through cardiac puncture. Ovarian samples were cut by hand from the ovarian cortex, and only selected regions that did not contain visible follicles were obtained. Fully methylated human genomic DNA was ordered from EpigenDX (Human High Methylated DNA control, 80-8061-HGHM5, HS091514) and HUES8 were acquired via NIH.
DNA preparation
DNA from either fibroblast, huES, or tissue samples was extracted using phenol-chloroform (Sigma-Aldrich) extraction. If needed, tissues were homogenized before lysis. After isopropanol (Sigma-Aldrich) precipitation, DNA was washed with 70% ethanol and dissolved in 20 mM Tris, pH 8.0. LpnPI, FspEI, and MspJI (New England Biolabs) digestions were carried out according to the manufacturer's protocol. Reactions contained 1000 ng in a 30-µL volume, and digestion took place overnight in the absence of enzyme activators.
Sample preparation and next-generation sequencing
Digests of genomic DNA with LpnPI resulted in snippets of 32 bp around the fully methylated recognition site that contains CpG. These short fragments were either purified on TBE gel before preparation or purified by Pippin system gel after preparation.
Gel purification was performed with 10% TBE gels using the Xcell SureLock system (ThermoFisher). Sixty microliters of each sample was loaded on the gel, leaving at least one empty well between samples. After running, gels were colored by ethidiumbromide and scanned on a Typhoon Trio (GE Healthcare). DNA was cut out based on ladder sizes at 30–40 bp and extracted from gel using gel breaker tubes and centrifugation. DNA was washed with 70% EtOH and dissolved in 10 mM Tris-HCl, pH 8.5. The 32-bp DNA fragments were prepared for sequencing following the manufacturer's instructions using a Rubicon Genomics ThruPLEX DNA-seq kit. Stem–loop adaptors were blunt-end ligated to repaired input DNA and amplified (4 +10 cycles) to include dual indexed barcodes using a high fidelity polymerase to yield an indexed Illumina NGS library.
For Pippin gel purification, the DNA concentration was determined by the Quant-iT High-Sensitivity assay (Life Technologies; Q33120), and 50 ng ds DNA was prepared using the ThruPLEX DNA-seq 96D kit (Rubicon Genomics, catalog #R400407). Twenty microliters of amplified end product was purified on a Pippin HT system with 3% agarose gel cassettes (Sage Science).
Multiplexed samples were sequenced on Illumina HiSeq 2500 systems for single reads of 50 bp according to the manufacturer's instructions. Dual indexed samples were demultiplexed using bcl2fastq software (Illumina).
WGBS, MeDIP, and Infinium 450K array
WGBS, MeDIP, and Infinium 450K data were retrieved from ENCODE (https://www.encodeproject.org; WGBS; ENCFF263KSB and 450K; ENCLB121ZZZ) and NBCI/SRA (https://www.ncbi.nlm.nih.gov/sra/SRX020007; MeDIP).
MeD-seq data processing
Data processing was carried out using specifically created scripts in Python. Raw FASTQ files were subjected to Illumina adaptor trimming, and reads were filtered based on LpnPI restriction site occurrence between 13 and 17 bp from either 5′ or 3′ end of the read. Reads that passed the filter were mapped to hg38 using Bowtie 2 (Langmead and Salzberg 2012). Mapped reads were used to assign read count scores to each individual LpnPI site in the hg38 genome. SAM and BAM files were generated using SAMtools for visualization. Gene and CpG island annotations were downloaded from Ensembl (https://www.ensembl.org). Genome-wide individual LpnPI site scores were used to generate read count scores for the following annotated regions: TSS (1 kb before and 1 kb after), CpG islands, and gene body (1 kb after TSS until transcription end site [TES]).
LpnPI filter validation
Filter validation was carried out in Python. Distribution of a specific DNA sequence in the trimmed reads was plotted and analyzed for enrichment at the 16-bp position. Only CpG containing sequences were tested based on previously published work (Cohen-Karni et al. 2011) and were summarized in an LpnPI recognition sequence. Read length distribution was plotted for all trimmed reads and filtered reads. Reads with a length outside the expected 32–33bp were used to plot the LpnPI site distribution.
Data analysis
Data analysis was carried out in Python. Correlations between data sets were calculated using the Pearson or Spearman coefficient after log10 transformation of read counts, and outliers (Z-score >5.0) were excluded and graphs created using matplotlib (Hunter et al. 2007).
Genomic distribution of LpnPI sites was shown by generating 100 bins of 100 bp (10 kb), either upstream of the TSS or downstream from the TES. Gene body bins were generated using genes with a minimal gene size of 100 bp and dividing each gene body into 100 bins of 1% of the total gene body size. For each bin, the number of LpnPI sites are plotted. To compare pre-TSS and post-TES regions (10 kb) to the gene body regions, LpnPI site count for each gene body bin are adjusted for gene size and 10-kb region. Similarly, genomic distribution of read counts were shown by dividing the read count by the number of LpnPI sites in each bin and adjusted for gene size. Subgroups were made based on RNA-seq data from Expression Atlas 3.0 (Petryszak et al. 2016).
Comparison of MeD-seq data and 450K array data was done generating 100-bp regions around the 450K probe, 50 bp flanking both sides of the interrogated CpG by the assigned probe. Only regions containing 10 or more LpnPI sites were used for comparison with 450K array data. 450K array probes were put into 10 different bins, based on percentage of methylation (0%–100%), and MeD-seq read counts were plotted from the assigned probe regions. Similar analysis was done between WGBS data using the same 100-bp regions. Scatterplot comparison between MeD-seq, WGBS, and MeDIP-seq was preformed using log10 transformed read counts (MeD-seq and MeDIP-seq) divided by the amount of CpG sites present inside the 2-kb TSS or CpG island window and compared with average methylation percentage (WGBS) in the appropriate window.
DMR detection was performed between two data sets containing the regions of interest (TSS, gene body, or CpG islands) using the χ2 test on read counts. Significance was called by either Bonferroni or FDR using the Benjamini-Hochberg procedure (Benjamini and Hochberg 1995). Differently methylated regions were used for unsupervised hierarchical clustering; the Z-score of the read counts was used for normalization and is also shown in the heatmaps.
Data access
The data from this study have been submitted to the NCBI Sequence Read Archive (SRA; https://www.ncbi.nlm.nih.gov/sra) under accession number SRP100405.
Supplementary Material
Acknowledgments
We thank all laboratory members for helpful discussions. This work was supported by NWO VICI and ERC consolidator grants.
Footnotes
[Supplemental material is available for this article.]
Article published online before print. Article, supplemental material, and publication date are at http://www.genome.org/cgi/doi/10.1101/gr.222885.117.
References
- Acampora D, Pannese M, D'Esposito M, Simeone A, Boncinelli E. 1987. Human homoeobox-containing genes in development. Hum Reprod 2: 407–414. [DOI] [PubMed] [Google Scholar]
- Andersson R, Gebhard C, Miguel-Escalada I, Hoof I, Bornholdt J, Boyd M, Chen Y, Zhao X, Schmidl C, Suzuki T, et al. 2014. An atlas of active enhancers across human cell types and tissues. Nature 507: 455–461. [DOI] [PMC free article] [PubMed] [Google Scholar]
- Barakat TS, Ghazvini M, de Hoon B, Li T, Eussen B, Douben H, van der Linden R, van der Stap N, Boter M, Laven JS, et al. 2015. Stable X chromosome reactivation in female human induced pluripotent stem cells. Stem Cell Reports 4: 199–208. [DOI] [PMC free article] [PubMed] [Google Scholar]
- Benjamini Y, Hochberg Y. 1995. Controlling the false discovery rate: a practical and powerful approach to multiple testing. J R Statist Soc Ser B (Methodol) 57: 289–300. [Google Scholar]
- Bock C, Tomazou EM, Brinkman AB, Müller F, Simmer F, Gu H, Jäger N, Gnirke A, Stunnenberg HG, Meissner A. 2010. Quantitative comparison of genome-wide DNA methylation mapping technologies. Nat Biotechnol 28: 1106–1114. [DOI] [PMC free article] [PubMed] [Google Scholar]
- Boström AE, Mwinyi J, Voisin S, Wu W, Schultes B, Zhang K, Schiöth HB. 2016. Longitudinal genome-wide methylation study of Roux-en-Y gastric bypass patients reveals novel CpG sites associated with essential hypertension. BMC Med Genomics 9: 20. [DOI] [PMC free article] [PubMed] [Google Scholar]
- Brinkman AB, Simmer F, Ma K, Kaan A, Zhu J, Stunnenberg HG. 2010. Whole-genome DNA methylation profiling using MethylCap-seq. Methods 52: 232–236. [DOI] [PubMed] [Google Scholar]
- Caburet S, Conti C, Schurra C, Lebofsky R, Edelstein SJ, Bensimon A. 2005. Human ribosomal RNA gene arrays display a broad range of palindromic structures. Genome Res 15: 1079–1085. [DOI] [PMC free article] [PubMed] [Google Scholar]
- Carrel L, Willard HF. 2005. X-inactivation profile reveals extensive variability in X-linked gene expression in females. Nature 434: 400–404. [DOI] [PubMed] [Google Scholar]
- Carvalho RH, Haberle V, Hou J, van Gent T, Thongjuea S, van Ijcken W, Kockx C, Brouwer R, Rijkers E, Sieuwerts A, et al. 2012. Genome-wide DNA methylation profiling of non-small cell lung carcinomas. Epigenetics Chromatin 5: 9. [DOI] [PMC free article] [PubMed] [Google Scholar]
- Cohen-Karni D, Xu D, Apone L, Fomenkov A, Sun Z, Davis PJ, Kinney SR, Yamada-Mabuchi M, Xu SY, Davis T, et al. 2011. The MspJI family of modification-dependent restriction endonucleases for epigenetic studies. Proc Natl Acad Sci 108: 11040–11045. [DOI] [PMC free article] [PubMed] [Google Scholar]
- de Hoon B, Monkhorst K, Riegman P, Laven JS, Gribnau J. 2015. Buccal swab as a reliable predictor for X inactivation ratio in inaccessible tissues. J Med Genet 52: 784–790. [DOI] [PMC free article] [PubMed] [Google Scholar]
- Deaton AM, Bird A. 2011. CpG islands and the regulation of transcription. Genes Dev 25: 1010–1022. [DOI] [PMC free article] [PubMed] [Google Scholar]
- Grummt I, Längst G. 2013. Epigenetic control of RNA polymerase I transcription in mammalian cells. Biochim Biophys Acta 1829: 393–404. [DOI] [PubMed] [Google Scholar]
- Houtepen LC, van Bergen AH, Vinkers CH, Boks MP. 2016. DNA methylation signatures of mood stabilizers and antipsychotics in bipolar disorder. Epigenomics 8: 197–208. [DOI] [PubMed] [Google Scholar]
- Huang X, Lu H, Wang JW, Xu L, Liu S, Sun J, Gao F. 2013. High-throughput sequencing of methylated cytosine enriched by modification-dependent restriction endonuclease MspJI. BMC Genet 14: 56. [DOI] [PMC free article] [PubMed] [Google Scholar]
- Huang YT, Chu S, Loucks EB, Lin CL, Eaton CB, Buka SL, Kelsey KT. 2016. Epigenome-wide profiling of DNA methylation in paired samples of adipose tissue and blood. Epigenetics 11: 227–236. [DOI] [PMC free article] [PubMed] [Google Scholar]
- Hunter JD. 2007. Matplotlib: a 2D graphics environment. Computing in Science & Engineering 9: 90–95. [Google Scholar]
- Illingworth RS, Gruenewald-Schneider U, Webb S, Kerr AR, James KD, Turner DJ, Smith C, Harrison DJ, Andrews R, Bird AP. 2010. Orphan CpG islands identify numerous conserved promoters in the mammalian genome. PLoS Genet 6: e1001134. [DOI] [PMC free article] [PubMed] [Google Scholar]
- Langmead B, Salzberg SL. 2012. Fast gapped-read alignment with Bowtie 2. Nat Methods 9: 357–359. [DOI] [PMC free article] [PubMed] [Google Scholar]
- Leidenroth A, Clapp J, Mitchell LM, Coneyworth D, Dearden FL, Iannuzzi L, Hewitt JE. 2012. Evolution of DUX gene macrosatellites in placental mammals. Chromosoma 121: 489–497. [DOI] [PubMed] [Google Scholar]
- Li S, Zhu D, Duan H, Ren A, Glintborg D, Andersen M, Skov V, Thomassen M, Kruse T, Tan Q. 2017. Differential DNA methylation patterns of polycystic ovarian syndrome in whole blood of Chinese women. Oncotarget 8: 20656–20666. [DOI] [PMC free article] [PubMed] [Google Scholar]
- Meissner A, Gnirke A, Bell GW, Ramsahoye B, Lander ES, Jaenisch R. 2005. Reduced representation bisulfite sequencing for comparative high-resolution DNA methylation analysis. Nucleic Acids Res 33: 5868–5877. [DOI] [PMC free article] [PubMed] [Google Scholar]
- Mill J, Yazdanpanah S, Gückel E, Ziegler S, Kaminsky Z, Petronis A. 2006. Whole genome amplification of sodium bisulfite-treated DNA allows the accurate estimate of methylated cytosine density in limited DNA resources. Biotechniques 41: 603–607. [DOI] [PubMed] [Google Scholar]
- Montano C, Taub MA, Jaffe A, Briem E, Feinberg JI, Trygvadottir R, Idrizi A, Runarsson A, Berndsen B, Gur RC, et al. 2016. Association of DNA methylation differences with schizophrenia in an epigenome-wide association study. JAMA Psychiatry 73: 506–514. [DOI] [PMC free article] [PubMed] [Google Scholar]
- Petryszak R, Keays M, Tang YA, Fonseca NA, Barrera E, Burdett T, Füllgrabe A, Fuentes AM, Jupp S, Koskinen S, et al. 2016. Expression Atlas update—an integrated database of gene and protein expression in humans, animals and plants. Nucleic Acids Res 44: D746–D752. [DOI] [PMC free article] [PubMed] [Google Scholar]
- Ramsahoye BH, Biniszkiewicz D, Lyko F, Clark V, Bird AP, Jaenisch R. 2000. Non-CpG methylation is prevalent in embryonic stem cells and may be mediated by DNA methyltransferase 3a. Proc Natl Acad Sci 97: 5237–5242. [DOI] [PMC free article] [PubMed] [Google Scholar]
- Roadmap Epigenomics Consortium, Kundaje A, Meuleman W, Ernst J, Bilenky M, Yen A, Heravi-Moussavi A, Kheradpour P, Zhang Z, Wang J, et al. 2015. Integrative analysis of 111 reference human epigenomes. Nature 518: 317–330. [DOI] [PMC free article] [PubMed] [Google Scholar]
- Sandoval J, Heyn H, Moran S, Serra-Musach J, Pujana MA, Bibikova M, Esteller M. 2011. Validation of a DNA methylation microarray for 450,000 CpG sites in the human genome. Epigenetics 6: 692–702. [DOI] [PubMed] [Google Scholar]
- Schultz MD, He Y, Whitaker JW, Hariharan M, Mukamel EA, Leung D, Rajagopal N, Nery JR, Urich MA, Chen H, et al. 2015. Human body epigenome maps reveal noncanonical DNA methylation variation. Nature 523: 212–216. [DOI] [PMC free article] [PubMed] [Google Scholar]
- Smith ZD, Meissner A. 2013. DNA methylation: roles in mammalian development. Nat Rev Genet 14: 204–220. [DOI] [PubMed] [Google Scholar]
- Stirzaker C, Taberlay PC, Statham AL, Clark SJ. 2014. Mining cancer methylomes: prospects and challenges. Trends Genet 30: 75–84. [DOI] [PubMed] [Google Scholar]
- van Dongen J, Nivard MG, Baselmans BM, Zilhão NR, Ligthart L, BIOS Consortium, Heijmans BT, Bartels M, Boomsma DI. 2015. Epigenome-wide association study of aggressive behavior. Twin Res Hum Genet 18: 686–698. [DOI] [PubMed] [Google Scholar]
- Villar D, Flicek P, Odom DT. 2014. Evolution of transcription factor binding in metazoans—mechanisms and functional implications. Nat Rev Genet 15: 221–233. [DOI] [PMC free article] [PubMed] [Google Scholar]
- Wang S, Lv J, Zhang L, Dou J, Sun Y, Li X, Fu X, Dou H, Mao J, Hu X, et al. 2015. MethylRAD: a simple and scalable method for genome-wide DNA methylation profiling using methylation-dependent restriction enzymes. Open Biol 5: 150130. [DOI] [PMC free article] [PubMed] [Google Scholar]
- Wilson IM, Davies JJ, Weber M, Brown CJ, Alvarez CE, MacAulay C, Schübeler D, Lam WL. 2006. Epigenomics: mapping the methylome. Cell Cycle 5: 155–158. [DOI] [PubMed] [Google Scholar]
- Zhang B, Zhou Y, Lin N, Lowdon RF, Hong C, Nagarajan RP, Cheng JB, Li D, Stevens M, Lee HJ, et al. 2013. Functional DNA methylation differences between tissues, cell types, and across individuals discovered using the M&M algorithm. Genome Res 23: 1522–1540. [DOI] [PMC free article] [PubMed] [Google Scholar]
- Zheng Y, Cohen-Karni D, Xu D, Chin HG, Wilson G, Pradhan S, Roberts RJ. 2010. A unique family of Mrr-like modification-dependent restriction endonucleases. Nucleic Acids Res 38: 5527–5534. [DOI] [PMC free article] [PubMed] [Google Scholar]
Associated Data
This section collects any data citations, data availability statements, or supplementary materials included in this article.