Abstract
We integrate spectroscopic optical coherence tomography (SOCT) with stimulated Raman scattering (SRS) to enable simultaneously multiplexed spatial and spectral imaging with sensitivity to many endogenous biochemical species that play an important role in biology and medicine. The combined approach, termed SRS-SOCT, overcomes the limitations of each individual method. Ultimately, SRS-SOCT has the potential to achieve fast, volumetric, and highly sensitive label-free molecular imaging. We demonstrate the approach by imaging excised human adipose tissue and detecting the lipids’ Raman signatures in the high-wavenumber region.
Optical coherence tomography (OCT) enables noninvasive, high-resolution, tomographic imaging of biological tissues by coherence gating backscattered light [1]; however, this technique lacks molecular specificity. Efforts to overcome this limitation include spectroscopic OCT (SOCT), an extension of OCT that leverages the broadband nature of low-coherent light sources, along with advanced digital signal processing methods, to simultaneously obtain three-dimensional spatial and spectral information [2–4]. Unfortunately, label-free molecular imaging with SOCT has been limited to a couple of molecules (namely, hemoglobin and melanin). Other variant OCT methods that provide molecular information (e.g., photothermal OCT) rely on exogenous agents (e.g., nanoparticles) [5–8]. Exceptions include pump–probe OCT [9] and second-harmonic OCT [10], which have shown the ability to image melanin and collagen, respectively.
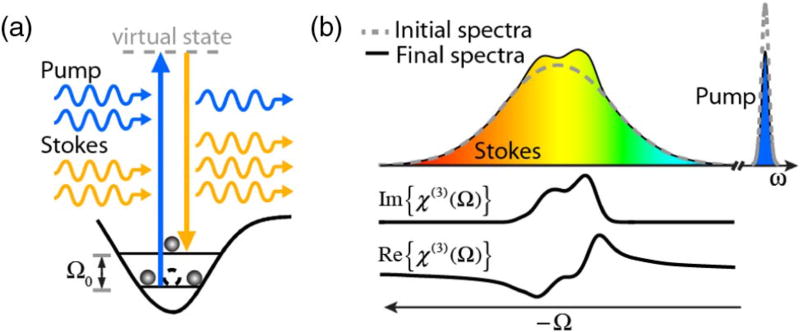
On the other hand, stimulated Raman scattering (SRS) has emerged as a powerful nonlinear optical technique that can reveal detailed molecular/biochemical information from many endogenous and exogenous species based on their vibrational modes [11–14]. In SRS, two optical fields (pump and Stokes) can coherently excite a molecule if their frequency difference, Ω = ωp − ωS, matches the vibrational modes of a sample, which are characterized by the thirdorder nonlinear optical susceptibility, χ(3). Under these circumstances, and assuming the molecule is initially in the ground state, a pump photon is converted to a Stokes photon, changing both the amplitude and phase of the initial fields (Fig. 1). In SRS microscopy, amplitude changes are monitored using high-frequency lock-in detection, which reduces the influence of laser noise and enables highly sensitive measurements [11,15]. However, this approach commonly relies on point scanning at a few Raman frequencies (most often, only one). Spatial multiplexing, particularly in the axial dimension, has also not been achieved using other types of coherent Raman scattering methods [16]. Recently, we developed an interferometric approach to assess both the SRS amplitude and phase changes (i.e., the imaginary and real parts of χ(3), respectively) that was well suited for integration with OCT imaging, thereby enabling spatial multiplexing [17].
Fig. 1.
(a) SRS energy diagram with a Stokes and pump beam tuned to a sample’s vibrational resonance frequency, Ω0. (b) The interaction between a broadband Stokes beam and a narrow-band pump results in changes in the amplitude and phase of the initial fields. The material’s complex third-order nonlinear susceptibility is also plotted below.
In this Letter, we integrate SRS with SOCT. The combined approach, SRS-SOCT, enables simultaneously multiplexed spatial and spectral imaging with sensitivity to many endogenous biochemical species. We demonstrate the approach by imaging excised human adipose tissue and detecting the lipids’ Raman signatures in the high-wavenumber region.
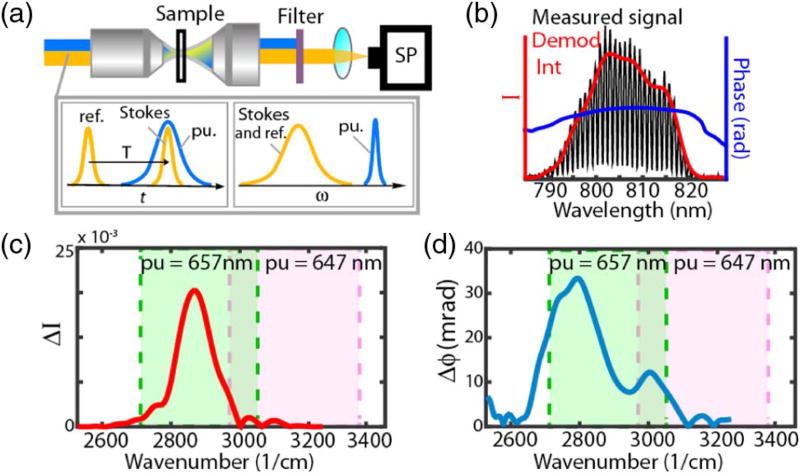
First, we consider a system with a transmission geometry (Fig. 2), which allows us to obtain a baseline/calibration SRS amplitude and phase response of lipids for comparison with the depthresolved spectra of SRS-SOCT. As previously described [17–19], the system uses a regenerative amplifier laser source (RegA, Coherent) with a repetition rate of 20 kHz (λ0 = 808 nm, Δλ = 25 nm). Two time-delayed replicas of the output light (separated by time T) serve as the reference and Stokes beams. Both follow the same optical path through the system and sample. A portion of the RegA output is used to pump an optical parametric amplifier (OPA, Coherent), which then generates the pump beam (λ0 = 657 nm, filtered to Δλ = 3 nm). Finally, the pump is temporally overlapped with the Stokes beam and focused on an olive oil sample (used as a substitute for adipose tissue). The transmitted reference and Stokes beams are detected with a high-resolution spectrometer (resolution δλ = 0.074 nm; BaySpec OCT spectrograph), and the amplitude and phase of the interferometric signal [Fig. 2(b)] are monitored with and without the pump beam.
Fig. 2.
(a) Experimental system with transmission geometry. (b) Measured signal and demodulated amplitude and phase. Amplitude (c) and phase (d) SRS response of an olive oil sample.
Mathematically, the nonlinear response can be described as follows. Let the initial Stokes and reference field be E0(ω). After the Stokes and pump beams interact with the sample, the resulting Stokes field can be described as [20]
| (1) |
where ñNL(ω) ∝ χ(3)(Ω) · I pu is the complex nonlinear refractive index (assuming a weak probe and linear polarization), z0 is the region of interaction, I pu is the pump intensity, and Ω = ωpu − ω. The signal the spectrometer detects (i.e., the interference between the Stokes and reference fields) is given by
| (2) |
After removing the DC component and expressing it in complex form, Eq. (2) reduces to
| (3) |
where I 0(ω) = |E0(ω)|2, and is a real-valued constant. The first part of Eq. (3) contains the slowly varying envelope as well as the carrier frequency, which depends on the delay between the Stokes and reference fields (z = T · c). The second part describes the probe’s attenuation/gain resulting from the nonlinear interaction. Assuming the attenuation/gain is small, ΔI(Ω) ∝ I 0 × I pu × Im{χ(3)(Ω)}, which is the conventional SRS signal (Δ denotes the difference in the signal with and without the pump). The third part of Eq. (3) contains the phase of the signal, which yields the nonlinear dispersion properties, given by Δn(Ω) ∝ I pu × Re{χ(3)(Ω)}. Note that this quantity is independent of the initial intensity, I 0.
The results of the transmission experiment are plotted in Figs. 2(c) and 2(d), which show the nonlinear changes in the amplitude and phase, respectively, as a function of the wavenumber. These results are in good agreement with the known Raman amplitude response of olive oil, with a peak around 2900 cm−1 [21]. The phase response is in good agreement with our previous phase measurements [17].
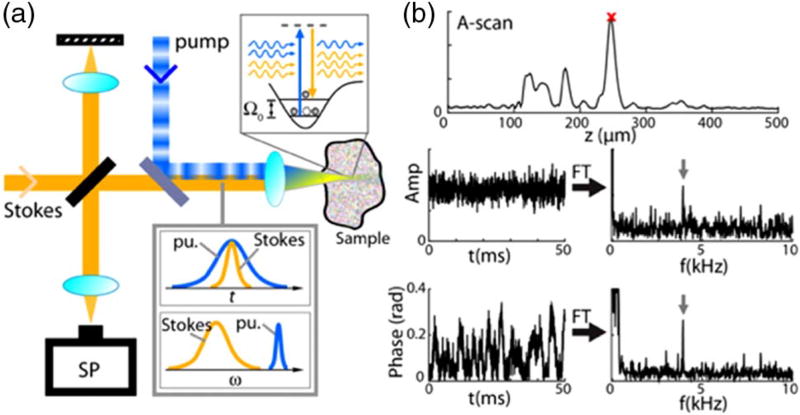
Next, the system is modified to enable SOCT imaging. As Fig. 3(a) illustrates, the modified setup consists of a conventional free-space Michelson interferometer and Fourier-domain detection, with an added pump beam coupled into the system before the sample arm lens. All lenses are achromatic, with a focal length of f = 50 mm. The SOCT light source (λ0 = 808 nm, Δλ = 25 nm), which also serves as the Stokes beam, is derived from the RegA laser, and the pump beam is tuned to either λ0 = 657 or 647 nm (with a bandwidth of Δλ = 3 nm). The wavenumber range captured with each pump wavelength is high-lighted in green (on-resonance) and pink (off-resonance) in Figs. 2(c) and 2(d). The Stokes and pump beams are combined using a dichroic mirror, where they are temporally overlapped and then focused onto the sample. The backscattered Stokes light is mixed with the reference field and detected with the high-resolution spectrometer, triggered to collect every shot of the laser (integration time = 20 µs). With this setup, we obtain an axial and lateral resolution of ~10 µm and a depth range of ~2.5 mm.
Fig. 3.
(a) SRS-SOCT system. (b) Signal processing: at each lateral position, multiple interferograms (1024) are acquired with the pump on and off (modulated at 4 kHz). Either the full spectrum or a windowed portion of the spectrum is Fourier transformed to obtain an A-scan. For each point in depth, the amplitude and phase modulation at 4 kHz correspond to the molecular signal. If the spectrum was windowed, then the window is shifted and the process is repeated.
The mathematical treatment of the nonlinear signal acquired with this setup proceeds similarly to the transmission experiment with two major differences: (1) the total detected signal is the summation over M different scatterers of reflectivity rm(ω) at various depths, and (2) the acquired nonlinear phase change is path-length integrated (up to the point of backscatter). The formulation changes from Eq. (2) as follows:
| (4) |
| (5) |
Note that the path-length integrated molecular signal is a trait shared with attenuation-based SOCT and most molecular-OCT methods.
To process the structural image, we follow conventional OCT methods: the interferometric data is interpolated into a linear wavenumber array and Fourier transformed to reveal an A-scan. To obtain some insight into the molecular information, we acquire multiple (1024) A-scans at each (lateral) position of the sample (net A-scan rate is ca. 20 Hz), modulating the pump beam at 4 kHz. Then, for each axial pixel of the complex A-scans, we monitor the amplitude and phase fluctuations at 4 kHz, as illustrated in Fig. 3(b). This process is similar to pump–probe OCT, which has been used to measure amplitude changes from long-lived transient states in melanin and methylene blue [6,22]. This is also similar to photothermal OCT, which looks at phase changes resulting from heating (typically using exogenous agents, such as nanoparticles) [5].
The procedure above, however, does not reveal the rich spectral information of the SRS interactions. To extract the spatially resolved, complex spectral information, we use a short-time Fourier transform (STFT). Here, we window the interferograms using a sixth-order Butterworth filter with a 5 nm bandwidth. Typically, processing with an STFT results in a resolution trade-off between the spectral and spatial information; however, here, the spectral content is inherently limited by the bandwidth of the pump beam, which we have set to Δλ = 3 nmin order to deliver sufficient laser light to the sample, in this case, ~100 µW. Thus, the bandwidth of our digital filter does not significantly degrade the resolution of the spectral content, but it does affect the spatial resolution (from ~10 to ~50 µm). At each step of the spectral windowing process, we repeat the procedure above: the windowed interferograms at the same lateral position (1024 interferograms) are Fourier transformed to reveal modified A-scans with lower spatial resolutions. Then, we monitor the amplitude and phase fluctuations at 4 kHz at each axial pixel of the modified complex A-scans. The process is repeated for each step of the spectral digital filter until the full complex time-frequency distribution is recovered.
Figures 4 and 5 show molecular SRS-SOCT images of freshly excised human adipose tissue with the pump centered at λ0 = 657 nm (on-resonance) and 647nm(off-resonance). The wavenumber ranges captured with each pump wavelength are illustrated in Figs. 2(c) and 2(d). The anonymous and discarded tissue samples were procured from the Department of Plastic Surgery at Duke University and are not subject to an Institutional Review Board protocol.
Fig. 4.
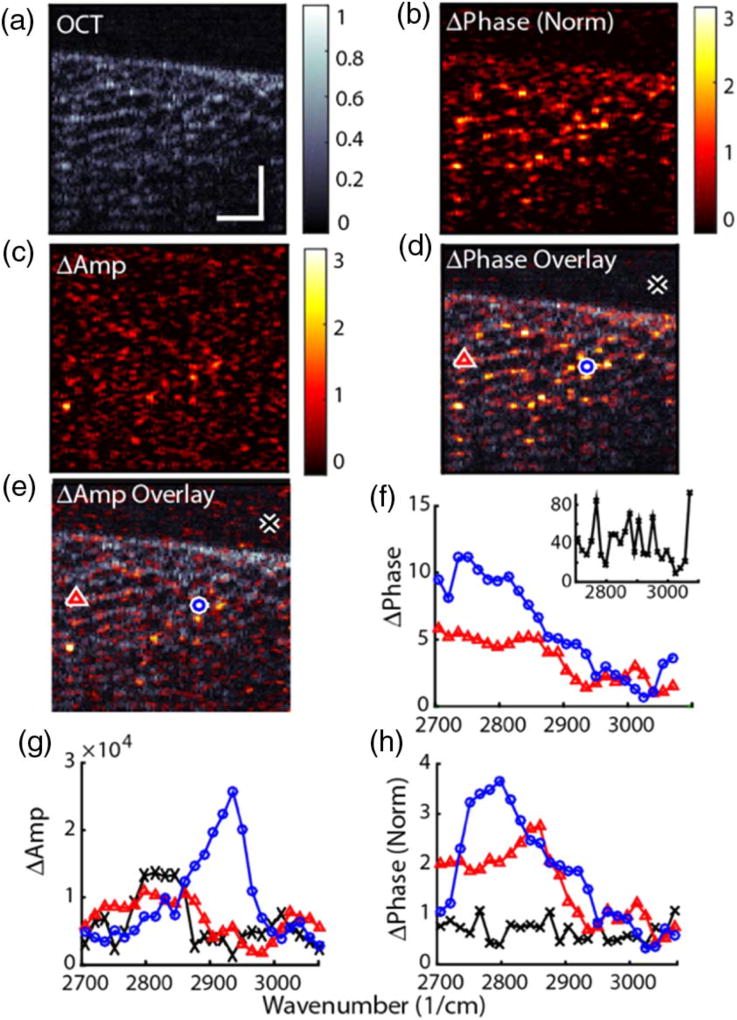
SRS-SOCT image of excised human adipose tissue. Stokes and pump frequencies are tuned on-resonance with the vibrational modes of lipids. (a) Conventional OCT image. (b),(c) Average spectral phase and amplitude changes resulting from SRS interactions. (d),(e) Overlay of the average molecular signals with the structure. (f),(g) Phase and amplitude spectra from 3 selected points. (h) Phase spectra normalized to suppress noise. Scale bar = 100 µm.
Fig. 5.
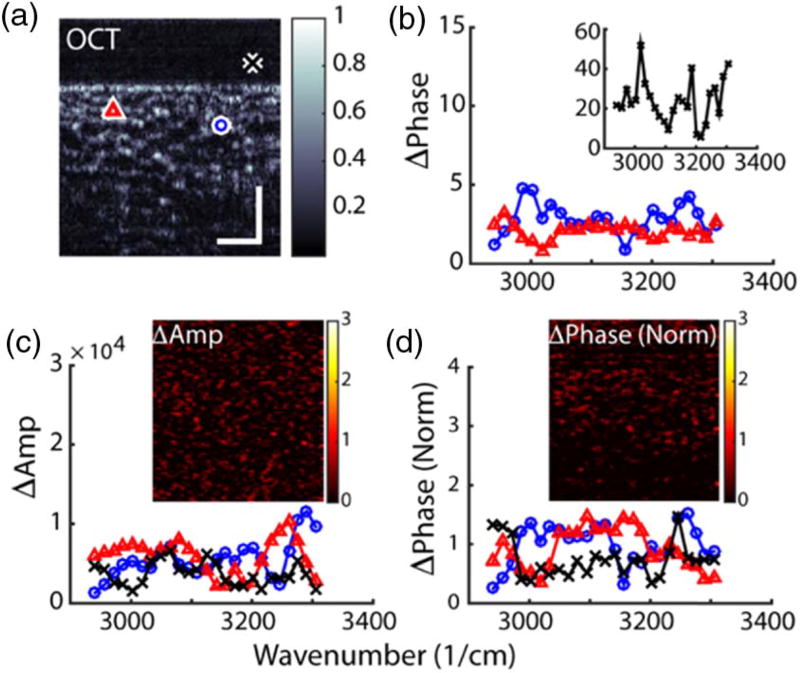
SRS-SOCT image of excised human adipose tissue. Stokes and pump frequencies tuned off-resonance with the vibrational modes of lipids. (a) Conventional OCT image. (b),(c) Phase and amplitude spectra from 3 selected points. (d) Normalized phase spectra. Insets show the average molecular response images. Scale bar = 100 µm.
Figure 4(a) shows a conventional OCT image of adipose tissue, while Figs. 4(b) and 4(c) show the phase and amplitude changes, respectively, resulting from the integrated SRS response. Note that the phase modulation signal at each point in Fig. 4(b) is normalized by the standard deviation of the phase at modulation frequencies ranging from 1.5 to 2.5 kHz. The normalization suppresses the large, noisy background produced from random phase fluctuations in regions with no signal (the phase noise is inversely proportional to the signal-to-noise ratio (SNR) of the OCT image [17]). We will revisit this point later. Overlaid images of the structural and molecular information are shown in Figs. 4(d) and 4(e). Note that the phase images [Fig. 4(b) and 4(d)] clearly show the structure of the tissue, while the amplitude images exhibit much higher noise levels, which makes it difficult to discern the structure of the sample [Fig. 4(c) and 4(e)].
Finally, we extract representative spectra (amplitude and phase) at two points in the adipose tissue sample and one from an outside region. (Supplement 1 presents a phasor analysis of the molecular images.) Although the signals corresponding to the amplitude changes are weak, the region under the blue circle does indeed show a relatively strong response whose spectrum matches the expected Raman signal of adipose tissue [see Fig. 2(c) and Supplement 1, Fig. S1], with a peak around 2900 cm−1 [21]. The other region, under the red triangle, shows a similar response to that of the background region, which lies on the noise floor, due to the lower SNR of the amplitude signal. The spectral dependence of the nonlinear phase responses [Fig. 4(f)] at both selected points in the sample exhibits the characteristic behavior of lipids [17]. These spectra are also in good agreement with the transmission experiment (Fig. 2) and an additional experiment using a sample composed of olive oil between two microscopes slides, imaged with same SRSSOCT system (Supplement 1, Fig. S1). Note that the un-normalized phase spectrum from the background [inset Fig. 4 (f)] has a noisy profile with a large amplitude, compared to regions from within the sample. This is because the measured phase in regions void of signal undergoes random phase fluctuations from 0 to 2π. Once normalized, however, this same region shows a relatively flat and low-amplitude spectrum [black line Fig. 4(h), also see Fig. S2]. Both spectra from within the sample show a normalized phase spectrum above the noise floor, but note that the normalized phase spectra have a distorted shape, since Δn(Ω) is independent of the initial Stokes field.
Figure 5 shows a different region of the adipose tissue with the pump tuned slightly off-resonance. As the figure clearly shows, neither the amplitude nor the phase show a molecular response, further confirming that the observed signals in Fig. 4 result from nonlinear SRS interactions.
These results demonstrate that SRS-SOCT can obtain simultaneously multiplexed spatially and spectrally resolved molecular information from intrinsic vibrational modes in scattering tissue. This combined approach addresses the limitations of each individual method. For SOCT, the integration with SRS increases the sensitivity of the method to many more endogenous molecules that were previously inaccessible when detecting linear attenuation processes. For SRS, SOCT provides the means to multiplex spatially and spectrally. Our results also indicate that the nonlinear phase (i.e., dispersion) is more sensitive to the molecular information compared to the gain/attenuation. In our previous work [17], we showed that the phase is more robust to laser noise, for example; however, given a shot-noise-limited signal, both measurements (dispersion and absorption/gain) perform equally. The difference in the observed sensitivity here could result from a non-shot-noise-limited signal, giving the phase measurement an advantage. However, the nonresonant portion of the third-order nonlinear optical susceptibility could also be part of the reason for the observed improvement. Specifically, the nonresonant response produces a constant phase offset (i.e., independent of the wavelength) that boosts the phase measurement without altering the molecular signatures (given by the spectral dependence).
Another benefit of using the phase spectrum is that it is independent of the intensity of the incident and scattered fields. First, consider the amplitude modulation signal: to correctly relate the nonlinear changes in the amplitude to the molecular Raman response, one has to account for the initial input field’s power spectral density, IS(ω), as well as any spectral dependence of the scattered field, given by rm(ω). The latter quantity can be extremely difficult (if not impossible) to determine accurately and can play a significant role on the detected spectrum, particularly for broadband pulses. The phase, on the other hand, is independent of these factors (Δn(Ω) and only depends on I pu and Re{χ(3)(Ω)}). However, as previously noted, caution is still warranted when interpreting these signals, as low-intensity regions will possess large phase noise.
Improvements to the system can be achieved by using a light source that provides a narrower-band pump and delivers more power. This will increase the signal and sharpen the spectral features, potentially providing even more specific molecular information. Further, more advanced signal processing methods could be applied to ameliorate the STFT spatial and spectral resolution trade-off [23]. The processing time for the molecular images using a nonoptimized algorithm in MATLAB is ca. 1 min. The use of GPUs could significantly speed up this process. It is also important to highlight that because SRS-SOCT relies on coherence gating for imaging, the method possesses the same limitations as most other molecular OCT methods, namely that the information is path-length integrated. However, methods do exists to potentially prevent the accumulation of the molecular signals as a function of the depth [5], which can be explored in the future.
In conclusion, we have integrated SRS with SOCT. The combined approach has the potential to enable fast, volumetric, and highly sensitive label-free molecular imaging. Such methods would be valuable for a number of biomedical applications.
Supplementary Material
Acknowledgments
Funding. National Cancer Institute (NCI) (F32CA183204, R01-CA166555); National Science Foundation (NSF) (CHE- 1309017, DGF-1106401); Burroughs Wellcome Fund (BWF) (1012639, 1014540); Duke University.
We gratefully acknowledge Dr. Simone Degan and Dr. Detlev Erdman for procuring the tissue samples.
See Supplement 1 for supporting content.
References
- 1.Huang D, Swanson EA, Lin CP, Schuman JS, Stinson WG, Chang W, Hee MR, Flotte T, Gregory K, Puliafito CA, Fujimoto JG. Science. 1991;254:1178. doi: 10.1126/science.1957169. [DOI] [PMC free article] [PubMed] [Google Scholar]
- 2.Morgner U, Drexler W, Kärtner F, Li X, Pitris C, Ippen E, Fujimoto J. Opt. Lett. 2000;25:111. doi: 10.1364/ol.25.000111. [DOI] [PubMed] [Google Scholar]
- 3.Robles FE, Wilson C, Grant G, Wax A. Nat. Photonics. 2011;5:744. doi: 10.1038/nphoton.2011.257. [DOI] [PMC free article] [PubMed] [Google Scholar]
- 4.Yi J, Liu W, Chen S, Backman V, Sheibani N, Sorenson CM, Fawzi AA, Linsenmeier RA, Zhang HF. Light Sci. Appl. 2015;4:e334. doi: 10.1038/lsa.2015.107. [DOI] [PMC free article] [PubMed] [Google Scholar]
- 5.Lapierre-Landry M, Tucker-Schwartz JM, Skala MC. Biomed. Opt. Express. 2016;7:2607. doi: 10.1364/BOE.7.002607. [DOI] [PMC free article] [PubMed] [Google Scholar]
- 6.Kim W, Applegate BE. Opt. Lett. 2015;40:1426. doi: 10.1364/OL.40.001426. [DOI] [PMC free article] [PubMed] [Google Scholar]
- 7.Oldenburg AL, Boppart SA. Phys. Med. Biol. 2010;55:1189. doi: 10.1088/0031-9155/55/4/019. [DOI] [PMC free article] [PubMed] [Google Scholar]
- 8.Liba O, SoRelle ED, Sen D, de la Zerda A. Sci. Rep. 2016;6:23337. doi: 10.1038/srep23337. [DOI] [PMC free article] [PubMed] [Google Scholar]
- 9.Applegate BE, Izatt JA. Opt. Express. 2006;14:9142. doi: 10.1364/oe.14.009142. [DOI] [PubMed] [Google Scholar]
- 10.Applegate BB, Yang CC, Izatt JJ. Opt. Express. 2005;13:8146. doi: 10.1364/opex.13.008146. [DOI] [PubMed] [Google Scholar]
- 11.Freudiger CW, Min W, Saar BG, Lu S, Holtom GR, He C, Tsai JC, Kang JX, Xie XS. Science. 2008;322:1857. doi: 10.1126/science.1165758. [DOI] [PMC free article] [PubMed] [Google Scholar]
- 12.Saar BG, Freudiger CW, Reichman J, Stanley CM, Holtom GR, Xie XS. Science. 2010;330:1368. doi: 10.1126/science.1197236. [DOI] [PMC free article] [PubMed] [Google Scholar]
- 13.Ji M, Orringer DA, Freudiger CW, Ramkissoon S, Liu X, Lau D, Golby AJ, Norton I, Hayashi M, Agar NYR, Young GS, Spino C, Santagata S, Camelo-Piragua S, Ligon KL, Sagher O, Xie XS. Sci. Transl. Med. 2013;5:201ra119. doi: 10.1126/scitranslmed.3005954. [DOI] [PMC free article] [PubMed] [Google Scholar]
- 14.Wei L, Hu F, Chen Z, Shen Y, Zhang L, Min W. Acc. Chem. Res. 2016;49:1494. doi: 10.1021/acs.accounts.6b00210. [DOI] [PMC free article] [PubMed] [Google Scholar]
- 15.Liao C-S, Slipchenko MN, Wang P, Li J, Lee S-Y, Oglesbee RA, Cheng J-X. Light Sci. Appl. 2015;4:e265. doi: 10.1038/lsa.2015.38. [DOI] [PMC free article] [PubMed] [Google Scholar]
- 16.Camp CH, Jr, Cicerone MT. Nat. Photonics. 2015;9:295. doi: 10.1038/nphoton.2014.145. [DOI] [PMC free article] [PubMed] [Google Scholar]
- 17.Robles FE, Fischer MC, Warren WS. Opt. Express. 2016;24:485. doi: 10.1364/OE.24.000485. [DOI] [PMC free article] [PubMed] [Google Scholar]
- 18.Robles FE, Samineni P, Wilson JW, Warren WS. Opt. Express. 2013;21:9353. doi: 10.1364/OE.21.009353. [DOI] [PMC free article] [PubMed] [Google Scholar]
- 19.Robles FE, Fischer MC, Warren WS. Opt. Lett. 2014;39:4788. doi: 10.1364/OL.39.004788. [DOI] [PMC free article] [PubMed] [Google Scholar]
- 20.Parker G. Encyclopedia of Materials: Science and Technology. 2001 [Google Scholar]
- 21.Chowdary PD, Benalcazar WA, Jiang Z, Marks DM, Boppart SA, Gruebele M. Anal. Chem. 2010;82:3812. doi: 10.1021/ac100222c. [DOI] [PMC free article] [PubMed] [Google Scholar]
- 22.Jacob D, Shelton RL, Applegate BE. Opt. Express. 2010;18:12399. doi: 10.1364/OE.18.012399. [DOI] [PMC free article] [PubMed] [Google Scholar]
- 23.Robles F, Graf RN, Wax A. Opt. Express. 2009;17:6799. doi: 10.1364/oe.17.006799. [DOI] [PMC free article] [PubMed] [Google Scholar]
Associated Data
This section collects any data citations, data availability statements, or supplementary materials included in this article.


