Abstract
Although recent evidence has pointed to the role of organ- and pathogenesis-specific macrophage subsets, it is still unclear which subsets are critically involved in the pathogenesis of nonalcoholic steatohepatitis (NASH). Using melanocortin-4 receptor–deficient (MC4R-KO) mice fed Western diet (WD), which exhibit liver phenotypes similar to those of human NASH, we found a histological structure, termed hepatic crown-like structure (hCLS), in which CD11c+ macrophages surround dead/dying hepatocytes, a prominent feature of NASH. Here, we demonstrate that hCLS-constituting macrophages could be a novel macrophage subset that drives hepatocyte death-triggered liver fibrosis. In an “inducible NASH model,” hepatocyte death induces hCLS formation and liver fibrosis sequentially in the short term. In combination with the long-term WD feeding model, we also showed that resident macrophages are a major cellular source of CD11c+ macrophages constituting hCLS, which exhibited gene expression profiles distinct from CD11c– macrophages scattered in the liver. Moreover, depletion of CD11c+ macrophages abolished hCLS formation and fibrogenesis in NASH. Our clinical data suggest the role of CD11c+ macrophages in the disease progression from simple steatosis to NASH. This study sheds light on the role of resident macrophages, in addition to recruited macrophages, in the pathogenesis of NASH.
Keywords: Hepatology, Inflammation
Keywords: Fibrosis, Macrophages, Obesity
CD11c-positive macrophages in the hepatic crown-like structure promote metabolic stress-induced liver fibrosis, suggesting a NASH-specific pathological mechanism.
Introduction
Along with high prevalence of obesity worldwide, nonalcoholic fatty liver disease (NAFLD) is becoming one of the most common forms of chronic liver diseases, among which nonalcoholic steatohepatitis (NASH) increases the risk for cirrhosis and hepatocellular carcinoma (1, 2). Hepatocyte death plays a critical role in the disease progression from simple steatosis to NASH. Although in vitro studies showed that engulfment of dead hepatocytes by phagocytic cells, such as macrophages and hepatic stellate cells, activates fibrogenic programs (3–5), the precise in vivo mechanism remains to be elucidated. Macrophages are the major phagocytic cells in the liver and mediate proinflammatory and profibrotic effects in various experimental models (6, 7). In contrast, macrophages can regress excessive deposition of extracellular matrix in carbon tetrachloride–induced liver fibrosis (8). These observations, taken together, suggest the differential functions of macrophages in liver fibrosis in response to a variety of internal and external stresses. In addition, recent evidence has pointed to macrophage heterogeneity in their origin (e.g., circulating monocyte-derived macrophages vs. tissue-resident macrophages) and polarization (e.g., proinflammatory M1 vs. antiinflammatory M2). Thus, it is still unclear which macrophage subsets are critically involved in the pathogenesis of NASH.
We have reported that melanocortin-4 receptor–deficient (MC4R-KO) mice fed high-fat diet or Western diet (WD) exhibit liver phenotypes similar to human NASH (9, 10). MC4R, a 7-transmembrane G protein–coupled receptor, is expressed in the hypothalamic nuclei implicated in the regulation of food intake and body weight (11). In addition to the previously known phenotypes, such as hyperphagic obesity, insulin resistance, and hepatic steatosis, MC4R-KO mice develop NASH-like liver phenotypes and multiple liver tumors (9, 10). Accordingly, MC4R-KO mice would provide a rodent model of NASH to investigate the sequential events that comprise obesity-induced steatosis and liver fibrosis in combination with systemic metabolic derangements. Importantly, there is a unique histological structure, termed hepatic crown-like structure (hCLS), in which CD11c+ macrophages surround dead or dying hepatocytes with large lipid droplets (10). The number of hCLSs is positively correlated with the number of dead cells and fibrosis area (10, 12), suggesting that the hCLS is involved in the development of hepatocyte death-triggered liver fibrosis. Notably, hCLS is observed in patients with NASH, whereas it is rarely observed in those with chronic viral hepatitis (10).
Interestingly, adipose tissue in obesity exhibits similar histological structures, where CD11c+ macrophages aggregate around dead adipocytes to scavenge the residual lipid droplets (13). We have shown a molecular mechanism underlying adipose tissue CLS-induced interstitial fibrosis in obesity (14, 15). We and others have also reported that the MCP-1/CCR2 pathway plays a critical role in obesity-induced macrophage infiltration and CLS formation in adipose tissue (16–20). In addition, there is considerable evidence indicating that recruited macrophages play an important role in experimental models of liver fibrosis (21–25), whereas the role of tissue macrophages or Kupffer cells is also implicated (26). Thus, it remains to be elucidated which macrophage subsets interact with dead or dying hepatocytes and how hepatocyte death induces liver fibrosis.
In this study, we developed an “inducible NASH model” to analyze the molecular mechanisms underlying the cell death-triggered chronic inflammation. Using this inducible model and our conventional NASH model with 20-week WD feeding, we demonstrated that resident macrophages are a major cellular source of the CD11c+ macrophages that constitute hCLS, which exhibited gene expression profiles distinct from CD11c– macrophages scattered in the liver. Moreover, depletion of CD11c+ macrophages abolished hCLS formation and fibrogenesis in NASH. Our clinical data suggest the role of CD11c+ macrophages in disease progression from simple steatosis to NASH. This study provides evidence that CD11c+ macrophages in hCLS would be a macrophage subset that drives metabolic stress–induced liver fibrosis, suggesting a NASH-specific pathological mechanism.
Results
Role of recruited macrophages in hCLS formation and liver fibrosis in NASH.
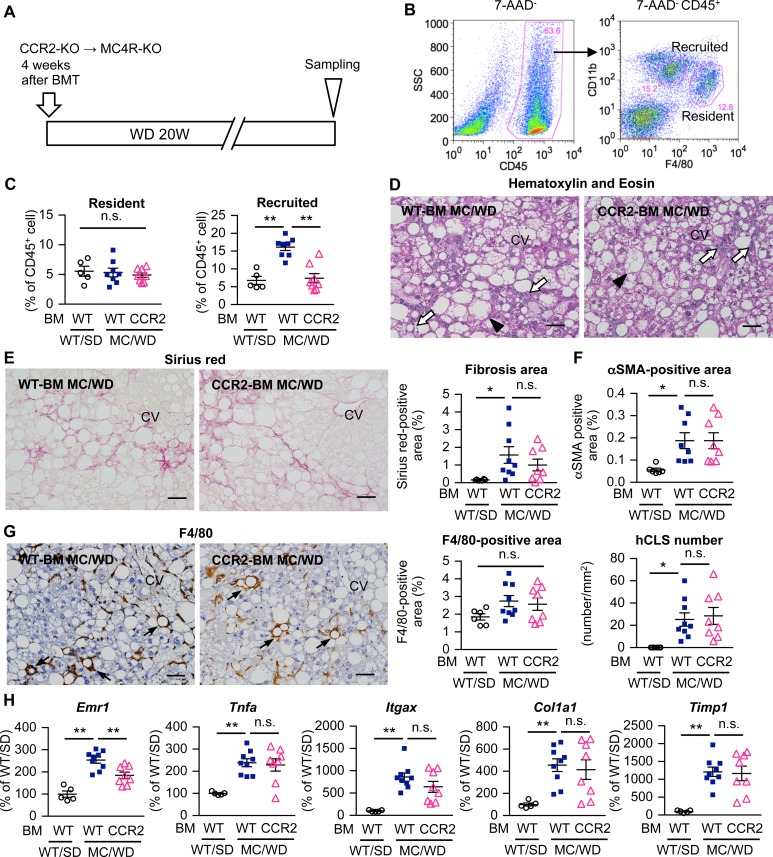
On the basis of previous knowledge regarding the role of CCR2 in liver fibrosis (21–25), we investigated the involvement of CCR2 in hCLS formation and liver fibrosis in a mouse model of NASH using MC4R-KO mice. Bone marrow cells (BMCs) from CCR2-KO and wild-type mice were transferred into lethally irradiated MC4R-KO or wild-type mice. After the 4-week recovery period, the bone marrow–chimeric MC4R-KO mice were fed WD for an additional 20 weeks (Figure 1A), at which point MC4R-KO mice develop NASH (9). There was no significant difference in body weight, epididymal fat and liver weights, and blood glucose concentrations ad lib between MC4R-KO mice reconstituted with CCR2-KO BMCs and those reconstituted with wild-type BMCs (CCR2-BM MC/WD and WT-BM MC/WD, respectively) (Supplemental Table 1; supplemental material available online with this article; https://doi.org/10.1172/jci.insight.92902DS1). CCR2 deficiency in BMCs reduced macrophage infiltration and CLS formation in the epididymal fat of MC4R-KO mice, along with increasing insulin sensitivity (Supplemental Figure 1). This is consistent with the previous reports using diet-induced obese mice (16–20).
Figure 1. Role of recruited macrophages in liver fibrosis in a murine model of NASH.
(A) Experimental protocol for bone marrow–specific CCR2-deficient MC4R-KO mice. Lethally irradiated MC4R-KO mice and wild-type mice were reconstituted with bone marrow (BM) cells prepared from CCR2-KO or wild-type mice. After a 4-week recovery period, MC4R-KO mice were fed Western diet (WD) for an additional 20 weeks (CCR2-BM MC/WD and WT-BM MC/WD). Wild-type mice were kept under standard diet (SD) as a control (WT-BM WT/SD). (B) FACS gating to identify macrophage populations in hepatic nonparenchymal cells (NPCs). CD45+ cells were analyzed with F4/80 and CD11b, and resident (F4/80hi) and recruited (CD11bhi) macrophages were identified. (C) FACS analysis of the percentage of resident and recruited macrophages in the CD45+ cell population of hepatic NPCs. (D) Hematoxylin and eosin staining of the liver, and histological analysis for interstitial fibrosis (E, Sirius red staining), myofibroblast accumulation (F, αSMA immunostaining), and hCLS formation (G, F4/80 immunostaining). Arrowheads, ballooning hepatocytes; white arrows, inflammatory cells; black arrows, hCLS. CV, central veins. Scale bar: 50 μm. (H) Hepatic mRNA expression of genes related to inflammation (Emr1 [F4/80], Tnfa, Itgax [CD11c]) and fibrogenesis (Timp1, Col1a1). Data represent mean ± SEM. *P < 0.05, **P < 0.01 (Tukey-Kramer test). n = 5–9.
At least two macrophage populations exist in the liver: F4/80hiCD11blo resident macrophages or Kupffer cells (F4/80hi macrophages) and F4/80loCD11bhi recruited macrophages (CD11bhi macrophages) under steady-state conditions (Figure 1B) (27). CCR2 deficiency in BMCs almost abolished the increase in the number of CD11bhi macrophages in MC4R-KO mice, whereas it did not affect the number of F4/80hi CD11bhi macrophages (Figure 1C). Histological analysis revealed no apparent difference in hepatic steatosis, hCLS formation, myofibroblast accumulation, and liver fibrosis between CCR2-BM MC/WD and WT-BM MC/WD mice (Figure 1, D–G, and Supplemental Figure 2). In this study, the F4/80+ area mostly reflects the number of F4/80hi macrophages. In addition, mRNA expression of inflammatory genes (Tnfa and Itgax, which encodes M1 macrophage marker CD11c) and fibrogenic genes (Col1a1 [collagen I] and Timp1 [tissue inhibitor of metalloproteinase 1]) was indistinguishable between the mice (Figure 1H). Collectively, these data suggest that, in contrast to adipose tissue, CCR2-mediated recruited macrophages are dispensable for hCLS formation and liver fibrosis in MC4R-KO mice.
Establishment of an inducible NASH model using MC4R-KO mice treated with CCl4.
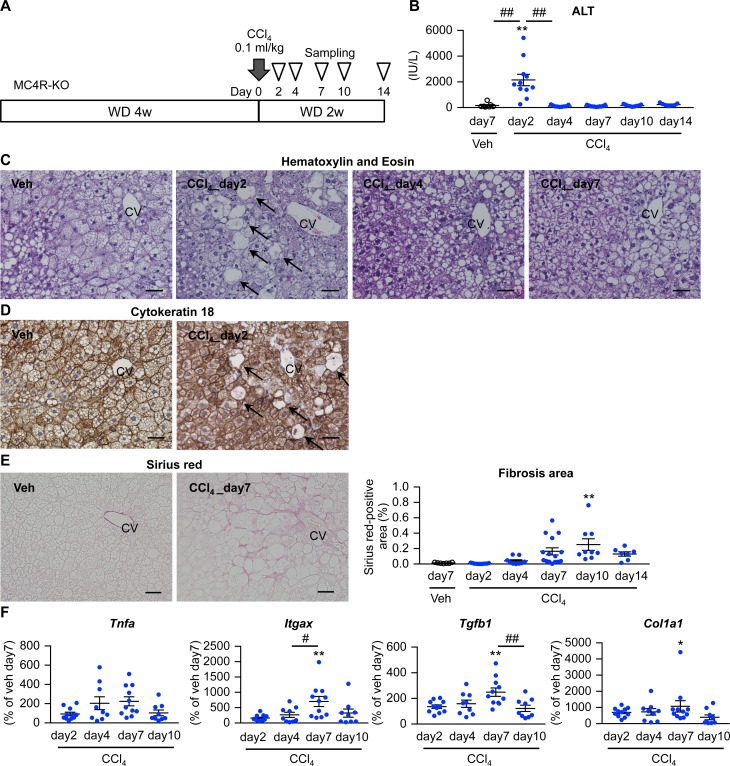
We next attempted to establish an inducible NASH model, since it is technically difficult to examine which macrophage subset is responsible for hCLS formation and how hepatocyte death is involved in this process using our conventional NASH model (MC4R-KO mice fed WD for 20 weeks). In this study, MC4R-KO mice fed WD for 4 weeks to induce simple steatosis received a single injection of low-dose CCl4 (0.1 ml/kg), a potent hepatotoxic chemical (Figure 2A). There was a transient increase in serum alanine aminotransferase (ALT) concentrations 2 days after CCl4 injection (Figure 2B), when swollen hepatocytes appeared around central veins (Figure 2C). These cells were negative for cytokeratin 18 immunostaining (Figure 2D), consistent with histopathological features of ballooning degeneration in human NASH (28). Sirius red staining revealed pericellular fibrosis mainly in the area around central veins 7–10 days after CCl4 injection (Figure 2E). Moreover, mRNA expression of inflammatory and fibrogenic genes was upregulated in parallel with those histological changes (Figure 2F).
Figure 2. Establishment of an inducible NASH model.
(A) Experimental protocol of the inducible NASH model using MC4R-KO mice. Eight-week-old MC4R-KO mice were fed WD for 4 weeks and received a single injection of CCl4 at a dose of 0.1 ml/kg (diluted 1:40 in olive oil) or olive oil as vehicle (Veh) intraperitoneally. (B) Serum ALT concentrations after CCl4 injection. (C) Hematoxylin and eosin staining, (D) cytokeratin 18 immunostaining, and (E) Sirius red staining of the liver at each time point after the low-dose CCl4 injection. Arrows, ballooning degeneration of hepatocytes. CV, central veins. Scale bar: 50 μm. (F) Time course of hepatic mRNA expression of genes related to inflammation (Tnfa and Itgax) and fibrogenesis (Tgfb1 and Col1a1). Data represent mean ± SEM. *P < 0.05, **P < 0.01 vs. Veh (day 7), #P < 0.05, ##P < 0.01 (Tukey-Kramer test). n = 7–15.
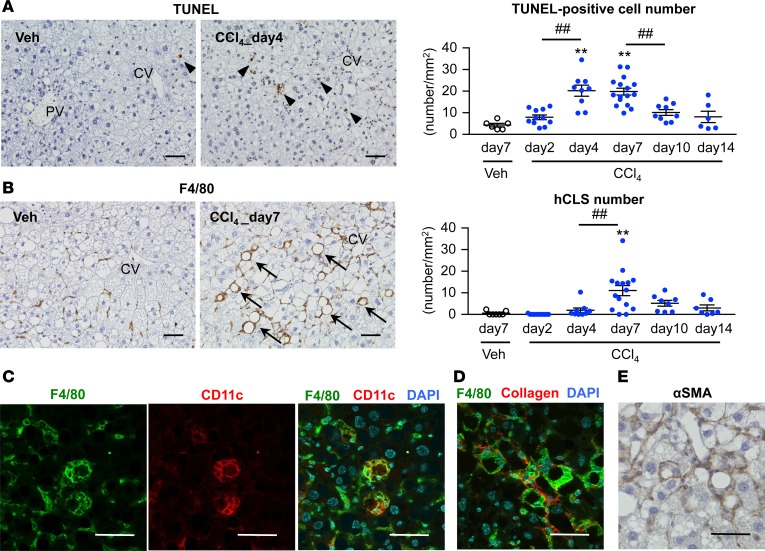
We next performed TUNEL staining in the inducible NASH model. Following CCl4-induced hepatocyte necrosis at day 2 in the area around central veins (Figure 2C), the number of TUNEL+ cells was increased from day 4 (Figure 3A). hCLS formation was observed in parallel with liver fibrosis (Figure 2E and Figure 3B). As we previously reported in our conventional NASH model (10), CD11c+ macrophages comprised the hCLS (Figure 3C), which was surrounded by α-smooth muscle actin+ (αSMA+) myofibroblasts and collagen depositions (Figure 3, D and E). On the other hand, scattered F4/80hi macrophages were negative for CD11c immunostaining (Figure 3C).
Figure 3. Time course of hCLS formation in the inducible NASH model.
Time course of the number of TUNEL+ cells (A) and hCLS (B) in the inducible NASH model using MC4R-KO mice. Arrowheads, TUNEL+ cells; arrows, hCLS. CV, central veins; PV, portal veins. Immunostaining for F4/80 and CD11c (C), F4/80 and type I collagen (D), and αSMA immunostaining (E) in the livers of MC4R-KO mice 7 days after CCl4 injection. Scale bar: 50 μm. Data represent mean ± SEM. **P < 0.01 vs. Veh (day 7), ##P < 0.01 (Tukey-Kramer test). n = 7–15.
We further optimized the experimental protocol of the inducible NASH model. Administration of CCl4 dose-dependently increased serum ALT concentrations at day 1 and aggravated hCLS formation and liver fibrosis at day 7 (Supplemental Figure 3). Notably, CCl4 injection of wild-type mice fed standard diet (SD) did not induce these histological changes, although there was a transient increase in serum ALT concentrations at day 2, together with hepatocyte injury and necrosis in the area around central veins (Supplemental Figure 4). Similarly, CCl4 injection failed to induce NASH-like liver phenotypes in wild-type mice fed WD and MC4R-KO mice kept under SD for 4 weeks (data not shown). On the other hand, wild-type mice fed WD for a longer period (16 weeks) developed NASH following injection of CCl4 (Supplemental Figure 5), suggesting that functional impairment of MC4R is not crucial for hCLS formation. Moreover, activation of Fas signaling in livers from WD-fed MC4R-KO mice induced hCLS formation and liver fibrosis (Supplemental Figure 6). Taken together, we established the inducible NASH model, in which a single injection of hepatotoxic chemical into MC4R-KO mice with simple steatosis recapitulates NASH-like liver phenotypes in the short term.
Role of F4/80hi macrophages in hCLS formation and liver fibrosis in NASH.
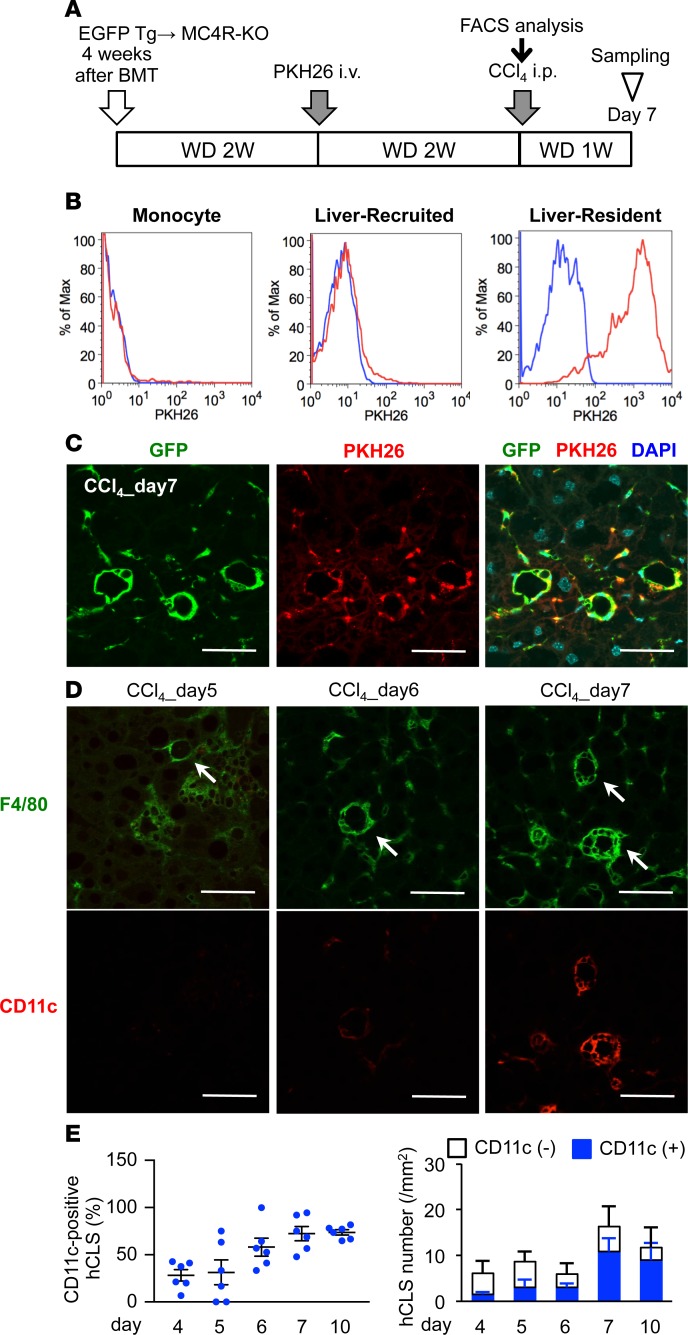
Using the inducible NASH model, we next examined the in vivo fate of F4/80hi macrophages with the cell-tracking dye PKH26. MC4R-KO mice were lethally irradiated and reconstituted with BMCs from EGFP-transgenic mice and then were fed WD to induce steatosis (Figure 4A). Two weeks after the intravenous injection of PKH26 in MC4R-KO mice for phagocytic cell labeling, peripheral monocytes and CD11bhi macrophages in the liver were PKH26– because of their high turnover, whereas most F4/80hi macrophages were double positive for PKH26 and EGFP at this time point (Figure 4B). Histological examinations revealed that PKH26+ cells aggregate to constitute the hCLS in the inducible NASH model (Figure 4C). Moreover, macrophages in hCLS gradually became positive for CD11c during the course of hCLS formation (Figure 4, D and E). Collectively, these data suggest that F4/80hi macrophages comprise hCLS, along with a phenotypic change.
Figure 4. Involvement of resident macrophages in hCLS formation.
(A) Experimental protocol for resident macrophage tracing in the inducible NASH model. (B) FACS analysis of peripheral monocytes and hepatic NPCs 2 weeks after PKH26 administration. The blue line indicates MC4R-KO mice without PKH26 administration, and the red line indicates MC4R-KO mice administered with PKH26. (C) Representative image of the livers of PKH26-treated MC4R-KO mice 7 days after CCl4 injection. (D) Immunofluorescent staining for F4/80 and CD11c from day 5–7 in the inducible NASH model. Arrows, hCLS. (E) Time course of the number of CD11c+ hCLSs in the inducible NASH model. Scale bar: 50 μm. Data represent mean ± SEM. n = 6.
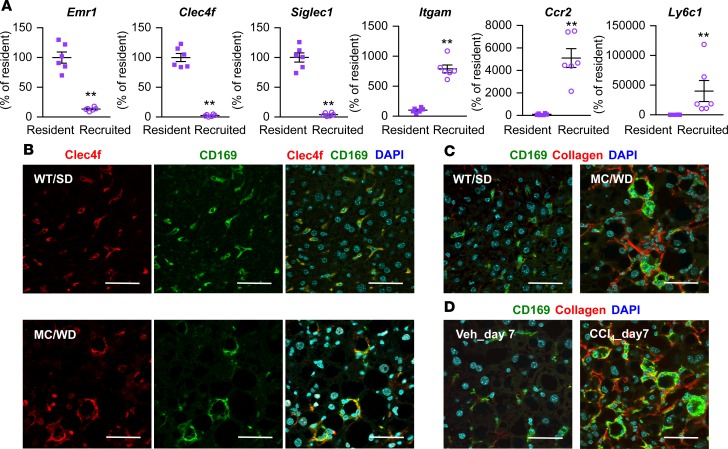
CD169, or Siglec-1, is a type I lectin containing 17 immunoglobulin domains; it is expressed in certain subsets of resident macrophages in spleen, lymph node, bone marrow, and intestine (29–32). In spite of the role in adaptive immune response (33), little is known about CD169+ cells in the liver. mRNA of Siglec1 as well as Clec4f, a marker for resident macrophages, was exclusively expressed in F4/80hi macrophages relative to CD11bhi macrophages from the livers of SD-fed wild-type mice (Figure 5A). In contrast, there was a predominant expression of Itgam, which encodes CD11b, Ccr2 and Ly6c1 in CD11bhi macrophages. CD169 immunostaining was colocalized with Clec4f in F4/80hi macrophages in wild-type and MC4R-KO mice fed SD and WD for 20 weeks, respectively (Figure 5B). Moreover, hCLS-constituting macrophages were positive for CD169 immunostaining in the conventional and inducible NASH models (Figure 5, C and D). We confirmed the data using another NASH model with wild-type mice fed WD for a long period (Supplemental Figure 7, A and B).
Figure 5. Characterization of CD169 as a marker for resident macrophages in the liver.
(A) F4/80hi resident and CD11bhi recruited macrophages were sorted from hepatic NPCs of wild-type mice fed SD. mRNA expression of Emr1, Clec4f, Siglec1 (CD169), Itgam, Ccr2, and Ly6c1 was analyzed by quantitative real-time PCR. Data represent mean ± SEM. **P < 0.01 (2-tailed unpaired Student’s t test). n = 5. (B) Immunofluorescent staining for Clec4f and CD169 of livers of wild-type mice fed SD (WT/SD) and MC4R-KO mice fed WD (MC/WD) for 20 weeks. Immunofluorescent staining for CD169 and type I collagen in MC/WD and WT/SD for 20 weeks (C) and the inducible NASH model (D). Veh, WD-fed MC4R-KO mice 7 days after vehicle (olive oil) injection; CCl4_day7, WD-fed MC4R 7 days after CCl4 injection. Scale bar: 50 μm.
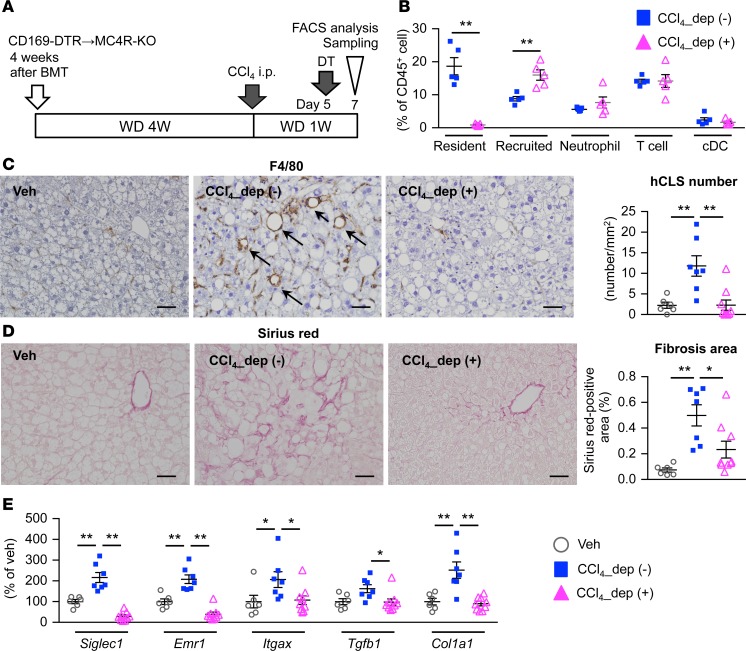
Next, we depleted these cells using CD169 promoter–driven diphtheria toxin receptor knockin (CD169-DTR) mice to investigate the cellular source of hCLS (34). Five days after CCl4 injection in the inducible NASH model, diphtheria toxin (DT) was administered to MC4R-KO mice with BMCs from CD169-DTR or wild-type mice (Figure 6A). Seven days after CCl4 injection, FACS analysis revealed almost complete depletion of F4/80hi macrophages, without any detectable effect on other cell types (Figure 6B). Histologically, treatment with DT abolished the increase in hCLS number and fibrosis area (Figure 6, C and D). In line with this, upregulated mRNA expression of genes related to inflammation and fibrogenesis was effectively suppressed by depletion of CD169+ macrophages (Figure 6E). These observations suggest that CD169+F4/80hi macrophages are a major cellular source of hCLS.
Figure 6. CD169+ macrophages are a major cellular source of hCLS.
(A) Experimental protocol for depletion of CD169+ cells in the inducible NASH model using CD169-DTR bone marrow–chimeric MC4R-KO (CD169-DTR–bone marrow MC4R-KO) mice. DT, diphtheria toxin; Veh, WD-fed WT-BM MC4R-KO mice injected with olive oil as a vehicle; CCl4_dep (-), inducible NASH model without depletion of CD169+ cells (WD-fed and CCl4-injected WT-BM MC4R-KO mice with DT treatment); CCl4_dep (+), inducible NASH model with depletion of CD169+ cells (WD-fed and CCl4-injected CD169-DTR–bone marrow MC4R-KO mice with DT treatment). (B) FACS analysis of hepatic NPCs. CD45+ cells were analyzed as follows: resident macrophage, F4/80hiCD11clo; recruited macrophage, F4/80loCD11bhi; neutrophil, Ly6GhiCD11b+; T cell, CD4+; conventional dendritic cell (cDC), CD11b–CD11c+. **P < 0.01 (2-tailed unpaired Student’s t test). n = 5. (C) Immunostaining for F4/80 and quantification of hCLS number. (D) Fibrosis area evaluated by Sirius red staining. n = 6–9. (E) Hepatic mRNA expression of genes related to inflammation (Siglec1, Emr1, and Itgax) and fibrogenesis (Tgfb1 and Col1a1). Data represent mean ± SEM. Scale bar: 50 μm. (C–E) *P < 0.05, **P < 0.01 (Tukey-Kramer test). n = 6–9.
Role of CD11c+ macrophages in hCLS formation and liver fibrosis in NASH.
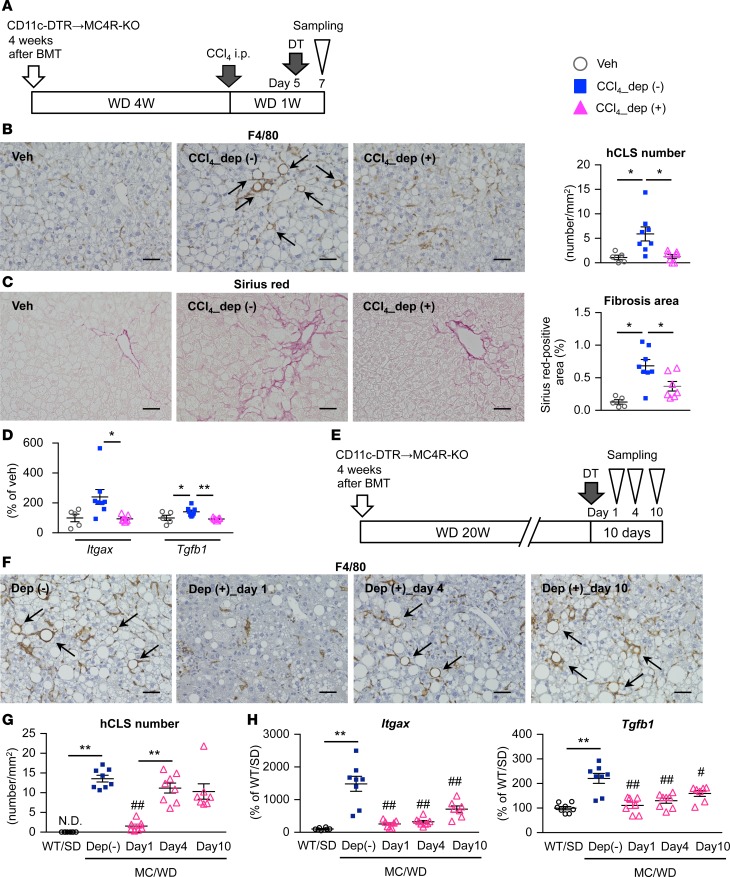
To elucidate the functional role of CD11c+F4/80hi macrophages in the pathogenesis of NASH, we generated bone marrow–chimeric MC4R-KO mice reconstituted with BMCs from CD11c promoter–driven DTR-transgenic (CD11c-DTR) mice. CD11c+ cells were depleted with DT 5 days after CCl4 injection in the inducible NASH model (Figure 7A). The number of hCLSs was remarkably decreased with DT treatment, resulting in reduction of fibrosis area and downregulation of Itgax and Tgfb1 mRNA expression (Figure 7, B–D). Moreover, we depleted CD11c+ macrophages after MC4R-KO mice developed NASH (Figure 7E). The number of hCLSs was markedly decreased after DT injection and was restored at day 4 (Figure 7, F and G); in addition, expression of Itgax and Tgfb1 was increased starting at day 4 (Figure 7H). Furthermore, we performed immunofluorescent analysis to confirm CD11c expression in the restored hCLS (Supplemental Figure 8). Besides MC4R-KO mice, similar results were observed in wild-type mice fed WD (Supplemental Figure 7, C and D). These findings suggest the role of hCLS-constituting CD11c+F4/80hi macrophages in liver fibrosis in NASH.
Figure 7. Role of CD11c+ macrophages in hCLS formation and fibrogenesis.
(A) Experimental protocol for depletion of CD11c+ cells in the inducible NASH model using CD11c-DTR bone marrow–chimeric MC4R-KO mice. Veh, WD-fed WT-BM MC4R-KO mice injected with olive oil as a vehicle; CCl4_dep (-), inducible NASH model without depletion of CD11c+ cells (WD-fed and CCl4-injected WT-BM MC4R-KO mice with DT treatment); CCl4_dep (+), inducible NASH model with depletion of CD11c+ cells (WD-fed and CCl4-injected CD11c-DTR–bone marrow MC4R-KO mice with DT treatment). n = 5–8. (B) Immunostaining for F4/80 and quantification of hCLS number and (C) fibrosis area. Arrows, hCLS. *P < 0.05, **P < 0.01 (Tukey-Kramer test). (D) Hepatic mRNA expression of Itgax and Tgfb1. (E) Experimental protocol for depletion of CD11c+ cells in the long-term WD-fed NASH model. CD11c-DTR MC4R-KO mice were injected with DT following 20-week WD feeding and were sacrificed at each time point (1, 4, and 10 days after DT injection). n = 7–8. (F) Immunostaining for F4/80 and (G) quantification of hCLS number. Arrows, hCLS. (H) Hepatic mRNA expression of Itgax and Tgfb1. Data represent mean ± SEM. *P < 0.05, **P < 0.01, #P < 0.05, ##P < 0.01 vs. MC/WD-Dep (-) (Tukey-Kramer test). Scale bar: 50 μm.
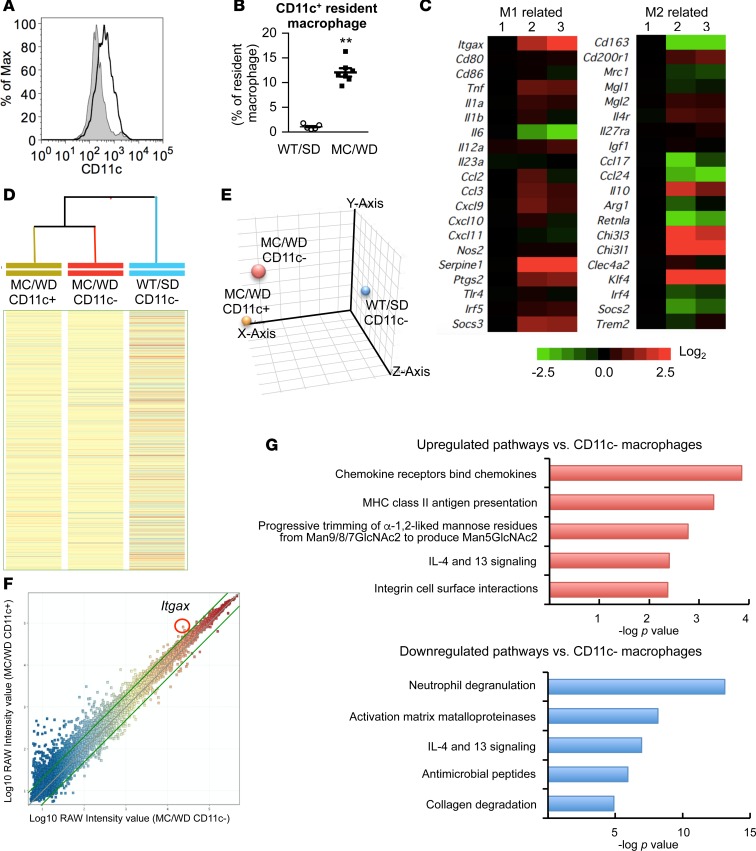
As the number of CD11c+F4/80hi macrophages was increased in WD-fed MC4R-KO mice relative to SD-fed wild-type mice (Figure 8, A and B), we performed microarray analysis to compare the gene expression patterns. The heatmap in Figure 8C showed that F4/80hi macrophages from WD-fed MC4R-KO mice were not categorized as typical M1 and M2 macrophages. In addition, there were apparent differences in the gene expression patterns between CD11c+ and CD11c– F4/80hi macrophages (Figure 8, C–F). Pathway analysis revealed that genes related to inflammation and extracellular matrix remodeling were upregulated and/or downregulated in CD11c+F4/80hi macrophages compared with CD11c–F4/80hi macrophages (Figure 8, F and G). These observations support the notion that CD11c+F4/80hi macrophages in the hCLS would be a macrophage subset that promotes liver fibrosis in NASH.
Figure 8. Microarray analysis of resident macrophages in the liver.
(A) Representative FACS data of CD11c expression of F4/80hiCD11blo resident macrophages isolated of MC4R-KO mice fed WD (MC/WD, black line) and wild-type mice fed SD (WT/SD, gray shade) for 20 weeks. (B) Percentage of CD11c+ cells in resident macrophages. Data represent mean ± SEM. **P < 0.01 (2-tailed unpaired Student’s t test). n = 5–7. (C) Heatmap showing relative expression levels of M1- and M2-related genes in resident macrophages. Lane 1 indicates resident macrophages isolated from the livers of wild-type mice fed SD (F4/80hiCD11blo CD11c- cells). Lanes 2 and 3 indicate CD11c– and CD11c+ resident macrophages of MC4R-KO mice fed WD for 20 weeks (F4/80hiCD11bloCD11c- and F4/80hiCD11bloCD11c+ cells, respectively). Hierarchical clustering analysis (D) and principal component analysis (E) of resident macrophages from WT/SD and MC/WD. (F) Scatterplot of gene expression profiling for CD11c– and CD11c+ resident macrophages of MC4R-KO mice fed WD. Green lines indicate the cutoffs for 2-fold induction and repression. (G) Pathway analysis of the genes more than 2-fold upregulated or downregulated in CD11c+ resident macrophages compared with CD11c– resident macrophages of MC4R-KO mice using the Reactome databases. The top 5 upregulated and downregulated pathways were indicated.
Role of CD11c+ macrophages in human NASH.
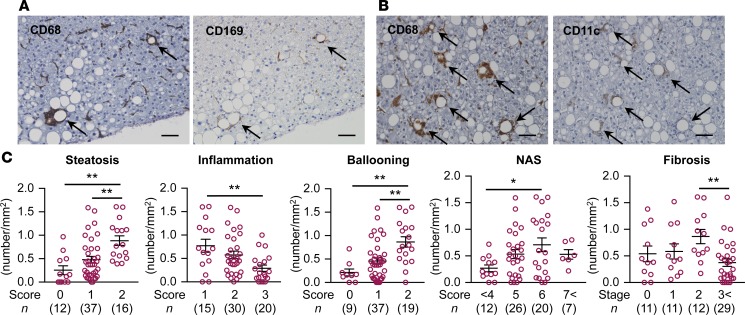
Finally, we examined the characteristics of hCLS-constituting macrophages using liver biopsy specimens from patients with NAFLD/NASH. Immunostaining using serial sections revealed that expression of CD169 and CD11c was positive in the macrophages constituting the hCLS (Figure 9, A and B). The number of CD11c+ hCLSs was positively correlated with the scores for hepatic steatosis and ballooning degeneration, a hallmark for hepatocyte injury (Figure 9C). In this study, the patients with NAS 6 and fibrosis stage 2 showed the highest number of CD11c+ hCLSs (Figure 9C). These observations suggest the clinical relevance of CD11c+ macrophages in hCLS in human NAFLD/NASH.
Figure 9. CD169 and CD11c expression in hCLS in human NASH.
Representative images of liver serial sections stained with CD68 and CD169 antibodies (A) and CD68 and CD11c antibodies (B) in patients with NASH. Arrows, hCLS. Scale bar: 50 μm. (C) Correlation of CD11c+ hCLS number and each histological score. Data represent mean ± SEM. *P < 0.05, **P < 0.01 (Tukey-Kramer test).
Discussion
Much attention has been paid to understanding how simple steatosis progresses to NASH; this would provide insights into therapeutic targets for NASH and potential biomarkers for identifying high-risk patients. In this study, we clearly demonstrate that CD11c+ resident macrophages in the hCLS play a critical role in liver fibrosis during the development of NASH. Since these macrophages aggregate around dead or dying hepatocytes to constitute hCLS, where parenchymal and stromal cells interact with each other, it is conceivable that hCLS provides a local microenvironment in the steatotic liver where cell death-triggered stromal cellular responses drive profibrotic mechanisms, thereby inducing the development of NASH. Moreover, CD11c+ resident macrophages in the hCLS would comprise a macrophage subset distinct from CD11c– resident macrophages scattered in the liver in terms of the gene expression profiles and histological localization. During the past decade, evidence has accumulated that macrophages are highly heterogenous in organs and pathologies, rather than simply dichotomous (proinflammatory M1 vs. antiinflammatory M2) (29, 35, 36). Accordingly, it is important to identify a specific macrophage subset in each pathogenic condition in vivo. This notion is consistent with the recent report by Satoh et al., suggesting that there are multiple macrophage subsets in a murine model of lung fibrosis, only one of which is responsible for fibrogenesis (37). So far, limited information has been available on in situ localization of macrophage subsets in inflamed tissues. Since hCLS is not observed in human viral hepatitis (10) and CD11c+ macrophages form hCLS in human NASH, characterization of this macrophage subset may offer a pathological mechanism specific to metabolic stress–induced liver fibrosis.
It is important to understand the molecular mechanism underlying tissue remodeling, since it may elicit a solution to tackle chronic inflammatory diseases, including NASH and obesity. On the flip side, it is technically difficult to examine the causality and precise time course of chronic inflammation on a long-term basis. In this regard, our inducible NASH model possesses several advantages as follows. First of all, it enables us to investigate the sequential events after hepatocyte injury or death, which eventually lead to histologically detectable fibrosis. Indeed, we demonstrate that hCLS is a cell death-triggered stromal cellular response. Second, hCLS synchronously develops in the inducible NASH model, whereas the lesions are at multiple stages of chronic inflammation in our conventional NASH model and human NASH. Third, it is useful to screen for novel therapeutic strategies targeting inflammation and fibrosis in the liver, without affecting systemic glucose and lipid metabolism. Finally, we can save time and cost using the inducible NASH model. On the other hand, we should be careful about its limitation as a disease model, since neither hepatocyte death induced by CCl4 nor anti-Fas antibody in the inducible model fully recapitulate the pathophysiology of NASH. Nevertheless, this disease model would help further the understanding of the molecular mechanism of NASH.
Interestingly, chemically induced hepatocyte injury is not sufficient to induce hCLS formation and liver fibrosis in the inducible NASH model. Indeed, the NASH-like liver phenotypes are not observed when low-dose CCl4 is administered to wild-type mice fed SD or WD or MC4R-KO mice fed SD for 4 weeks, although CCl4 injection induces initial liver injuries and hepatocyte degeneration, with swollen appearance in both mice. These results led us to speculate that preconditioning of hepatocytes and/or macrophages is important for hepatocyte death-induced hCLS formation. Previous studies reported that pharmacological blockade as well as genetic deletion of the central melanocortin system increases de novo lipogenesis in the liver and white adipose tissue independently of hyperphagia and that stimulation of the system increases lipolysis in the white adipose tissue (38, 39). In addition, we and others have shown that the central melanocortin system is involved in macrophage infiltration and proinflammatory cytokine production in peripheral tissues (40, 41). In this regard, it is noteworthy that CCl4 injection can induce hCLS formation in wild-type mice fed WD for a longer period, suggesting that functional impairment of MC4R is not crucial for hCLS formation. Further studies are required to understand the molecular mechanism of hCLS formation during the development of NASH.
We need to discuss the histological features, cellular components, and pathologic roles of hCLS and adipose tissue CLS, since they are the sites of the crosstalk between dead or dying parenchymal cells and macrophages, and they thereby induce chronic inflammation and tissue fibrosis (10, 14, 15). Although both macrophages constituting hCLS and adipose tissue CLS are positive for CD11c, their origins may be different. Resident macrophages are a major cellular source of hCLS, and CCR2 is dispensable for hCLS formation. In contrast, CCR2 is crucial for adipose tissue CLS. It is currently unclear why CCR2-mediated recruited macrophages do not play a major role in proinflammatory cytokine expression and pericellular fibrosis in the livers of MC4R-KO mice. Further investigation is required to conclude the origin of the macrophage subset constituting hCLS, since resident macrophages are reconstituted with bone marrow–derived macrophages in our bone marrow transplantation experiments and they may have differential phenotypes from yolk sac–derived resident macrophages (42). This study sheds light on the role of resident macrophages in the pathogenesis of NASH, rather than negating the substantial amount of knowledge on the pathophysiologic role of recruited macrophages. For the next step, it is important to examine the cellular crosstalk involving macrophages, hepatocytes, and fibroblasts to know how macrophages in hCLS become CD11c+. It is also interesting to investigate gene expression profiles of macrophages in hCLS and adipose tissue CLS, which would give us insight into the tissue-specific molecular mechanisms underlying chronic inflammation-induced fibrogenesis.
In summary, we demonstrate that CD169+F4/80hi resident macrophages aggregate around dead or dying hepatocytes to constitute hCLS, thereby inducing persistent inflammation and pericellular fibrosis in a murine model of NASH (Supplemental Figure 9). Our data also suggest that these macrophages in hCLS become CD11c+ in response to hepatocyte death, with unique polarization profiles. Although hCLS shares many histological features and pathologic roles with adipose tissue CLS, the cellular components may be different between the organs. Since limited information is available on in situ localization of macrophage subsets in inflamed tissues, this study provides evidence that a macrophage subset in hCLS drives hepatocyte death-induced liver fibrosis, suggesting a NASH-specific pathological mechanism.
Methods
Animals.
MC4R-KO and CD169-DTR-knockin mice were provided by Joel K. Elmquist (University of Texas Southwestern Medical Center, Dallas, Texas, USA) and Masato Tanaka, respectively (11, 34). CD11c-DTR-transgenic mice were provided by Steffen Jung (Weizemann Institute of Science, Rehovot, Israel) and Toshiaki Ohteki (43, 44). CCR2-KO and EGFP-transgenic mice were described previously (14, 17). C57BL/6J wild-type mice were purchased from CLEA Japan. The animals were acclimated to the environment in a temperature-, humidity-, and light-controlled room (12-hour-light/dark cycle) and allowed free access to water and SD (CE-2; 343.1 kcal/100 g, 12.6% energy as fat; CLEA Japan) for 1 week. Eight-week-old male mice were fed WD (D12079B; 468 kcal/100 g, 41% energy as fat, 34.0% sucrose, 0.21% cholesterol; Research Diets). At the end of the experiment, they were sacrificed, when fed ad libitum, under intraperitoneal pentobarbital anesthesia (30 mg/kg).
Inducible NASH model.
After 4-week WD feeding, MC4R-KO mice received a single injection of CCl4 (WAKO) intraperitoneally at a dose of 0.1 ml/kg diluted 1:40 in olive oil. Mice were kept on WD after CCl4 administration and were sacrificed at each time point. For additional details, see the Supplemental Methods.
Bone marrow transplantation.
Bone marrow transplantation was performed as described previously (14). In brief, BMCs were collected from wild-type, EGFP-transgenic, CCR2-KO, CD169-DTR, and CD11c-DTR donor mice and washed 2 times with cold PBS and injected intravenously (3 × 10⁶ cells) into 7.5-Gy irradiated 8-week-old recipient mice. The substitution rate of BMCs was determined by FACS analysis using peripheral blood and hepatic nonparenchymal cells of MC4R-KO mice reconstituted with BMCs obtained from EGFP-transgenic donor mice. In this study, more than 95% of peripheral blood cells and 90% of F4/80hi resident macrophages were substituted for GFP+ cells. After the 4-week recovery period, MC4R-KO mice were fed WD for the indicated period. Wild-type mice reconstituted with wild-type BMCs and fed SD served as a control.
Macrophage depletion experiment by DT treatment.
Lethally irradiated MC4R-KO mice were reconstituted with BMCs from CD169-DTR or wild-type mice and administered DT at a dose of 10 μg/kg intraperitoneally. In the experiment using CD11c-DTR bone marrow–chimeric MC4R-KO mice, DT was administered at a dose of 0.4 μg/kg intraperitoneally.
Macrophage labeling using PKH26.
The PKH26 cell linker kit (MilliporeSigma) was used following the manufacturer’s instruction with some modifications. Briefly, PKH26 fluorescence dye was diluted with diluent B 1:9 and injected 0.2 ml per body to MC4R-KO mice fed WD.
FACS analysis and sorting experiment.
The mice were perfused with PBS from the portal vein to remove blood from the liver. The liver was dispersed in Hank’s balanced salt solution with calcium and magnesium supplemented with 1 mg/ml type IV collagenase (MilliporeSigma) and 50 μg/ml DNaseI (Roche) using a gentleMACS dissociator (Miltenyi Biotec). Liver suspensions were shaken at 37°C for 20 minutes and resuspended using the gentleMACS dissociator. After filtered through a 100-μm cell strainer, cells were collected by centrifugation and resuspended in 30% percoll. The cell suspensions were centrifuged at 500 x g for 15 minutes at room temperature to remove cell debris. Red blood cells were lysed by ACK buffer and nonparenchymal cells were washed twice with PBS and resuspended in PBS containing EDTA and 0.5% BSA. Cells were stained with antibodies against CD45 (30-F11), CD11b (M1/70), CD11c (N418), F4/80 (BM8), Ly-6G (1A8), CD4 (GK1.5), and 7-AAD (BioLegend) and analyzed using FACSCantoII (BD Biosciences) or sorted using FACSAriaII (BD Biosciences) for mRNA expression analysis.
Histological analysis.
The liver was fixed with neutral-buffered formalin and embedded in paraffin. Four-μm-thick sections of the liver and epididymal fat were stained with hematoxylin and eosin and Sirius red (9). Immunohistochemical staining for F4/80 (MCA497GA, Serotec), αSMA (ab5694, Abcam), and cytokeratin 18 (NB100-79923, Novus Biologicals) was performed as previously described (10). Apoptotic cells were detected by TUNEL assay using the Apop-Tag Plus Peroxidase In Situ Apoptosis Detection Kit (Millipore). Positive areas for Sirius red and F4/80 were measured using WinROOF software (Mitani) (9). The numbers of hCLS and TUNEL+ cells were counted in the whole area of each F4/80-stained section and expressed as the mean number/mm2. For immunofluorescent staining, the liver was embedded in OCT compound and frozen in dry ice acetone. Ten-μm-thick frozen sections were stained with antibodies against F4/80 (Cl:A3-1, Bio-Rad), type I collagen (20151, Novotec), CD11c (14-0114, eBioscience), CD169 (142307, BioLegend), Clec4f (MAB2784, R&D Systems), and secondary antibodies (anti-rat IgG Alexa Fluor 488 [A11006, Invitrogen], anti-rabbit IgG Alexa Fluor 568 [A11036, Invitrogen], anti-hamster IgG Alexa Fluor 594 [127-585-160, Jackson ImmunoResearch Laboratories] and anti-hamster IgG Alexa Fluor 647 [127-605-160, Jackson ImmunoResearch Laboratories]) conjugated with Alexa Fluor 488, 568, or 594 (Invitrogen) and Alexa Fluor 647 (Jackson ImmunoResearch Laboratories). Sections were mounted in Vectashield mounting medium with DAPI (Vector Labs) and photographed using the FV10i-DOC confocal laser-scanning microscope (Olympus).
Quantitative Real-Time PCR.
Total RNA was extracted from the liver using Sepasol reagent (Nacalai Tesque) and from the sorted cells using the PureLink RNA Micro Kit (Invitrogen). Quantitative real-time PCR was performed with the StepOnePlus Real-time PCR System using the Fast SYBR Green Master Mix Reagent (Applied Biosystems) as described previously (9). Primers used in this study are listed in Supplemental Table 2. Data were normalized to 36B4 or 18S levels and analyzed using the comparative CT method.
Microarray analysis.
F4/80hiCD11blo resident macrophages were sorted based on the expression levels of CD11c from the livers of wild-type mice fed SD (CD11c–) and MC4R-KO mice fed WD for 20 weeks (CD11c– and CD11c+). Total RNAs were extracted from pooled macrophages of 7–9 mice using the PureLink RNA Micro Kit (Invitrogen). Microarray analysis was performed using SurePrint G3 Mouse GE 8 × 60K microarrays (Agilent Technologies) according to the manufacturer’s instructions. Data were obtained in quintuplicate and were normalized to the median of wild-type macrophages using GeneSpring software version 14.5 (Agilent Technologies). The pathway analysis was performed using the Reactome databases (http://reactome.org). Data have been deposited in NCBI’s Gene Expression Omnibus (accession GSE104901).
Human study.
Sixty-five Japanese NASH-suspected patients who had sustained liver dysfunction, dyslipidemia, and insulin resistance were recruited at Yamaguchi University hospital and Heart Life Hospital. Liver samples were obtained by ultrasound-guided liver biopsy to evaluate liver histology. Mean NAFLD activity score was 5.2 ± 0.2 (steatosis 2.1 ± 0.1, inflammation 1.1 ± 0.1, ballooning 2.0 ± 0.1), and mean fibrosis stage was 2.0 ± 0.2. Formalin-fixed and paraffin-embedded liver specimens were stained with antibodies against CD68 (M0876, Dako), CD169 (sc-53442, Santa Cruz, CA), and CD11c (EP1347Y, Abcam) (10, 31).
Statistics.
Data are presented as mean ± SEM, and P < 0.05 was considered statistically significant. Statistical analysis was performed using analysis of variance followed by Tukey-Kramer test. Two-tailed unpaired Student’s t test was used to compare two groups.
Study approval.
This study complies with the Declaration of Helsinki. All animal experiments were approved by the Institutional Animal Care and Use Committee of Tokyo Medical and Dental University (no. 2015-008C, no. 0170186A). The clinical study protocol was approved by the Medical Research Ethics Committee of Tokyo Medical and Dental University (no. 1366 and 1397), the Institutional Review Board of Yamaguchi University Hospital (H24-12 and H24-80), and the Institutional Review Board of Heart Life Hospital (24-6). The study is a follow-back study using existing materials and information. All samples were collected and stored for clinical practice at Yamaguchi University Hospital and Heart Life Hospital. Although written informed consent was not obtained for the current study, we obtained approval from Ethics Committee/Institutional Review Board of each institution based on Japanese Ethical Guidelines for Clinical Studies, disclosed detailed information on the study protocol, and provided all participants with an opportunity to refuse their inclusion in the study.
Author contributions
MI, T. Suganami, and YO designed the experiments. MI, HK, SK, and I. Shirakawa performed mouse experiments. MI, HK, SK, I. Shirakawa, T. Sakai, TG, and MA collected data. IH, HS, and I. Sakaida provided human samples. KA and MT provided CD169-DTR mice and helped with study design. KO and YK helped with histological analysis. MI, T. Suganami, and YO reviewed data and drafted and edited the manuscript.
Supplementary Material
Acknowledgments
The authors thank Joel K. Elmquist for the gift of MC4R-KO mice, Steffen Jung and Toshiaki Ohteki for CD11c-DTR-transgenic mice, and Miyako Tanaka (Nagoya University) for support of microarray analysis. We also thank the members of the Ogawa laboratory for helpful discussions. This work was supported in part by Grants-in-Aid for Scientific Research from the Ministry of Education, Culture, Sports, Science and Technology of Japan (16H05171, 16KT0110, 16K08732, 17K19686, and 17H05500) and Japan Agency for Medical Research and Development (CREST). This work was also supported by research grants from the Takeda Science Foundation, the Takeda Medical Research Foundation, the Uehara Memorial Foundation, the Suzuken Memorial Foundation, the Daiichi Sankyo Foundation of Life Science, the Japan Diabetes Society, and the Joint Usage/Research Program of Medical Research Institute, Tokyo Medical and Dental University.
Version 1. 11/16/2017
Electronic publication
Footnotes
Conflict of interest: M. Itoh and I. Shirakawa are assigned to the Joint Research Department of Tokyo Medical and Dental University and Shionogi & Co. Ltd.
Reference information: JCI Insight. 2017;2(22):e92902. https://doi.org/10.1172/jci.insight.92902.
Contributor Information
Michiko Itoh, Email: mito.mem@tmd.ac.jp.
Takayoshi Suganami, Email: suganami@riem.nagoya-u.ac.jp.
Hideaki Kato, Email: hideaki.katou@shionogi.co.jp.
Sayaka Kanai, Email: kanai.mem@tmd.ac.jp.
Ibuki Shirakawa, Email: sirakawa.mem@tmd.ac.jp.
Takeru Sakai, Email: takerusakai1980@gmail.com.
Toshihiro Goto, Email: tgotmem@tmd.ac.jp.
Masahiro Asakawa, Email: asakmem@tmd.ac.jp.
Isao Hidaka, Email: isao-h@yamaguchi-u.ac.jp.
Hiroshi Sakugawa, Email: h.sakugawa@heartlife.or.jp.
Koji Ohnishi, Email: kjoh@kumamoto-u.ac.jp.
Yoshihiro Komohara, Email: ycomo@kumamoto-u.ac.jp.
Kenichi Asano, Email: asanok@toyaku.ac.jp.
Isao Sakaida, Email: sakaida@yamaguchi-u.ac.jp.
Masato Tanaka, Email: mtanaka@toyaku.ac.jp.
Yoshihiro Ogawa, Email: yogawa@med.kyushu-u.ac.jp.
References
- 1.de Alwis NM, Day CP. Non-alcoholic fatty liver disease: the mist gradually clears. J Hepatol. 2008;48 Suppl 1:S104–S112. doi: 10.1016/j.jhep.2008.01.009. [DOI] [PubMed] [Google Scholar]
- 2.Lade A, Noon LA, Friedman SL. Contributions of metabolic dysregulation and inflammation to nonalcoholic steatohepatitis, hepatic fibrosis, and cancer. Curr Opin Oncol. 2014;26(1):100–107. doi: 10.1097/CCO.0000000000000042. [DOI] [PMC free article] [PubMed] [Google Scholar]
- 3.Luedde T, Kaplowitz N, Schwabe RF. Cell death and cell death responses in liver disease: mechanisms and clinical relevance. Gastroenterology. 2014;147(4):765–783.e4. doi: 10.1053/j.gastro.2014.07.018. [DOI] [PMC free article] [PubMed] [Google Scholar]
- 4.Feldstein AE, et al. Hepatocyte apoptosis and fas expression are prominent features of human nonalcoholic steatohepatitis. Gastroenterology. 2003;125(2):437–443. doi: 10.1016/S0016-5085(03)00907-7. [DOI] [PubMed] [Google Scholar]
- 5.Canbay A, et al. Kupffer cell engulfment of apoptotic bodies stimulates death ligand and cytokine expression. Hepatology. 2003;38(5):1188–1198. doi: 10.1053/jhep.2003.50472. [DOI] [PubMed] [Google Scholar]
- 6.Rivera CA, Adegboyega P, van Rooijen N, Tagalicud A, Allman M, Wallace M. Toll-like receptor-4 signaling and Kupffer cells play pivotal roles in the pathogenesis of non-alcoholic steatohepatitis. J Hepatol. 2007;47(4):571–579. doi: 10.1016/j.jhep.2007.04.019. [DOI] [PMC free article] [PubMed] [Google Scholar]
- 7.Ramadori G, Armbrust T. Cytokines in the liver. Eur J Gastroenterol Hepatol. 2001;13(7):777–784. doi: 10.1097/00042737-200107000-00004. [DOI] [PubMed] [Google Scholar]
- 8.Duffield JS, et al. Selective depletion of macrophages reveals distinct, opposing roles during liver injury and repair. J Clin Invest. 2005;115(1):56–65. doi: 10.1172/JCI22675. [DOI] [PMC free article] [PubMed] [Google Scholar]
- 9.Itoh M, et al. Melanocortin 4 receptor-deficient mice as a novel mouse model of nonalcoholic steatohepatitis. Am J Pathol. 2011;179(5):2454–2463. doi: 10.1016/j.ajpath.2011.07.014. [DOI] [PMC free article] [PubMed] [Google Scholar]
- 10.Itoh M, et al. Hepatic crown-like structure: a unique histological feature in non-alcoholic steatohepatitis in mice and humans. PLoS ONE. 2013;8(12):e82163. doi: 10.1371/journal.pone.0082163. [DOI] [PMC free article] [PubMed] [Google Scholar]
- 11.Balthasar N, et al. Divergence of melanocortin pathways in the control of food intake and energy expenditure. Cell. 2005;123(3):493–505. doi: 10.1016/j.cell.2005.08.035. [DOI] [PubMed] [Google Scholar]
- 12.Konuma K, et al. Eicosapentaenoic acid ameliorates non-alcoholic steatohepatitis in a novel mouse model using melanocortin 4 receptor-deficient mice. PLoS One. 2015;10(3):e0121528. doi: 10.1371/journal.pone.0121528. [DOI] [PMC free article] [PubMed] [Google Scholar]
- 13.Cinti S, et al. Adipocyte death defines macrophage localization and function in adipose tissue of obese mice and humans. J Lipid Res. 2005;46(11):2347–2355. doi: 10.1194/jlr.M500294-JLR200. [DOI] [PubMed] [Google Scholar]
- 14.Tanaka M, et al. Macrophage-inducible C-type lectin underlies obesity-induced adipose tissue fibrosis. Nat Commun. 2014;5:4982. doi: 10.1038/ncomms5982. [DOI] [PubMed] [Google Scholar]
- 15.Ichioka M, et al. Increased expression of macrophage-inducible C-type lectin in adipose tissue of obese mice and humans. Diabetes. 2011;60(3):819–826. doi: 10.2337/db10-0864. [DOI] [PMC free article] [PubMed] [Google Scholar]
- 16.Lumeng CN, Bodzin JL, Saltiel AR. Obesity induces a phenotypic switch in adipose tissue macrophage polarization. J Clin Invest. 2007;117(1):175–184. doi: 10.1172/JCI29881. [DOI] [PMC free article] [PubMed] [Google Scholar]
- 17.Ito A, et al. Role of CC chemokine receptor 2 in bone marrow cells in the recruitment of macrophages into obese adipose tissue. J Biol Chem. 2008;283(51):35715–35723. doi: 10.1074/jbc.M804220200. [DOI] [PubMed] [Google Scholar]
- 18.Weisberg SP, et al. CCR2 modulates inflammatory and metabolic effects of high-fat feeding. J Clin Invest. 2006;116(1):115–124. doi: 10.1172/JCI24335. [DOI] [PMC free article] [PubMed] [Google Scholar]
- 19.Kanda H, et al. MCP-1 contributes to macrophage infiltration into adipose tissue, insulin resistance, and hepatic steatosis in obesity. J Clin Invest. 2006;116(6):1494–1505. doi: 10.1172/JCI26498. [DOI] [PMC free article] [PubMed] [Google Scholar]
- 20.Kamei N, et al. Overexpression of monocyte chemoattractant protein-1 in adipose tissues causes macrophage recruitment and insulin resistance. J Biol Chem. 2006;281(36):26602–26614. doi: 10.1074/jbc.M601284200. [DOI] [PubMed] [Google Scholar]
- 21.Miura K, Yang L, van Rooijen N, Ohnishi H, Seki E. Hepatic recruitment of macrophages promotes nonalcoholic steatohepatitis through CCR2. Am J Physiol Gastrointest Liver Physiol. 2012;302(11):G1310–G1321. doi: 10.1152/ajpgi.00365.2011. [DOI] [PMC free article] [PubMed] [Google Scholar]
- 22.Mitchell C, et al. Dual role of CCR2 in the constitution and the resolution of liver fibrosis in mice. Am J Pathol. 2009;174(5):1766–1775. doi: 10.2353/ajpath.2009.080632. [DOI] [PMC free article] [PubMed] [Google Scholar]
- 23.Seki E, et al. CCR2 promotes hepatic fibrosis in mice. Hepatology. 2009;50(1):185–197. doi: 10.1002/hep.22952. [DOI] [PMC free article] [PubMed] [Google Scholar]
- 24.Obstfeld AE, et al. C-C chemokine receptor 2 (CCR2) regulates the hepatic recruitment of myeloid cells that promote obesity-induced hepatic steatosis. Diabetes. 2010;59(4):916–925. doi: 10.2337/db09-1403. [DOI] [PMC free article] [PubMed] [Google Scholar]
- 25.Yang SJ, IglayReger HB, Kadouh HC, Bodary PF. Inhibition of the chemokine (C-C motif) ligand 2/chemokine (C-C motif) receptor 2 pathway attenuates hyperglycaemia and inflammation in a mouse model of hepatic steatosis and lipoatrophy. Diabetologia. 2009;52(5):972–981. doi: 10.1007/s00125-009-1309-8. [DOI] [PubMed] [Google Scholar]
- 26.Krenkel O, Tacke F. Liver macrophages in tissue homeostasis and disease. Nat Rev Immunol. 2017;17(5):306–321. doi: 10.1038/nri.2017.11. [DOI] [PubMed] [Google Scholar]
- 27.Morinaga H, et al. Characterization of distinct subpopulations of hepatic macrophages in HFD/obese mice. Diabetes. 2015;64(4):1120–1130. doi: 10.2337/db14-1238. [DOI] [PMC free article] [PubMed] [Google Scholar]
- 28.Caldwell S, et al. Hepatocellular ballooning in NASH. J Hepatol. 2010;53(4):719–723. doi: 10.1016/j.jhep.2010.04.031. [DOI] [PMC free article] [PubMed] [Google Scholar]
- 29.Chávez-Galán L, Olleros ML, Vesin D, Garcia I. Much more than M1 and M2 macrophages, there are also CD169(+) and TCR(+) macrophages. Front Immunol. 2015;6:263. doi: 10.3389/fimmu.2015.00263. [DOI] [PMC free article] [PubMed] [Google Scholar]
- 30.Asano K, et al. CD169-positive macrophages dominate antitumor immunity by crosspresenting dead cell-associated antigens. Immunity. 2011;34(1):85–95. doi: 10.1016/j.immuni.2010.12.011. [DOI] [PubMed] [Google Scholar]
- 31.Ohnishi K, et al. CD169-positive macrophages in regional lymph nodes are associated with a favorable prognosis in patients with colorectal carcinoma. Cancer Sci. 2013;104(9):1237–1244. doi: 10.1111/cas.12212. [DOI] [PMC free article] [PubMed] [Google Scholar]
- 32.Asano K, et al. Intestinal CD169(+) macrophages initiate mucosal inflammation by secreting CCL8 that recruits inflammatory monocytes. Nat Commun. 2015;6:7802. doi: 10.1038/ncomms8802. [DOI] [PMC free article] [PubMed] [Google Scholar]
- 33.Davies LC, Jenkins SJ, Allen JE, Taylor PR. Tissue-resident macrophages. Nat Immunol. 2013;14(10):986–995. doi: 10.1038/ni.2705. [DOI] [PMC free article] [PubMed] [Google Scholar]
- 34.Miyake Y, Asano K, Kaise H, Uemura M, Nakayama M, Tanaka M. Critical role of macrophages in the marginal zone in the suppression of immune responses to apoptotic cell-associated antigens. J Clin Invest. 2007;117(8):2268–2278. doi: 10.1172/JCI31990. [DOI] [PMC free article] [PubMed] [Google Scholar]
- 35.Murray PJ, Wynn TA. Protective and pathogenic functions of macrophage subsets. Nat Rev Immunol. 2011;11(11):723–737. doi: 10.1038/nri3073. [DOI] [PMC free article] [PubMed] [Google Scholar]
- 36.Gordon S, Taylor PR. Monocyte and macrophage heterogeneity. Nat Rev Immunol. 2005;5(12):953–964. doi: 10.1038/nri1733. [DOI] [PubMed] [Google Scholar]
- 37.Satoh T, et al. Identification of an atypical monocyte and committed progenitor involved in fibrosis. Nature. 2017;541(7635):96–101. doi: 10.1038/nature20611. [DOI] [PubMed] [Google Scholar]
- 38.Nogueiras R, et al. The central melanocortin system directly controls peripheral lipid metabolism. J Clin Invest. 2007;117(11):3475–3488. doi: 10.1172/JCI31743. [DOI] [PMC free article] [PubMed] [Google Scholar]
- 39.Shrestha YB, Vaughan CH, Smith BJ, Song CK, Baro DJ, Bartness TJ. Central melanocortin stimulation increases phosphorylated perilipin A and hormone-sensitive lipase in adipose tissues. Am J Physiol Regul Integr Comp Physiol. 2010;299(1):R140–R149. doi: 10.1152/ajpregu.00535.2009. [DOI] [PMC free article] [PubMed] [Google Scholar]
- 40.Tanaka M, et al. Role of central leptin signaling in renal macrophage infiltration. Endocr J. 2010;57(1):61–72. doi: 10.1507/endocrj.K09E-296. [DOI] [PubMed] [Google Scholar]
- 41.Tang L, et al. Sympathetic nerve activity maintains an anti-inflammatory state in adipose tissue in male mice by inhibiting TNF-α gene expression in macrophages. Endocrinology. 2015;156(10):3680–3694. doi: 10.1210/EN.2015-1096. [DOI] [PubMed] [Google Scholar]
- 42.Beattie L, et al. Bone marrow-derived and resident liver macrophages display unique transcriptomic signatures but similar biological functions. J Hepatol. 2016;65(4):758–768. doi: 10.1016/j.jhep.2016.05.037. [DOI] [PMC free article] [PubMed] [Google Scholar]
- 43.Jung S, et al. In vivo depletion of CD11c+ dendritic cells abrogates priming of CD8+ T cells by exogenous cell-associated antigens. Immunity. 2002;17(2):211–220. doi: 10.1016/S1074-7613(02)00365-5. [DOI] [PMC free article] [PubMed] [Google Scholar]
- 44.Ohteki T, et al. Essential roles of DC-derived IL-15 as a mediator of inflammatory responses in vivo. J Exp Med. 2006;203(10):2329–2338. doi: 10.1084/jem.20061297. [DOI] [PMC free article] [PubMed] [Google Scholar]
Associated Data
This section collects any data citations, data availability statements, or supplementary materials included in this article.


