

Abstract
This study tested the hypothesis that SS31 therapy could effectively protect the heart against transverse aortic constriction (TAC)-induced hypertrophic cardiomyopathy (HCM) damage. Adult-male B6 mice (n=36) were equally divided into sham-operated control (group 1), TAC only (group 2) and TAC+SS31 (group) (2.0 mg/kg/day by intra-peritoneal administration from day 28 after TAC induction) and euthanized by day 60. In vitro results showed that SS31 markedly suppressed angiotensin-II induced protein expressions of BNP/β-MHC, ATM, p-P38 and P53 and ATP damage in H9C2 cells, and protein expression of pro-collagen-I/CTGF in fibroblasts (all P<0.001). By day 60, left ventricular ejection fraction (LVEF) and sarcomere length were significantly lower in group 2 than groups 1 and 3, and significantly lower in group 3 than in group 1, whereas the LEVDd/LVESd and ratio of heart weight to tibial length showed an opposite pattern to LVEF (all P<0.0001). Microscopic findings of numbers of apoptotic nuclei, inflammatory (CD14+, F4/80+) and oxidative-stress (H2DCFDA+) biomarkers, disorganized score of endocardium, and fibrotic and collagen-deposition areas showed an opposite pattern to LVEF among the three groups (all P<0.0001). The protein expressions of inflammatory (PDGF/TNF-α/NF-κB/COX-2), oxidative-stress (NOX-1/NOX-2/oxidized protein), fibrotic (TGF-β/Smad3) apoptotic (cleaved-caspase-3/cleaved-PARP), pressure/volume overload (BNP/β-MHC), CTGF, mitochondrial-damaged (cytosolic cytochrome-C), p-ERK1/2, p-Akt and PI3K signaling showed an opposite pattern to LVEF among the three groups (all P<0.001). The protein expression of anti-oxidants (HO-1/Nrf2) were significantly progressively increased in groups 1 to 3 (all P<0.001). In conclusion, SS31 therapy effectively protected the heart against TAC-induced damage.
Keywords: Transverse aortic constriction, hypertrophic cardiomyopathy, SS31 therapy
Introduction
The etiologies of heart failure (HF) are divergent, such as valvular disease, pressure overload, ischemia, and cardiomyocyte disease. Of these, pressure overload-associated pathological cardiac hypertrophy (CH) is one of the most common etiologies to cause HF [1-3]. Pathophysiologically, CH is an abnormal growth in the mass of the heart muscle resulting from cardiomyocyte hypertrophy along with the remarkable proliferation of fibroblasts and extracellular matrix (ECM) [4-7]. This process, called compensatory change in heart, is initially an adaptive response to maintain cardiac function through reduction in wall stress and energy expenditure [7,8]. However, the accompanying growth/proliferation of microvasculature for maintaining the blood supply in response to increased cardiomyocyte hypertrophy and workload is always inadequate, which leads eventually to imbalanced heart metabolism [2-4] and insufficient nutrient supply. This results in chronic cardiac diastolic dysfunction or even development into decompensated HF, causing high morbidity and mortality worldwide [4,9-12].
Previous studies have demonstrated that the fundamental pathological changes of cellular-molecular levels in CH are the continuous generation of reactive oxygen species (ROS)/oxidative stress and mitochondrial dysfunction caused by oxidative stress [13-15]. Additionally, mitochondrial oxidative damage promotes mitochondrial cytochrome c release [16] and cessation of ATP production, resulting in cardiomyocyte death and myocardial fibrosis.
Since mitochondria are known to be both the source and target of ROS [14], a number of previous studies have explored the possibility of mitochondria-targeted therapeutic approaches in the treatment of different disease entities [14-19]. These findings raise the potential that mitochondria-targeted therapeutic approaches by breakthrough generation of ROS and oxidative stress may be appropriate for CH.
Antioxidant peptide SS31 is amongst a novel class of cell-permeable small peptides that highly selectively resides on the inner layer of mitochondrial membrane and owns its intrinsic mitochondrial protective ability [17,19,20]. Several studies have displayed that SS31 acts as a scavenger of ROS, attenuates mitochondrial ROS production, and inhibits mitochondrial permeability transition [16,17,19,20]. SS31 has been shown to be potent in guarding against cell apoptosis and necrosis induced by oxidative stress or inhibition of the mitochondrial electron transport chain, especially in experimental models of acute ischemia-reperfusion injury [16,17,19,20]. Surprisingly, the therapeutic role of peptide SS31 in CH has seldom been reported [18,19]. Accordingly, this study investigated the therapeutic potential of peptide SS31, a mitochondrial targeted antioxidant, in treating transverse aortic constriction (TAC)-induced CH, myocardial damage and heart dysfunction, by utilizing an animal model.
Materials and methods
Ethics
All animal experimental protocols and procedures were approved by the Institute of Animal Care and Use Committee at Kaohsiung Chang Gung Memorial Hospital (Affidavit of Approval of Animal Use Protocol No. 2015032403) and performed in accordance with the Guide for the Care and Use of Laboratory Animals [The Eighth Edition of the Guide for the Care and Use of Laboratory Animals (NRC 2011)].
Animals were housed in an Association for Assessment and Accreditation of Laboratory Animal Care International (AAALAC)-approved animal facility in our hospital with controlled temperature and light cycle (24°C and 12/12 light cycle).
Animal grouping and induction of pathological hypertrophic cardiomyopathy by TAC
The procedure and protocol of TAC has been detailed in our recent report [21]. Pathogen-free, male adult C57BL/6 (B6) mice (n=36) weighing 22-25 g (Charles River Technology, BioLASCO, Taiwan) were equally divided into sham control (SC), TAC only, and TAC+SS31 (2.0 mg/kg/day by intra-peritoneal administration since day 28 after TAC induction). The dosage of SS31 in the present study was based on our recent report [22].
All animals were placed in a supine position under anesthesia with 2.0% inhalational isoflurane on a warming pad at 37°C and intubated with positive-pressure ventilation (180 mL/min) with room air using a small animal ventilator (SAR-830/A, CWE, Inc., USA) for the TAC procedure. Under sterile conditions, the heart was exposed via a left thoracotomy. TAC was induced in groups 2 and 3 animals by tying the ascending aorta with 7-0 prolene on a 25# needle between the aortic arch (after right common carotid artery) and left common carotid artery. The needle was then removed, leaving a constricted aorta. These mice were then assigned to groups 2 and 3 respectively. Only a left thoracotomy without TAC was performed for group 1 animals. After the procedure, the thoracotomy wound was closed and the animals were allowed to recover from anaesthesia in a portable animal intensive care unit (ThermoCare®) for 24 hours.
By day 60, animal in each group was euthanized. The harvested hearts were divided into (1) the whole heart section (n=6 in each group) and (2) the remainders (n=6 in each group) were utilized for other individual studies.
In vitro study for identifying the impact of SS31 therapy on inhibiting the oxidative stress and collagen reproduction in H9C2 cell line and fibroblast from angiotensin II treatment
To determine the impact of SS31 against the angiotensin II-induced DNA damage, cell apoptosis/death and fetal gene of β-myosin heavy chain (MHC) as well as connecting tissue growth factor (CTGF), H9C2 cells (cardioblast cell line) and fibroblast (Bioresource Collection and Research Center, Hsinchu, Taiwan) were first cultured in DMEM culture medium, respectively, followed by co-culture with 5.0 µM angiotensin II and SS31 (0 and 20 μM) for 24 h. The H29C2 cells and fibroblast were then collected for individual study.
Utilization of ELISA for measuring the ATP concentration in H9C2 cells
The ATP assay protocol was based on the manufacturer’s instructions. Briefly, after removing the H9C2 cells from the culture plate, 100 μL ATP Assay Buffer was added into the cells, followed by centrifugation in 12000 rpm at 4°C for 5 minutes. The supernatant was then removed into the microtubule, 10 µL neutralization solution (ab204708, Abcam) was added and allowed to rest for 5 minutes within an ice box. The standard, sample background control, and the sample (as 50 μL volume) were added into a 96-well plate (i.e., reaction mix, background reaction mix) which finally was recognized by the 570 nm λ reabsorbing reader in a dark room 30 minutes later.
Functional assessment by echocardiography
The procedure and protocol for transthoracic echocardiography was based on our recent report [21]. Transthoracic echocardiography (Vevo 2100, Visualsonics) was performed in each group prior to and on day 60 after SS31 treatment by an animal cardiologist blinded to the experimental design. M-mode standard two-dimensional (2D) left parasternal-long axis echocardiographic examination was conducted. Left ventricular internal dimensions [i.e., left ventricular end-systolic diameter (LVESd) and left ventricular end-diastolic diameter (LVEDd)] were measured at mitral valve and papillary levels of the left ventricle, according to the American Society of Echocardiography leading-edge method using at least three consecutive cardiac cycles. Left ventricular ejection fraction (LVEF) was calculated as follows: LVEF (%) = [(LVEDd3-LVESd3)/LVEDd3]×100%.
Western blot analysis
The procedure and protocol for Western blot analysis were based on our recent reports [23-25]. Briefly, equal amounts (50 μg) of protein extracts were loaded and separated by SDS-PAGE using acrylamide gradients. After electrophoresis, the separated proteins were transferred electrophoretically to a polyvinylidenedifluoride (PVDF) membrane (GE, UK). Nonspecific sites were blocked by incubating the membrane in blocking buffer [5% nonfat dry milk in T-TBS (TBS containing 0.05% Tween 20)] overnight. The membranes were incubated with the indicated primary antibodies [COX-2 (1:1000, Cell Signaling), caspase 3 (1:1000, Cell Signaling), Poly (ADP-ribose) polymerase (PARP) (1:1000, Cell Signaling), nuclear factor (NF)-κB (1:600, Abcam), tumor necrosis factor (TNF)-α (1:1000, Cell Signaling), platelet derived growth factor (PDGF) (1:500, Abcam), CTGF (1:1000, Abcam), ERK1/2 (1:1000, Calbiochem), phosphorylated (p)-ERK1/2 (1:1000, Calbiochem), PI3K (1:1000, Cell Signaling), Akt 1:1000, Cell Signaling)), p-Akt (1:1000, Cell Signaling), Nrf2 (1:600, Abcam), hemeoxygenase (HO)-1 (1:500, Calbiochem), cytosolic cytochrome C (1:1000, BD), mitochondrial cytochrome C, phosphorylated (p)-Smad1/5 (1:1000, Cell Signaling), transforming growth factor (TGF)-β (1:500, Abcam), NOX-1 (1:1500, Sigma), NOX-2 (1:750, Sigma), COX-2 (1:1000, Cell Signaling), ATM (1:2000, Abcam), brain natriuretic peptide (BNP) (1:500, Abcam), α-MHC (1:300, Santa Cruz), β-MHC (1:1000, Santa Cruz), COX-IV (1:1000, Abcam), andActin (1:1000, Millipore)] for 1 hour at room temperature. Horseradish peroxidase-conjugated anti-rabbit immunoglobulin IgG (1:2000, Cell Signaling, Danvers, MA, USA) was used as a secondary antibody for one-hour incubation at room temperature. The washing procedure was repeated eight times within one hour. Immunoreactive bands were visualized by enhanced chemiluminescence (ECL; Amersham Biosciences, Amersham, UK) and exposed to Biomax L film (Kodak, Rochester, NY, USA). For the purpose of quantification, ECL signals were digitized using Labwork software (UVP, Waltham, MA, USA).
Immunohistochemical (IHC) and immunofluorescent (IF) staining
The procedure and protocol of IHC and IF staining have been described in detail in our previous reports [23-25]. For IHC and IF staining, rehydrated paraffin sections were first treated with 3% H2O2 for 30 minutes and incubated with Immuno-Block reagent (BioSB, Santa Barbara, CA, USA) for 30 minutes at room temperature. Sections were then incubated with primary antibodies specifically against CD14 (1:50, Santa Cruz biotechnology), F4/80 (1:100, Abcam), Sirius red, Masson’s trchrome (ScyTek Lab), sarcomere (1:500, Imgenx) and H2DCFDA, while sections incubated with the use of irrelevant antibodies served as controls. Three sections of heart specimen from each mouse were analyzed. For quantification, three randomly selected HPFs (200× for IF studies) were analyzed in each section. The scoring system reflecting the grading of H2DCFDA+ cells in 10 randomly chosen, non-overlapping fields (200x) was scored as follows: 0 (none), 1 (≤10%), 2 (11-25%), 3 (26-45%), 4 (46-75%), and 5 (≥76%).
Assessment of oxidative stress
The procedure and protocol for evaluating the protein expression of oxidative stress have been described in detail in our previous reports [23-25]. The Oxyblot Oxidized Protein Detection Kit was purchased from Chemicon, Billerica, MA, USA (S7150). DNPH derivatization was carried out on 6 μg of protein for 15 minutes according to the manufacturer’s instructions. One-dimensional electrophoresis was carried out on 12% SDS/polyacrylamide gel after DNPH derivatization. Proteins were transferred to nitrocellulose membranes that were then incubated in the primary antibody solution (anti-DNP 1:150) for 2 hours, followed by incubation in secondary antibody solution (1:300) for 1 hour at room temperature. The washing procedure was repeated eight times within 40 minutes. Immunoreactive bands were visualized by enhanced chemiluminescence (ECL; Amersham Biosciences, Amersham, UK) which was then exposed to Biomax L film (Kodak, Rochester, NY, USA). For quantification, ECL signals were digitized using Labwork software (UVP, Waltham, MA, USA). For oxyblot protein analysis, a standard control was loaded on each gel.
Estimating the degree of disarrangement of the endocardial layer by scoring
The degree of disarrangement of the endocardial layer was defined as (1) score 0: no disarrangement; (2) score 1: <15% of disarrangement of cardiomyocyte architecture was identified per high-power field (HPF); (3) score 2: >15% and ≤50% of disarrangement of cardiomyocyte architecture was identified per HPF; (4) score 3: >50% of disarrangement of cardiomyocyte architecture was unidentified HPF. The scoring system reflecting the grading of cardiomyocyte disarrangement in 10 randomly chosen and non-overlapping fields (200×) was scored.
Statistical analysis
Quantitative data are expressed as means ± SD. Statistical analysis was adequately performed by ANOVA, followed by Bonferroni multiple-comparison post hoc test. SAS statistical software for Windows version 8.2 (SAS institute, Cary, NC) was utilized. A P value of less than 0.05 was considered statistically significant.
Results
Angiotensin reduced the expression of mitochondria and ATP concentration in H9C2 cells that was reversed by SS31 treatment (Figure 1)
Figure 1.
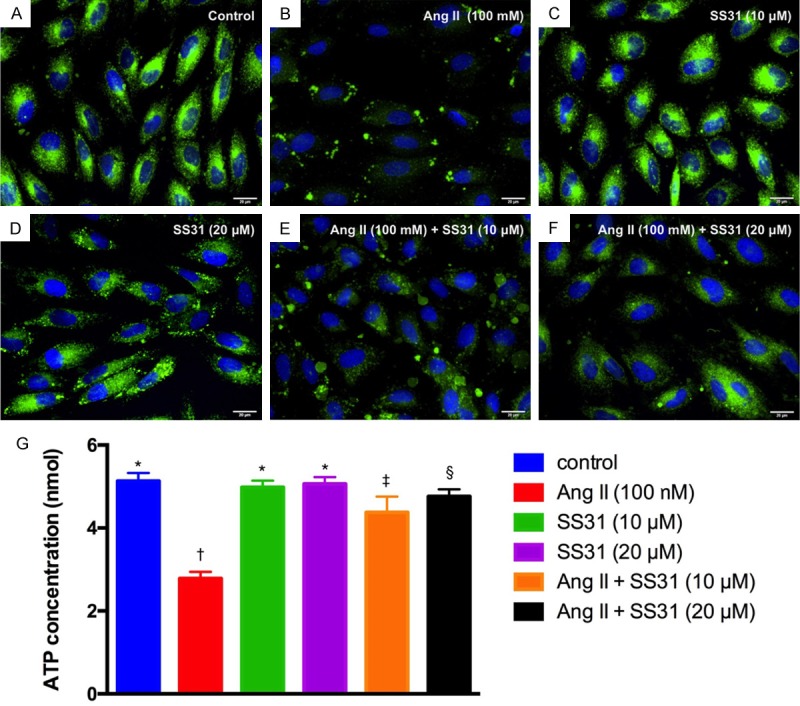
SS31 therapy preserves the expressions of mitochondria and ATP in H9C2 cells. A-F. Illustrative microscopic immunofluorescence (400×) to identify the expression of mitochondria (green; i.e., the result was merge of Hoechst 33258 and Mitotracker staining) in H9C2 cells. The results showed that as compared with control group, mitochondria expression did not differ in H9C2 cells treated by SS31 (10 μM or 20 μM) groups. However, the as compared with control group mitochondrial expression in H9C2 cells was markedly suppressed by angiotensin II (100 nM) that were progressively reversed after increasing the dosage of SS31 treatment (i.e., from (10 μM to 20 μM). Scale bars in right lower corner represent 20 µm. G. Analysis ELISA investigation of ATP concentration, * vs. other groups with different symbols (†, ‡, §), P<0.0001. All statistical analyses were performed by one-way ANOVA, followed by Bonferroni multiple comparison post hoc test (n=6 for each group). Symbols (*, †, ‡, §) indicate significance at the 0.05 level. Ang II = Angiotensin II.
As compared with normal control (NC), the expression of mitochondria in H9C2 cells (Figure 1A-F) was significantly reduced in H9C2 cells treated by angiotensin II (100 nM); this was significantly and stepwise reversed with increasing dosages of SS31 treatment (i.e., from 10 µM to 20 µM, respectively). Additionally, ELISA measurement showed that the APT concentration in H9C2 cells was identical to the expression of mitochondria among the groups (Figure 1G). These findings suggested that SS31 therapy preserved mitochondria-ATP level, an indicator of energy in H9C2 cells, potentially through protecting the mitochondria against oxidative-stress damage.
The protein expressions of pressure/volume overload and myocardial hypertrophic biomarkers in H9C2 cells and collagen proliferative biomarkers in fibroblast (Figure 2)
Figure 2.
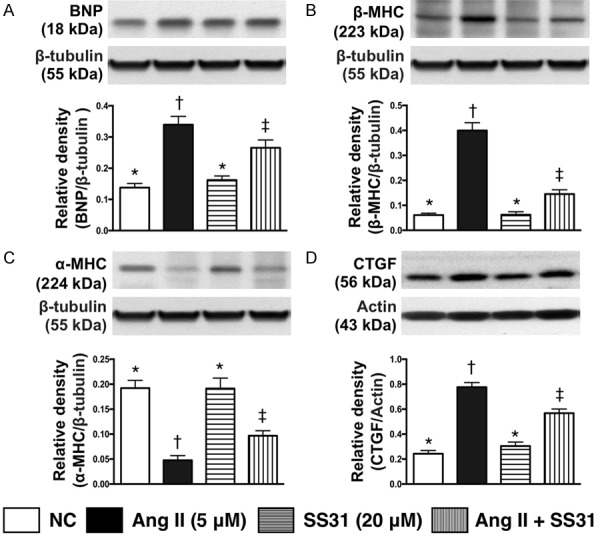
SS31 against the effect of angiotensin II on protein expressions of BNP, β-MHC and α-MHC in H9C2 cells and CTGF in fibroblasts. A. Protein expression of brain natriuretic peptide (BNP) in H9C2 cells, * vs. other groups with different symbols (†, ‡), P<0.001. B. Protein expression of beta myosin heavy chain (β-MHC) in H9C2 cells, * vs. other groups with different symbols (†, ‡), P<0.0001. C. Protein expression of α-MHC, * vs. other groups with different symbols (†, ‡), P<0.0001. D. Protein expression of connecting tissue growth factor (CTGF) in fibroblast, * vs. other groups with different symbols (†, ‡), P<0.0001. All statistical analyses were performed by one-way ANOVA, followed by Bonferroni multiple comparison post hoc test (n=6 for each group). Symbols (*, †, ‡) indicate significance at the 0.05 level. Ang II = Angiotensin II.
The results of in vitro study demonstrated that, as compared with control group, the protein expression of brain natriuretic peptide (BNP), an indicator of pressure/volume overload, was significantly higher in H9C2 cells treated by angiotensin II. This was significantly reduced after SS31 treatment (20 µM).
It is well recognized that cardiac hypertrophy is characterized by a switch from α- to β-MHC protein expression (i.e. reactivation of fetal gene program). The results of the in vitro study showed that the protein expression of β-MHC was significantly higher in H9C2 cells treated by angiotensin II as compared with the controls; this was significantly reversed after the SS31 treatment. Conversely, protein expression of α-MHC in H9C2 cells showed a reversed pattern as compared to that of β-MHC among the three groups. However, the protein expression of CTGF and procollagen type I in fibroblast, an indicator of smooth muscle cell proliferation, exhibited an identical pattern to β-MHC among the three groups.
SS31 therapy inhibited the protein expressions of DNA damaged downstream signaling pathways in H9C2 cells (Figure 3)
Figure 3.
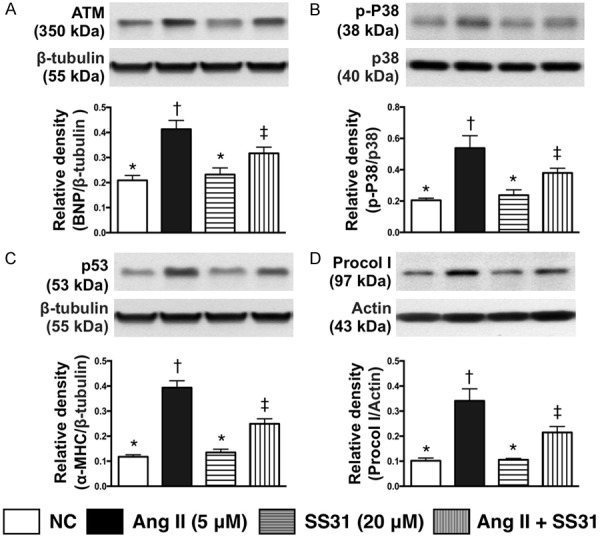
SS31 therapy inhibited the protein expression of DNA damage downstream signaling pathways in H9C2 cells. A. Protein expression of ATM, * vs. other groups with different symbols (†, ‡, §, ¶), P<0.001. B. Protein expression of phosphorylated (p)-p38, * vs. other groups with different symbols (†, ‡), P<0.001. C. Protein expression of p53, * vs. other groups with different symbols (†, ‡), P<0.0001. D. Protein expression of procollagen type I (procol I), * vs. other groups with different symbols (†, ‡), P<0.0001. All statistical analyses were performed by one-way ANOVA, followed by Bonferroni multiple comparison post hoc test (n=6 for each group). Symbols (*, †, ‡, §, ¶) indicate significance at the 0.05 level. Ang II = Angiotensin II.
The protein expression of ATM, a downstream signaling of DNA damage, was significantly higher in H9C2 cells treated by angiotensin II as compared with control group; this was reversed after SS31 treatment. Additionally, protein expressions of p-P38 and P53, two downstream signaling molecules of ATM that would be activated following the activation of ATM after DNA damage, displayed a pattern identical to that of ATM among the three groups. Furthermore, the protein expression of procollagen I, an indicator of DNA-damage, also showed an identical pattern to ATM among the groups.
Impact of SS31 therapy on reducing cardiac hypertrophy and preserving left ventricular performance by day 60 after TAC procedure (Table 1)
Table 1.
Serial changes of transthoracic echocardiographic findings in three groups of animals
| Variables | NC | TAC | TCA-SS31 | p-value |
|---|---|---|---|---|
| By day 0 | ||||
| LVEDd (mm) | 3.51 ± 0.42 | 3.52 ± 0.18 | 3.51 ± 0.22 | 0.512 |
| LVESd (mm) | 2.24 ± 0.36 | 2.24 ± 0.19 | 2.24 ± 0.28 | 0.869 |
| IVSd (mm) | 0.63 ± 0.05 | 0.63 ± 0.03 | 0.63 ± 0.04 | 0.881 |
| LVPW (mm) | 0.66 ± 0.04 | 0.67 ± 0.02 | 0.66 ± 0.03 | 0.664 |
| LVEF (%) | 67.14 ± 4.34 | 67.73 ± 3.41 | 67.22 ± 3.68 | 0.678 |
| By day 28 | ||||
| LVEDd (mm) | 3.52 ± 0.22a | 3.91 ± 0.14b | 3.97 ± 0.32b | <0.01 |
| LVESd (mm) | 2.24 ± 0.33a | 2.86 ± 0.17b | 2.86 ± 0.32b | <0.01 |
| IVSd (mm) | 0.62 ± 0.08a | 0.70 ± 0.05b | 0.69 ± 0.04b | <0.001 |
| LVPW (mm) | 0.66 ± 0.06a | 0.70 ± 0.03b | 0.69 ± 0.03b | <0.01 |
| LVEF (%) | 67.81 ± 2.64a | 51.51 ± 2.34b | 52.64 ± 4.82b | <0.0001 |
| By day 60 | ||||
| LVEDd (mm) | 3.58 ± 0.32a | 4.28 ± 0.44b | 4.21 ± 0.18b | <0.001 |
| LVESd (mm) | 2.31 ± 0.43a | 3.62 ± 0.42b | 3.0 ± 0.27c | <0.01 |
| IVSd (mm) | 0.63 ± 0.06a | 0.63 ± 0.02a | 0.65 ± 0.03a | 0.241 |
| LVPW (mm) | 0.69 ± 0.05a | 0.65 ± 0.02b | 0.70 ± 0.05a | <0.01 |
| LVEF (%) | 67.66 ± 2.54a | 32.94 ± 2.19b | 55.97 ± 5.60c | <0.0001 |
Data are expressed as mean ± SD. NC = normal control; TAC = transverse aortic constriction; LVEDd = left ventricular end-diastolic dimension; LVESd = Left ventricular end-systolic dimension; IVSd = interventricularseptal thickness; LVPW = left ventricular posterior wall thickness. All statistical analyses using one-way ANOVA, followed by Bonferroni multiple comparison post hoc test. Letters (a, b, c) indicate significance (at 0.05 level).
Prior to TAC, transthoracic echocardiography showed that the LVEDd, LVEESd, interventricularseptal thickness at diastolic phase (IVSd), LV posterior wall (LVPW) and LVEF did not differ among the three groups. However, by day 28 after the TAC procedure, LVEDd, LVEESd, IVSd and LVPW were significantly increased in TAC and TAC-SS31 groups than in NC but these parameters showed no difference between the former two groups. On the other hand, LVEF displayed an opposite pattern of these parameters among the three groups.
By day 60 after the TAC procedure, the LVEDd still showed an identical pattern of day 28 among the three groups. However, the LVEF were significantly increased in NC group than in TAC and TAC-SS31 groups, and significantly increased in TAC-SS31 group than in TAC group, whereas the LVESd exhibited an opposite pattern of LVEF among the groups. Additionally, the LVPW was significantly increased in TAC only than in NC and TAC-SS31 groups, but it showed no difference between the latter two groups, whereas the IVSd did not differ among the three groups.
Impact of SS31 therapy on attenuating the anatomical and pathological findings of hypertrophic cardiomyopathy by day 60 after TAC procedure (Figure 4)
Figure 4.
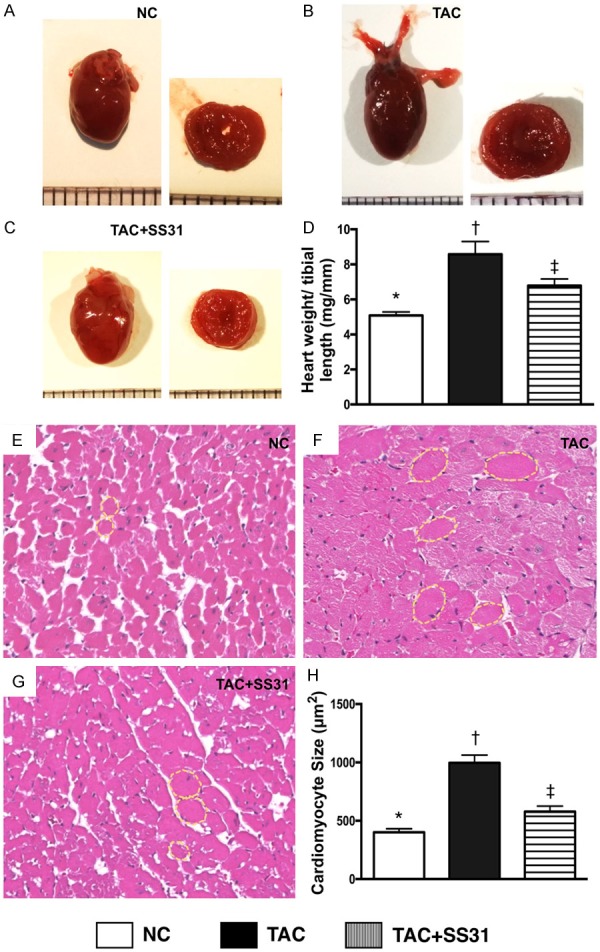
SS31 Treatment attenuated the anatomical and pathological findings of LV hypertrophic cardiomyopathy by day 60 after TAC procedure. A-C. Illustrating gross anatomical findings of the whole heart by day 60 after TAC procedure. Notably, as compared with NC, the whole heart was notably larger in TAC only animals. However, the heart size was notably smaller in TAC animals post SS31 treatment. D. Analytical result of the ratio of total heart weight to tibial length, * vs. other groups with different symbols (†, ‡), P<0.001. E-G. Illustrating H.E. microscopy (400×) for identification of cardiomyocyte size (yellow dotted line). Scale bars in right lower corner represent 50 µm. H. Analytical result of cardiomyocyte size, * vs. other groups with different symbols (†, ‡), P<0.0001. All statistical analyses were performed by one-way ANOVA, followed by Bonferroni multiple comparison post hoc test (n=6 for each group). Symbols (*, †, ‡) indicate significance at the 0.05 level. NC = normal control; TAC = transverse aortic constriction; LV = left ventricular.
The gross anatomical findings demonstrated that, as compared with NC, the whole heart was notably larger in TAC only animals (Figure 4A-C). However, the heart size was notably reduced in TAC animals after receiving SS31 treatment (i.e., TAC-SS31 group).
The ratio of total heart weight to the tibial length was significantly higher in TAC group than in NC group. However, this parameter was significantly reversed in TCA-SS31 group (Figure 4D). Additionally, microscopic findings of H.E. staining showed that as compared with NC, the size of cardiomyocytes was significantly increased in TAC group, but were significantly reduced in the TCA-SS1 group (Figure 4E-H).
Impact of SS31 therapy on reducing fibrosis, cell apoptosis and collagen deposition in left ventricular (LV) myocardium by day 60 after TAC procedure (Figures 5 and 6)
Figure 5.
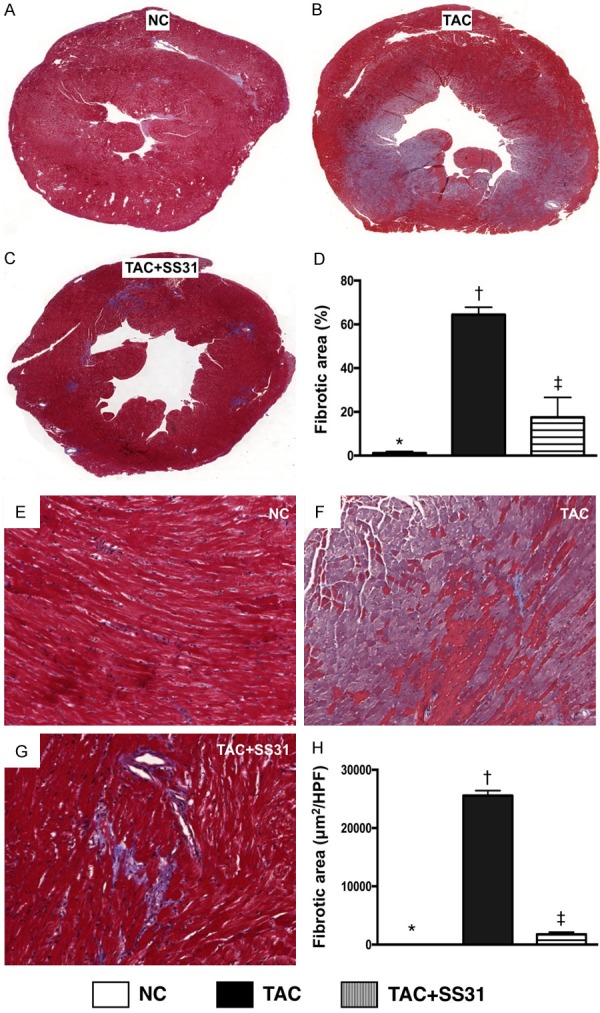
SS31 treatment suppressed the generation of fibrosis by day 60 after TAC procedure. A-C. Masson’s trichrome stain microscopy to identify LV fibrotic area (blue) in whole heart cross section (n=6). D. Analytical result of LV fibrosis area (%), * vs. other groups with different symbols (†, ‡), P<0.0001. E-G. Masson’s trichrome stain microscopy (100×) to identify left ventricular (LV) fibrosis area (blue) through randomized observation sliced LV myocardium (n=6). H. Analytical result of LV fibrosis area (μm2/HPF), * vs. other groups with different symbols (†, ‡), P<0.0001. Scale bars in right lower corner represent 100 µm. All statistical analyses were performed by one-way ANOVA, followed by Bonferroni multiple comparison post hoc test. Symbols (*, †, ‡) indicate significance at the 0.05 level. NC = normal control; TAC = transverse aortic constriction; LV = left ventricular; HPF = high-power field.
Figure 6.
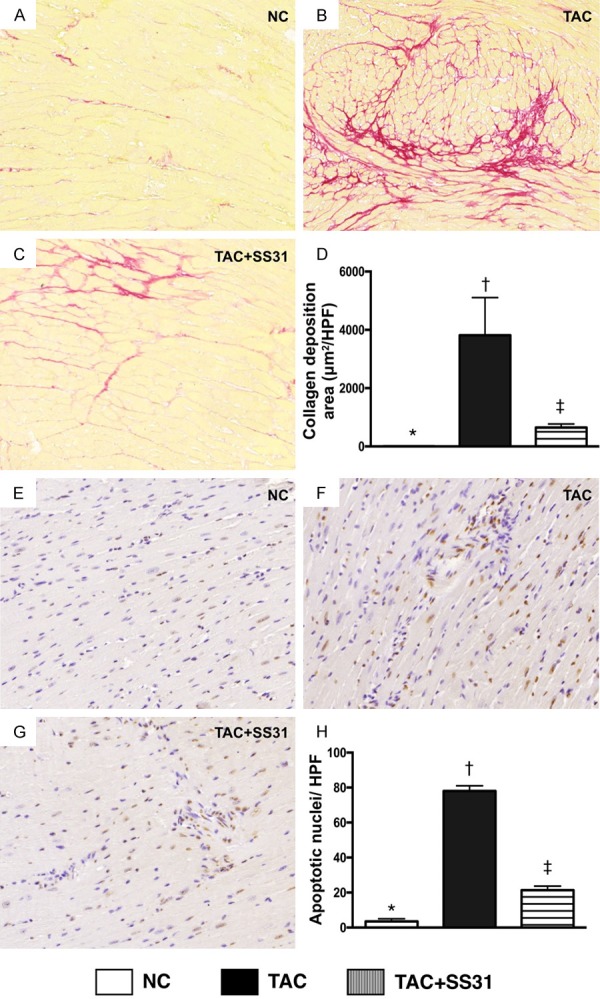
SS31 treatment reduced apoptosis and collagen deposition in LV myocardium by day 60 after TAC procedure. A-C. Sirius red stain microscopy (100×) to identify collagen deposition (red) in LV myocardium. D. Analytical result of the collagen deposition area, * vs. other groups with different symbols (†, ‡), P<0.0001. Scale bars in right lower corner represent 100 µm. E-G. Demonstrating the microscopic findings (200×) of TUNEL assay for identifying the number of apoptotic nuclei (gray) per HPF in LV myocardium. H. Analytic result of number of apoptotic nuclei per HPF, * vs. other groups with different symbols (†, ‡), P<0.0001. Scale bars in right lower corner represent 50 µm. All statistical analyses were performed by one-way ANOVA, followed by Bonferroni multiple comparison post hoc test (n=6 for each group). Symbols (*, †, ‡) indicate significance at the 0.05 level. NC = normal control; TAC = transverse aortic constriction; LV = left ventricular; HPF = high-power field.
Masson’s trichrome staining showed that the fibrotic area was significantly higher in TAC group than in NC group and TAC-SS31 group, and significantly higher in TAC-SS31 group than in the NC group (Figure 5). Additionally, the collagen deposition area, an indicator of myocardial fibrosis and upregulating activity of fibroblast in LV myocardium, showed an identical pattern to fibrosis area among the three groups (Figure 6A-D). Furthermore, the TUNEL assay showed that the number of apoptotic nuclei also showed an identical pattern to fibrosis area among the three groups (Figure 6E-H).
Impact of SS31 therapy on attenuating the disarrangement of the myocardial component (Figure 7)
Figure 7.
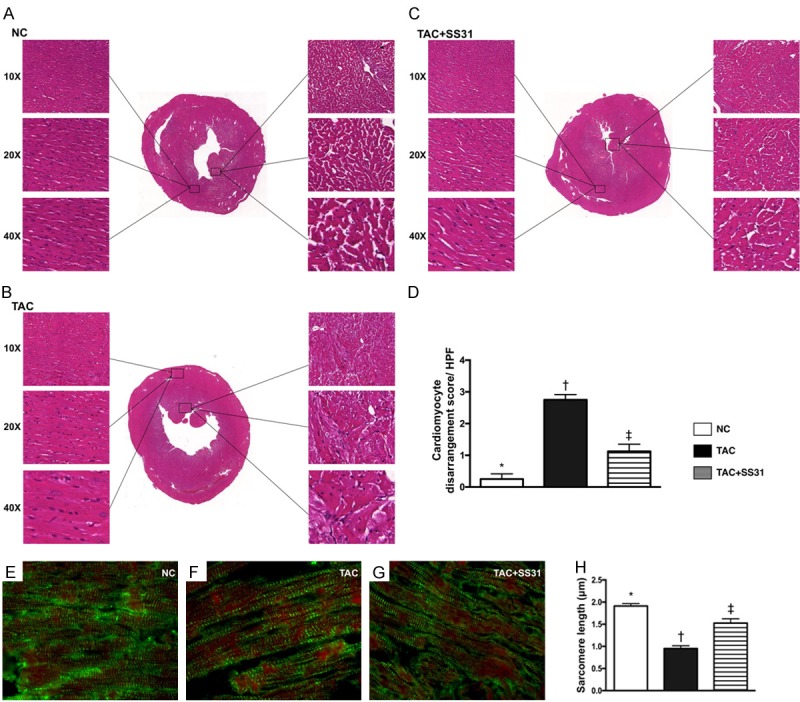
SS31 therapy prevented disorganized endocardial architecture and inhibited sarcomere length shortening by day 60 after TAC procedure. A-C. Showing the microscopic findings (100×, 200×, 400×) of H.E. staining for identifying the integrity of LV endocardial architecture that were remarkably impaired in TAC group than in control group. However, this disarrangement of endocardial layer was notable reversed in TAC animals after receiving SS31 treatment. D. Analytic result of the disarrangement of LV endocardium, * vs. other groups with different symbols (†, ‡), P<0.0001. E-G. Showing the microscopic finding (1000×) of immunofluorescent stain for identifying LV sarcomere length (green striatum). H. Analytical result of LV sarcomere length, * vs. other groups with different symbols (†, ‡), P<0.0001. Scale bars in right lower corner represent 10 µm. All statistical analyses were performed by one-way ANOVA, followed by Bonferroni multiple comparison post hoc test (n=6 for each group). Symbols (*, †, ‡) indicate significance at the 0.05 level. NC = normal control; TAC = transverse aortic constriction; LV = left ventricular.
Microscopic finding (Figure 7A-C) exhibited that, as compared with the NC, the cardiomyocyte architecture in endocardial layer was identified to be significantly disorganized in TAC group (Figure 7D). However, this phenomenon was notably corrected in those of the TCA-SS31 group (Figure 7D).
The IF microscopic finding (Figure 7E-G) displayed that, as compared with the NC group, the sarcomere length of cardiomyocytes was significantly reduced in TAC group (Figure 7H), suggesting cardiomyocyte hypertrophy occurred in the pressure overloaded TCA animals. However, this parameter was signi-ficantly reversed in the TAC-SS31 group (Figure 7H).
Impact of SS31 therapy on attenuating the inflammatory cellular expressions in LV myocardium by day 60 after TAC procedure (Figure 8)
Figure 8.
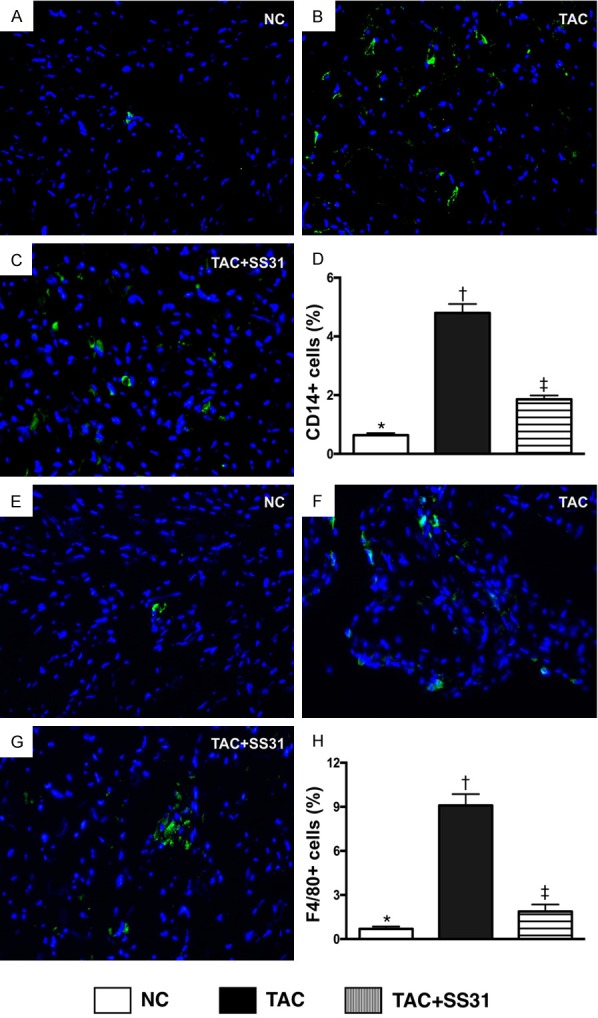
SS31 therapy suppressed inflammatory cell infiltration in LV myocardium by day 60 after TAC procedure. A-C. Microscopic finding (400×) of immunofluorescent (IF) staining for identifying CD14+ cells (green) in LV myocardium. D. Analytic result of number of CD14+ cell infiltration in LV myocardium, * vs. other groups with different symbols (†, ‡), P<0.0001. E-G. Microscopic finding (400×) of immunofluorescent (IF) staining for identifying F4/80+ cells (green) in LV myocardium. H. Analytic result of number of F4/80+ cell infiltration in LV myocardium, * vs. other groups with different symbols (†, ‡), P<0.0001. Scale bars in right lower corner represent 20 µm. All statistical analyses were performed by one-way ANOVA, followed by Bonferroni multiple comparison post hoc test (n=6 for each group). Symbols (*, †, ‡) indicate significance at the 0.05 level. NC = normal control; TAC = transverse aortic constriction; LV = left ventricular.
The IF microscopic findings exhibited that the cellular expressions CD14 (Figure 8A-D) and F4/80 (Figure 8E-H), two indicators of inflammation, were significantly higher in TAC animals than in NC animals and TAC animals treated by SS31, and significantly higher in TAC animals treated by SS31 than in NC animals.
Impact of SS31 therapy on suppressing the oxidative stress in LV myocardium by day 60 after TAC procedure (Figure 9)
Figure 9.
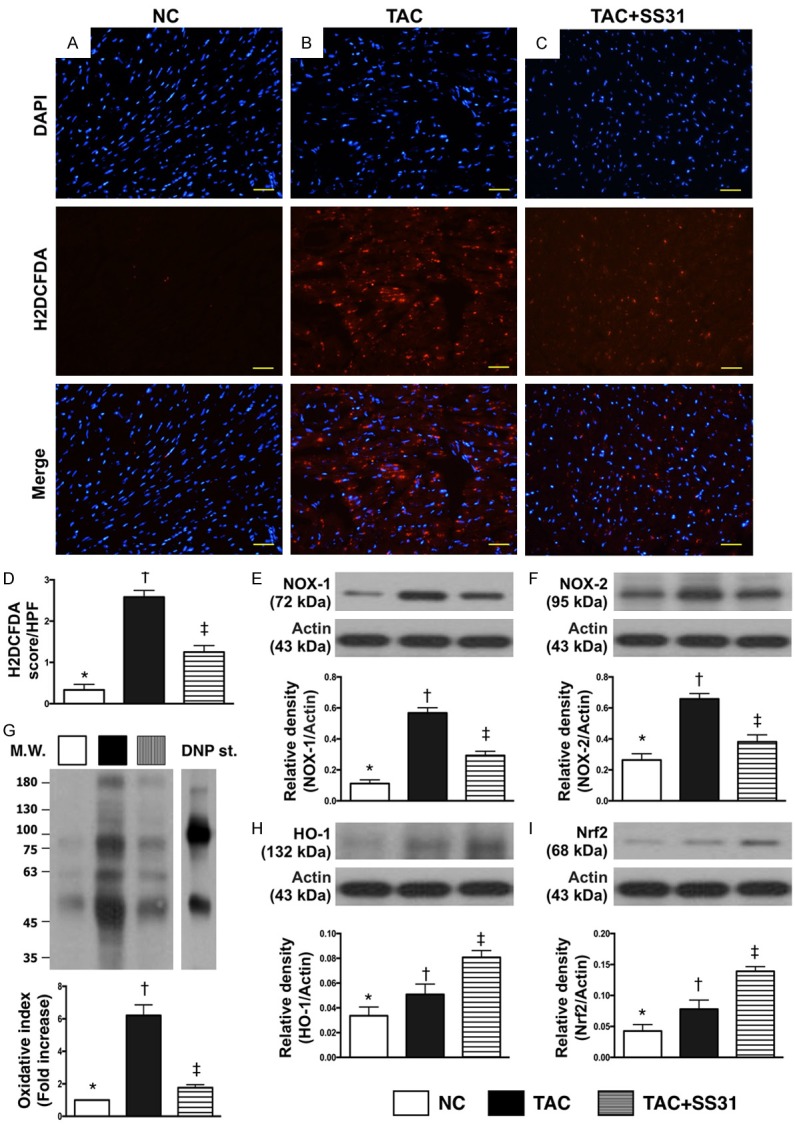
SS31 therapy downregulated the expression of oxidative-stress in LV myocardium by day 60 after TAC procedure. A-C. Microscopic finding (400×) of immunofluorescent staining for identifying H2DCFDA-positively stained cells (red) in LV myocardium. D. Analytic result of number of H2DCFDA+ cell expression in LV myocardium, * vs. other groups with different symbols (†, ‡), P<0.0001. Scale bars in right lower corner represent 20 µm. E. Protein expression of NOX-1, * vs. other groups with different symbols (†, ‡), P<0.0001. F. Protein expression of NOX-2, * vs. other groups with different symbols (†, ‡), P<0.001. G. Oxidized protein expression, * vs. other groups with different symbols (†, ‡), P<0.0001. (Note: left and right lanes shown on the upper panel represent protein molecular weight marker and control oxidized molecular protein standard, respectively). M.W = molecular weight; DNP = 1-3 dinitrophenylhydrazone. H. Protein expression of hemeoxygenase (HO)-1, * vs. other groups with different symbols (†, ‡), P<0.001. I. Protein expression of Nrf2, * vs. other groups with different symbols (†, ‡), P<0.0001. All statistical analyses were performed by one-way ANOVA, followed by Bonferroni multiple comparison post hoc test (n=6 for each group). Symbols (*, †, ‡) indicate significance at the 0.05 level. NC = normal control; TAC = transverse aortic constriction; LV = left ventricular.
The IF microscopic findings displayed that the number of H2DCFDA-positively stained cells was significantly higher in TAC group than in NC group and TAC-SS31 group, and significantly higher in TCA-SS31 group than in NC group (Figure 9A-D). Additionally, the protein expression of NOX-1, NOX-2 and oxidized protein, three indicators of oxidative stress, exhibited an identical pattern of H2DCFDA-positively stained cells among the three groups (Figure 9E-G). However, the protein expressions of HO-1 (Figure 9H) and Nrf2 (Figure 9I), two indicators of antioxidants, were progressively increased from NC to TAC-SS31, indicating an intrinsic response to the pressure overload and oxidative stress in the animals.
Impact of SS31 therapy on inhibiting the protein expressions of fibrosis, apoptosis, and in LV myocardium by day 60 after TAC procedure (Figure 10)
Figure 10.

SS31 therapy inhibited the protein expressions of fibrosis, apoptosis, and inflammation in LV myocardium by day 60 after TAC procedure. A. Protein expression of transforming growth factor (TGF)-β, * vs. other groups with different symbols (†, ‡), P<0.0001. B. Protein expression of phosphorylated (p)-Smad3, * vs. other groups with different symbols (†, ‡, §), P<0.0001. C. Protein expression of cleaved caspase 3 (c-Casp-3), * vs. other groups with different symbols (†, ‡), P<0.001. D. Protein expression of cleaved poly (ADP-ribose) polymerase (c-PARP), * vs. other groups with different symbols (†, ‡), P<0.001. E. Protein expressions of connective tissue growth factor (CTGF), * vs. other groups with different symbols (†, ‡), P<0.0001. F. Protein expression of tumor necrosis factor (TNF)-α, * vs. other groups with different symbols (†, ‡), P<0.0001. G. Protein expression of nuclear factor (NF)-κB, * vs. other groups with different symbols (†, ‡, §), P<0.0001. H. Protein expression of platelet derived growth factor (PDGF), * vs. other groups with different symbols (†, ‡), P<0.0001. I. Protein expression of COX-2, * vs. other groups with different symbols (†, ‡), P<0.0001. All statistical analyses were performed by one-way ANOVA, followed by Bonferroni multiple comparison post hoc test (n=6 for each group). Symbols (*, †, ‡) indicate significance at the 0.05 level. NC = normal control; TAC = transverse aortic constriction; LV = left ventricular.
The protein expressions of TGF-β and Smad3, two indices of apoptosis, were significantly higher in TCA group than in NC and TAC-SS31 groups, and significantly higher in TAC-SS31 group than in NC group. Additionally, the protein expressions of cleaved caspase 3 and cleaved PARP, two indices of apoptosis, showed an identical pattern to fibrosis among the three groups. Furthermore, the protein expressions of CTGF, an indicator of collagen proliferation, showed an identical pattern to apoptosis among the three groups. Moreover, the protein expressions of TNF-α, NF-κB, PDGF and COX-2, four indicators of inflammation, also showed an identical pattern to apoptosis among the three groups.
Impact of SS31 therapy on suppressing pressure overload and mitochondrial damaged biomarkers and signaling of cellular apoptosis (Figure 11)
Figure 11.

SS31 therapy suppressed pressure overload and mitochondrial damage biomarkers and signaling of cellular apoptosis/death in LV myocardium by day 60 after TAC procedure. A. Protein expression of brain natriuretic peptide (BNP), * vs. other groups with different symbols (†, ‡), P<0.001. B. Protein expression of beta myosin heavy chain (β-MHC), * vs. other groups with different symbols (†, ‡), P<0.0001. C. Protein expression of α-MHC, *vs. other groups with different symbols (†, ‡), P<0.0001. D. Protein expression of cytosolic cytochrome C (c-Cyt C), * vs. other groups with different symbols (†, ‡), P<0.0001. E. Protein expression of m-Cyt C, * vs. other groups with different symbols (†, ‡), P<0.001. F. Ratio of phosphorylated (p)-ERK1/2 to total ERK1/2, * vs. other groups with different symbols (†, ‡), P<0.001. G. Ratio of p-Akt to total Akt, * vs. other groups with different symbols (†, ‡), P<0.0001. H. Protein expression of PI3K, * vs. other groups with different symbols (†, ‡), P<0.001. All statistical analyses were performed by one-way ANOVA, followed by Bonferroni multiple comparison post hoc test (n=6 for each group). Symbols (*, †, ‡) indicate significance at the 0.05 level. NC = normal control; TAC = transverse aortic constriction; LV = left ventricular.
The protein expression of BNP and β-MHC, two indicators of volume/pressure overload, were significantly higher in TCA group than in the NC and TAC-SS31 groups, and significantly higher in TAC-SS31 group than in NC group. The protein expression of α-MHC, a negative index of volume/pressure overload, exhibited an opposite pattern to β-MHC among the three groups.
The protein expression of cytosolic cytochrome C, an indicator of mitochondrial damage, showed an identical pattern to BNP among the three groups. Conversely, the protein expression of mitochondrial cytochrome C, an indicator of mitochondrial integrity, displayed an opposite pattern to cytosolic cytochrome C among the three groups.
The protein expressions of phosphorylated (p)-ERK1/2, p-Akt and PI3K, three signaling pathways of cell proliferation and apoptosis showed an identical pattern to cytosolic cytochrome C among the three groups.
Discussion
The common pathological features of HC have been well recognized as heart enlargement, especially in the late stage of CH, an increase in the thickness of LV free wall and IVS as well as LV chamber dilatation, and increases in total heart weight and cardiomyocyte size [1-10,17,21,22]. One important finding in the present study was that, as compared with NC animals, the gross anatomy of heart was identified to be remarkably enlarged and the ratio of total heart weight to tibial length to be significantly increased in TAC animals without treatment. Additionally, the parameters measured by transthoracic echocardiography displayed the HC in TAC animals. Furthermore, protein expressions of BNP and β-MHC were notably increased in the latter than in the former group. Importantly, these pathological findings were reversed in TAC animals after receiving SS31 treatment. Accordingly, our findings not only proved that TAC-induced HC could be successfully created but also displayed effectiveness of SS31 therapy on attenuating CH.
When we looked at the molecular-cellular level of HC, we found that the cardiomyocyte size of LV myocardium was significantly increased in TAC group than in NC group. Additionally, microscopic findings showed that the pathological feature of disorganization of cardiomyocytes in the endomycardial layer became more prominent in TAC animals as compared with NC animals. Furthermore, the fibrotic zone, apoptotic nuclei and collagen-deposition area were substantially increased in TCA animals than in NC. Besides, sarcomere length was markedly shorter in TAC animals than in NC animals, indicating that the relaxation of myofibrils in TCA animals was remarkably impaired. These ultra-structural findings, which were consistent with the findings of our recent reports in an identical setting [21,22], highlighted that the pathological changes of myocardium in HC were extremely complex. Of importance in the present study was that these abnormally distinctive features in LV myocardium were significantly reversed in TAC animals after receiving SS31 treatment.
Interestingly, our recent studies have shown that [21,22] fibrosis and apoptosis were both molecular perturbations to be identified in the setting of HC. An essential finding in the present study was that the protein expressions of apoptotic, collagen-proliferating (i.e., CTGF), fibrotic and mitochondrial damaged biomarkers were significantly higher in TAC group than in NC group. In this way, our findings, in addition to being consistent with the findings of our recent studies [21,22], could partially explain why LVEF was reduced and LV chamber size was remarkably increased in TAC animals. Another essential finding in the present study was that the protein and cellular expressions of oxidative stress were significantly increased, whereas the integrity of mitochondria was impaired in TAC group than in NCs. The intrinsic anti-oxidant capacity was also notably reduced in TAC animals without than with SS31 treatment. Our [21,22] and previous [17] studies have demonstrated that oxidative stress was remarkably enhanced in HC. Accordingly, the findings of the present study, in addition to being comparable with the findings of prior studies [17,21,22], could, at least in part, explain why apoptosis, fibrosis and oxidative stress of LV myocardium were augmented; and once again explain why LV remodeling was enhanced and LV performance was reduced. The present study revealed that SS31 therapy remarkably suppressed these molecular-cellular perturbations.
An association between activation of MAPK family and upregulation of inflammation, cytokine production and cell apoptosis/death has been keenly investigated in setting of ischemia and ischemia-reperfusion injury [25-27]. A principal finding in the present study was that, as compared with NC, the cellular and protein inflammatory biomarkers were significantly enhanced and signaling pathway of ERK1/2, PI3K/Akt were notably upregulated in TAC animals. Our findings, in addition to corroborating the findings of previous studies [25-27], once more explain for why cellular apoptosis, fibrosis and LV myocardium and LV remodeling were remarkably increased, whereas heart function was impaired in TAC animals. These inflammatory and signaling activities were significantly abrogated by SS31 treatment.
Study limitations
This study has limitations. First, despite copious investigations, the true mechanisms for how SS31 treatment protects the heart from TAC injury has not yet been fully identified. However, a previous study has identified that the underlying mechanism of SS31 for suppressing hypertensive cardiomyopathy was mainly through suppressing oxidative stress and protecting the integrity of mitochondria [17] which were identical to our findings. Second, LV end diastolic and LV end systolic blood pressures, as well as the pressure-volume loop, were not measured in the present study. Accordingly, this study did not determine LV compliance in the animals.
In conclusion, SS31 therapy inhibited TAC-induced HC and myocardial damage through multiple signaling pathways.
Acknowledgements
This study was supported by a program grant from Chang Gung Memorial Hospital, Chang Gung University (Grant number: CMRPG8E0331).
Disclosure of conflict of interest
None.
References
- 1.Writing Group Members; Lloyd-Jones D, Adams RJ, Brown TM, Carnethon M, Dai S, De Simone G, Ferguson TB, Ford E, Furie K, Gillespie C, Go A, Greenlund K, Haase N, Hailpern S, Ho PM, Howard V, Kissela B, Kittner S, Lackland D, Lisabeth L, Marelli A, McDermott MM, Meigs J, Mozaffarian D, Mussolino M, Nichol G, Roger VL, Rosamond W, Sacco R, Sorlie P, Roger VL, Thom T, Wasserthiel-Smoller S, Wong ND, Wylie-Rosett J American Heart Association Statistics Committee and Stroke Statistics Subcommittee. Heart disease and stroke statistics--2010 update: a report from the American Heart Association. Circulation. 2010;121:e46–e215. doi: 10.1161/CIRCULATIONAHA.109.192667. [DOI] [PubMed] [Google Scholar]
- 2.Fraccarollo D, Galuppo P, Bauersachs J. Novel therapeutic approaches to post-infarction remodelling. Cardiovasc Res. 2012;94:293–303. doi: 10.1093/cvr/cvs109. [DOI] [PubMed] [Google Scholar]
- 3.Hill JA, Olson EN. Cardiac plasticity. N Engl J Med. 2008;358:1370–1380. doi: 10.1056/NEJMra072139. [DOI] [PubMed] [Google Scholar]
- 4.Heineke J, Molkentin JD. Regulation of cardiac hypertrophy by intracellular signalling pathways. Nat Rev Mol Cell Biol. 2006;7:589–600. doi: 10.1038/nrm1983. [DOI] [PubMed] [Google Scholar]
- 5.Broberg CS, Burchill LJ. Myocardial factor revisited: the importance of myocardial fibrosis in adults with congenital heart disease. Int J Cardiol. 2015;189:204–210. doi: 10.1016/j.ijcard.2015.04.064. [DOI] [PMC free article] [PubMed] [Google Scholar]
- 6.Donekal S, Venkatesh BA, Liu YC, Liu CY, Yoneyama K, Wu CO, Nacif M, Gomes AS, Hundley WG, Bluemke DA, Lima JA. Interstitial fibrosis, left ventricular remodeling, and myocardial mechanical behavior in a population-based multiethnic cohort: the multiethnic study of atherosclerosis (MESA) study. Circ Cardiovasc Imaging. 2014;7:292–302. doi: 10.1161/CIRCIMAGING.113.001073. [DOI] [PMC free article] [PubMed] [Google Scholar]
- 7.Lorell BH, Carabello BA. Left ventricular hypertrophy pathogenesis, detection, and prognosis. Circulation. 2000;102:470–479. doi: 10.1161/01.cir.102.4.470. [DOI] [PubMed] [Google Scholar]
- 8.Hunter JJ, Chien KR. Signaling pathways for cardiac hypertrophy and failure. N Engl J Med. 1999;341:1276–1283. doi: 10.1056/NEJM199910213411706. [DOI] [PubMed] [Google Scholar]
- 9.Kostis JB. From hypertension to heart failure: update on the management of systolic and diastolic dysfunction. Am J Hypertens. 2003;16:18S–22S. doi: 10.1016/s0895-7061(03)00966-x. [DOI] [PubMed] [Google Scholar]
- 10.Badano LP, Albanese MC, De Biaggio P, Rozbowsky P, Miani D, Fresco C, Fioretti PM. Prevalence, clinical characteristics, quality of life, and prognosis of patients with congestive heart failure and isolated left ventricular diastolic dysfunction. J Am Soc Echocardiogr. 2004;17:253–261. doi: 10.1016/j.echo.2003.11.002. [DOI] [PubMed] [Google Scholar]
- 11.Gulati A, Jabbour A, Ismail TF, Guha K, Khwaja J, Raza S, Morarji K, Brown TD, Ismail NA, Dweck MR, Di Pietro E, Roughton M, Wage R, Daryani Y, O’Hanlon R, Sheppard MN, Alpendurada F, Lyon AR, Cook SA, Cowie MR, Assomull RG, Pennell DJ, Prasad SK. Association of fibrosis with mortality and sudden cardiac death in patients with nonischemic dilated cardiomyopathy. JAMA. 2013;309:896–908. doi: 10.1001/jama.2013.1363. [DOI] [PubMed] [Google Scholar]
- 12.Perazzolo Marra M, De Lazzari M, Zorzi A, Migliore F, Zilio F, Calore C, Vettor G, Tona F, Tarantini G, Cacciavillani L, Corbetti F, Giorgi B, Miotto D, Thiene G, Basso C, Iliceto S, Corrado D. Impact of the presence and amount of myocardial fibrosis by cardiac magnetic resonance on arrhythmic outcome and sudden cardiac death in nonischemic dilated cardiomyopathy. Heart Rhythm. 2014;11:856–863. doi: 10.1016/j.hrthm.2014.01.014. [DOI] [PubMed] [Google Scholar]
- 13.Tsutsui H, Kinugawa S, Matsushima S. Mitochondrial oxidative stress and dysfunction in myocardial remodelling. Cardiovasc Res. 2009;81:449–456. doi: 10.1093/cvr/cvn280. [DOI] [PubMed] [Google Scholar]
- 14.Zhao K, Luo G, Giannelli S, Szeto HH. Mitochondria-targeted peptide prevents mitochondrial depolarization and apoptosis induced by tert-butyl hydroperoxide in neuronal cell lines. Biochem Pharmacol. 2005;70:1796–1806. doi: 10.1016/j.bcp.2005.08.022. [DOI] [PubMed] [Google Scholar]
- 15.Whiteman M, Spencer JP, Szeto HH, Armstrong JS. Do mitochondriotropic antioxidants prevent chlorinative stress-induced mitochondrial and cellular injury? Antioxid Redox Signal. 2008;10:641–650. doi: 10.1089/ars.2007.1879. [DOI] [PubMed] [Google Scholar]
- 16.Zhao K, Zhao GM, Wu D, Soong Y, Birk AV, Schiller PW, Szeto HH. Cell-permeable peptide antioxidants targeted to inner mitochondrial membrane inhibit mitochondrial swelling, oxidative cell death, and reperfusion injury. J Biol Chem. 2004;279:34682–34690. doi: 10.1074/jbc.M402999200. [DOI] [PubMed] [Google Scholar]
- 17.Dai DF, Chen T, Szeto H, Nieves-Cintrón M, Kutyavin V, Santana LF, Rabinovitch PS. Mitochondrial targeted antioxidant peptide ameliorates hypertensive cardiomyopathy. J Am Coll Cardiol. 2011;58:73–82. doi: 10.1016/j.jacc.2010.12.044. [DOI] [PMC free article] [PubMed] [Google Scholar]
- 18.Kloner RA, Hale SL, Dai W, Gorman RC, Shuto T, Koomalsingh KJ, Gorman JH rd, Sloan RC, Frasier CR, Watson CA, Bostian PA, Kypson AP, Brown DA. Reduction of ischemia/reperfusion injury with bendavia, a mitochondria-targeting cytoprotective peptide. J Am Heart Assoc. 2012;1:e001644. doi: 10.1161/JAHA.112.001644. [DOI] [PMC free article] [PubMed] [Google Scholar]
- 19.Birk AV, Liu S, Soong Y, Mills W, Singh P, Warren JD, Seshan SV, Pardee JD, Szeto HH. The mitochondrial-targeted compound SS-31 reenergizes ischemic mitochondria by interacting with cardiolipin. J Am Soc Nephrol. 2013;24:1250–1261. doi: 10.1681/ASN.2012121216. [DOI] [PMC free article] [PubMed] [Google Scholar]
- 20.Szeto HH. Mitochondria-targeted cytoprotective peptides for ischemia-reperfusion injury. Antioxid Redox Signal. 2008;10:601–620. doi: 10.1089/ars.2007.1892. [DOI] [PubMed] [Google Scholar]
- 21.Lu HI, Chung SY, Chen YL, Huang TH, Zhen YY, Liu CF, Chang MW, Chen YL, Sheu JJ, Chua S, Yip HK, Lee FY. Exendin-4 therapy still offered an additional benefit on reducing transverse aortic constriction-induced cardiac hypertrophy-caused myocardial damage in DPP-4 deficient rats. Am J Transl Res. 2016;8:778–798. [PMC free article] [PubMed] [Google Scholar]
- 22.Lu HI, Huang TH, Sung PH, Chen Yl, Chua S, Chai HY, Chung SY, Liu CF, Sun CK, Chang HW. Administration of antioxidant peptide SS-31 attenuates transverse aortic constrictioninduced pulmonary arterial hypertension in mice. Acta Pharmacol Sin. 2016;37:589–603. doi: 10.1038/aps.2015.162. [DOI] [PMC free article] [PubMed] [Google Scholar]
- 23.Chen HH, Chen YT, Yang CC, Chen KH, Sung PH, Chiang HJ, Chen CH, Chua S, Chung SY, Chen YL. Melatonin pretreatment enhances the therapeutic effects of exogenous mitochondria against hepatic ischemia-reperfusion injury in rats through suppression of mitochondrial permeability transition. J Pineal Res. 2016;61:52–68. doi: 10.1111/jpi.12326. [DOI] [PubMed] [Google Scholar]
- 24.Chua S, Lee FY, Chiang HJ, Chen KH, Lu HI, Chen YT, Yang CC, Lin KC, Chen YL, Kao GS. The cardioprotective effect of melatonin and exendin-4 treatment in a rat model of cardiorenal syndrome. J Pineal Res. 2016;61:438–456. doi: 10.1111/jpi.12357. [DOI] [PubMed] [Google Scholar]
- 25.Chua S, Chang LT, Sun CK, Sheu JJ, Lee FY, Youssef AA, Yang CH, Wu CJ, Yip HK. Time courses of subcellular signal transduction and cellular apoptosis in remote viable myocardium of rat left ventricles following acute myocardial infarction: role of pharmacomodulation. J Cardiovasc Pharmacol Ther. 2009;14:104–15. doi: 10.1177/1074248409332841. [DOI] [PubMed] [Google Scholar]
- 26.Ortega-Pérez I, Cano E, Were F, Villar M, Vázquez J, Redondo JM. c-Jun N-terminal kinase (JNK) positively regulates NFATc2 transactivation through phosphorylation within the N-terminal regulatory domain. J Biol Chem. 2005;280:20867–20878. doi: 10.1074/jbc.M501898200. [DOI] [PubMed] [Google Scholar]
- 27.Yang CH, Sheu JJ, Tsai TH, Chua S, Chang LT, Chang HW, Lee FY, Chen YL, Chung SY, Sun CK. Effect of tacrolimus on myocardial infarction is associated with inflammation, ROS, MAP kinase and Akt pathways in mini-pigs. J Atheroscler Thromb. 2013;20:9–22. doi: 10.5551/jat.14316. [DOI] [PubMed] [Google Scholar]