

Abstract
Background
Cleft lip with or without cleft palate (CL/P) and cleft palate only (CPO) are common congenital malformations. Numerous epidemiologic studies have shown an increased risk for orofacial clefts among children whose mothers smoked during early pregnancy; however, there is concern that the results of these studies may have been biased because of exposure misclassification. The purpose of this study is to use previous research on the reliability of self-reported cigarette smoking to produce corrected point estimates (and associated credible intervals) of the effect of maternal smoking on children’s risk of clefts.
Methods
We accounted for misclassification using 4 Bayesian models that made different assumptions about the sensitivity and specificity of self-reported maternal smoking data. We used results from previous studies to specify the prior distributions for sensitivity and specificity of reporting and used Markov chain Monte Carlo algorithms to calculate the posterior distribution of the effect of maternal smoking on children’s risk for CL/P and CPO.
Results
After correcting for potential sources of misclassification in data from the National Birth Defects Prevention Study, we found an increased risk of CL/P among children born to mothers who smoked during early pregnancy (posterior odds ratio [OR] =1.6, 95% credible interval = 1.1–2.2). The posterior effect of smoking on CPO provided less evidence of effect (posterior OR = 1.1, 95% credible interval = 0.7–1.7).
Conclusion
Our results lend some credibility to the hypothesis that periconceptional maternal smoking increases the risk of a child being born with CL/P. The results concerning CPO provide no overall evidence of effect, although the estimates were relatively imprecise. We suggest that future research should emphasize validity studies, especially those of differential reporting, rather than replicating existing analyses of the relationship between maternal smoking and clefts. We discuss how our approach is also applicable to evaluating misclassification in a wide range of exposure-outcome scenarios.
Effect estimates in epidemiologic research are subject to bias from confounding, selection bias, and misclassification. Case-control studies are particularly vulnerable to bias from reporting errors. In case-control studies of birth defects, when exposure information is gathered after a birth defect has occurred, the accuracy of maternal recall may depend on the presence of the birth defect. Rich literature has developed in recent years to account and correct for potential biases in the analysis of observational data.1–4 We present a case study for general methods to correct for exposure misclassification.
Orofacial clefts, defined either as cleft lip with or without cleft palate (CL/P) or cleft palate only (CPO), are common congenital malformations that occur in roughly 1.0/1000 births and 0.6/1000 births, respectively.5 Exposures that have been associated with risk for facial clefts include maternal folic acid consumption,6 family history of clefts,7–10 sex of the infant,11,12 maternal age,12–14 maternal education,15 maternal obesity,16 and race.17,18 Numerous epidemiologic studies have shown that cigarette smoking during early pregnancy is also associated with an increased risk of clefts.19–24 A recent meta analysis by Little et al25 showed an increased risk for CL/P (odds ratio [OR] = 1.34, 95% confidence interval = 1.25–1.44) and CPO (1.22 [1.10–1.35]) among children born to women who reported smoking during pregnancy. These modest elevated risks were reasonably homogeneous over 15 studies of CL/P and 13 studies of CPO.
Almost all studies that have examined the relationship between maternal smoking and facial clefts have been case-control designs, with maternal smoking during pregnancy reported following pregnancy. Despite the relatively consistent association with maternal smoking seen across studies, there remains the possibility of differential maternal reporting of smoking status by mothers of infants diagnosed with clefts. Some authors have stated that misclassification by reporting bias is an unlikely explanation for the observed effects25; however, to our knowledge, no attempts have been made to quantify this. We used data from the National Birth Defects Prevention Study and previous research on the reliability of self-reported smoking data to produce point and interval estimates of the effect of maternal smoking on children’s risk of facial clefts, correcting for uncertainty in the validity of self-reported smoking data.
METHODS
Data
The National Birth Defects Prevention Study is a multisite population-based case-control study that began enrolling women with an estimated date of delivery on or after October 1, 1997. The study has been described in detail elsewhere.26,27 Infants with any of more than 30 types of birth defects were eligible for enrollment; we limited our analysis to infants diagnosed with CL/P (bilateral, unilateral, central, or not specified) or CPO. All sites used standard case definitions and clinical review.27,28 In addition to the case review at each site, all infants with a diagnosis of facial clefts were reviewed by a clinical geneticist. Case infants were ascertained from population-based birth defects surveillance systems, and control infants were chosen randomly from all live-born infants within the study area who did not have a congenital defect, and who were selected either from birth certificate files or from delivery logs of birth hospitals. The data in this analysis come from 9 study sites: Arkansas, California, Iowa, Georgia, Massachusetts, New Jersey, New York, North Carolina, and Texas. Telephone interviews were conducted with birth mothers of case and control infants within 2 years after the infants’ estimated date of delivery. The response rates were 76% among mothers of children with CL/P, 75% among mothers of children with CPO, and 69% for controls for this time period in this analysis. Among other questions, mothers were asked about their smoking habits before and during pregnancy. Our main exposure of interest was maternal smoking (yes/no) during the periconceptional period, which we defined as 1 month before becoming pregnant through 3 months after becoming pregnant. We analyzed data from version 5.06 of the dataset, which includes infants born from October 1997 through December 2003. This dataset overlaps considerably with the one used by Honein et al20 in their recent study of facial clefts and maternal smoking, but incorporates 2 additional years of data.
Statistical Methods
We used the directed acyclic graph (DAG) shown in Figure 1 to help guide our model specification. In this DAG, smpre is the unobserved value that a woman would have reported for her periconceptional smoking status had she been asked about her smoking status during the periconceptional period, and smpost is the periconceptional smoking status she reported after giving birth. Z is a vector of possible confounders: maternal age (≤35 years, >35 years), first-degree family history of OFC (yes, no), maternal race and ethnicity (non-Hispanic white, non-Hispanic black, Hispanic, other), any folic acid supplementation in the periconceptional period (yes, no), maternal education (≤12 years, >12 years), maternal obesity prior to index pregnancy (body mass index ≥30, <30), and any alcohol use during the periconceptional period (yes, no). Facial cleft was the outcome of interest; however, in all models we analyzed CL/P and CPO separately because they arise along different etiologic pathways. If we knew smpre, we could have easily estimated its effect through a logistic model, adjusting for confounders Z; however, lacking that information, we needed further assumptions to estimate the effect. We treated smpre as measured with error by smpost and used information from previous research29 on the sensitivity and specificity of self-reported maternal smoking data to produce corrected estimates.
FIGURE 1.
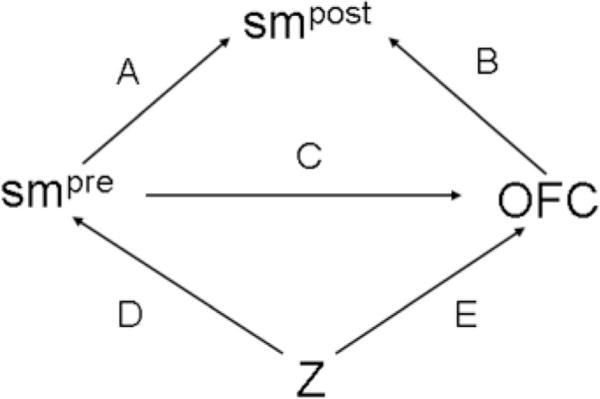
Directed acyclic graph (DAG) illustrating the relationship between women’s self-reported periconceptional smoking status during early pregnancy and late pregnancy and their children’s risk for orofacial clefts. Z is a vector of confounding variables.
We specified 3 regression models to characterize the DAG in Figure 1: an outcome model that specified the probability of facial clefts as a function of smpre (arrow C) and the other covariates, Z (arrow E); a measurement model that specified the probability of smpost as a function of smpre (arrow A) and clefts (arrow B); and an exposure model that specified the probability of smpre as a function of the covariates, Z (arrow D). We estimated these 3 regression models jointly, allowing simultaneous imputation of smpre and estimation of its effect on clefts risks. Exposure misclassification can be handled in frequentist30,31 or Bayesian32–34 inference. We adopted a Bayesian framework35–37 here for both theoretical and pragmatic reasons. From a theoretical perspective, the availability of sensitivity and specificity estimates for self-reports of maternal smoking from previous research argues strongly for a Bayesian approach as outlined by Gustafson et al.38 More pragmatically, the joint estimation of these 3 models would be extremely cumbersome in frequentist inference, and reasonably straightforward in Bayesian inference.
The Outcome Model
We modeled the probability of an infant having an orofacial cleft with a logistic regression conditional on the (unknown) maternal smoking status during the periconceptional period and on potential confounders:
| (1) |
where β1 is the effect of periconceptional smoking, and θ is a vector of effects of the potential confounders in the vector . We note that this model assumes there is no interaction between smoking and other factors, but could be altered to include one. A proper Bayesian analysis required us to place prior distributions on unknown parameters. We used a non-informative N(0,106) (where N(a,b) stands for a normal distribution with mean = a and variance = b) for the prior distribution of the intercept term, and informative priors for other coefficients in the model. We placed informative priors on the remaining parameters in expression (1). These informative priors are intended to express our prior belief regarding the magnitude of the ORs for these variables. Prior studies and expert opinion were used to inform these prior distributions (Table 1). We used a relatively vague prior for the effect of smoking on the risk of clefts because potential misclassification in previous research made it difficult to specify an informative prior. It is important to note that the model specified in expression (1) is for prospective data (such as data from a cohort study) and does not exactly represent the way these case-control data were collected. This could be problematic when the exposure is misclassified; however, Gustafson et al39 provide reassurance that with a large dataset, this misspecification is unlikely to bias results.
TABLE 1.
Prior Odds Ratios (ORs) and 95% Credible Intervals Used in the Outcome Model for Cleft Lip With or Without Palate (CL/P) and Cleft Palate Only (CPO)a
| CL/P Prior OR (Prior 95% Credible Interval) |
CPO Prior OR (Prior 95% Credible Interval) |
|
|---|---|---|
| Report periconceptional smoking | ||
| No | 1.0 | 1.0 |
| Yes | 1.0 (0.1–7.1) | 1.0 (0.1–7.1) |
| Periconceptional folic acid use6 | ||
| No | 1.0 | 1.0 |
| Yes | 0.8 (0.6–1.0) | 1.0 (0.5–2.0) |
| Maternal age (y)12–14 | ||
| <35 | 1.0 | 1.0 |
| ≥35 | 1.0 (0.7–1.5) | 1.3 (1.0–1.7) |
| Family history of OFC7–10 | ||
| No | 1.0 | 1.0 |
| Yes | 15.0 (5.6–40.0) | 15.0 (5.6–40.0) |
| Maternal race/ethnicity17,18 | ||
| Non-Hispanic white | 1.0 | 1.0 |
| Non-Hispanic black | 0.5 (0.4–0.6) | 0.7 (0.5–0.9) |
| Hispanic | 0.9 (0.5–1.5) | 0.8 (0.6–1.0) |
| Other | 1.0 (0.5–2.0) | 1.0 (0.5–2.0) |
| Gravidity | ||
| Primigravid | 1.0 | 1.0 |
| Multigravid | 1.0 (0.5–2.0) | 1.0 (0.5–2.0) |
| Obese16 | ||
| No | 1.0 | 1.0 |
| Yes | 1.3 (0.9–1.9) | 1.2 (0.8–1.7) |
| Maternal education | ||
| ≤12 y | 1.0 | 1.0 |
| >12 y | 1.0 (0.5–2.0) | 1.0 (0.5–2.0) |
| Periconceptional alcohol use | ||
| No | 1.0 | 1.0 |
| Yes | 1.0 (0.5–2.0) | 1.0 (0.5–2.0) |
Some of the relevant studies used to help inform prior knowledge are indicated in superscripts.
Exposure Model
In addition to placing prior distributions on the coefficients in expression (1), we also placed a prior distribution on the unknown variable smpre. The exposure model accomplishes this by expressing the probability of reporting periconceptional smoking when asked during early pregnancy as a function of the predictors in . This model allowed us to account for differences in smoking probability among various groups of women.
| (2) |
Here, ω is a vector of the effects of the predictors in , and ω0 is the intercept. The outcome is reported smoking status in the periconceptional period, which is not commonly observed in studies. This makes it difficult to use the results of previous studies to inform priors for parameter estimates. We placed N(0,1) priors on coefficients in this model, implying we are 95% certain the true OR relating any exposure with reported periconceptional smoking status lies between, roughly, OR = 1/7 and OR = 7. Additional prior specifications are considered in the eAppendix (available in the online version of this article).
Measurement Model
The last of the 3 regression models is the measurement model, in which the probability that a woman reports periconceptional smoking after delivery, , depends on her smoking status during the periconceptional period and whether her child was diagnosed with a cleft. Notice that because may depend on the outcome, we are allowing for differential misclassification:
| (3) |
The parameters in expression (3) correspond to the sensitivity and false-positive rate (FPR, or 1-specificity) of reported maternal smoking among case and control mothers. The probability of reporting smoking after delivery is separated into mutually exclusive components depending on case/control status and maternal report of smoking: α0 is the sensitivity of reported smoking among control mothers, α1 is the FPR among control mothers, α2 is the sensitivity among case mothers, and α3 is the FPR among case mothers. We used the exposure model and the measurement model to impute values of smpre in a manner analogous to that used with missing data techniques; we then used those imputed values to estimate the effect of periconceptional smoking on children’s OFC risk. The data, however, contain little information about the 4 parameters in the measurement model, so prior specification for these parameters can have a large impact on inference.
To examine the impact that misclassification might have had on the effect of smoking and clefting risk, we implemented 4 models that specify α0, α1, α2, and α3 in the measurement model by using different prior distributions. Model 1, our reference model, is based on the assumption that the periconceptional smoking status reported by women after their delivery is the same as what they would have reported had they been asked during their periconceptional period. In terms of the measurement model specified previously, this translates into the assumption that α0 = α2 = 1, and (1 − α1) = (1 − α3) = 1. With the parameters in expression (3) fixed at , the outcome model (1) simplifies to:
Combined with the priors for β0, β1, and θ outlined previously, this is a standard Bayesian logistic regression model.
Model 2 is based on the assumption that women’s smoking was differentially misclassified but the amount of the misclassification is known with certainty. The corrections made in analyses based on this model are roughly equivalent to common corrections for misclassification seen in the epidemiologic literature.40 It has been shown that such an approach can be highly sensitive to even small discrepancies between the assumed and actual values of sensitivity and specificity.38,41 There are few data on the reporting of maternal smoking during pregnancy that could help us quantify the sensitivity and specificity of self-reported smoking data for case and control subjects. We are aware of no studies that provide information on accuracy of smoking reporting among mothers of infants with clefts and only 1 study that provides information on accuracy of smoking reporting among mothers of infants with congenital malformations.29 In that study, conducted in the Netherlands in 1978 and 1979, women were asked about their smoking status at approximately the 18th week of gestation and again following delivery. Congenital malformations were found in 40 infants, allowing rather imprecise estimates of sensitivity and specificity to be generated for case mothers, whereas 2320 infants were born at term without any malformation, allowing more precise estimates of sensitivity and specificity among control mothers. The parameters we specified in the measurement model (3) were equal to the maximum likelihood estimates of sensitivity and FPR (among case and control mothers) estimated from data reported in this article: α0 = 0.91, α1 = 0.06, α2 = 0.94, and α3 = 0.09.
Model 3 is based on the assumption that the sensitivities and FPRs used in the measurement model (2) are unknown (rather than constant and known with certainty) and reflects concern about using even slightly inaccurate values of sensitivity and specificity to correct for misclassification. Because sensitivities and FPRs must fall between 0 and 1, a natural choice for a prior distribution is a beta distribution, which gives support only to values between 0 and 1. The beta distribution is defined by 2 parameters, b1 and b2, and has a mean of b1/(b1 + b2). The parameters b1 and b2 can be interpreted as the number of “successes” and “failures” in some trial, respectively. For sensitivities, b1 is the number of women who report smoking after delivery and in early pregnancy and b2 is the number of women who report not smoking after delivery but report smoking in early pregnancy. For FPRs, b1 is the number of women who report smoking after delivery but not during early pregnancy, and b2 is the number of women who report not smoking after delivery and not smoking during early pregnancy. The prior distributions for sensitivity and FPR among case and control mothers that we use in Model 3 are shown in Figure 2. Because of the difference in the number of case and control mothers in the validation study (40 versus 2320), the estimates of sensitivity (mean = 0.91, 95% CI = 0.89–0.93) and FPR (mean = 0.06, 95% CI = 0.04–0.07) among control mothers were more precise than the estimates of sensitivity (mean = 0.94, 95% CI = 0.81–1.0) and FPR (mean = 0.09, 95% CI = 0.01–0.24) among case mothers. We present analyses in the eAppendix using different prior specifications.
FIGURE 2.
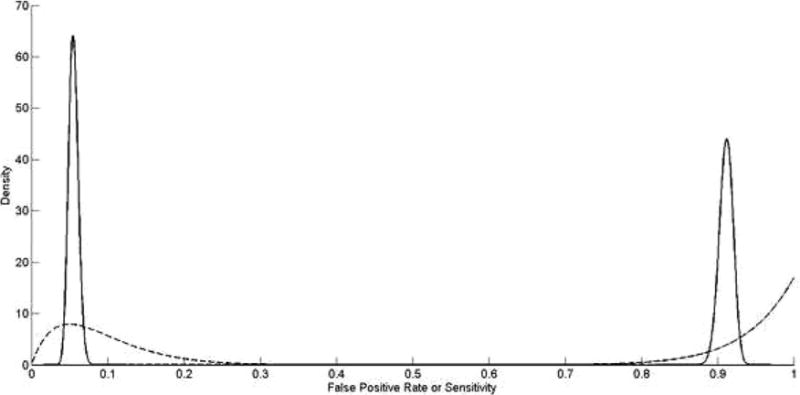
Prior distribution for sensitivity (right half of plot) and 1-specificity (left half of plot) in cases (dashed line) and controls (solid line) for report of maternal smoking, based on estimates from Verkerk et al.29
In Models (1), (2), and (3), we use data from previous studies on maternal reporting of smoking to impute values of a woman’s smoking status during the periconceptional period. The gold standard used in the previous studies was self-report of smoking during early pregnancy. Additional reporting bias is possible, however, and self-report during early pregnancy may not be an accurate description of a woman’s true smoking status. In particular, women who smoke during early pregnancy may underreport their smoking. This may be the reason for the surprisingly low specificities observed in previous research29: women who reported not smoking during early pregnancy but who did report smoking later during their pregnancy may have truly smoked during the periconceptional period but did not accurately report it. In this scenario, as depicted in Figure 3, an additional measurement model must be specified for the probability of reporting smoking during the periconceptional period given true smoking status (arrow F). Previous studies have examined the validity of women’s self-reported smoking status during pregnancy by comparing their reported status with levels of cotinine found in their blood or urine.42–45 Two of these studies collected data in the 1960s and 2 in the 1990s. Because estimates of sensitivity and specificity in the 4 studies were very similar, we pooled the data from the 4 studies to generate a single estimate. The pooled FPR estimate indicates that women who were truly not smokers rarely reported that they were (mean = 0.02, 95% CI = 0.02–0.03), whereas the pooled sensitivity estimate indicates that some women who did smoke reported that they did not (mean = 0.92, 95% CI = 0.91–0.93). In Model 4 we combine the outcome, exposure, and measurement models we defined in Model 3 with an additional measurement model that corrects for response bias:
| (4) |
FIGURE 3.
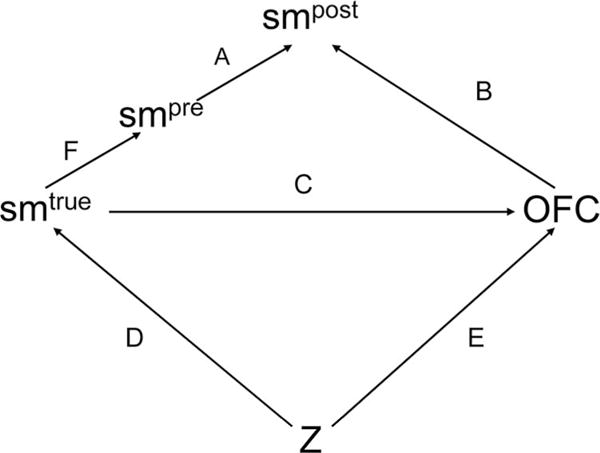
Directed acyclic graph (DAG) illustrating the relationship between women’s true smoking status, self-reported periconceptional smoking status during early pregnancy and late pregnancy, and their children’s risk for facial clefts. Z is a vector of confounding variables,
Here, γ0 is the sensitivity of reported smoking, and γ1 is the FPR. In contrast to the measurement model in expression (3), this one is nondifferential. We placed beta priors on the sensitivity and FPR in this model, with parameters corresponding to the pooled estimates described previously.
We performed a number of sensitivity analyses to judge the influence of our prior assumptions in the exposure and measurement models. We also performed additional analyses examining the effect of maternal smoking on isolated clefts (those having no additional major defects) and multiple defects (major unrelated defects in 2 or more different organ systems); these are shown in the eAppendix. We fit all models using Markov chain Monte Carlo (MCMC) algorithms in OpenBUGS and R.46,47 The code needed to fit these models is also shown in the eAppendix. MCMC algorithms were run for 20,000 iterations, with the first 1000 iterations excluded as a burn-in period. We ran multiple chains from different initial positions and visually examined trace plots to monitor convergence. Following the burn-in period, the iterations of the MCMC algorithm are random draws from the posterior distributions of interest. The median of these random draws was exponentiated to obtain the posterior OR of interest, and the 2.5th and 97.5th percentiles of the random draws were exponentiated to obtain posterior credible intervals.
RESULTS
The National Birth Defects Prevention Study enrolled 6909 infants who met our case and control definitions (4874 controls, 1323 with CL/P, and 712 with CPO). As shown in Table 2, control mothers were less likely to be non-Hispanic white and less likely to report a family history of clefts than mothers of infants with either CL/P or CPO. The observed ORs in Table 2 are consistent with the prior specification in Table 1.
TABLE 2.
Demographic Characteristics of Mothers of National Birth Defects Prevention Study Infants With Orofacial Clefts (OFC) and Those With No Major Birth Defects (Controls), 1997–2003
| Controls n = 4874 Count (%) | CL/P n = 1323 Count (%) | OR (95% CI) | CPO n = 712 Count (%) | OR (95% CI) | |
|---|---|---|---|---|---|
| Reported periconceptional maternal smoking | |||||
| No | 3899 (80) | 975 (74) | 1 | 539 (76) | 1 |
| Yes | 949 (20) | 340 (26) | 1.4 (1.2–1.7) | 169 (24) | 1.3 (1.1–1.6) |
| Periconceptional folic acid use | |||||
| No | 2417 (50) | 697 (53) | 1 | 349 (49) | 1 |
| Yes | 2442 (50) | 620 (47) | 0.9 (0.8–1.0) | 361 (51) | 1.0 (0.9–1.2) |
| Maternal age | |||||
| <35 | 4193 (86) | 1145 (87) | 1 | 587 (82) | 1 |
| ≥35 | 681 (14) | 178 (13) | 1.0 (0.8–1.1) | 125 (18) | 1.3 (1.1–1.6) |
| First degree family history of OFC | |||||
| No | 4857 (100) | 1246 (94) | 1 | 671 (94) | |
| Yes | 17 (0) | 77 (6) | 17.7 (10.4–30.0) | 41 (6) | 17.5 (9.9–30.9) |
| Maternal race/ethnicity | |||||
| Non-Hispanic white | 2894 (59) | 821 (62) | 1 | 483 (68) | 1 |
| Non-Hispanic black | 586 (12) | 80 (6) | 0.5 (0.4–0.6) | 47 (7) | 0.5 (0.4–0.7) |
| Hispanic | 1113 (23) | 340 (26) | 1.1 (0.9–1.2) | 135 (19) | 0.7 (0.6–0.9) |
| Other | 269 (6) | 81 (6) | 1.1 (0.8–1.4) | 46 (6) | 1.0 (0.7–1.4) |
| Gravidity | |||||
| Primigravid | 1420 (29) | 418 (32) | 1 | 208 (29) | 1 |
| Multigravid | 3445 (71) | 900 (68) | 0.9 (0.8–1.0) | 503 (71) | 1.0 (0.8–1.2) |
| Prepregnancy obesity (maternal body mass index ≥30) | |||||
| No | 3953 (85) | 1060 (84) | 1 | 567 (82) | 1 |
| Yes | 714 (15) | 205 (16) | 1.1 (0.9–1.3) | 123 (18) | 1.2 (1.0–1.5) |
| Maternal Education | |||||
| >12 y | 2792 (58) | 651 (50) | 1 | 406 (57) | 1 |
| ≤12 y | 2042 (42) | 662 (50) | 1.4 (1.2–1.6) | 301 (43) | 1.0 (0.9–1.2) |
| Periconceptional alcohol use | |||||
| No | 2963 (61) | 792 (60) | 1 | 411 (58) | 1 |
| Yes | 1865 (39) | 519 (40) | 1.0 (0.9–1.2) | 294 (42) | 1.1 (1.0–1.3) |
The 4 models, run separately for CL/P and CPO, converged relatively quickly. Posterior ORs and 95% credible intervals are shown in Table 3. Model 1, which did not correct for exposure misclassification, indicated a slight increased risk for CL/P and CPO among children of mothers who reported periconceptional smoking. Estimates from Model 2, which corrected for misclassification but treated the sensitivity and specificity of misclassification as known with certainty were shifted toward the null. Estimates from Model 3, which treated the sensitivity and specificity as unknown, had wider credible intervals and showed a greater association between maternal smoking and CL/P risk than the estimates from Model 2, but a similar association between maternal smoking and CPO risk. Estimates from Model 4, which incorporated additional information on self-reported smoking relative to cotinine levels were similar to those from Model 3.
TABLE 3.
Results of Bayesian Correction of Maternal Smoking in Estimating the Association Between Maternal Smoking and Children’s Risk for Oral Clefts, National Birth Defects Preventions Study, 1997–2003
| Model | Model Assumptions for Misclassification | CL/P ORa (95% Credible Interval) | CPO ORa (95% Credible Interval) |
|---|---|---|---|
| 1 | No misclassification | 1.3 (1.1–1.6) | 1.2 (1.0–1.5) |
| 2 | Misclassification with known sensitivity and specificity with maternal report as gold standard | 1.2 (0.9–1.5) | 1.0 (0.7–1.3) |
| 3 | Prior distributions on sensitivity and specificity, with maternal report as gold standard | 1.5 (1.1–2.1) | 1.1 (0.7–1.6) |
| 4 | Prior distributions on sensitivity and specificity, with cotinine levels used as gold standard | 1.6 (1.1–2.2) | 1.1 (0.7–1.7) |
OR is the posterior odds ratio.
Results of sensitivity analyses shown in the eAppendix indicated that varying the assumptions regarding prior distributions of coefficients in the outcome or exposure model did not result in any substantial changes to inference. Varying the prior distributions for the FPR and sensitivity resulted in wider posterior credible intervals but little change in posterior ORs.
DISCUSSION
After accounting for smoking misclassification, we found an increased risk for CL/P among infants of mothers who smoked during the periconceptional period. The effect of maternal periconceptional smoking on children’s CPO risk was less clear, with a posterior effect near the null but imprecise credible intervals.
Model 1 was a standard Bayesian logistic regression that assumed perfect sensitivity and specificity of maternal reporting. This model produced effect estimates of periconceptional maternal smoking on children’s risk for CL/P and CPO that were very similar to meta-analysis estimates by Little et al.25 The large size of our dataset ensured estimates were robust to prior specification for this model (see eAppendix); our results using the first Bayesian model were virtually identical to the frequentist results reported by Honein et al.20 Model 2, which corrected for maternal reporting bias by treating sensitivity and specificity as known constants, resulted in smaller estimated effects. The sensitivities and specificities we specified would be expected to produce differential misclassification away from the null, so corrected estimates will naturally move toward the null. In these data, the combination of lower specificity among cases than controls resulted in a relative surplus of infants categorized as exposed cases.
Model 3, which allowed sensitivities and specificities to be unknown, produced posterior effect estimates that were larger than those produced by Model 2. When uncertainty in maternal reporting was accounted for in this model, there was still evidence that periconceptional smoking had an effect on CL/P; however, there was far less evidence of an effect of smoking on CPO.
It is interesting to note that Model 3 resulted in different estimates for CL/P than Model 2. Because Model 2 treats sensitivities and specificities as known with certainty, the posterior values for the sensitivity and specificity parameters will always be identical to their priors: no amount of data can change them. Sensitivities and specificities in Model 3, on the other hand, adapt in light of the data. Many of the variables in Z are predictive of maternal smoking, and these variables were used to impute the unobserved periconceptional smoking status for each woman. The sensitivity and specificity parameters were then updated in light of how well these imputed variables corresponded to observed smoking status. Among mothers of infants with CL/P, the data imply smoking is reported more accurately than our prior indicated. In fact, the posterior distribution for specificity among cases had a mean of 0.96 and 95% credible intervals (0.93–0.99) that did not include the fixed estimate of 0.91 used in Model 2. The results for CPO were somewhat similar to those in Model 2 because, due to the smaller sample size of CPO cases, the posterior distribution of sensitivity and specificity was not very different from the priors and still centered near the values used for correction in Model 2. Estimates from Model 4 are largely unchanged relative to Model 3. In some of the additional analyses presented in the eAppendix, the additional uncertainty incorporated in Model 4 produces somewhat more imprecise credible intervals. The effect of maternal smoking on children’s risk for CL/P produced by Model 4 was quite similar to that found in one cohort study, although estimates of the association between smoking and CPO risk were somewhat different.48 A more recent cohort study with very little misclassification of maternal smoking, published while our paper was in press, found very similar results to ours.49
The study we used to help quantify the sensitivity and specificity of self-reported smoking status among case and control mothers is not ideal (nor is the additional study we include in the eAppendix). It was not conducted in a population similar to that participating in National Birth Defects Prevention Study or collected in the same decade. Given the divergent and changing attitudes toward smoking over time and in different countries, it is not clear how well the sensitivities and specificities in the study we used mimic those that would have been found in our source population. Additionally, the time between delivery and the postpregnancy interview was typically shorter in that study than in our data. For these reasons, Models 3 and 4 (which assume the effect estimate is not known with certainty) are particularly appealing. A typical analysis of these data would assume perfect recall (as in Model 1), and underestimate our true uncertainty of the effect of smoking on risk of clefts. Our ability to introduce uncertainty about the accuracy of recall and have that uncertainty reflected in the posterior ORs and credible intervals is a major benefit of this approach. Furthermore, we assumed that all variables in our model, other than smoking, were measured without error; we did not consider other types of errors that may also bias results. For example, we cannot rule out selection bias as a possible source of error if, for instance, case mothers who smoked during the periconceptional period were more likely to enroll than nonsmoking case mothers, or if maternal smoking had a selective impact on embryonic and fetal survival. The models we propose, however, could easily be adapted to incorporate this information if there were reasonable prior values.
Whether periconceptional smoking has an effect on the risk of facial clefts is not likely to be solved with further case-control studies, at least not without significant modification in how and what data are collected. In any event, extensive simulation studies would be needed to evaluate power in complicated settings such as the one we considered, although results and some formulae are provided for simpler settings of exposure misclassification in Gustafson.50 The estimates from Model 1 (in which misclassification is ignored) are precise; however, the width of the credible intervals about the estimates nearly doubled when we accounted for misclassification. The imprecision of these effects is partially due to our lack of information about the validity of maternal self-report of smoking during pregnancy; future studies focusing on the validity of maternal reporting (especially in relation to case status) would have a large impact in decreasing the uncertainty of these effects.
We have focused on a particularly interesting example, the effect of periconceptional maternal smoking on risk of facial clefts. Recall bias or differential misclassification represents a common concern in birth defects and pediatric epidemiology, but this scenario has broader applicability.
Results of numerous case-control studies have shown that maternal smoking during pregnancy is associated with an increased risk for of clefts; however, the interpretation of these effects is difficult due to the possible presence of reporting bias. The models we present correct for reporting bias and lend some support to the hypothesis that periconceptional smoking is associated with an increased risk for CL/P. The results concerning CPO are more mixed with little overall evidence of effect but less precise estimates.
These methods have broad applicability in other misclassification settings as well. The general strategy of specifying an exposure, measurement, and outcome model based on a DAG and jointly estimating modes in BUGS should be transportable to other studies. Clearly, misclassification can occur in prospective as well as retrospective studies and some alterations of the DAG may be necessary for these studies. For instance, arrow B in Figures 1 and 2 would not typically be present when the exposure measurement is made prior to the occurrence of the outcome. However, only minor modification of the code provided in the appendix would be necessary to run these models in other settings. Care should always be taken when specifying prior distributions. Insufficiently informative priors in either the exposure model or the measurement model may lead to poorly behaved MCMC algorithms. Generally speaking, the further the sensitivities and specificities are from 1.0, the greater the difference between the crude and adjusted OR could be. Furthermore, if a great deal is known about the sensitivity and specificity of recall, the results of Model 3 (or Model 4) will not differ much from the results of Model 2. Conversely, as the uncertainty regarding recall increases, Models 3 and 4 (which propagate that uncertainty through the model) will be particularly appealing.
Supplementary Material
Acknowledgments
We thank Joanna Smith for programming support and Ruby Nguyen and David Dunson for helpful comments on an earlier version of this paper.
The findings and conclusions in this report are those of the authors and do not necessarily represent the views of the Centers for Disease Control and Prevention.
Supported in part by the Intramural Research Program of the NIH, National Institute of Environmental Health Sciences and by grants from the Centers for Disease Control and Prevention (U50/CCU422096) and the National Institute of Environmental Health Sciences (P30ES10126).
Footnotes
The first author completed much of this work while in the Biostatistics Branch at the National Institute of Environmental Health Sciences, Research Triangle Park, NC.
Supplemental material for this article is available with the online version of the journal at www.epidem.com; click on “Article Plus.”
References
- 1.Steenland K, Greenland S. Monte Carlo sensitivity analysis and Bayesian analysis of smoking as an unmeasured confounder in a study of silica and lung cancer. Am J Epidemiol. 2004;160:384–392. doi: 10.1093/aje/kwh211. [DOI] [PubMed] [Google Scholar]
- 2.Lash TL, Fink AK. Semi-automated sensitivity analysis to assess systematic errors in observational data. Epidemiology. 2003;14:451–458. doi: 10.1097/01.EDE.0000071419.41011.cf. [DOI] [PubMed] [Google Scholar]
- 3.Greenland S. Multiple-bias modelling for analysis of observational data. J Royal Stat Soc A. 2005;168:267–306. [Google Scholar]
- 4.Eddy DM, Hasselblad V, Shachter RD. Meta-analysis by the confidence profile method: the statistical synthesis of evidence Statistical modeling and decision science. Boston: Academic Press; 1992. [Google Scholar]
- 5.Canfield MA, Honein MA, Yuskiv N, et al. National estimates and race/ethnic-specific variation of selected birth defects in the United States, 1999–2001. Birth Defects Res A Clin Mol Teratol. 2006;76:747–756. doi: 10.1002/bdra.20294. [DOI] [PubMed] [Google Scholar]
- 6.Wilcox AJ, Lie RT, Solvoll K, et al. Folic acid supplements and risk of facial clefts: national population based case-control study. Bmj. 2007;334:464. doi: 10.1136/bmj.39079.618287.0B. [DOI] [PMC free article] [PubMed] [Google Scholar]
- 7.Bixler D, Fogh-Andersen P, Conneally PM. Incidence of cleft lip and palate in the offspring of cleft parents. Clin Genet. 1971;2:155–159. doi: 10.1111/j.1399-0004.1971.tb00271.x. [DOI] [PubMed] [Google Scholar]
- 8.Itikala PR, Watkins ML, Mulinare J, et al. Maternal multivitamin use and orofacial clefts in offspring. Teratology. 2001;63:79–86. doi: 10.1002/1096-9926(200102)63:2<79::AID-TERA1013>3.0.CO;2-3. [DOI] [PubMed] [Google Scholar]
- 9.Silvertsen A, Wilcox A, Skjaerven R, et al. Familial risk of oral clefts by morphological type and severity: population based cohort study of first-degree relatives. Br Med J. 2008;336:432–434. doi: 10.1136/bmj.39458.563611.AE. [DOI] [PMC free article] [PubMed] [Google Scholar]
- 10.Tolarova M. Orofacial clefts in Czechoslovakia. Incidence, genetics and prevention of cleft lip and palate over a 19-year period. Scand J Plast Reconstr Surg Hand Surg. 1987;21:19–25. doi: 10.3109/02844318709083574. [DOI] [PubMed] [Google Scholar]
- 11.Czeizel A, Tusnadi G. An epidemiologic study of cleft lip with or without cleft palate and posterior cleft palate in Hungary. Hum Hered. 1971;21:17–38. doi: 10.1159/000152380. [DOI] [PubMed] [Google Scholar]
- 12.Harville EW, Wilcox AJ, Lie RT, et al. Epidemiology of cleft palate alone and cleft palate with accompanying defects. Eur J Epidemiol. 2007;22:389–395. doi: 10.1007/s10654-007-9129-y. [DOI] [PubMed] [Google Scholar]
- 13.Harville EW, Wilcox AJ, Lie RT, et al. Cleft lip and palate versus cleft lip only: are they distinct defects? Am J Epidemiol. 2005;162:448–453. doi: 10.1093/aje/kwi214. [DOI] [PubMed] [Google Scholar]
- 14.Forrester MB, Merz RD. Descriptive epidemiology of oral clefts in a multiethnic population, Hawaii, 1986–2000. Cleft Palate Craniofac J. 2004;41:622–628. doi: 10.1597/03-089.1. [DOI] [PubMed] [Google Scholar]
- 15.Carmichael SL, Nelson V, Shaw GM, et al. Socio-economic status and risk of conotruncal heart defects and orofacial clefts. Paediatr Perinat Epidemiol. 2003;17:264–271. doi: 10.1046/j.1365-3016.2003.00498.x. [DOI] [PubMed] [Google Scholar]
- 16.Cedergren M, Kallen B. Maternal obesity and the risk for orofacial clefts in the offspring. Cleft Palate Craniofac J. 2005;42:367–371. doi: 10.1597/04-012.1. [DOI] [PubMed] [Google Scholar]
- 17.Yazdy MM, Honein MA, Xing J. Reduction in orofacial clefts following folic acid fortification of the U.S. grain supply. Birth Defects Res A Clin Mol Teratol. 2007;79:16–23. doi: 10.1002/bdra.20319. [DOI] [PubMed] [Google Scholar]
- 18.DeRoo LA, Gaudino JA, Edmonds LD. Orofacial cleft malformations: associations with maternal and infant characteristics in Washington State. Birth Defects Res A Clin Mol Teratol. 2003;67:637–642. doi: 10.1002/bdra.10114. [DOI] [PubMed] [Google Scholar]
- 19.Honein MA, Paulozzi LJ, Watkins ML. Maternal smoking and birth defects: validity of birth certificate data for effect estimation. Public Health Rep. 2001;116:327–335. doi: 10.1016/S0033-3549(04)50054-7. [DOI] [PMC free article] [PubMed] [Google Scholar]
- 20.Honein MA, Rasmussen SA, Reefhuis J, et al. Maternal smoking and environmental tobacco smoke exposure and the risk of orofacial clefts. Epidemiology. 2007;18:226–233. doi: 10.1097/01.ede.0000254430.61294.c0. [DOI] [PubMed] [Google Scholar]
- 21.Khoury MJ, Gomez-Farias M, Mulinare J. Does maternal cigarette smoking during pregnancy cause cleft lip and palate in offspring? Am J Dis Child. 1989;143:333–337. doi: 10.1001/archpedi.1989.02150150091023. [DOI] [PubMed] [Google Scholar]
- 22.Khoury MJ, Weinstein A, Panny S, et al. Maternal cigarette smoking and oral clefts: a population-based study. Am J Public Health. 1987;77:623–625. doi: 10.2105/ajph.77.5.623. [DOI] [PMC free article] [PubMed] [Google Scholar]
- 23.Little J, Cardy A, Arslan MT, et al. Smoking and orofacial clefts: a United Kingdom-based case-control study. Cleft Palate Craniofac J. 2004;41:381–386. doi: 10.1597/02-142.1. [DOI] [PubMed] [Google Scholar]
- 24.Shaw GM, Wasserman CR, Lammer EJ, et al. Orofacial clefts, parental cigarette smoking, and transforming growth factor-alpha gene variants. Am J Hum Genet. 1996;58:551–561. [PMC free article] [PubMed] [Google Scholar]
- 25.Little J, Cardy A, Munger RG. Tobacco smoking and oral clefts: a meta-analysis. Bull World Health Organ. 2004;82:213–218. [PMC free article] [PubMed] [Google Scholar]
- 26.Yoon PW, Rasmussen SA, Lynberg MC, et al. The National Birth Defects Prevention Study. Public Health Rep. 2001;116(Suppl 1):32–40. doi: 10.1093/phr/116.S1.32. [DOI] [PMC free article] [PubMed] [Google Scholar]
- 27.Rasmussen SA, Lammer EJ, Shaw GM, et al. Integration of DNA sample collection into a multi-site birth defects case-control study. Teratology. 2002;66:177–184. doi: 10.1002/tera.10086. [DOI] [PubMed] [Google Scholar]
- 28.Rasmussen SA, Olney RS, Holmes LB, et al. Guidelines for case classification for the National Birth Defects Prevention Study. Birth Defects Res A Clin Mol Teratol. 2003;67:193–201. doi: 10.1002/bdra.10012. [DOI] [PubMed] [Google Scholar]
- 29.Verkerk PH, Buitendijk SE, Verloove-Vanhorick SP. Differential misclassification of alcohol and cigarette consumption by pregnancy outcome. Int J Epidemiol. 1994;23:1218–1225. doi: 10.1093/ije/23.6.1218. [DOI] [PubMed] [Google Scholar]
- 30.Carroll RJ, Ruppert D, Stefanski LA. Measurement error in nonlinear models Monographs on statistics and applied probability. 63 1st ed. London, New York: Chapman & Hall; 1995. [Google Scholar]
- 31.Spiegelman D, McDermott A, Rosner B. Regression calibration method for correcting measurement-error bias in nutritional epidemiology. Am J Clin Nutr. 1997;65(4 Suppl):1179S–1186S. doi: 10.1093/ajcn/65.4.1179S. [DOI] [PubMed] [Google Scholar]
- 32.Chu H, Wang Z, Cole SR, et al. Sensitivity analysis of misclassification: a graphical and a Bayesian approach. Ann Epidemiol. 2006;16:834–841. doi: 10.1016/j.annepidem.2006.04.001. [DOI] [PubMed] [Google Scholar]
- 33.Gustafson P. Measurement error and misclassification in statistics and epidemiology: impacts and Bayesian adjustments. Boca Raton: Chapman & Hall/CRC; 2004. [Google Scholar]
- 34.Richardson S. Measurement error. In: Gilks WR, Richardson S, Spiegelhalter DJ, editors. Markov Chain Monte Carlo in Practice. Boca Raton, Fla: Chapman & Hall; 1998. pp. 401–414. [Google Scholar]
- 35.Dunson DB. Commentary: practical advantages of Bayesian analysis of epidemiologic data. Am J Epidemiol. 2001;153:1222–1226. doi: 10.1093/aje/153.12.1222. [DOI] [PubMed] [Google Scholar]
- 36.Greenland S. Bayesian perspectives for epidemiological research: I. Foundations and basic methods. Int J Epidemiol. 2006;35:765–775. doi: 10.1093/ije/dyi312. [DOI] [PubMed] [Google Scholar]
- 37.Greenland S. Bayesian perspectives for epidemiological research. II. Regression analysis. Int J Epidemiol. 2007;36:195–202. doi: 10.1093/ije/dyl289. [DOI] [PubMed] [Google Scholar]
- 38.Gustafson P, Le ND, Saskin R. Case-control analysis with partial knowledge of exposure misclassification probabilities. Biometrics. 2001;57:598–609. doi: 10.1111/j.0006-341x.2001.00598.x. [DOI] [PubMed] [Google Scholar]
- 39.Gustafson P, Le ND, Vallee M. A Bayesian approach to case-control studies with errors in covariables. Biostatistics. 2002;3:229–243. doi: 10.1093/biostatistics/3.2.229. [DOI] [PubMed] [Google Scholar]
- 40.Rothman KJ, Greenland S. Modern Epidemiology. 2nd. Philadelphia: Lippincott-Raven; 1998. p. xiii.p. 737. [Google Scholar]
- 41.Marshall JR. The use of dual or multiple reports in epidemiologic studies. Stat Med. 1989;8:1041–1049. doi: 10.1002/sim.4780080904. discussion 1071–1073. [DOI] [PubMed] [Google Scholar]
- 42.English PB, Eskenazi B, Christianson RE. Black-white differences in serum cotinine levels among pregnant women and subsequent effects on infant birthweight. Am J Public Health. 1994;84:1439–1443. doi: 10.2105/ajph.84.9.1439. [DOI] [PMC free article] [PubMed] [Google Scholar]
- 43.Klebanoff MA, Levine RJ, Clemens JD, et al. Serum cotinine concentration and self-reported smoking during pregnancy. Am J Epidemiol. 1998;148:259–262. doi: 10.1093/oxfordjournals.aje.a009633. [DOI] [PubMed] [Google Scholar]
- 44.Klebanoff MA, Levine RJ, Morris CD, et al. Accuracy of self-reported cigarette smoking among pregnant women in the 1990s. Paediatr Perinat Epidemiol. 2001;15:140–143. doi: 10.1046/j.1365-3016.2001.00321.x. [DOI] [PubMed] [Google Scholar]
- 45.Pickett KE, Rathouz PJ, Kasza K, et al. Self-reported smoking, cotinine levels, and patterns of smoking in pregnancy. Paediatr Perinat Epidemiol. 2005;19:368–376. doi: 10.1111/j.1365-3016.2005.00660.x. [DOI] [PubMed] [Google Scholar]
- 46.R Development Core Team. R: A Language and Environment for Statistical Computing. Vienna, Austria: 2007. [Google Scholar]
- 47.Thomas A, O’Hara B, Ligges U, et al. Making BUGS open. R News. 2006;6:12–17. [Google Scholar]
- 48.Bille C, Olsen J, Vach W, et al. Oral clefts and life style factors–a case-cohort study based on prospective Danish data. Eur J Epidemiol. 2007;22:173–181. doi: 10.1007/s10654-006-9099-5. [DOI] [PubMed] [Google Scholar]
- 49.Lie RT, Wilcox AJ, Taylor J, et al. Maternal smoking and oral clefts: the role of detoxification pathway genes. Epidemiology. 2008;19:606–615. doi: 10.1097/EDE.0b013e3181690731. [DOI] [PMC free article] [PubMed] [Google Scholar]
- 50.Gustafson P. Sample size implications when biases are modelled rather than ignored. J Royal Stat Soc A. 2006;169:883–902. [Google Scholar]
Associated Data
This section collects any data citations, data availability statements, or supplementary materials included in this article.