

Supplemental Digital Content is available in the text.
Keywords: angiography, atherosclerosis, chest pain, coronary artery disease, multidetector computed tomography
Abstract
Background—
Napkin-ring sign (NRS) is an independent prognostic imaging marker of major adverse cardiac events. However, identification of NRS is challenging because of its qualitative nature. Radiomics is the process of extracting thousands of quantitative parameters from medical images to create big-data data sets that can identify distinct patterns in radiological images. Therefore, we sought to determine whether radiomic analysis improves the identification of NRS plaques.
Methods and Results—
From 2674 patients referred to coronary computed tomographic angiography caused by stable chest pain, expert readers identified 30 patients with NRS plaques and matched these with 30 non-NRS plaques with similar degree of calcification, luminal obstruction, localization, and imaging parameters. All plaques were segmented manually, and image data information was analyzed using Radiomics Image Analysis package for the presence of 8 conventional and 4440 radiomic parameters. We used the permutation test of symmetry to assess differences between NRS and non-NRS plaques, whereas we calculated receiver-operating characteristics’ area under the curve values to evaluate diagnostic accuracy. Bonferroni-corrected P<0.0012 was considered significant. None of the conventional quantitative parameters but 20.6% (916/4440) of radiomic features were significantly different between NRS and non-NRS plaques. Almost half of these (418/916) reached an area under the curve value >0.80. Short- and long-run low gray-level emphasis and surface ratio of high attenuation voxels to total surface had the highest area under the curve values (0.918; 0.894 and 0.890, respectively).
Conclusions—
A large number of radiomic features are different between NRS and non-NRS plaques and exhibit excellent discriminatory value.
Coronary computed tomographic (CT) angiography is a robust noninvasive imaging modality that can visualize the coronary lumen and the atherosclerotic changes of the vessel wall.1 Four distinct plaque characteristics have been linked to major adverse cardiovascular events using coronary CT angiography.2 Out of these 4 characteristics, positive remodeling, low attenuation, and spotty calcification are quantitative high-risk plaque features. The napkin-ring sign (NRS) is defined as a plaque cross-section with a central area of low CT attenuation apparently in contact with the lumen, which is surrounded by a ring-shaped higher attenuation plaque tissue.3 Because of its qualitative nature, identification of the NRS is affected by clinical experience and inter-reader variability.4
See Editorial by Dey and Commandeur
Radiological images are multidimensional data sets, where each voxel value represents a specific measurement based on some physical characteristic.5 Radiomics is the process of obtaining quantitative parameters from these spatial data sets, to create big-data data sets, where each lesion is characterized by hundreds of different parameters.6 These features aim to quantify morphological characteristics difficult or impossible to comprehend by visual assessment.7
Radiomics has proven to be a valuable tool in oncology.8 Several studies have shown radiomics to improve the diagnostic accuracy,9,10 staging and grading of cancer,11 response assessment to treatment,12–14 and also to predict clinical outcomes.15,16 However, up until today, there is no data available on radiomics-based analysis of coronary plaques. Coronary atherosclerotic lesions are smaller than tumors and have complex geometric shapes, which might pose a challenge for radiomic feature analysis. Therefore, we sought to assess whether calculation of radiomic features is feasible on coronary lesions. Furthermore, we aimed to evaluate whether radiomic parameters can differentiate between plaques with or without NRS.
Methods
Institutional review board approved the study (SE TUKEB 1/2017) and because of the retrospective study design informed consent was waived. The data and study materials will not be made available to other researchers for purposes of reproducing the results or replicating the procedure because of intellectual property rights and patient confidentiality. However, we made our analysis software open source and freely accessible for other researchers.17
Study Design and Population
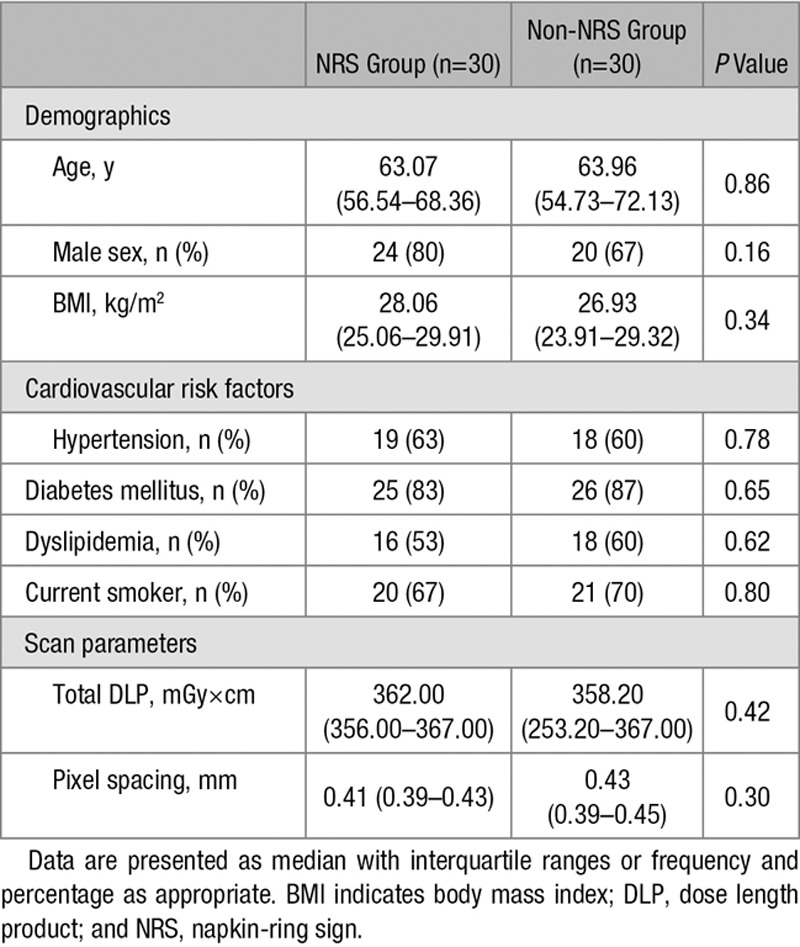
From 2674 consecutive coronary CT angiography examinations because of stable chest pain, we retrospectively identified 39 patients who had NRS plaques. Two expert readers reevaluated the scans with NRS plaques. To minimize potential variations because of inter-reader variability, the presence of NRS was assessed using consensus read. Readers excluded 7 patients because of insufficient image quality and 2 patients because of the lack of the NRS; therefore, 30 coronary plaques of 30 patients (NRS group; mean age: 63.07 years; interquartile range [IQR], 56.54–68.36; 20% female) were included in our analysis. As a control group, we retrospectively matched 30 plaques of 30 patients (non-NRS group; mean age: 63.96 years; IQR, 54.73–72.13; 33% female) from our clinical database with excellent image quality. To maximize similarity between the NRS and the non-NRS plaques and minimize parameters potentially influencing radiomic features, we matched the non-NRS group based on degree of calcification and stenosis, plaque localization, tube voltage, and image reconstruction. Detailed patient and scan characteristics are summarized in Table 1, whereas detailed description of scan characteristics and image quality measurements are described in Methods 1 section of the Data Supplement.
Table 1.
Patient Characteristics and Scan Parameters
Traditional Plaque Characteristics
All plaques were graded for luminal stenosis (minimal 1% to 24%; mild 25% to 49%; moderate 50% to 69%; severe 70% to 99%) and degree of calcification (calcified; partially calcified; noncalcified). Furthermore, plaques were classified as having low attenuation if the plaque cross-section contained any voxel with <30 Hounsfield unit and having spotty calcification if a <3-mm calcified plaque component was visible. Detailed plaque and imaging information is shown in Table 2.
Table 2.
Plaque and Image Quality Characteristics
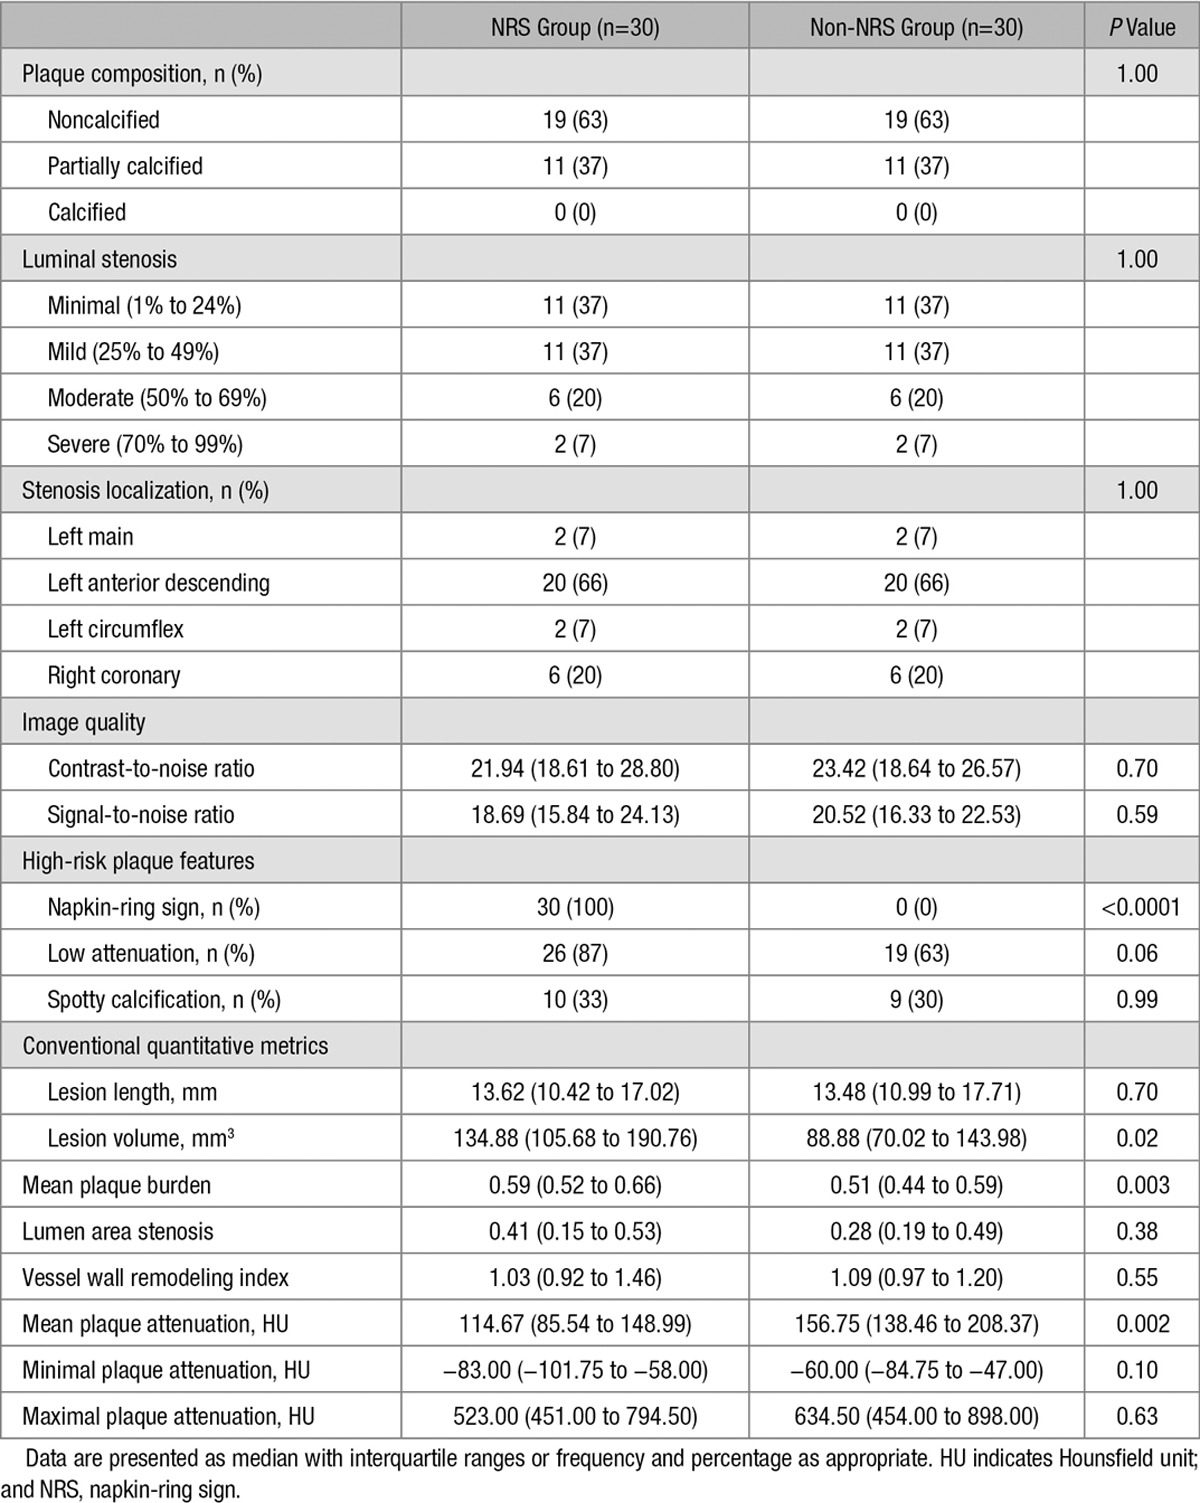
Image Segmentation, Conventional Quantitative Metrics, and Data Extraction
Image segmentation and data extraction was performed using a dedicated software tool for automated plaque assessment (QAngioCT Research Edition; Medis Medical Imaging Systems B.V., Leiden, The Netherlands). After automated segmentation of the coronary tree, the proximal and distal ends of each plaque were set manually. Automatic lumen and vessel contours were manually edited by an expert if needed.18 From the segmented data sets, 8 conventional quantitative metrics (lesion length, area stenosis, mean plaque burden, lesion volume, remodeling index, mean plaque attenuation, and minimal and maximal plaque attenuation) were calculated by the software. The voxels containing the plaque tissue were exported as a DICOM data set using a dedicated software tool (QAngioCT 3D Workbench; Medis Medical Imaging Systems B.V.). Smoothing or interpolation of the original Hounsfield unit values was not performed. Representative examples of volume-rendered and cross-sectional images of NRS and non-NRS plaques are shown in Figure 1.
Figure 1.
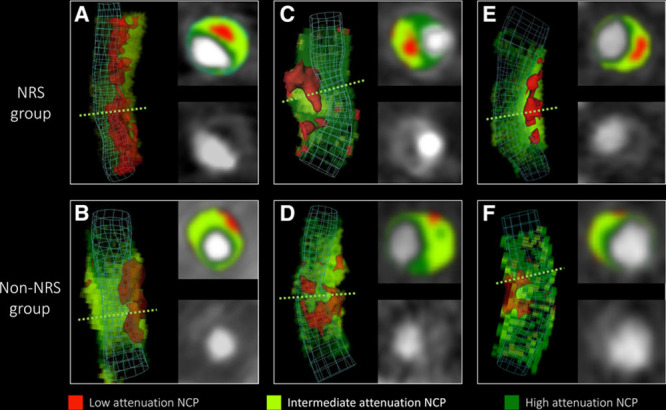
Representative images of plaques with or without the napkin-ring sign (NRS). Volume-rendered and cross-sectional images of plaques with NRS in the top (A, C, and E) and their corresponding matched plaques in the bottom (B, D, and E) are shown. Green dashed lines indicate the location of cross-sectional planes. Colors indicate different computed tomographic attenuation values. NCP indicates noncalcified plaque.
Calculation of Radiomic Features
We developed an open-source software package in the R programming environment (Radiomics Image Analysis), which is capable of calculating hundreds of different radiomic parameters on 2- and 3-dimensional data sets.17 We calculated 4440 radiomic features for each coronary plaque using the Radiomics Image Analysis software tool. Detailed description on how radiomic features were calculated can be found in the Methods 1 section of the Data Supplement, whereas a detailed description of the calculated statistical parameters can be found in the Methods 2 section of the Data Supplement.
Statistical Analysis
Binary variables are presented as frequencies and percentages, whereas ordinal and continuous variables are presented as medians and IQRs because of possible violations of the normality assumption. For robust statistical estimates, parameters between the NRS and the non-NRS groups were compared using the permutation test of symmetry for matched samples using conditional Monte Carlo simulations with 10 000 replicas.19 For diagnostic performance estimates, we conducted receiver-operating characteristics analysis and calculated area under the curve (AUC) with bootstrapped confidence interval values using 10 000 samples with replacement and calculated sensitivity, specificity, and positive and negative predictive values by maximizing the Youden index.20 To assess potential clusters among radiomic parameters, we conducted linear regression analysis between all pairs of the calculated 4440 radiomic metrics. The 1−R2 value between each radiomic feature was used as a distance measure for hierarchical clustering. The average silhouette method was used to evaluate the optimal number of different clusters in our data set.21 Furthermore, to validate our results, we conducted a stratified 5-fold cross-validation using 10 000 repeats of the 3 best radiomic and conventional quantitative parameters. The model was trained on a training set and was evaluated on a separate test set at each fold using receiver-operating characteristics analysis. The derived curves were averaged and plotted to assess the discriminatory power of the parameters. The number of additional cases classified correctly was calculated compared with lesion volume. The McNemar test was used to compare classification accuracy of the given parameters compared with lesion volume.22
Because of the large number of comparisons, we used the Bonferroni correction to account for the family-wise error rate. Bonferroni correction assumes that the examined parameters are independent of each other; thus, the question is not how many parameters are being tested but how many independent statistical comparisons will be made. Therefore, based on methods used in genome-wide association studies, we calculated the number of informative parameters accounting for 99.5% of the variance using principal component analysis.23,24 Overall, 42 principal components were identified; therefore, P values <0.0012 (0.05/42) were considered significant. All calculations were done in the R environment.25
Results
Descriptive Results
There was no significant difference between the NRS and non-NRS groups regarding patient characteristics and scan parameters (Table 1). Furthermore, we did not observe any significant difference in qualitative plaque characteristics and image quality parameters (Table 2) implying successful matching of the 2 groups. Median number of voxels contributing to the NRS coronary plaques (1928; IQR, 1413–2560) did not show statistical difference compared with the number of voxels in the non-NRS group (1286; IQR, 1001–1768; P=0.0041).
Statistical Significance and Diagnostic Accuracy of Conventional Quantitative Parameters
Among conventional quantitative imaging parameters, there was no significant difference between NRS and non-NRS plaques (Table 2). Furthermore, none of the conventional parameters had an AUC value >0.8 (Table 3).
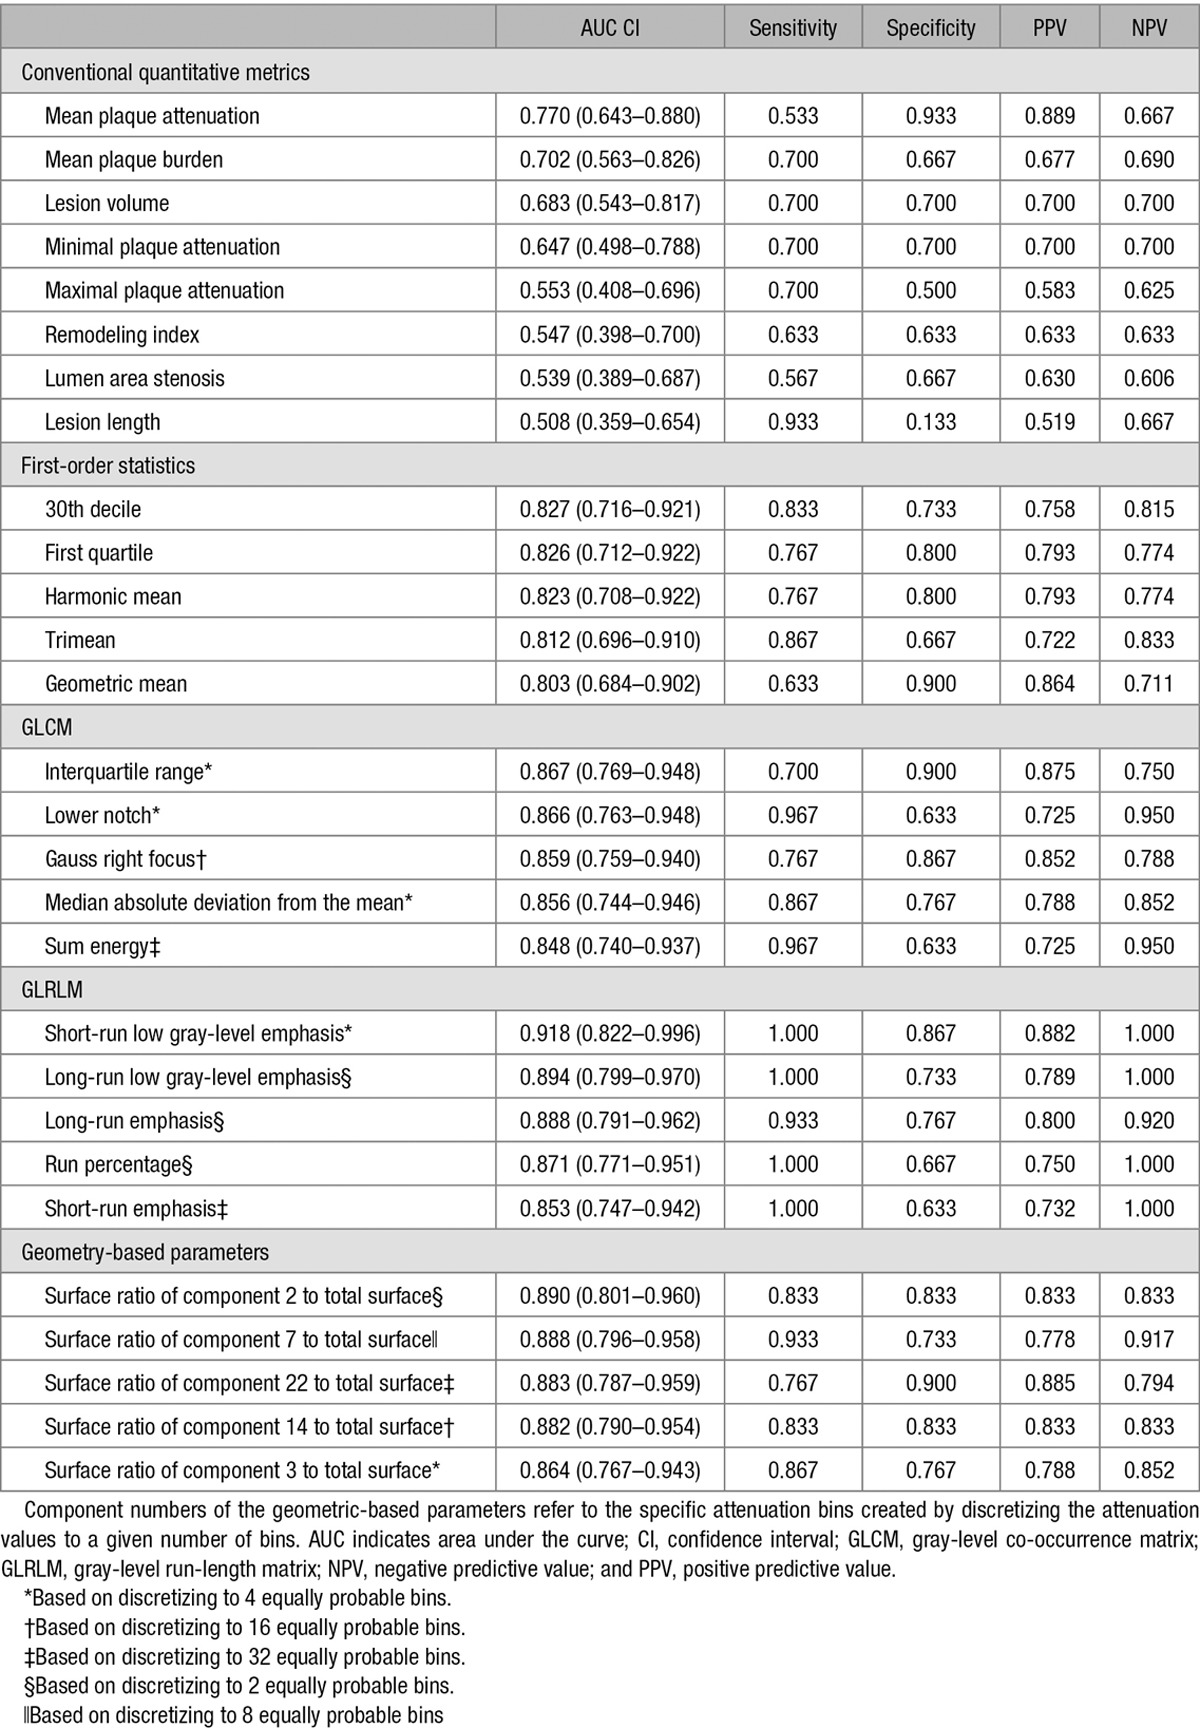
Table 3.
Diagnostic Performance of Conventional Quantitative Parameters and Novel Radiomic Parameters to Identify Plaques With the Napkin-Ring Sign
Statistical Significance and Diagnostic Accuracy of Radiomic Parameters
Overall, 4440 radiomic parameters were calculated for each atherosclerotic lesion. Of all calculated radiomic parameters, 20.6% (916/4440) showed a significant difference between plaques with or without NRS (all P<0.0012). Of the 44 calculated first-order statistics, 25.0% (11/44) was significant. Of the 3585 calculated gray-level co-occurrence matrix (GLCM) statistics, 20.7% (742/3585) showed a significant difference between the 2 groups. Among the 55 gray-level run-length matrix (GLRLM) parameters, 54.5% (30/55) were significant, whereas 17.6% (133/756) of the calculated 756 geometry-based parameters had a P<0.0012. A Manhattan plot of the P values of the calculated radiomic parameters is shown in Figure 2. Detailed statistics of the assessed radiomic parameters can be found in Table I in the Data Supplement.
Figure 2.
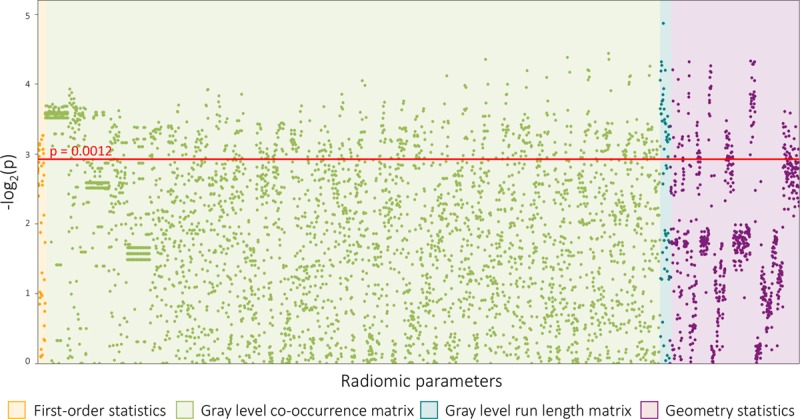
Manhattan plot of all 4440 calculated P values. The Manhattan plot shows all 4440 calculated P values comparing napkin-ring sign (NRS) vs non-NRS plaques and their distribution among the different classes of radiomic parameters. Radiomic features are lined up on the x axis, whereas the -log2(P) values are plotted on the y axis. The red horizontal line indicates the Bonferroni-corrected P value of 0.0012. Radiomic parameters above the red line were considered statistically significant.
Among all 4440 radiomic parameters, 9.9% (440/4440) had an AUC value >0.80. Of the 44 calculated first-order statistics, 18.2% (8/44) had an AUC value >0.80. Of the 3585 calculated GLCM parameters, 9.7% (348/3585) of the AUC values was >0.80. Among the 55 GLRLM parameters, 54.5% (30/55) had an AUC value >0.80, whereas of the calculated 756 geometry-based parameters, 7.1% (54/756) had an AUC value >0.80. Of all radiomic parameters, short-run low-gray-level emphasis, long-run low-gray-level emphasis, surface ratio of component 2 to total surface, long-run emphasis, and surface ratio of component 7 to total surface had the 5 highest AUC values (0.918; 0.894; 0.890; 0.888, and 0.888, respectively). Detailed diagnostic accuracy statistics of conventional quantitative features and of the 5 best radiomic features for each group are shown in Table 3, whereas detailed diagnostic accuracy results of radiomic parameters can be found in Table I in the Data Supplement.
Cluster Analysis of Radiomic Parameters
Results of the linear regression analysis conducted between all pairs of the calculated 4440 radiomic metrics are summarized using a heatmap (Figure 3). Hierarchical clustering showed several different clusters where parameters are highly correlated with each other (represented by the red areas in Figure 3) but only have minimal relationship with other radiomic features (represented by the black areas in Figure 3). Cluster analysis revealed that the optimal number of clusters among radiomic features in our data set is 44.
Figure 3.
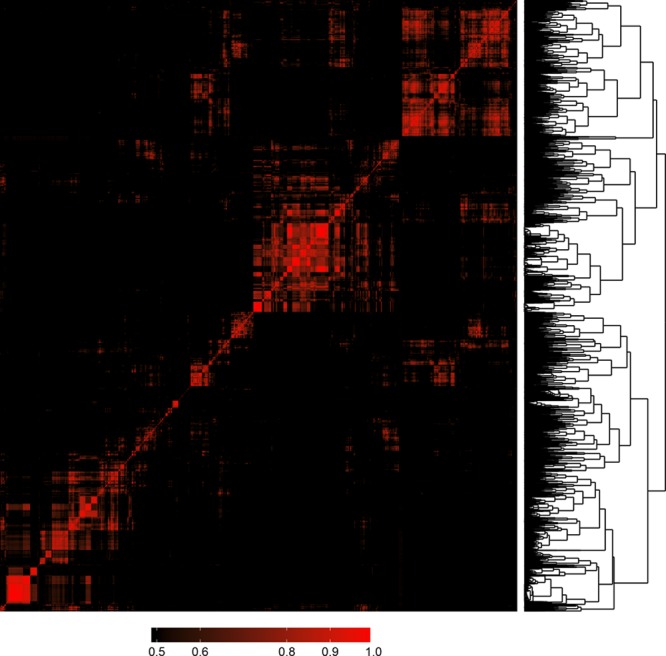
Heatmap and clustering dendrogram of all 4440 calculated radiomic parameters. Each parameter was compared with all other parameters using linear regression analysis. Features were clustered based on R2 values of the corresponding regression models and plotted along both axes. R2 values <0.5 are black, whereas greater values are shown in red with increasing intensity. The 1−R2 values was used as a distance measure between parameters and used for hierarchical clustering. The resulting clustering dendrogram can be seen on the right of the image. Cluster analysis indicated that the optimal number of clusters is 44 based on our radiomics data set.
Cross-Validation Results
Five-fold cross-validation using 10 000 repeats was used to simulate the discriminatory power of the 3 best radiomic and conventional parameter. Average receiver-operating characteristics curves of the cross-validated results are shown in Figure 4. Radiomic parameters had higher AUC values and identified lesions showing the NRS significantly better compared to conventional metrics. Detailed results are shown in Table 4.
Figure 4.
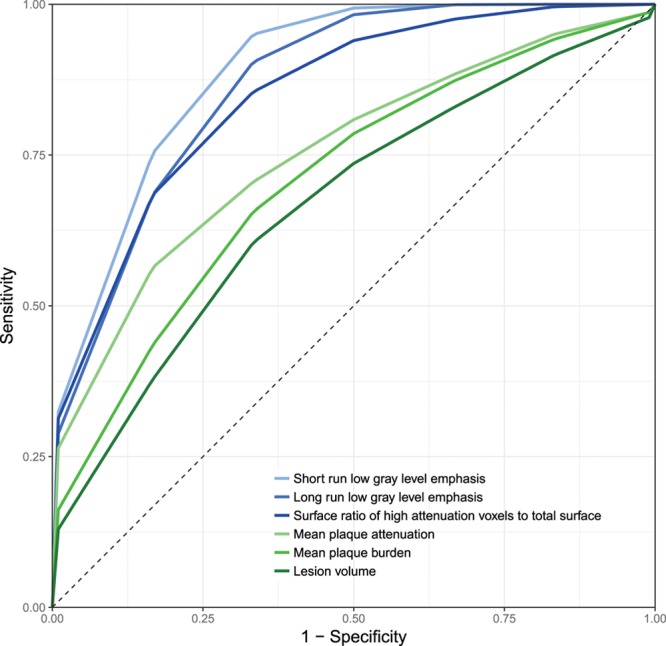
Stratified 5-fold cross-validated receiver-operating characteristic (ROC) curves of the best radiomic and conventional quantitative parameters. Radiomic parameters (blue) have higher discriminatory power to identify plaques with napkin-ring sign compared with conventional quantitative metrics (green). Detailed performance measures can be found in Table 4.
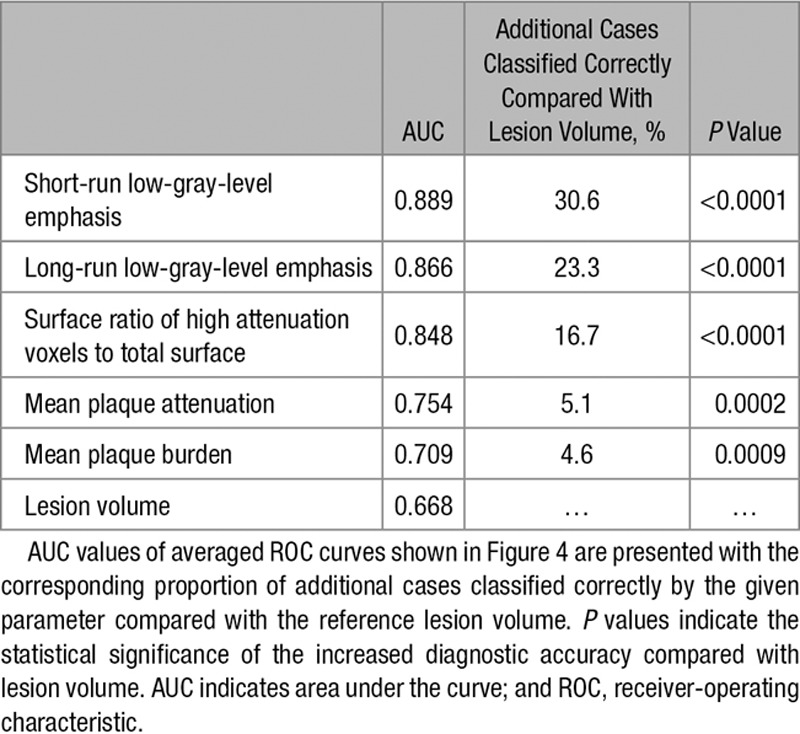
Table 4.
AUC Values of Stratified 5-Fold Cross-Validated ROC Curves of the Best Radiomic and Conventional Quantitative Parameters to Identify Plaques With the Napkin-Ring Sign
Discussion
We demonstrated that coronary plaques consist of sufficient number of voxels to conduct radiomic analysis, and 20.6% of radiomic parameters showed a significant difference between plaques with or without NRS, whereas conventional parameters did not show any difference. Furthermore, several radiomic parameters had a higher diagnostic accuracy in identifying NRS plaques than conventional quantitative measures. Cluster analysis revealed that many of these parameters are correlated with each other; however, there are several distinct clusters, which imply the presence of various features that hold unique information on plaque morphology. Cross-validation simulations indicate that our results are robust when assessing the discriminatory value of radiomic parameters, implying the generalizability of our results.
Radiomics uses voxel values and their relationship to each other to quantify image characteristics. On the basis of our results, it seems not only do radiomic features outperform conventional quantitative imaging markers but also parameters incorporating the spatial distribution of voxels (GLCM, GLRLM, and geometry-based parameters) have a better predictive value than first-order statistics, which describe the statistical distribution of the intensity values. Among GCLM parameters, the interquartile range, the lower notch, the median absolute deviation from the mean of the GLCM probability distribution, Gauss right focus, and sum energy had the 5 highest AUC values. NRS plaques have many low-value voxels next to each other in a group surrounded by higher density voxels. This heterogeneous morphology results in an unbalanced GLCM and therefore higher interquartile rank values, which also means smaller lower notch values and bigger deviations from the mean. Gauss right focus and sum energy both give higher weights to elements in the lower right of the GLCM, which represents the probability of high-density voxels occurring next to each other. Because NRS plaques do not have many high-value voxels next to each other, they received smaller values, whereas non-NRS plaques have higher values, which resulted in excellent diagnostic accuracy.
Among GLRLM statistics, long- and short-run low-gray-level emphasis, long- and short-run emphasis, and run percentage had the best predictive value. Run percentage and long-run emphasis give high values to lesions, where there are many similar value voxels in 1 direction, whereas long-run low-gray-level emphasis adds a weight to the previous parameter by giving higher weights when these voxel runs contain low Hounsfield unit values. NRS plaques’ low-density core has many low CT number voxels next to each other in 1 direction; therefore, NRS plaques have higher values compared with non-NRS plaques, which results in excellent diagnostic accuracy. In case of short-run emphasis and short-run low-gray-level emphasis, the contrary is true, which results in NRS plaques receiving low values, whereas non-NRS plaque have higher values also leading to high AUC values.
Among geometry-based parameters, the first 5 with the best diagnostic accuracy all represent the surface ratio of a specific subcomponent to the whole surface of the plaque. In all cases, the ratio of high-density subcomponents (eg, subcomponent 2 when the plaque was divided into 2 components) to the whole surface had excellent diagnostic accuracy. Because each subcomponent is composed of equal number of voxels because of the equally probable binning, the difference in surfaces is a result of how the high-intensity voxels are situated to each other. In case of NRS plaques, extraction of low attenuation voxels leaves a hollow cylindrical shape of high CT number voxels, which has a relatively large surface. Non-NRS plaques on the contrary do not have such voxel complexes; therefore, the surface of the high attenuation voxels is smaller, and, therefore, the ratio compared with the whole surface is also smaller.
This kind of transition from qualitative to quantitative image assessment was initiated by oncoradiology. Because studies showed that morphological descriptors correlate with later outcomes,26 reporting guidelines such as the Breast Imaging Reporting and Data System started implementing qualitative morphological characteristics into clinical practice.27 However, despite all the efforts of standardization, the variability of image assessment based on human interpretation is still substantial.28 Radiomics, the process of extracting thousands of different morphological descriptors from medical images, has been shown to reach the diagnostic accuracy of clinical experts in identifying malignant lesions.10 Furthermore, radiomics can not only classify abnormalities to proper clinical categories but also discriminate between responders and nonresponders to clinical therapy and predict long-term outcomes.12,15 However, there are major concerns on the generalizability of radiomics. Several studies have shown that imaging parameters, reconstruction settings, segmentation algorithms, etc, all affect the radiomic signature of lesions.29–32 Furthermore, it has been shown that the variability caused by these changeable parameters is in the range or even greater than the variability of radiomic features of tumor lesions.33 Little is known about cardiovascular radiomics. Several studies will be needed to replicate these results in the cardiovascular domain. The potential of radiomics is extensive; however, the problem of standardized imaging protocols and radiomic analysis need to be solved to achieve robust and generalizable results.
Despite our encouraging results, our study has some limitations that should be acknowledged. All of our examinations were done using the same scanner and reconstruction settings. It is yet unknown how these settings might affect radiomic parameters and therefore influence the applicability of radiomics in daily clinical care. Furthermore, our results are based on a case–control study design. The true prevalence of the NRS is considerably smaller compared with non-NRS plaques in a real population. Therefore, our observed positive predictive values might be higher, whereas our negative predictive values might be smaller than that expected in a real-world setting. Moreover, our limited sample sizes might not allow the accurate assessment of the diagnostic accuracy of the different parameters. However, we performed Monte Carlo simulations and cross-validated our results to achieve robust estimates.
Radiomics is a promising new tool to identify qualitative plaque features such as the NRS. Because the number of CT examinations increases, we are in dire need of new techniques that increase the accuracy of our examinations without increasing the workload of imaging specialists. We demonstrated that radiomics has the potential to identify a qualitative high-risk plaque feature that currently only experts are capable of. Furthermore, our findings indicate that radiomics can quantitatively describe qualitative plaque morphologies and therefore have the potential to decrease intra- and interobserver variability by objectifying plaque assessment. In addition, we observed several different clusters of information present in our data set, implying that radiomics might be able to identify new image markers that are currentlyt unknown. These new radiomic characteristics might provide a more accurate plaque risk stratification than the currently used high-risk plaque features. Radiomics could easily be implemented into currently used standard clinical workstations and become a computer-aided diagnostic tool, which seamlessly integrates into the clinical workflow and could increase the reproducibility and the accuracy of diagnostic image interpretation in the future. Further studies are needed to explore the potential of cardiovascular radiomics.
Sources of Funding
This study was supported by the National Research, Development and Innovation Office of Hungary (NKFIA; NVKP-16-1-2016-0017). Dr Kolossváry received support from the ÚNKP-17-3 New National Excellence Program of the Ministry of Human Capacities, Hungary.
Disclosures
Dr Kolossváry is the creator and developer of Radiomics Image Analysis software package, which was used for radiomic analysis. P. Kitslaar is employed by Medis Medical Imaging Systems B.V. This software was used for the coronary segmentations and image export. The other authors report no conflicts.
Supplementary Material
Footnotes
Guest Editor for this article was Leslee J. Shaw, PhD.
The Data Supplement is available at http://circimaging.ahajournals.org/lookup/suppl/doi:10.1161/CIRCIMAGING.117.006843/-/DC1.
CLINICAL PERSPECTIVE
Napkin-ring sign is an independent prognostic imaging marker of major adverse cardiac events. However, being a solely qualitative marker, identification of such coronary plaques mainly depends on the readers’ experience. Therefore, a more quantitative approach would be desirable. Radiomics is the process of obtaining quantitative parameters from radiological examinations, to create big-data data sets, where each abnormality is characterized by hundreds of thousands of different parameters. Radiomics is an emerging field in oncoradiology; however, to date, there is limited information on the clinical applicability of radiomics to cardiovascular imaging. We compared napkin-ring sign plaques with matched non–napkin-ring sign plaques. Although none of the conventional metrics differed between the 2 groups, >20% of radiomic features were significantly different, of which almost half had an area under the curve value >0.80, suggesting good discriminatory potential in clinical practice. We demonstrated that radiomics has the potential to identify a qualitative high-risk plaque feature that currently only experts are capable of. With the transformation of visual characteristics into distinct quantitative information, radiological examinations could become more standardized and less dependent on reader’s experience. Radiomics could easily be implemented into current clinical software packages and, therefore, become a computer-aided diagnostic tool for clinicians in assessing coronary plaque morphology. Furthermore, cardiovascular radiomics has the potential to identify new imaging biomarkers, which might be more specific to rupture-prone plaques and, therefore, could guide clinical treatment of patients with nonobstructive coronary artery disease.
References
- 1.Dweck MR, Doris MK, Motwani M, Adamson PD, Slomka P, Dey D, Fayad ZA, Newby DE, Berman D. Imaging of coronary atherosclerosis - evolution towards new treatment strategies. Nat Rev Cardiol. 2016;13:533–548. doi: 10.1038/nrcardio.2016.79. doi: 10.1038/nrcardio.2016.79. [DOI] [PubMed] [Google Scholar]
- 2.Maurovich-Horvat P, Ferencik M, Voros S, Merkely B, Hoffmann U. Comprehensive plaque assessment by coronary CT angiography. Nat Rev Cardiol. 2014;11:390–402. doi: 10.1038/nrcardio.2014.60. doi: 10.1038/nrcardio.2014.60. [DOI] [PubMed] [Google Scholar]
- 3.Maurovich-Horvat P, Hoffmann U, Vorpahl M, Nakano M, Virmani R, Alkadhi H. The napkin-ring sign: CT signature of high-risk coronary plaques? JACC Cardiovasc Imaging. 2010;3:440–444. doi: 10.1016/j.jcmg.2010.02.003. doi: 10.1016/j.jcmg.2010.02.003. [DOI] [PubMed] [Google Scholar]
- 4.Puchner SB, Liu T, Mayrhofer T, Truong QA, Lee H, Fleg JL, Nagurney JT, Udelson JE, Hoffmann U, Ferencik M. High-risk plaque detected on coronary CT angiography predicts acute coronary syndromes independent of significant stenosis in acute chest pain: results from the ROMICAT-II trial. J Am Coll Cardiol. 2014;64:684–692. doi: 10.1016/j.jacc.2014.05.039. doi: 10.1016/j.jacc.2014.05.039. [DOI] [PMC free article] [PubMed] [Google Scholar]
- 5.Kolossvary M, Kellermayer M, Merkely B, Maurovich-Horvat P. Cardiac computed tomography radiomics: a comprehensive review on radiomic techniques [published online ahead of print 24 March 2017]. J Thorac Imaging. doi: 10.1097/RTI.0000000000000268. doi: 10.1097/RTI.0000000000000268. [DOI] [PubMed] [Google Scholar]
- 6.Gillies RJ, Kinahan PE, Hricak H. Radiomics: images are more than pictures, they are data. Radiology. 2016;278:563–577. doi: 10.1148/radiol.2015151169. doi: 10.1148/radiol.2015151169. [DOI] [PMC free article] [PubMed] [Google Scholar]
- 7.Davnall F, Yip CS, Ljungqvist G, Selmi M, Ng F, Sanghera B, Ganeshan B, Miles KA, Cook GJ, Goh V. Assessment of tumor heterogeneity: an emerging imaging tool for clinical practice? Insights Imaging. 2012;3:573–589. doi: 10.1007/s13244-012-0196-6. doi: 10.1007/s13244-012-0196-6. [DOI] [PMC free article] [PubMed] [Google Scholar]
- 8.O’Connor JP, Rose CJ, Waterton JC, Carano RA, Parker GJ, Jackson A. Imaging intratumor heterogeneity: role in therapy response, resistance, and clinical outcome. Clin Cancer Res. 2015;21:249–257. doi: 10.1158/1078-0432.CCR-14-0990. doi: 10.1158/1078-0432.CCR-14-0990. [DOI] [PMC free article] [PubMed] [Google Scholar]
- 9.Yu J, Shi Z, Lian Y, Li Z, Liu T, Gao Y, Wang Y, Chen L, Mao Y. Noninvasive IDH1 mutation estimation based on a quantitative radiomics approach for grade II glioma. Eur Radiol. 2017;27:3509–3522. doi: 10.1007/s00330-016-4653-3. doi: 10.1007/s00330-016-4653-3. [DOI] [PubMed] [Google Scholar]
- 10.Bickelhaupt S, Paech D, Kickingereder P, Steudle F, Lederer W, Daniel H, Götz M, Gählert N, Tichy D, Wiesenfarth M, Laun FB, Maier-Hein KH, Schlemmer HP, Bonekamp D. Prediction of malignancy by a radiomic signature from contrast agent-free diffusion MRI in suspicious breast lesions found on screening mammography. J Magn Reson Imaging. 2017;46:604–616. doi: 10.1002/jmri.25606. doi: 10.1002/jmri.25606. [DOI] [PubMed] [Google Scholar]
- 11.Zhang X, Xu X, Tian Q, Li B, Wu Y, Yang Z, Liang Z, Liu Y, Cui G, Lu H. Radiomics assessment of bladder cancer grade using texture features from diffusion-weighted imaging. J Magn Reson Imaging. 2017;46:1281–1288. doi: 10.1002/jmri.25669. doi: 10.1002/jmri.25669. [DOI] [PMC free article] [PubMed] [Google Scholar]
- 12.Coroller TP, Agrawal V, Huynh E, Narayan V, Lee SW, Mak RH, Aerts HJWL. Radiomic-based pathological response prediction from primary tumors and lymph nodes in NSCLC. J Thorac Oncol. 2017;12:467–476. doi: 10.1016/j.jtho.2016.11.2226. doi: 10.1016/j.jtho.2016.11.2226. [DOI] [PMC free article] [PubMed] [Google Scholar]
- 13.Kickingereder P, Götz M, Muschelli J, Wick A, Neuberger U, Shinohara RT, Sill M, Nowosielski M, Schlemmer HP, Radbruch A, Wick W, Bendszus M, Maier-Hein KH, Bonekamp D. Large-scale radiomic profiling of recurrent glioblastoma identifies an imaging predictor for stratifying anti-angiogenic treatment response. Clin Cancer Res. 2016;22:5765–5771. doi: 10.1158/1078-0432.CCR-16-0702. doi: 10.1158/1078-0432.CCR-16-0702. [DOI] [PMC free article] [PubMed] [Google Scholar]
- 14.Li H, Zhu Y, Burnside ES, Drukker K, Hoadley KA, Fan C, Conzen SD, Whitman GJ, Sutton EJ, Net JM, Ganott M, Huang E, Morris EA, Perou CM, Ji Y, Giger ML. MR imaging radiomics signatures for predicting the risk of breast cancer recurrence as given by research versions of MammaPrint, Oncotype DX, and PAM50 gene assays. Radiology. 2016;281:382–391. doi: 10.1148/radiol.2016152110. doi: 10.1148/radiol.2016152110. [DOI] [PMC free article] [PubMed] [Google Scholar]
- 15.Huang Y, Liu Z, He L, Chen X, Pan D, Ma Z, Liang C, Tian J, Liang C. Radiomics signature: a potential biomarker for the prediction of disease-free survival in early-stage (I or II) non-small cell lung cancer. Radiology. 2016;281:947–957. doi: 10.1148/radiol.2016152234. doi: 10.1148/radiol.2016152234. [DOI] [PubMed] [Google Scholar]
- 16.Prasanna P, Patel J, Partovi S, Madabhushi A, Tiwari P. Radiomic features from the peritumoral brain parenchyma on treatment-naive multi-parametric MR imaging predict long versus short-term survival in glioblastoma multiforme: preliminary findings [published online ahead of print 24 October 2016]. Eur Radiol. doi: 10.1007/s00330-016-4637-3. doi: 10.1007/s00330-016-4637-3. [DOI] [PMC free article] [PubMed] [Google Scholar]
- 17.RIA: Radiomics Image Analysis Toolbox for Grayscale Images [computer program] 2017.
- 18.Boogers MJ, Schuijf JD, Kitslaar PH, van Werkhoven JM, de Graaf FR, Boersma E, van Velzen JE, Dijkstra J, Adame IM, Kroft LJ, de Roos A, Schreur JH, Heijenbrok MW, Jukema JW, Reiber JH, Bax JJ. Automated quantification of stenosis severity on 64-slice CT: a comparison with quantitative coronary angiography. JACC Cardiovasc Imaging. 2010;3:699–709. doi: 10.1016/j.jcmg.2010.01.010. doi: 10.1016/j.jcmg.2010.01.010. [DOI] [PubMed] [Google Scholar]
- 19.Hothorn T, Hornik K, van de Wiel MAV, Zeileis A. Implementing a class of permutation tests: the coin package. J Stat Softw. 2008;28:1–23. [Google Scholar]
- 20.Robin X, Turck N, Hainard A, Tiberti N, Lisacek F, Sanchez JC, Müller M. pROC: an open-source package for R and S+ to analyze and compare ROC curves. BMC Bioinformatics. 2011;12:77. doi: 10.1186/1471-2105-12-77. doi: 10.1186/1471-2105-12-77. [DOI] [PMC free article] [PubMed] [Google Scholar]
- 21.Rousseeuw PJ. Silhouettes - a graphical aid to the interpretation and validation of cluster- analysis. J Comput Appl Math. 1987;20:53–65. [Google Scholar]
- 22.Dietterich TG. Approximate statistical tests for comparing supervised classification learning algorithms. Neural Comput. 1998;10:1895–1923. doi: 10.1162/089976698300017197. [DOI] [PubMed] [Google Scholar]
- 23.Gao X, Starmer J, Martin ER. A multiple testing correction method for genetic association studies using correlated single nucleotide polymorphisms. Genet Epidemiol. 2008;32:361–369. doi: 10.1002/gepi.20310. doi: 10.1002/gepi.20310. [DOI] [PubMed] [Google Scholar]
- 24.Johnson RC, Nelson GW, Troyer JL, Lautenberger JA, Kessing BD, Winkler CA, O’Brien SJ. Accounting for multiple comparisons in a genome-wide association study (GWAS). BMC Genomics. 2010;11:724. doi: 10.1186/1471-2164-11-724. doi: 10.1186/1471-2164-11-724. [DOI] [PMC free article] [PubMed] [Google Scholar]
- 25.R: A Language and Environment for Statistical Computing. R Foundation for Statistical Computing [Computer Program]. Version 3.3.2. R Foundation for Statistical Computing; 2016.
- 26.Burrell HC, Pinder SE, Wilson AR, Evans AJ, Yeoman LJ, Elston CW, Ellis IO. The positive predictive value of mammographic signs: a review of 425 non-palpable breast lesions. Clin Radiol. 1996;51:277–281. doi: 10.1016/s0009-9260(96)80346-1. [DOI] [PubMed] [Google Scholar]
- 27.Orel SG, Kay N, Reynolds C, Sullivan DC. BI-RADS categorization as a predictor of malignancy. Radiology. 1999;211:845–850. doi: 10.1148/radiology.211.3.r99jn31845. doi: 10.1148/radiology.211.3.r99jn31845. [DOI] [PubMed] [Google Scholar]
- 28.Grimm LJ, Anderson AL, Baker JA, Johnson KS, Walsh R, Yoon SC, Ghate SV. Interobserver variability between breast imagers using the fifth edition of the BI-RADS MRI lexicon. AJR Am J Roentgenol. 2015;204:1120–1124. doi: 10.2214/AJR.14.13047. [DOI] [PubMed] [Google Scholar]
- 29.Altazi BA, Zhang GG, Fernandez DC, Montejo ME, Hunt D, Werner J, Biagioli MC, Moros EG. Reproducibility of F18-FDG PET radiomic features for different cervical tumor segmentation methods, gray-level discretization, and reconstruction algorithms [published online ahead of print 11 September 2017]. J Appl Clin Med Phys. doi: 10.1002/acm2.12170. doi: 10.1002/acm2.12170. [DOI] [PMC free article] [PubMed] [Google Scholar]
- 30.Cortes-Rodicio J, Sanchez-Merino G, Garcia-Fidalgo MA, Tobalina-Larrea I. Identification of low variability textural features for heterogeneity quantification of (18)F-FDG PET/CT imaging. Rev Esp Med Nucl Imagen Mol. 2016;35:379–384. doi: 10.1016/j.remn.2016.04.002. doi: 10.1016/j.remn.2016.04.002. [DOI] [PubMed] [Google Scholar]
- 31.Hu P, Wang J, Zhong H, Zhou Z, Shen L, Hu W, Zhang Z. Reproducibility with repeat CT in radiomics study for rectal cancer. Oncotarget. 2016;7:71440–71446. doi: 10.18632/oncotarget.12199. doi: 10.18632/oncotarget.12199. [DOI] [PMC free article] [PubMed] [Google Scholar]
- 32.Shiri I, Rahmim A, Ghaffarian P, Geramifar P, Abdollahi H, Bitarafan-Rajabi A. The impact of image reconstruction settings on 18F-FDG PET radiomic features: multi-scanner phantom and patient studies [published online ahead of print 31 May 2017]. Eur Radiol. 2017 doi: 10.1007/s00330-017-4859-z. doi: 10.1007/s00330-017-4859-z. [DOI] [PubMed] [Google Scholar]
- 33.Mackin D, Fave X, Zhang L, Fried D, Yang J, Taylor B, Rodriguez-Rivera E, Dodge C, Jones AK, Court L. Measuring computed tomography scanner variability of radiomics features. Invest Radiol. 2015;50:757–765. doi: 10.1097/RLI.0000000000000180. doi: 10.1097/RLI.0000000000000180. [DOI] [PMC free article] [PubMed] [Google Scholar]