Abstract
Hydrogen peroxide (H2O2) is important in the regulation of a variety of biological processes and is involved in various diseases. Quantitative measurement of H2O2 levels at the subcellular level is important for understanding its positive and negative effects on biological processes. Herein, a two‐photon ratiometric fluorescent probe (SHP‐Cyto) with a boronate‐based carbamate leaving group as the H2O2 reactive trigger and 6‐(benzo[d]thiazol‐2′‐yl)‐2‐(N,N‐dimethylamino) naphthalene (BTDAN) as the fluorophore was synthesized and examined for its ability to detect cytosolic H2O2 in situ. This probe, based on the specific reaction between boronate and H2O2, displayed a fluorescent color change (455 to 528 nm) in response to H2O2 in the presence of diverse reactive oxygen species in a physiological medium. In addition, ratiometric two‐photon microscopy (TPM) images with SHP‐Cyto revealed that H2O2 levels gradually increased from brain to kidney, skin, heart, lung, and then liver tissues. SHP‐Cyto was successfully applied to the imaging of endogenously produced cytosolic H2O2 levels in live cells and various rat organs by using TPM.
Keywords: hydrogen peroxide, rat organ imaging, ratiometric fluorescent probe, two-photon microscopy, two-photon probe
Hydrogen peroxide (H2O2) is well known for its cytotoxicity, inducing cellular damage via oxidative stress.1 This damage is linked to the initiation and progression of a number of diseases, including diabetes, atherosclerosis, neurodegenerative diseases such as Alzheimer's and Parkinson's, and cancer.2 However, it has recently been shown to function as a eukaryotic signal transduction regulator in various biological processes.3, 4 Hence, H2O2 can have both positive and negative effects, depending on the level of H2O2 as well as the cell or tissue type. Precise measurement of H2O2 levels is, therefore, important both for the assessment of signal transduction regulation and as an indicator of disease development. In addition, H2O2 is known to be associated with the modulation of organelle function and intracellular calcium ion signaling in rat hippocampus.5 Furthermore, acute biogenic amine and stimulants such as amphetamine are known to cause an increase in neurotransmission, leading eventually to intracellular H2O2 production, which is highly toxic to various organs such as the liver, heart, and kidney. The ability to detect H2O2 levels in rat brain and other organs is, therefore, also of great interest.6
There have been numerous reports of probes for the measurement of reactive oxygen species (ROS) and reactive nitrogen species (RNS) in live cells,7, 8, 9, 10, 11 including boronate oxidation‐based H2O2 probes for imaging in live cells12 However, most of the fluorescent small‐molecule H2O2 probes developed to date have been limited to cells and transparent animals such as zebrafish,10c and approaches to detect H2O2 levels with high accuracy in non‐transparent animals, such as rat organs, are limited. In addition, most of these probes used one‐photon microscopy (OPM), which utilizes short excitation wavelengths for imaging. The utility of OPM is limited in deep tissue imaging because of its low penetration depth (≈80 μm), and it can only be used for short‐time imaging, owing to its high excitation energy. These limitations can be overcome by using two‐photon microscopy (TPM), an advanced imaging technique that utilizes a lower energy for excitation with two photons, and provides a number of advantages, such as increased penetration depth (>500 μm), localized excitation, and a long imaging time.13 Recently, we reported two‐photon (TP) mitochondrial‐selective probes that can measure H2O2 levels in live cells and tissues by using TPM.14 However, it is necessary to develop a new TP probe that can detect H2O2 levels and distribution in cytosolic regions by using ratiometric observation methods in order to allow quantitative analysis.
To address this need, we have developed a ratiometric TP probe for cytosolic H2O2 (SHP‐Cyto, Scheme 1) derived from 6‐(benzo[d]thiazol‐2′‐yl)‐2‐(N,N‐dimethylamino) naphthalene (BTDAN) as the fluorophore, with a boronate‐based carbamate leaving group as the H2O2 reactive trigger. BTDAN shows good TP properties and has been applied in TP probes for metal ions, thiols, and enzymes,15, 16 and the boronate‐based carbamate linkage is widely used as the reaction site for H2O2.12c We expected that the cleavage of H2O2‐triggered boronate and electron‐poor carbamate linkage would release the more electron‐rich structure 1, which shows red‐shifting of the emission spectrum (Scheme 1).
Scheme 1.

Structures of SHP‐Cyto and 1.
The detailed synthetic procedure of SHP‐Cyto is described in the Supporting Information. The solubility of SHP‐Cyto, as determined by the fluorescence method,17 was 4 μm in MOPS buffer (30 mm MOPS, 100 mm KCl, pH 7.4), which is enough to label cells (Figure S1). Within the soluble range, SHP‐Cyto and 1 showed absorption maxima (λ abs) at 333 nm (ϵ=38,000 m −1 cm−1) and 371 nm (ϵ=21,000 m −1 cm−1), respectively, and fluorescence maxima (λ fl) at 455 nm (Φ=1.00) and 528 nm (Φ=0.70), respectively (Table 1).
Table 1.
Photophysical data for SHP‐Cyto and 1 in buffer.[a]
| Compound | λ (1) max (10‐4 ϵ)[b] | λ fl max [c] | Φ[d] | λ (2) max [e] | Φδ [f] |
|---|---|---|---|---|---|
| SHP‐Cyto | 333 (3.80) | 455 | 1.00 | 740 | 14 |
| 1 | 371 (2.10) | 528 | 0.70 | 750 | 104 |
[a] All data were measured in MOPS buffer (30 mM MOPS, 100 mM KCl, pH 7.4) unless otherwise noted. [b] λ max of the one‐photon absorption spectra in [nm]. The numbers in parentheses are molar extinction coefficients in [m −1 cm−1]. [c] λ max of the one‐photon emission spectra in [nm]. [d] Fluorescence quantum yield, ±15 %. [e] The peak two‐photon cross section in 10−50 cm4 s photon−1 (GM), ±15 %. [f] Two‐photon action cross‐section.
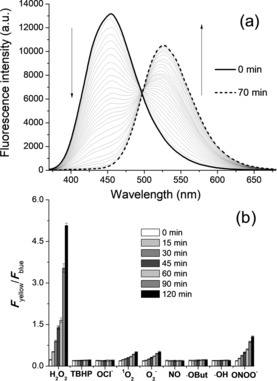
Reaction of SHP‐Cyto with H2O2 produced 1 as the reaction product, as detected by the emission spectra (Figure 1 a). Upon addition of 1 mm H2O2 to the MOPS buffer, the emission spectra at 455 nm of SHP‐Cyto (1 μm) decreased, whereas that at 528 nm increased gradually as a result of the formation of 1. This process followed pseudo‐first‐order kinetics with k obs=1.2×10⁻³ s−1 (Figure S2). A similar value was reported in previously developed H2O2 probes.14 Furthermore, F yellow/F blue (530–600 nm/400–470 nm), the ratio of the emission intensities, increased 217‐fold (Figure 1 a). This result indicates that the emission ratio of SHP‐Cyto is highly sensitive to changes in H2O2 level, and this sensitivity is higher than those reported in previous studies.14 The detection limit of H2O2 with SHP‐Cyto is 4.0 μm (Figure S3). Moreover, SHP‐Cyto has high selectivity for H2O2 over competing biological species, ROS, and RNS, as shown by unchanged F yellow/F blue ratios following the addition of 200 μm of diverse ROS and RNS, including tert‐butylhydroperoxide (TBHP), superoxide (O2 −), hypochlorite (OCl−), tert‐butoxy radicals (⋅OtBu), nitric oxide (NO), hydroxyl radicals (⋅OH), and peroxynitrite (ONOO−) (Figure 1 b). SHP‐Cyto and 1 also exhibit pH insensitivity over the biologically relevant pH range (Figure S4). These results indicate that SHP‐Cyto is useful as a ratiometric fluorescent probe for H2O2 with minimal interference from other ROS and RNS or from changes in pH.
Figure 1.

a) One‐photon fluorescence response with time for the reactions of SHP‐Cyto (1 μm) with H2O2 (1 mm). Spectra were acquired at 0 to 70 min after addition of H2O2. b) Fluorescence responses of 1 μm SHP‐Cyto to various reactive oxygen and nitrogen species (200 μm). Bars represent the integrated fluorescence ratios F yellow/F blue at 0 to 120 min after addition of each reactive species. Data were acquired at 25 °C in 30 mm MOPS, pH 7.4, with excitation wavelength 370 nm.
Next, we estimated the ability of SHP‐Cyto to detect H2O2 in TP measurements. The TP action (Φδ) spectra of SHP‐Cyto and 1 in MOPS buffer at pH 7.4 showed Φδ max values of 14 and 106 GM at 740 and 750 nm, respectively (Figure S5). 1 exhibited a 7.6‐fold higher Φδ max value than SHP‐Cyto, in part as a result of enhanced intramolecular charge transfer between the donor and acceptor (vide supra).18
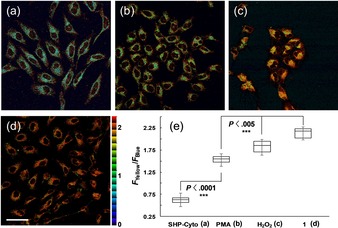
Subsequently, we applied SHP‐Cyto as a TP probe to monitor changes in H2O2 levels in cellular environments. For confirmation of its utility in live‐cell imaging, SHP‐Cyto was used to label HeLa cells. The emission ratio images were generated from two emission channels, 400–470 nm (F blue) and 530–600 nm (F yellow), upon TP excitation at 750 nm, and the emission ratios (F yellow /F blue) were 0.57 and 2.18 for SHP‐Cyto and 1, respectively (Figures 2 a 2 d,and 2 e). The F yellow /F blue ratio was increased 3.8‐fold, and its values were larger than those obtained in previous studies, confirming the high sensitivity of SHP‐Cyto as a H2O2 probe. In addition, SHP‐Cyto showed high sensitivity to changes in H2O2 levels: the F yellow /F blue ratio increased to 1.49 upon pretreatment with phorbol myristate acetate (PMA), which induces H2O2 generation through a cellular inflammation process,19 and to 1.85 when the cells were pretreated with 200 μm H2O2 for 30 min (Figures 2 b, 2 c,and 2 e). The F yellow /F blue ratios were considerably smaller when cells were pretreated with PMA than with excess H2O2. In contrast, the F yellow /F blue ratios were very similar for the mitochondrial‐selective H2O2 probe, that is, SHP‐Mito‐labeled cells pretreated with excess H2O2 and PMA.14b This result distinguishes SHP‐Cyto from SHP‐Mito in the detection of H2O2 in cytosolic enviroments. In addition, SHP‐Cyto was found to be non‐toxic to HeLa cells within incubation concentrations, as determined by MTS [3‐(4,5‐dimethylthiazol‐2‐yl)‐5‐(3‐carboxymethoxyphenyl)‐2‐(4‐sulfophenyl)‐2H‐tetrazolium] assay (Figure S6). Futhermore, SHP‐Cyto showed sufficient photostability in HeLa cells for 1 h in two emission detection windows (Figure S7). These results indicate that SHP‐Cyto is capable of detecting H2O2 levels in live cells.
Figure 2.

Pseudo‐colored ratiometric TPM images (F yellow/F blue) of Hela cells incubated with 3 μm a) SHP‐Cyto and d) 1. Cells were pretreated with b) PMA (1 μg mL−1) for 30 min and c) 200 μm H2O2 for 30 min. e) Box plot of average F yellow/F blue in (a)–(d). Images were acquired by using 750 nm excitation and fluorescent emission windows: blue 400–470 nm, yellow 530–600 nm. Scale bar=60 μm. Cells shown are representative images from replicate experiments (n=5).
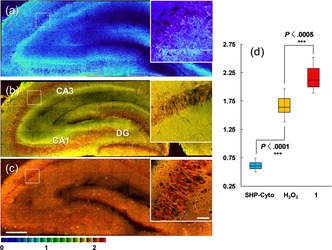
To further confirm the applicability of SHP‐Cyto for bioimaging applications, we applied the probe to the detection of changes in H2O2 levels deep inside live tissue. Hippocampus tissue slices were taken from 2‐week‐old rats, and a slice was labeled with 10 mm SHP‐Cyto for 1 h at 37 °C. A tile‐scanned ratiometric TPM image with 40× magnification was captured and a part of this slice reveals the CA1, CA3, and DG regions (Figures 3 b). Hippocampus slice tissues are well known to have an inhomogeneous structure. For that reason, we accumulated 20 TPM images from the two emission channels (F blue, F yellow) at depths of 90–180 μm to visualize the overall H2O2 distribution in the tissue. Upon pretreatment of the tissue with 1 mm H2O2, the ratio increased gradually from 0.57 to 1.63 (Figures 3 a, 3 b,and 3 d), which lies between the ratios measured in SHP‐Cyto‐ and 1‐labeled tissues (Figure 3). Therefore, SHP‐Cyto is responsive to changes in H2O2 levels in live tissue. Interestingly, the changes in emission ratios measured deep inside the rat brain tissue are comparable to those measured in cultured cells. Moreover, the expanded ratiometric image (white box in whole slice tissue image) clearly reveals the H2O2 distribution in the individual cells in the CA3 region at a depth of approximately 120 μm (Figures 3 a–c). These outcomes demonstrate that SHP‐Cyto is capable of detecting changes in H2O2 levels in live tissues at depths of 90–180 μm when using TPM.
Figure 3.

Tile‐scanned ratiometric TPM images of a rat hippocampal slice stained with a) 10 μm SHP‐Cyto and c) 1, and b) pretreated with 1 mm H2O2 for 30 min before labeling with 20 μm SHP‐Cyto. A total of 15 ratiometric TPM images were accumulated along the z direction at depths of approximately 90–180 μm with magnification at 40×. The white boxes show enlarged images of the regions in red boxes in (a)–(c) at 120 μm depth. d) Box plot of average F yellow/F blue in (a)–(c). The TPEF were collected at two channels (blue 400–470 nm, yellow 530–600 nm) upon excitation at 750 nm with a femtosecond pulse. Scale bars: 300 μm (a)–(c) and 75 μm (inset).
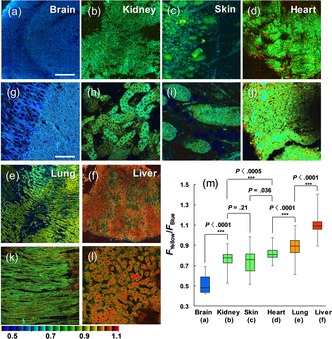
Finally, we measured the H2O2 distribution in several rat organ tissues: brain, kidney, skin, heart, lung, and liver tissues taken from 2‐week‐old rats. The 20 ratio images of the SHP‐Cyto‐labeled tissues were accumulated and their emission ratios (F yellow /F blue) were analyzed (Figure 4 a–f). The average levels of F green /F blue in response to H2O2 in the brain, kidney, skin, heart, lung, and liver tissues were 0.48, 0.76, 0.77, 0.81, 0.89, and 1.09, respectively (Figure 4 m), indicating differences in H2O2 level between the organ tissues.20, 21 This result suggests the utility of SHP‐Cyto for the detection of the H2O2 level in various live tissues by ratiometric TPM imaging.
Figure 4.

Ratiometric TPM images of the a, g) brain, b, h) kidney, c, i) skin, d, j) heart, e, k) lung, and f, l) liver tissues of rat organs. All tissues were labelled with 20 μm SHP‐Cyto and a–f) 20 ratiometric TPM images were accumulated along the z direction at the depths of approximately 90–180 μm with magnification at 40×. g–l) Enlarged images of (a)–(f) at 120 μm depth. m) Box plot of average F yellow/F blue in (a)–(l). The TPEF were collected at two channels (blue 400–470 nm, yellow 530–600 nm) upon excitation at 750 nm with a femtosecond pulse. Scale bars: 500 μm (a)–(f) and 75 μm (g)–(l).
To conclude, we have developed a new ratiometric TP probe (SHP‐Cyto), which shows a high TP cross‐section, a noticeable blue‐to‐yellow emission color change with high sensitivity to H2O2 levels, and high stability over the biologically relevant pH range. This TP probe is able to measure H2O2 levels quantitatively in live cells and deep inside various rat organ tissues. The ratiometric TPM images with SHP‐Cyto revealed that H2O2 levels gradually increase from brain to kidney, skin, heart, lung, and then liver organ tissues. These results indicate that this probe will be useful for applications in studies on the biological role of H2O2 and for the diagnosis of various diseases.
Conflict of interest
The authors declare no conflict of interest.
Supporting information
As a service to our authors and readers, this journal provides supporting information supplied by the authors. Such materials are peer reviewed and may be re‐organized for online delivery, but are not copy‐edited or typeset. Technical support issues arising from supporting information (other than missing files) should be addressed to the authors.
Supplementary
Acknowledgements
This work was supported by grants from the National Research Foundation (NRF) funded by the Korean Government (2016R1E1A1A02920873, 2013R1A6A3A04058351, and 20090093826), and the Ajou University research fund.
C. S. Lim, M. K. Cho, M. Y. Park, H. M. Kim, ChemistryOpen 2018, 7, 53.
References
- 1.
- 1a. Ward J. F., Evans J. W., Limoli C. L., Calabro-Jones P. M., Br. J. Cancer Suppl. 1987, 55, 105–112; [PMC free article] [PubMed] [Google Scholar]
- 1b. Imlay J. A., Annu Rev Biochem 2008, 77, 755–776. [DOI] [PMC free article] [PubMed] [Google Scholar]
- 2.
- 2a. Finkel T., Serrano M., Blasco M. A., Nature 2007, 448, 767–774; [DOI] [PubMed] [Google Scholar]
- 2b. Barnham K. J., Masters C. L., Bush A. I., Nat. Rev. Drug. Discov. 2004, 3, 205–214; [DOI] [PubMed] [Google Scholar]
- 2c. Lin M. T., Beal M. F., Nature 2006, 443, 787–795. [DOI] [PubMed] [Google Scholar]
- 3.
- 3a. Turrens J. F., J. Physiol. 2003, 552, 335–344; [DOI] [PMC free article] [PubMed] [Google Scholar]
- 3b. Dickinson B. C., Chang C. J., Nat. Chem. Biol. 2011, 7, 504–511. [DOI] [PMC free article] [PubMed] [Google Scholar]
- 4.
- 4a. Harman D., Proc. Natl. Acad. Sci. USA 1981, 78, 7124–7128; [DOI] [PMC free article] [PubMed] [Google Scholar]
- 4b. Finkel T., Holbrook N. J., Nature 2000, 408, 239–247; [DOI] [PubMed] [Google Scholar]
- 4c. Stadtman E. R., Free Radical Res. 2006, 40, 1250–1258. [DOI] [PubMed] [Google Scholar]
- 5. Gerich F. J., Funke F., Hildebrandt B., Fasshauer M., Muller M., Pflugers. Arch. 2009, 458, 937–952. [DOI] [PMC free article] [PubMed] [Google Scholar]
- 6. Carvalho F., Duarte J. A., Neuparth M. J., Carmo H., Fernandes E., Remiao F., Bastos M. L., Arch. Toxicol. 2001, 75, 465–469. [DOI] [PubMed] [Google Scholar]
- 7.
- 7a. Dong X., Heo C. H., Chen S., Kim H. M., Liu Z., Anal. Chem. 2013, 86, 308–311; [DOI] [PubMed] [Google Scholar]
- 7b. Mao Z., Jiang H., Li Z., Zhong C., Zhang W., Liu Z., Chem. Sci. 2017, 8, 4533–4538. [DOI] [PMC free article] [PubMed] [Google Scholar]
- 8.
- 8a. Nie J., Liu Y., Niu J., Ni Z., Lin W., J. Photochem. Photobiol. A 2017, 348, 1–7; [Google Scholar]
- 8b. Liu Y., Niu J., Nie J., Meng F., Lin W., New J. Chem. 2017, 41, 3320–3325; [Google Scholar]
- 8c. Ren M., Deng B., Zhou K., Kong X., Wang J. Y., Lin W., Anal. Chem. 2017, 89, 552–555. [DOI] [PubMed] [Google Scholar]
- 9.
- 9a. Cheng D., Pan Y., Wang L., Zeng Z., Yuan L., Zhang X., Chang Y. T., J. Am. Chem. Soc. 2017, 139, 285–292; [DOI] [PubMed] [Google Scholar]
- 9b. Yuan L., Wang L., Agrawalla B. K., Park S. J., Zhu H., Sivaraman B., Peng J., Xu Q. H., Chang Y. T., J. Am. Chem. Soc. 2015, 137, 5930–5938; [DOI] [PubMed] [Google Scholar]
- 9c. Lee S. W., Rhee H. W., Chang Y. T., Hong J. I., Chem. Eur. J. 2013, 19, 14791–14794. [DOI] [PubMed] [Google Scholar]
- 10.
- 10a. Li J., Lim C. S., Kim G., Kim H. M., Yoon J., Anal. Chem. 2017, 89, 8496–8500; [DOI] [PubMed] [Google Scholar]
- 10b. Sedgwick A. C., Sun X., Kim G., Yoon J., Bull S. D., James T. D., Chem. Commun. 2016, 52, 12350–12352; [DOI] [PubMed] [Google Scholar]
- 10c. Yang Y., Huo F., Yin C., Xu M., Hu Y., Chao J., Zhang Y., Glass T. E., Yoon J., J. Mater. Chem. B 2016, 4, 5101–5104; [DOI] [PubMed] [Google Scholar]
- 10d. Xu Q., Heo C. H., Kim J. A., Lee H. S., Hu Y., Kim D., Swamy K. M. K., Kim G., Nam S. J., Kim H. M., Yoon J., Anal. Chem. 2016, 88, 6615–6620. [DOI] [PubMed] [Google Scholar]
- 11.
- 11a. Xie X., Yang X., Wu T., Li Y., Li M., Tan Q., Wang X., Tang B., Anal. Chem. 2016, 88, 8019–8802; [DOI] [PubMed] [Google Scholar]
- 11b. Bortolozzi R., Gradowski S. V., Ihmels H., Schäfer K., Viola G., Chem. Commun. 2014, 50, 8242–8245; [DOI] [PubMed] [Google Scholar]
- 11c. Zhang W., Liu T., Huo F., Ning P., Meng X., Yin C., Anal. Chem. 2017, 89, 8079–8083. [DOI] [PubMed] [Google Scholar]
- 12.
- 12a. Dickinson B. C., Chang C. J., J. Am. Chem. Soc. 2008, 130, 9638–9639; [DOI] [PMC free article] [PubMed] [Google Scholar]
- 12b. Dickinson B. C., Tang Y., Chang Z., Chang C. J., Chem. Biol. 2011, 18, 943–948; [DOI] [PMC free article] [PubMed] [Google Scholar]
- 12c. Lippert A. R., Van De Bittner G. C., Chang C. J., Acc. Chem. Res. 2011, 44, 793–804; [DOI] [PMC free article] [PubMed] [Google Scholar]
- 12d. Carroll V., Michel B. W., Blecha J., VanBrocklin H., Keshari K., Wilson D., Chang C. J., J. Am. Chem. Soc. 2014, 136, 14742–14745; [DOI] [PMC free article] [PubMed] [Google Scholar]
- 12e. Fu X., Tang Y., Dickinson B. C., Chang C. J., Chang Z., Biochem. Biophys. Res. Commun. 2015, 458, 896–900; [DOI] [PubMed] [Google Scholar]
- 12f. Tomalin L. E., Day A. M., Underwood Z. E., Smith G. R., Dalle Pezze P., Rallis C., Patel W., Dickinson B. C., Bähler J., Brewer T. F., Free Radical Biol. Med. 2016, 95, 333–348. [DOI] [PMC free article] [PubMed] [Google Scholar]
- 13.
- 13a. Zipfel W. R., Williams R. M., Webb W. W., Nat. Biotechnol. 2003, 21, 1369–1377; [DOI] [PubMed] [Google Scholar]
- 13b. Helmchen F., Denk W., Nat. Methods 2005, 2, 932–940; [DOI] [PubMed] [Google Scholar]
- 13c. Kim H. M., Cho B. R., Chem. Rev. 2015, 115, 5014–5055. [DOI] [PubMed] [Google Scholar]
- 14.
- 14a. Chung C., Srikun D., Lim C. S., Chang C. J., Cho B. R., Chem. Commun. 2011, 47, 9618–9620; [DOI] [PMC free article] [PubMed] [Google Scholar]
- 14b. Masanta G., Heo C. H., Lim C. S., Bae S. K., Cho B. R., Kim H. M., Chem. Commun. 2012, 48, 3518–3520. [DOI] [PubMed] [Google Scholar]
- 15.
- 15a. Kim H. J., Lim C. S., Lee H. W., Lee H. S., Um Y. J., Kumar H., Han I., Kim H. M., Biomaterials 2017, 141, 251–259; [DOI] [PubMed] [Google Scholar]
- 15b. Bae S. K., Heo C. H., Choi D. J., Sen D., Joe E. H., Cho B. R., Kim H. M., J. Am. Chem. Soc. 2013, 135, 9915–9923. [DOI] [PubMed] [Google Scholar]
- 16.
- 16a. Lee H. W., Heo C. H., Sen D., Byun H. O., Kwak I. H., Yoon G., Kim H. M., Anal. Chem. 2014, 86, 10001–10005; [DOI] [PubMed] [Google Scholar]
- 16b. Park S. J., Lee H. W., Kim H., Kang C., Kim H. M., Chem. Sci. 2016, 7, 3703–3709. [DOI] [PMC free article] [PubMed] [Google Scholar]
- 17. Kim H. M., Choo H. J., Jung S. Y., Ko Y. G., Park W. H., Jeon S. J., Kim C. H., Joo T., Cho B. R., ChemBioChem 2007, 8, 553–559. [DOI] [PubMed] [Google Scholar]
- 18. Kim H. M., Cho B. R., Chem. Commun. 2009, 2, 153–164. [Google Scholar]
- 19. Carreras M. C., Pargament G. A., Catz S. D., Poderoso J. J., Boveris A., FEBS Lett. 1994, 341, 65–68. [DOI] [PubMed] [Google Scholar]
- 20.
- 20a. Wilhelm J., Frydrychova M., Vizek M., Physiol. Res. 1999, 48, 445–449; [PubMed] [Google Scholar]
- 20b. Piotrowski W. J., Pietras T., Kurmanowska Z., Nowak D., Marczak J., Marks-Konczalik J., Mazerant P., J Appl. Toxicol. 1996, 16, 501–507. [DOI] [PubMed] [Google Scholar]
- 21.
- 21a. Halliwell B., Clement M. V., Long L. H., FEBS Lett. 2000, 486, 10–13; [DOI] [PubMed] [Google Scholar]
- 21b. Szatrowski T. P., Nathan C. F., Cancer Res. 1991, 51, 794–798. [PubMed] [Google Scholar]
Associated Data
This section collects any data citations, data availability statements, or supplementary materials included in this article.
Supplementary Materials
As a service to our authors and readers, this journal provides supporting information supplied by the authors. Such materials are peer reviewed and may be re‐organized for online delivery, but are not copy‐edited or typeset. Technical support issues arising from supporting information (other than missing files) should be addressed to the authors.
Supplementary


