Summary
Synaptotagmin, complexin and neuronal SNARE proteins mediate evoked synchronous neurotransmitter release, but the molecular mechanisms mediating the cooperation between these molecules remain unclear. Here, we determined crystal structures of the primed pre-fusion SNARE-complexin-synaptotagmin-1 complex. These structures reveal an unexpected tripartite interface between synaptotagmin-1 and both the SNARE complex and complexin. Simultaneously, a second synaptotagmin-1 molecule interacted with the other side of the SNARE complex via the previously identified primary interface. Mutations that disrupt either interface in solution also severely impaired evoked synchronous release in neurons, suggesting that both interfaces are essential for the primed pre-fusion state. Ca2+ binding to the synaptotagmin-1 molecules unlocks the complex, allows full zippering of the SNARE complex, and triggers membrane fusion. The tripartite SNARE-complexin-synaptotagmin-1 complex at a synaptic vesicle docking site has to be unlocked for triggered fusion to commence, explaining the cooperation between complexin and synaptotagmin-1 in synchronizing evoked release on the sub-millisecond timescale.
During synaptic transmission, Ca2+ influx into a presynaptic terminal triggers fusion of neurotransmitter-filled synaptic vesicles with the presynaptic plasma membrane1,2. The SNARE (for Soluble N-ethylmaleimide sensitive factor Attachment protein REceptor) proteins synaptobrevin-2/VAMP2 on the synaptic vesicle and syntaxin-1A and SNAP-25 on the plasma membrane initiate vesicle fusion by forming a trans-SNARE complex before Ca2+ triggering3,4. In addition to SNAREs, synaptotagmin-1 (Syt1) is vital for Ca2+-triggered synaptic vesicle fusion5,6. Syt1 contains a single transmembrane-spanning domain and two C-terminal cytoplasmic C2 domains, termed C2A and C2B, respectively (or C2AB together)7,8. Syt2 and Syt9 are also involved in evoked synchronous neurotransmitter release for subsets of neurons9, while Syt7 mediates asynchronous release10,11.
Syt1 interacts with both anionic membranes and SNARE complexes12–23. In addition to Syt1, the SNARE complex interacts with complexin (Cpx), a small soluble protein that both activates evoked release and suppresses spontaneous release24. Syt1, Cpx and SNAREs cooperate to activate synchronous release upon action potential arrival in the synaptic terminal25,26 and regulate spontaneous release27,28. The previously determined structures of the SNARE-Cpx complex29 and of the Syt1-SNARE complex21, along with functional studies, suggested that each binary interaction is essential for evoked release, but these studies explained neither the cooperativity between Syt1, Cpx, and SNAREs, nor the dominant-negative effect certain Syt1 C2B domain mutations30,31.
Pre-fusion complex of SNAREs, Cpx, and Syt1
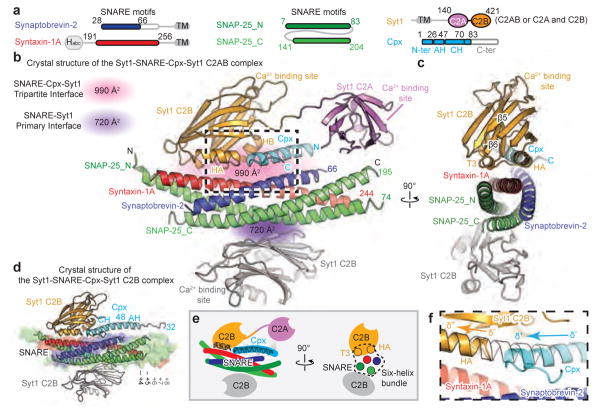
We designed a soluble trans-SNARE complex mimetic suitable for structural studies by truncating the C-terminal end of the synaptobrevin-2 SNARE motif two layers past the central ionic zero layer, thus preventing full zippering of the SNARE complex (Fig. 1a). We co-crystallized this trans-SNARE complex mimetic with a Syt1 C2AB fragment (or with separate C2A, C2B domains) and a Cpx fragment that is fully active in evoked release (amino acids 1–83) in order to capture the primed pre-fusion state. Crystal structures of these complexes were determined in two different crystal forms to 1.85 Å resolution (co-crystallized with the C2AB fragment, referred to as Syt1-SNARE-Cpx-Syt1 C2AB crystal structure) and 2.5 Å resolution (co-crystallized with both C2A, C2B domains, referred to as Syt1-SNARE-Cpx-Syt1 C2B crystal structure) (Fig. 1 and Extended Data Table 1).
Figure 1. Crystal structures of the Syt1-SNARE-Cpx-Syt1 complex.
a, Domain diagrams. The numbers delineate the boundaries of the fragments used for crystallization. TM: transmembrane region. b, Cartoon representation of the Syt1-SNARE-Cpx-Syt1 C2AB crystal structure. The Syt1 C2B domain (orange), Cpx (cyan), and the SNARE complex (blue, red, green) form the tripartite interface. A second Syt1 C2B domain (grey, related by crystallographic symmetry) forms the primary interface with the SNARE complex21. For clarity, we omitted the C2A domain of the Syt1 molecule involved in the primary interface (Extended Data Fig. 1c). c, Rotated view of panel b, showing a section that includes 310 helix T3 and α-helix HA of the Syt1 C2B domain. d, Cartoon representation of the Syt1-SNARE-Cpx-Syt1 C2B crystal structure. The molecular surface of the complete SNARE complex structure (PDB code 1N7S) is superimposed. e, Schema of the Syt1-SNARE-Cpx-Syt1 C2AB crystal structure. f, Close-up view of the tripartite interface (same orientation as in panel b), showing the continuation of α-helix HA of the Syt1 C2B domain into the central α-helix of Cpx. Helical dipoles are indicated by δ+ and δ−.
By design, the C-terminal ends of the syntaxin-1A and SNAP-25 components are partially unstructured in the absence of the C-terminal residues of the synaptobrevin-2 SNARE motif (Fig. 1a, b, d). With the exception of the unstructured C terminal region, the structure of the truncated SNARE complex superimposes well on the structure of the fully assembled SNARE complex32 (PDB code 1N7S, root-mean-square difference (r.m.s.d.) = 0.63 Å).
The SNARE-Cpx-Syt1 tripartite interface
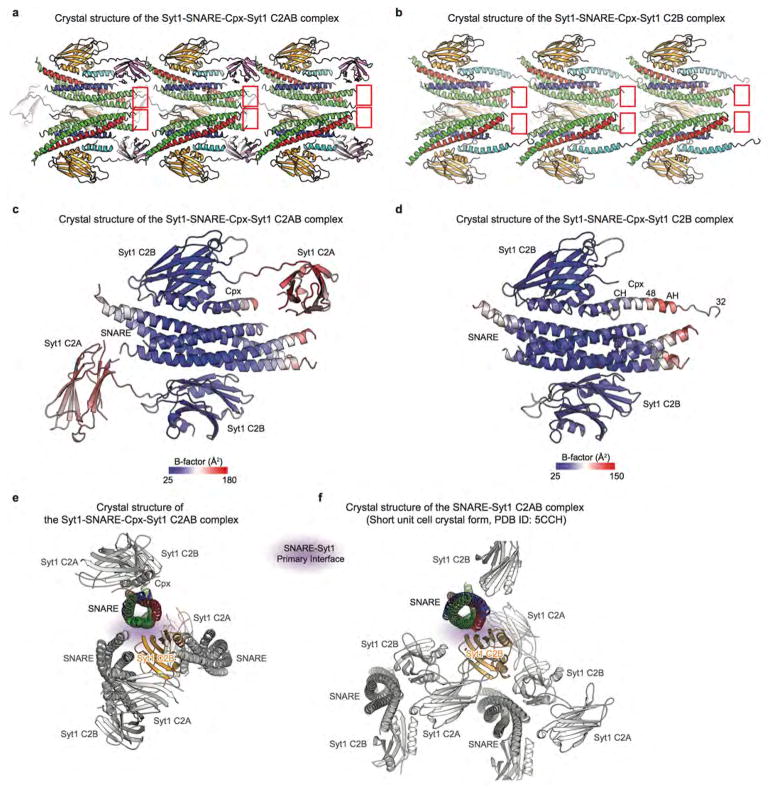
Both crystal structures contain the previously identified “primary” interface between Syt1 C2B and the SNARE complex21 (Fig. 1 and Supplementary Video 1), illustrating structural conservation in different molecular packing environments (r.m.s.d = 0.39 Å, Extended Data Fig. 1e, f). More importantly, the new structures reveal a novel tripartite interface between a second C2B domain, the SNARE complex, and the Cpx central α-helix (Fig. 1b–d, Supplementary Video 1) (referred to as SNARE-Cpx-Syt1 tripartite interface). The tripartite interface is very similar in both crystal forms (r.m.s.d. = 0.30 Å) (Fig. 1b, d, Extended Data Fig. 1a, b).
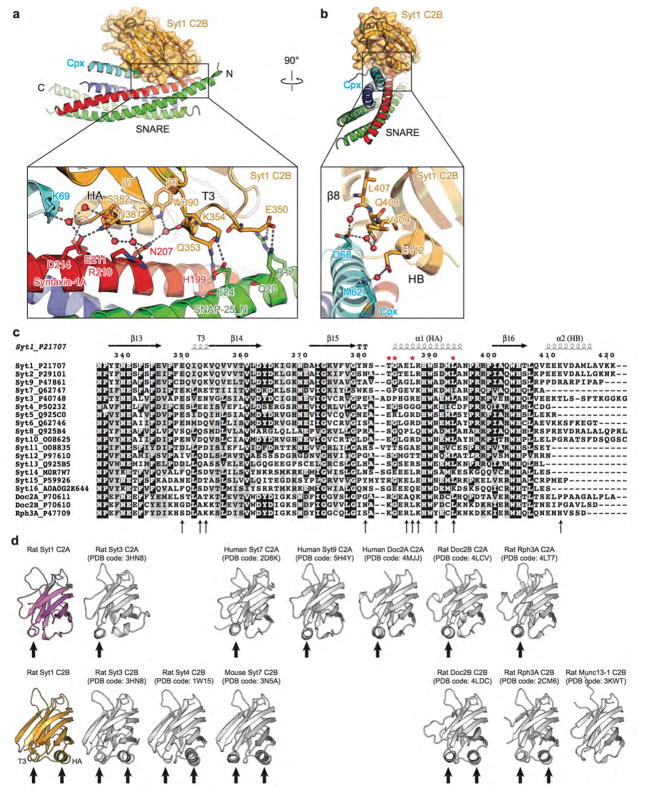
The interactions between the Cpx central α-helix and the SNARE complex are similar to those found in the SNARE-Cpx subcomplex29,33,34. The Syt1 C2B domain of the tripartite interface binds to this SNARE-Cpx subcomplex by forming a large interface (interface area 990 Å2) with both the SNARE and Cpx components (Fig. 1b–e). Strikingly, the α-helix HA of the Syt1 C2B domain extends the Cpx central α-helix (Fig. 1b–f) and, together with the short 310 helix T3 of the Syt1 C2B domain and the SNARE complex, forms a six-helix bundle (Fig. 1c, e). The HA helix is structurally conserved in known structures of C2B domains of all synaptotagmins, Doc2 and rabphilin3A, but is absent from synaptotagmin C2A domains or Munc13 C2 domains (Extended Data Fig. 2d).
The tripartite interface does not involve Ca2+ binding sites, implying Ca2+-independent binding. The residues involved in either the SNARE-Cpx-Syt1 tripartite or the Syt1-SNARE primary interfaces have relatively low temperature B factors (Extended Data Fig. 1c, d), suggesting genuine stable interactions.
The tripartite interface is specific
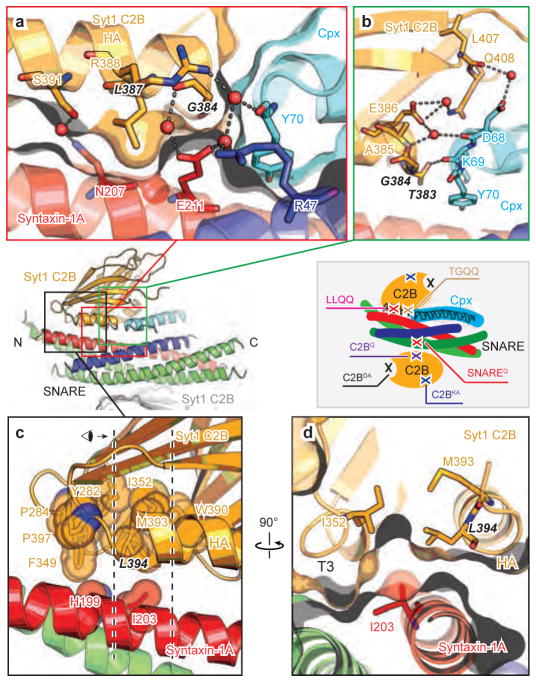
There is excellent shape complementarity between the molecules involved in the SNARE-Cpx-Syt1 tripartite interface (Fig. 2a–d, Extended Data Fig. 2a, b, and Supplementary Video 1). In addition, specificity is conferred by hydrogen bonds and salt bridges between the C-terminal end of the Cpx central α-helix and the N-termini of the Syt1 C2B HA and syntaxin-1A SNARE motif helices (Fig. 2a, b), and by a large hydrophobic interface (Fig. 2c, d). Primary sequence alignments show that residues that are involved in specific sidechain interactions are highly conserved in Syt1, 2, and 9, i.e., isoforms that are involved in fast evoked release (Extended Data Fig. 2c). There are several ordered water molecules at the periphery of the interface between the Syt1 C2B domain and the SNARE-Cpx subcomplex (Fig. 2a, b), and a few that are involved in contacts between Syt1 C2B and syntaxin-1A (Extended Data Fig. 2a). Consequently, the buried interface area of the tripartite interface is largely independent of all ordered water molecules.
Figure 2. Close-up views of the SNARE-Cpx-Syt1 tripartite interface.
a–d, Interacting residues are shown in stick representation and labelled, water molecules are shown as red balls, hydrogen bonds and salt bridges are shown as dashed lines. Molecular surfaces are shown in panels a and d. a, interactions between the α-helix HA of the Syt1 C2B domain and syntaxin-1A. Leu387 in Syt1 C2B protrudes into the cavity of syntaxin-1A and Ser391 in Syt1 C2B forms a water-mediated hydrogen bond with Gln207 in syntaxin-1A. b, Close-up view of the interactions between the N-terminal end of the α-helix HA of the Syt1 C2B domain and the C-terminal end of the Cpx central α-helix. The main chain carboxyl of Asp68 in Cpx forms hydrogen bonds with the main chain of Glu386 in the Syt1 C2B domain and is involved in water-mediated hydrogen bonds with the side chain of the same residue. The main chain carboxyl of Lys69 in Cpx interacts with side chain Oγ of Thr383 in the Syt1 C2B domain, while the main chain of Gly384 in Syt1 C2B domain is involved in water-mediated hydrogen bonds with the side chain of Glu211 in syntaxin-1A. c and d, Close-up views of a region of hydrophobic interactions involved in the tripartite interface. Hydrophobic residues are shown in sphere representation. Dashed lines in panel c indicate the depth of the section shown in panel d. Inset, schema showing the approximate locations of the mutations.
A large hydrophobic interface connects the Syt1 C2B domain (including the C-terminal end of α-helix HA and the short 310 helix T3) to syntaxin-1A (Fig. 2c). Several residues of this interface participate in three hydrophobic layers of the abovementioned six-helix bundle (Fig. 1c, e). In particular, Syt1 residues Leu394 and I352 form a hydrophobic coiled-coil like interaction with syntaxin-1A residue Ile203 (Fig. 2d). In addition, α-helix HB of C2B and the loop between β8 and HB also interact with Cpx (Extended Data Fig. 2b).
Specific mutations disrupt the tripartite interface
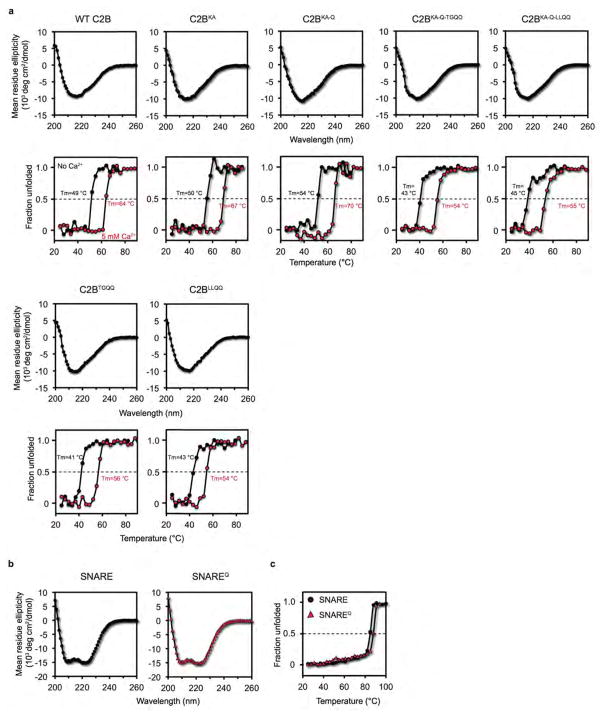
To test the functional significance of the SNARE-Cpx-Syt1 tripartite interface, we designed two sets of mutations. The L387Q/L394Q mutations (referred to as LLQQ mutant) were chosen to disrupt the hydrophobic interaction that is an integral part of the interface between α-helix HA of Syt1 C2B and the SNARE complex, while the T383Q/G384Q mutations (referred to as TGQQ mutant) were chosen to disrupt interactions at the periphery of the interface (Fig. 2a–d, Supplementary Video 2). We also tested potential interactions that involve the polybasic region of Syt1 C2B by mutating two Lys residues (K326A/K327A, referred to as KA mutant) in order to disrupt any dynamic binding modes involving the highly charged polybasic region20,22. All mutants of the Syt1 C2B domain are properly folded (Fig. 2, Extended Data Fig. 3, and Methods). Additionally, we used the quintuple mutations of the primary interface in the Syt1 C2B domain (R281A/E295A/Y338W/R398A/R399A, referred to as C2BQ or quintuple mutant) and the SNARE complex (SNAP-25 K40A/D51A/E52A/E55A/D166A, referred to as SNAREQ mutant) in order to selectively disrupt the Syt1-SNARE primary interface and to study the tripartite interaction without the background of the primary interface21.
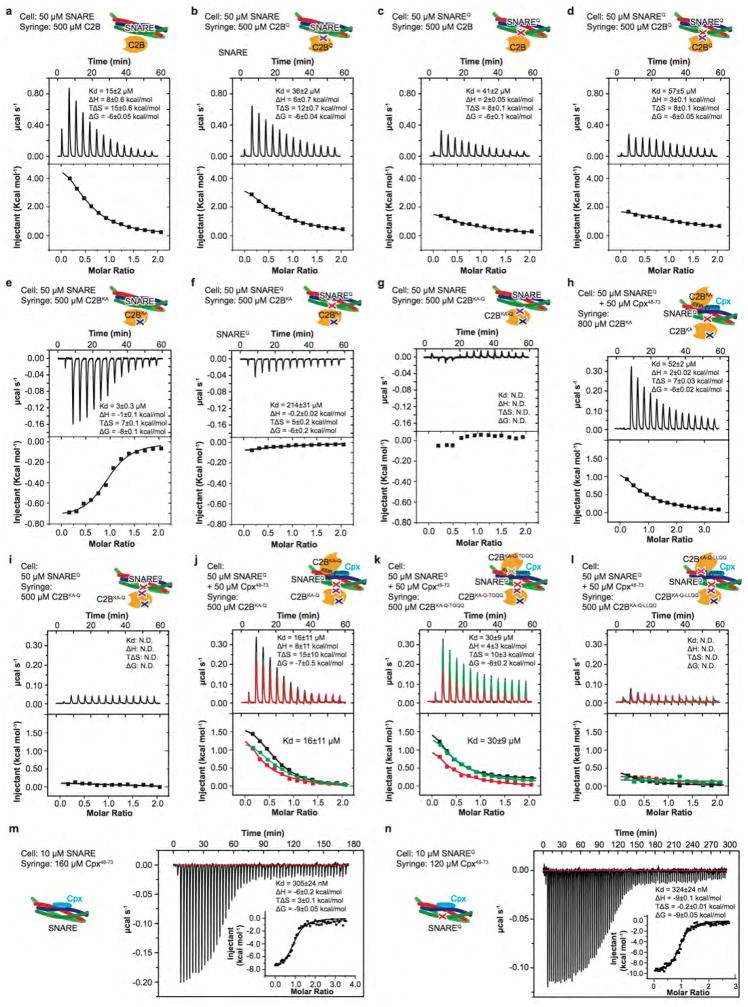
We performed ITC experiments to characterize the effect of these mutations on the various molecular interactions in solution in the absence of Ca2+ (Fig. 3, Extended Data Fig. 4). Injection of the wildtype Syt1 C2B domain into a cell containing the wildtype SNARE complex produced an endothermic heat trace (Fig. 3b, c, Extended Data Fig. 4a). The quintuple mutation of the primary interface in the SNARE complex and the Syt1 C2B domain did not abolish binding (Fig. 3a–c, Extended Data Fig. 4b, d), suggesting that multiple interactions between the Syt1 C2B domain and the SNARE complex occur in solution (Extended Data Fig. 5). The KA mutant of the Syt1 C2B domain (C2BKA) produced an exothermic heat of injection trace that could be well fit to a first order reaction (Fig. 3a–c, Extended Data Fig. 4e). Upon additional mutation of the primary interface, little binding was observed between Syt1 C2BKA and the SNAREQ complex, and between Syt1 C2BKA-Q and the SNARE complex (Fig. 3b, c, Extended Data Fig. 4e–g), suggesting that the only significant interactions in solution in the absence of Ca2+ are the primary Syt1-SNARE interaction21 and promiscuous interactions involving the polybasic interface of Syt1 C2B (Extended Data Fig. 5). Although each of these individual interactions with the polybasic region may be considerably weaker than the primary interface, collectively they will dominate the overall ITC binding trace, obscuring the specific binding signal. In the presence of anionic phospholipid membranes, the membrane interactions stabilize the Syt1-SNARE primary interface21, lowering the dissociation constant, Kd, to 0.9 μM (ref.23). Moreover, the localization of Syt1 to the same membrane as synaptobrevin may further lower the dissociation constant in the physiological context.
Figure 3. Probing the interfaces between the SNARE complex and the Syt1 C2B domain by ITC.
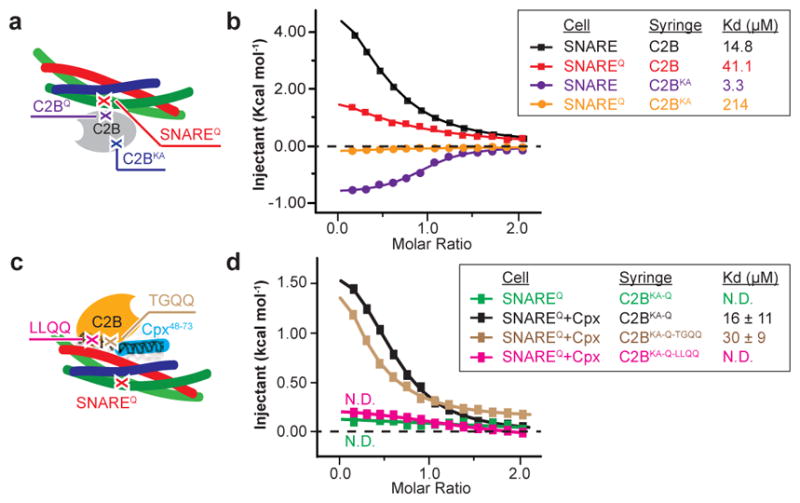
a and c, Schema showing the approximate locations of the mutations used for ITC experiments in panel b and d, separately. b, ITC binding traces and dissociation constants (inset) of the Syt1 C2B domain and C2BKA mutant titrated into the SNARE or SNAREQ complex. d, Sample ITC binding traces and dissociation constants (inset) of the Syt1 C2B domain and its mutants titrated into the SNAREQ complex or the SNAREQ-Cpx complex. Three independent experimental repeats were performed, and standard deviations (SD) of the dissociation constants are provided. N.D., not detectable. Extended Data Fig. 4 shows further ITC data and analyses.
To test the SNARE-Cpx-Syt1 tripartite interface in solution, we combined the quintuple mutants of the primary interface and the KA mutant of the polybasic region (Syt C2BKA-Q, SNAREQ) since these combined mutations disrupt the Syt1-SNARE primary interface and the weak interactions involving the polybasic region of the Syt1 C2B domain, resulting in total loss of SNARE binding to the Syt1 C2B domain in the absence of Cpx (Fig. 3d–f, Extended Data Fig. 4i). Upon addition of the Cpx central α-helix, we observed an exothermic binding trace (Kd = 16 ± 11 μM; Fig. 3e, f), consistent with formation of the tripartite interface. Indeed, the LLQQ mutant diminished this binding, whereas the TGQQ mutant – that only affects peripheral interactions between the molecules – did not affect the tripartite interface (Kd = 30 ± 9 μM; Fig. 2a, b, 3e, f).
Evoked release requires the tripartite interface
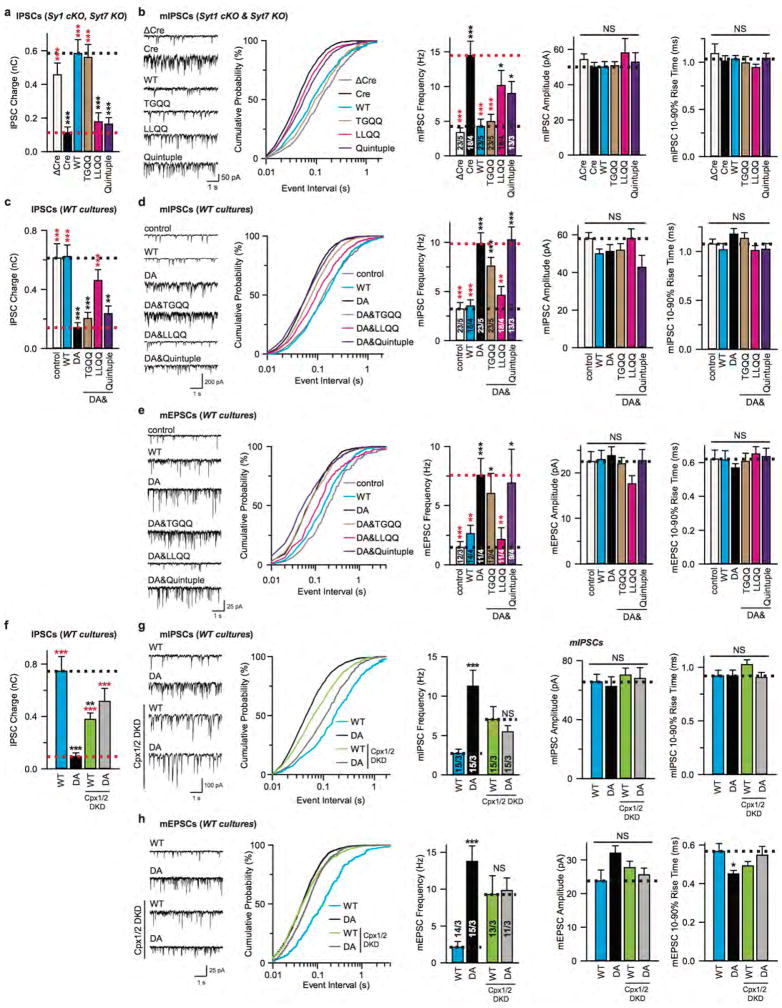
To determine the physiological role of the SNARE-Cpx-Syt1 tripartite interface in neurons, wildtype Syt1 and its TGQQ, LLQQ mutants were separately expressed in cultured cortical neurons derived from double mutant mice harboring Syt1 conditional and Syt7 constitutive KO alleles21,30. Consistent with a previous report11, Syt7 KO neurons maintained normal synchronous synaptic release, while double removal of Syt1/7 suppressed synchronous and asynchronous release and increased spontaneous mini release, as indicated by the decreased amplitude of evoked inhibitory postsynaptic currents (IPSCs; Fig. 4a) and the increased frequency of miniature IPSCs (mIPSCs; Extended Data Fig. 6b). These phenotypes could be fully rescued by expression of wildtype Syt1 (Syt1WT) or TGQQ mutant Syt1, but not by LLQQ mutant Syt1 (Fig. 4a, Extended Data Fig. 6a, b), consistent with our ITC binding studies that showed that the LLQQ, but not the TGQQ mutant abolishes the tripartite interface (Fig. 3). Therefore, the tripartite interface plays an indispensable role in synaptic release. Besides LLQQ, the quintuple mutant (Syt1Quintuple), which disrupts the Syt1-SNARE primary interface, also failed to rescue synaptic release (Fig. 4a, Extended Data Fig. 6a, b), as previously reported21. Taken together, our results indicate that Syt1-mediated Ca2+-triggering of evoked-synchronous release and inhibiting of spontaneous release commonly require both the primary and tripartite interfaces.
Figure 4. Ca2+-triggering of release by Syt1 requires both the SNARE-Cpx-Syt1 and Syt1-SNARE interfaces.
a, Recordings of IPSCs from cultured cortical neurons with Syt1 conditional KO and Syt7 constitutive KO, infected with lentiviruses expressing ΔCre/Cre recombinase and WT Syt1 or Syt1 mutants. b and c, IPSCs and EPSCs from wildtype cultured cortical neurons infected with lentiviruses expressing Syt1 mutants. d and e, Recordings of IPSCs and EPSCs from cultured cortical neurons infected with lentiviruses expressing Syt1WT or Syt1DA, without or with lentiviruses expressing Cpx1/2 shRNAs (Cpx1/2 DKD). Sample traces (left) and quantification of peak amplitudes (right) of evoked IPSCs (a, b, d) or of EPSCs (c, e) elicited by single action potentials. Quantifications of IPSC charge transfer from the same neurons are shown in Extended Data Fig. 6a, c, f. Shown are means ± s.e.m; the number of neurons/independent cultures are indicated. Statistical significance was assessed by Student’s t test (**P < 0.01; ***P < 0.001; NS, no significant difference) with respect to either the Cre (red) or the Cre+Syt1 group (black) in panel a, either the control (black) or the Syt1DA group (red) in panels b and c, between Syt1WT and Syt1DA with or without Cpx1/2 DKD in panels d and e.
Ca2+ binding is essential for the function of the tripartite interface
To further test the physiological significance of the primary and tripartite interfaces, we recorded synaptic responses in cultured WT cortical neurons, with expression of either exogenous wildtype or D309A/D363A/D365A-mutant (Syt1DA) Syt1. Syt1DA abolishes Ca2+-dependent liposome binding to the Syt1 C2B domain35, and expression of Syt1DA in WT neurons blocks both endogenous Syt1 and Syt7 function, thus suppressing evoked neurotransmitter release30 (Fig. 4b, c) and prompting us to examine whether Syt1DA is dominant negative for release by locking the SNARE-Cpx-Syt1 tripartite complex into place. We tested the effect of the additional TGQQ, LLQQ, and quintuple mutations on the dominant-negative activity of Syt1DA (Fig. 2). While Syt1WT in cultured WT neurons induced no phenotype, Syt1DA expression as expected reduced the amplitudes of both evoked IPSCs (Fig. 4b) and evoked excitatory postsynaptic currents (EPSCs; Fig. 4c), and increased the frequencies of both mIPSCs (Extended Data Fig. 6d) and miniature EPSCs (mEPSCs; Extended Data Fig. 6e).
Remarkably, the dominant-negative activity of Syt1DA was eliminated by the LLQQ mutant but not by the TGQQ mutant (Fig. 4b, c, Extended Data Fig. 6c–e), indicating the importance of the tripartite interface for the Syt1DA dominant-negative phenotypes. Conversely, the Syt1Quintuple mutation of the primary interface had no effect on the Syt1DA phenotype (Fig. 4b, c, Extended Data Fig. 6c–e), indicating that the Syt1-SNARE primary interface is not involved in producing the dominant negative effect of Syt1DA.
Inhibition of spontaneous release by Syt1 depends on both the tripartite and primary interfaces (Extended Data Fig. 6d, e), i.e., elimination of either interface resulted in an increase in mini frequency. The increased mini release in Syt1-deficient neurons is mediated by another Ca2+-sensor with a lower Ca2+-cooperativity than typically observed with synaptotagmins26. Consistent with this observation, we found that the increased mini release induced by dominant-negative Syt1DA expression and measured as mIPSCs was blocked by the LLQQ mutations and by the intracellular Ca2+ chelator BAPTA-AM (Extended Data Fig. 7).
The role of Cpx in the tripartite interface
The LLQQ mutant prevented the control of synaptic release by Syt1 (Fig. 4a–c). However, the LLQQ mutant only probed the interaction between α-helix HA of Syt1 C2B and the SNARE complex. To further probe the role of Cpx in the SNARE-Cpx-Syt1 tripartite interface, we asked whether complexin is required for the dominant-negative lock imposed on release by mutant Syt1DA. We combined exogenous Syt1 expression with Cpx1/2 double knockdown (DKD) in WT neuron as previously described25,36. Again, compared to Syt1WT, exogenous Syt1DA expression severely suppressed the amplitude of IPSCs (Fig. 4d) and EPSCs (Fig. 4e), and increased the frequency of mIPSCs (Extended Data Fig. 6g) and mEPSCs (Extended Data Fig. 6h).
In WT neurons with exogenous Syt1WT expression, the Cpx1/2 DKD partially decreased the evoked IPSC and EPSC amplitudes, and increased mIPSC and mEPSC frequencies (Fig. 4d, e, Extended Data Fig. 6f–h)25. However, in WT neurons with exogenous Syt1DA expression, the Cpx1/2 DKD partially reversed the massive dominant-negative effect of Syt1DA. As a result, synaptic responses in Cpx1/2 DKD neurons were identical in neurons with Syt1WT and Syt1DA expression. Considering the milder effect of Cpx1/2 DKD than expression of Syt1DA, this result cannot be explained by saturation due to overexpression. Rather, the dominant negative effect of the Syt1DA mutant requires Cpx, consistent with the tripartite interface observed in our crystal structures. The Cpx1/2 DKD is expected to greatly reduce SNARE-Cpx-Syt1 tripartite complexes, and, in turn, to reduce the effect of the dominant negative Syt1DA mutant. Interestingly, the phenotypes of expression of Syt1WT or SytDA with Cpx1/2 DKD are not as severe as the Cpx1/2 DKD alone25, suggesting that both exogenously expressed Syt1WT or SytDA in WT neurons can partially compensate for the Cpx deletion.
The readily-releasable pool requires both interfaces
We measured the presynaptic readily-releasable pool (RRP) of synaptic vesicles, thought to correspond to vesicles primed in a pre-fusion state, in cultured cortical neurons by monitoring IPSCs induced by hypertonic sucrose, which stimulates Ca2+-independent exocytosis of all primed synaptic vesicles30. Consistent with earlier studies30, Syt7 KO neurons maintained normal sucrose-induced release, while double removal of Syt1/7 induced a ~60% decrease (Fig. 5a). This decreased RRP could be fully rescued by expression of either Syt1WT or Syt1DA or Syt1DA&TGQQ, but neither by Syt1DA&LLQQ nor by Syt1DA&Quintuple (Fig. 5a). Thus, both the primary and tripartite interfaces are surprisingly required for supporting the RRP, suggesting that both are required for fusion competence.
Figure 5. Unlocking and triggering the primed Syt1-SNARE-Cpx-Syt1 complex.
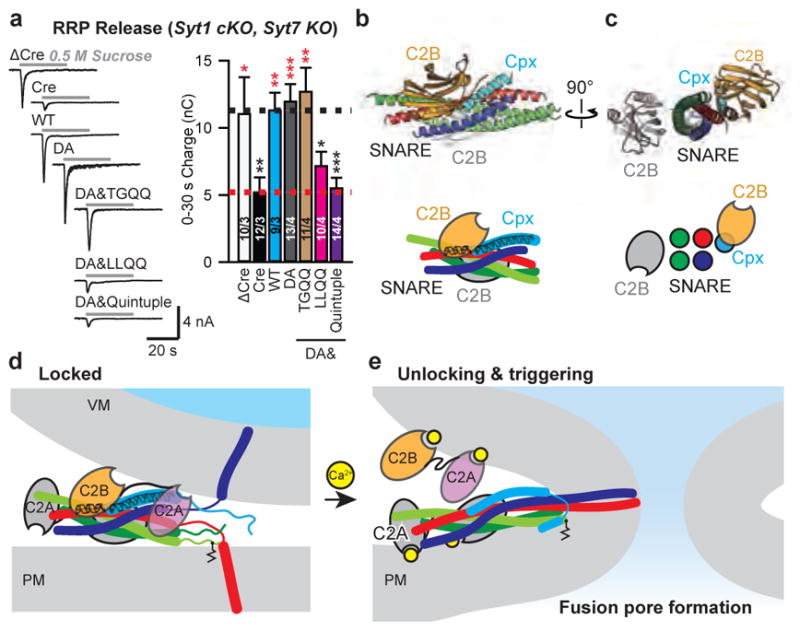
a, Recordings of IPSCs evoked by a 30-s application of 0.5 M hypertonic sucrose to induce exocytosis of RRP from cultured cortical neurons with Syt1 conditional KO and Syt7 constitutive KO. Cultures were infected with lentiviruses expressing ΔCre/Cre recombinase and WT Syt1 or Syt1 mutants. Sample traces (left) and summary graph of the IPSC charge transfers from RRP (right). Shown are means ± s.e.m; the number of neurons/independent cultures are indicated. Statistical significance was assessed by Student’s t test (*P < 0.05; **P < 0.01; ***P < 0.001) with respect to either the Cre (marked in red) or the Cre+Syt1 group (black). b and c, Orthogonal views (cartoon representation, upper; schema, lower) of the Syt1-SNARE-Cpx-Syt1 crystal structure with the membrane interacting elements of the primary Syt1/SNARE subcomplex located in a plane perpendicular to the page. d, Model of a primed Syt1-SNARE-Cpx-Syt1 (“Locked”) complex situated between the synaptic vesicle and plasma membranes. e, Upon unlocking and Ca2+-triggering, fusion occurs. For clarity, we omitted the transmembrane domains of the Syt1 molecules. Two or more such complexes are likely involved (e.g., Extended Data Fig. 9).
Discussion
Two Syt1 molecules simultaneously interact with two binding interfaces on opposite sides of the SNARE complex, the SNARE-Cpx-Syt1 tripartite interface discovered here and the previously described primary interface (Fig. 1). Both binding interfaces are essential for Ca2+-triggered neurotransmitter release (Figs. 3,4): when the tripartite interface is disrupted while the primary interface is intact, or vice versa, little evoked release occurs (Fig. 4a), suggesting that both the primary and tripartite interfaces are required for Ca2+-triggered synaptic vesicle fusion. The functional role of the two interfaces, however, is different.
The Syt1-SNARE primary interface is specific for fast Ca2+ sensors (Syt1, Syt2, Syt9)21,9. In contrast, the newly discovered tripartite interface may be a more general interface involving other synaptotagmins given the sequence conservation of the T3 and HA helices (Fig. 1e) among all synaptotagmin C2B domains (Extended Data Fig. 2d). Different types of synaptotagmin-regulated exocytosis are mediated by similar Cpx-dependent fusion mechanisms9,37–39, so it is conceivable that these other synaptotagmins could participate in a tripartite interface.
The tripartite interface involves the central α-helix, but not the accessory helix of Cpx or any other part of Cpx (Fig. 1b, Extended Data Fig. 8a–c). Previous in vitro fusion experiments showed that the accessory domain can be entirely eliminated while maintaining the activating function of Cpx, i.e., the N-terminal and central domains of Cpx can be reconstituted as separate fragments40. Our Syt1-SNARE-Cpx-Syt1 structures now explain the functional requirement of the central α-helix of Cpx since it is an integral part of the tripartite interface, while the Cpx N-terminal domain can independently interact with the splayed-open trans-SNARE complex41.
We propose that the structure of the Syt1-SNARE-Cpx-Syt1 complex is the pre-fusion state of the complex (Fig. 5b, c). The tripartite interface at the same time activates and “locks” the complex, keeping the energized trans-SNARE complex half zippered and the membranes apart, thereby preventing membrane fusion (Fig. 5d). Consistent with this model of the primed state, constitutive insertion of Cpx into the SNARE complex locks release42, and inclusion of Cpx increases the separation between membranes in a reconstituted system as observed by electron cryo-tomography43.
The Ca2+-binding loops of the C2 domains in the crystal structures of the primed complex are not involved in the primary and tripartite interfaces. Upon Ca2+-binding to the C2 domains of the primed complex, we propose that the tripartite interface is unlocked, allowing Ca2+-triggered fusion to proceed. Upon Ca2+-binding, the Syt1 molecule that is involved in the tripartite interface probably triggers a cascade of molecular rearrangements, including dissolution of the tripartite interface (Fig. 5e) with possible liberation of Cpx42. In the crystal structure, the Syt1 C2A domain of the tripartite complex is close to the Cpx core helix and the C-terminus of the synaptobrevin-2 SNARE motif (Fig. 5d), and is flexibly linked to the C2B domain (Extended Data Fig. 8d). Thus, the C2A domain might cooperate with the C2B domain in either process, consistent with importance of the Ca2+-binding sites of both the C2A and C2B domains in neurotransmitter release26. There are likely two or more synaptic complexes involved in Ca2+-triggered fusion that could potentially interact with each other. For example, one Syt1 C2B domain could bridge two SNARE complexes via the primary and tripartite interfaces (Extended Data Fig. 9). Moreover, the presence of the membranes will likely affect the conformation of the pre-fusion complex. Upon unlocking the primed complex, the trans-SNARE complex will fully zipper up and trigger fusion, possibly in conjunction with Ca2+-dependent membrane-bending action of all C2A and C2B domains – including those of the primary interface – as previously proposed21 (Fig. 5e).
The Syt1-SNARE-Cpx-Syt1 structure explains why the Cpx DKD or DKO, and the Syt1 KO impair Ca2+-evoked release since the primed state of the system cannot form. Similarly, if the Syt1DA mutant is bound to a particular complex, the complex is primed, but the Syt1DA mutant is unable to unlock the complex. When some of the tripartite interfaces that participate in a docked synaptic vesicle remain locked, triggered fusion cannot occur, which explains the dominant negative phenotype of the Syt1DA mutant. Taken together, we thus propose an atomic model that accounts for vesicle priming and the cooperation between Cpx, Syt1, and SNAREs in synchronizing and activating evoked release on the sub-millisecond timescale.
Methods
No statistical methods were used to predetermine sample size. No formal randomization process was used for all experiments. Experiments described in Figs. 4, 5a and Extended Data Figs. 6, 8 were blinded to allocation and outcome assessments; all other experiments were not randomized and investigators were not blinded.
Expression and purification of recombinant proteins
For the trans-SNARE complex mimetic used in the crystallizations, the decimal-histdine-tagged and C-terminally truncated rat synaptobrevin-2 fragment (amino acid range 28–66), the rat syntaxin-1A fragment (amino acid range 191–256), the rat SNAP-25_N fragment (amino acid range 7–83) and the rat SNAP-25_C fragment (amino acid range 191–256) were cloned into the Duet expression system (Novagen) following previous work with the neuronal SNARE complex44 (Fig. 1a, Extended Data Fig. 1a). These four protein constructs were co-expressed in Escherichia coli, leading to complex formation in the host (referred to as trans-SNARE complex mimetic). Specifically, E. coli BL21(DE3) were grown overnight at 37 °C using auto-inducing LB medium45. After harvesting the cells by centrifugation, the pellet was re-suspended in lysis buffer (50 mM Tris-HCl, pH8.0, 300 mM NaCl, 20 mM imidazole, 0.5 mM TCEP) and was subjected to sonication and centrifugation. The cleared lysate was bound to Ni-NTA agarose beads (Qiagen) equilibrated in the lysis buffer. Beads were harvested by centrifugation and poured into a column, washed with the lysis buffer, urea buffer (50 mM Tris-HCl, pH 8.0, 300 mM NaCl, 60 mM imidazole, 0.5 mM TCEP, 7.5 M urea) and wash buffer (50 mM Tris-HCl, pH8.0, 300 mM NaCl, 60 mM imidazole, 0.5 mM TCEP). The trans-SNARE complex mimetic was eluted with the lysis buffer supplemented with additional 330 mM imidazole. The fresh eluent of the Ni-NTA affinity purified trans-SNARE complex mimetic was supplemented with tabacco etch virus (TEV) protease and dialysed against buffer A1 (50 mM Tris-HCl, pH8.0, 50 mM NaCl, 0.5 mM TCEP, 1 mM EDTA) overnight at 4 °C. After removal of uncleaved sample, the His-tag-free complex was subjected to anion exchange chromatography (buffer A1: 50 mM Tris-HCl, pH8.0, 50 mM NaCl, 0.5 mM TCEP, 1 mM EDTA, buffer B1: 50 mM Tris-HCl, pH8.0, 500 mM NaCl, 0.5 mM TCEP, 1 mM EDTA) using a linear gradient of NaCl starting at 50 mM and ending at 500 mM. The peak was eluted at ~250 mM NaCl. The peak fractions were pooled and concentrated to a final concentration of ~1 mM and stored at −80 °C for crystallization.
For the SNARE complex used for CD and ITC experiments, the decimal-histidine-tagged rat synaptobrevin-2 fragment (amino acid range 28–89), the rat syntaxin-1A fragment (amino acid range 191–256), the rat SNAP-25_N fragment (amino acid range 7–83) and the rat SNAP-25_C fragment (amino acid range 191–256), as well as the quintuple mutation of the SNARE complex (SNAP-25 K40A, D51A, E52A, E55A, D166A, referred to as SNAREQ) were cloned, expressed and purified similarly to the trans-SNARE complex mimetic.
Rat complexin-1 fragment (amino acid range 1–83) with a PreScission protease (GE Healthcare) cleavable N-terminal GST-tag were cloned into the pGEX-6P-1 vector and expressed in E. coli BL21(DE3) cells at 37 °C overnight using autoinducing LB medium45. After harvesting the cells by centrifugation, the pellet was re-suspended in lysis buffer (50 mM HEPES, pH7.5, 300 mM NaCl, 0.5 mM TCEP, 1 mM EDTA) and was subjected to sonication and centrifugation. The cleared lysate was bound to glutathione sepharose beads (GE Healthcare) equilibrated in the lysis buffer. The resin was harvested by centrifugation and poured into a column, extensively washed with the lysis buffer, and subsequently washed with the lysis buffer and wash buffer (50 mM HEPES, pH7.5, 1 M NaCl, 0.5 mM TCEP, 1 mM EDTA). The Cpx fragment was cleaved from the GST moiety by PreScission protease in 10 ml lysis buffer at 4 °C overnight. The protein was eluted from the glutathione sepharose resin with lysis buffer, then concentrated and loaded onto a Superdex 75 10/300 GL column (GE Healthcare) that was pre-equilibrated with SEC buffer (25 mM HEPES, pH7.5, 300 mM NaCl, 0.5 mM TCEP, 1 mM EDTA). The peak fractions were pooled, concentrated and stored at −80 °C.
The rat complexin-1 central α-helix fragment (amino acid range 48–73) was cloned and expressed similarly to the longer Cpx(1–83) fragment. However, it was difficult to concentrate Cpx central α-helix fragment to high concentration. Therefore, the cleaved protein was eluted from the resin with buffer A2 (50 mM MES, pH6.2, 50 mM NaCl, 0.5 mM TCEP, 1 mM EDTA), then purified by cation exchange chromatography on a MonoS column (GE Healthcare) in buffer A2 using a linear gradient from 50 mM to 500 mM NaCl. The peak fractions were pooled and stored at −80 °C.
The rat synaptotagmin-1 C2AB fragment (amino acid range 140–421), C2A domain (amino acid range 140–263), C2B domain (amino acid range 271–421), and mutant Syt1 C2B domains were cloned into the pGEX-6P-1 vector and expressed as GST-tagged fusion proteins in E. coli BL21(DE3) cells at 37 °C 3–4 h firstly, then decreased to 25 °C overnight using auto-inducing LB medium45. After harvesting the cells by centrifugation, the sample was re-suspended in lysis buffer (50 mM HEPES, pH7.5, 300 mM NaCl, 0.5 mM TCEP, 1 mM EDTA) and was subjected to sonication and centrifugation. The supernatant was incubated to glutathione-sepharose beads (GE Healthcare) equilibrated in the lysis buffer. The resin was extensively washed with the lysis buffer, and subsequently washed with the lysis buffer, CaCl2 buffer (50 mM HEPES, pH7.5, 1 M NaCl, 0.5 mM TCEP, 50 mM CaCl2) and wash buffer (50 mM HEPES, pH7.5, 1 M NaCl, 0.5 mM TCEP, 1 mM EDTA). The Syt1 fragments were cleaved from the GST moiety by PreScission protease in 10 ml lysis buffer at 4 °C overnight. The protein was eluted from the resin with lysis buffer. For the Syt1 C2A domain, Syt1 C2BKA-Q mutant, Syt1 C2BKA-Q-TGQQ mutant and Syt1 C2BKA-Q-LLQQ mutant, the fresh eluent was concentrated and loaded onto a Superdex 75 10/300 GL column (GE Healthcare) that was pre-equilibrated with SEC buffer (25 mM HEPES, pH7.5, 300 mM NaCl, 0.5 mM TCEP, 1 mM EDTA). The peak fractions were pooled and concentrated. For other proteins, the fresh eluent was dialysis in buffer A2 at 4 °C 3–4 h and purified by cation exchange chromatography on a MonoS column (GE Healthcare) in buffer A2 using a linear gradient from 50 mM to 500 mM NaCl. The peak fractions were pooled and stored at −80 °C.
Crystallization, data collection and structure solution
Before setting up crystal trays, the trans-SNARE complex mimetic, Cpx(1–83), and Syt1 C2AB fragment (or both Syt1 C2A and C2B domain fragments) were mixed to obtain a molar ratio of 1:1.2:1.5 and dialyzed in crystallization final buffer (25 mM Tris-HCl, pH8.0, 150 mM NaCl, 50 mM MgCl2, 0.5 mM TCEP) at 4 °C overnight. Crystals were grown by the hanging-drop vapor diffusion method at 20 °C by mixing 2 μl protein solution with equal volume of reservoir solution. Note that the concentration of the trans-SNARE complex mimetic in protein solution was 100–200 μM. For the Syt1-SNARE-Cpx-Syt1 C2AB crystals, the reservoir contained 100 mM HEPES, pH7.4, 15–20% PEG3350, 200 mM ammonium formate. For the Syt1-SNARE-Cpx-Syt1 C2B crystals (co-crystallized with both Syt1 C2A and C2B domain fragments), the reservoir contained 100 mM HEPES, pH7.0, 15–17% PEG3350, 240 mM sodium malonate. Both crystals were flash-frozen in a cryo-protecting solution containing the same constituents as the crystallization condition supplemented with 20% (v/v) glycerol.
Both diffraction data sets (Extended Data Table 1) were collected at beamline 24ID-C of the Advanced Photon Source (APS) at Argonne National Laboratory (Argonne, IL). Diffraction data of the best crystals of both the Syt1-SNARE-Cpx-Syt1 C2AB complex and the Syt1-SNARE-Cpx-Syt1 C2B complex were indexed and integrated using the XDS software46, and scaled and merged using the SCALA program in CCP4 package47.
The phases for both crystal forms were determined by molecular replacement with Phaser48 using the SNARE-Cpx complex (Protein Data Bank (PDB) code 1KIL), the rat Syt1 C2A domain (PDB code 3F04), and the rat Syt1 C2B domain (PDB code 1UOW) as search models. The asymmetric unit consists of one SNARE-Cpx complex and one C2AB fragment for the Syt1-SNARE-Cpx-Syt1 C2AB crystal structure and of one SNARE-Cpx complex and one C2B domain for the Syt1-SNARE-Cpx-Syt1 C2B crystal structure. We did not observe electron density for the Syt1 C2A domain in the Syt1-SNARE-Cpx-Syt1 C2B crystal structure even though it was included in the crystallization condition as a separate fragment. Moreover, the electron density of the C2A domain in the Syt1-SNARE-Cpx-Syt1 C2AB crystal structure is relatively weak, resulting in high B-factors (Extended Data Fig 1c) and suggesting conformational variability of the C2A domain. The N-terminus of Cpx and the C-terminus of the SNARE complex also exhibit relatively high B factors in both structures. The structures were iteratively rebuilt and refined using the programs Coot49, and phenix.refine50 (Extended Data Table 1). Ramachandran analysis with MolProbity51 indicated that 96% (Syt1-SNARE-Cpx-Syt1 C2AB crystal structure), 98% (Syt1-SNARE-Cpx-Syt1 C2B crystal structure) of the residues are in the favored regions and none are in disallowed regions.
Crystal diffraction screening and data collection were carried out at synchrotron facilities that were provided by the Advanced Photon Source (APS) in Argonne, Stanford Synchrotron Radiation Lightsource (SSRL) in Stanford, and the Advanced Light Source (ALS) in Berkeley funded by Department of Energy (DOE) under contract DE-AC02-06CH11357 (APS), DE-AC02-76SF00515 (SSRL), and DE-AC02-05CH11231 (ALS). We thank the staff at these beamlines for help with diffraction data collection. The Northeastern Collaborative Access Team beamlines are funded by the National Institute of General Medical Sciences from the National Institutes of Health (P41 GM103403). The Pilatus 6M detector on 24-ID-C beam line is funded by a NIH-ORIP HEI grant (S10 RR029205). The SSRL Structural Molecular Biology Program is supported by the DOE Office of Biological and Environmental Research, and by the National Institutes of Health, National Institute of General Medical Sciences (including P41GM103393). The contents of this publication are solely the responsibility of the authors and do not necessarily represent the official views of NIGMS or NIH.
Validation and structure analysis
MolProbity51 was used for evaluating the geometry and quality of the models (Extended Data Table 1). All structure figures were prepared with PyMol (http://www.pymol.org). Interface areas were calculated by PISA52; note that the commonly used ‘buried surface area’ is twice the ‘interface area’.
Circular dichroism (CD) spectroscopy
CD measurements were conducted with CD spectrometer Model 202-01 (Aviv Biomedical, Inc.) equipped with a temperature controller. Data were collected with 10 μM samples of wildtype and mutant Syt1 C2B proteins, the SNARE complex, as well as the SNAREQ complex mutant in 10 mM Tris-HCl (pH 8.0), 100 mM NaCl buffer (with 5 mM EGTA or 5 mM CaCl2) over a wavelength range of 200 nm to 260 nm, with 1 nm increments, in a 1 mm path length cell at 25 °C. Temperature denaturation experiments were performed at a wavelength of 216 nm (for C2B and its mutants) or 220 nm (for the SNARE complexes) by increasing the temperature from 25 °C to 100 °C in 3 °C temperature increments, a 2 min temperature equilibration time, and a 3 s averaging time. The fraction of unfolded protein at each temperature was calculated by using the formula (Iobs−If)/(Iu−If), where Iobs is the observed mean residue ellipticity, and Iu and If are the mean residue ellipticities of the unfolded and folded states, respectively. Iu and If were estimated by extrapolation of the linear regions of the extremes of the denaturation curves.
Isothermal titration calorimetry (ITC)
We tested different buffer compostions and protein concentrations for ITC experiments on an ITC200 microcalorimeter (Microcal, GE Healthcare). Best results were obtained when the NaCl concentration was 100 mM, and the protein concentration in the sample cell was higher than 50 μM. These conditions were used for all following ITC experiments. We used the Cpx central α-helix Cpx48-73 in the ITC experiments since it corresponds to the structured part of Cpx in our crystal structures.
Final ITC measurements (shown in Fig. 3a, b, and Extended Data Fig. 4) were carried out on a VP-ITC calorimeter (Microcal, GE Healthcare) at 25 °C. All protein samples were dialyzed against a buffer solution containing 10 mM HEPES (pH 7.4), 100 mM NaCl, and 0.5 mM TCEP three times for 3 hr, 5 hr, and overnight. The final buffer was used as washing buffer for the ITC instrument. Samples were degassed for 10 min before the experiment. The SNARE or SNAREQ complex or SNARE/Cpx48-73 or SNAREQ/Cpx48-73 subcomplex solutions (10–50 μM) were placed in the sample cell. Solutions of Syt1 C2B or its mutants or Cpx48-73 (120–800 μM) were loaded into the syringe. The titration processes were performed by injecting a series of multiple injections of varying volume aliquots of Syt1 C2B (20 μl) or its mutants (20 μl) or Cpx48-73 (5 μl into the SNARE complex, 3 μl into the SNAREQ complex) into the cell. For each experiment, a control run in which the same concentration of Syt1 C2B protein solution was injected into buffer alone was used for baseline subtraction. In addition, control runs with buffer alone titrated into 50 μM SNAREQ/Cpx48-73 subcomplex solution, and C2BKA-Q, C2BKA-Q-TGQQ, C2BKA-Q-LLQQ titrated into 50 μM Cpx48-73 solution were performed. All these controls confirmed that there is no heat of injection by the buffer alone and that the solvents were well matched. Two additional control experiments for SNARE vs. Cpx48-73 and SNAREQ vs. Cpx48-73 were performed (Extended Data Fig. 4m, n). The measured sub-micromolar binding affinities imply that the SNAREQ-Cpx48-73 complex is mostly formed in the experiments that test the tripartite interface since in these experiments we used a cell concentration of 50 μM. Note that the dissociation constant, Kd, for C2BKA titrated into the SNAREQ-Cpx48-73 complex (Extended Data Fig. 4h) is similar to the one for the C2BKA-Q titrated into the SNAREQ-Cpx48-73 complex (Extended Data Fig. 4j), i.e., the tripartite interface is independent of presence of the quintuple mutations in the C2B domain. Data were analyzed with the Affinimeter software and the Origin ITC data analysis software supplied by the instrument manufacturer.
We note that both endothermic and exothermic interactions are often observed for protein-protein interfaces and protein-ligand interactions53–55.
Neuronal cultures
Cortical neurons were cultured from new-born male and female mice for all electrophysiology experiments as previously described56. Briefly, mouse cortices were dissected from postnatal day 1 (P1) of Syt1 cKO/Syt7 KO21,30 or wildtype CD-1 mice, dissociated by papain digestion (10 U/ml) for 20 min at 37 °C, plated on Matrigel-coated circular glass coverslips (12 mm diameter), and cultured in MEM (GIBCO) supplemented with 2mM glutamine (GIBCO), 0.4% w/v glucose (Sigma), 2% B-27 (Gemini), and 5% fetal bovine serum (Atlanta Biological). At DIV1, the culture medium were changed to Neurobasal-A (GIBCO) supplemented with 2mM Glutamine, 2% B-27, and 5% Serum, with 2 μM Ara-C (Sigma) added at DIV3. Neurons were infected with lentiviruses at DIV3-4, and analyzed at DIV13-16. All animal experiments were evaluated and approved by the Stanford University Administrative Panel on Laboratory Animal Care.
Plasmid construction
We used the same lentiviral construct as previously described21 carrying a synapsin promoter, an optional rat Syt1 cDNA, internal ribosome entry site (IRES), and a GFP-Cre recombinase fusion sequence. The control plasmid contained no cDNA, with plasmids carrying the following cDNAs: WT (wildtype), TGQQ (T383Q/G384Q), LLQQ (L387Q/L394Q), Quintuple (R281A/E295A/Y338W/R398A/R399A), DA (D309A/D363A/D365A), DA&TGQQ, DA&LLQQ, DA&Quintuple. The complexin1/2 double KD construct was described previously25.
Lentiviruses production
Lentiviral expression vectors and three helper plasmids (pRSV-REV, pMDLg/pRRE and pVSVG) were co-transfected into HEK293T cells (ATCC, VA), at 6, 2, 2 and 2 μg of DNA per 25 cm2 culture area, respectively57 by using calcium phosphate. Cell-culture supernatants containing the viruses were collected 48 h after transfection and directly used for infection of neurons. All steps were performed under level II biosafety conditions.
Electrophysiological recordings
Recordings were performed in whole-cell patch-clamp mode using concentric extracellular stimulation electrodes58. Evoked synaptic responses were triggered by a bipolar electrode placed 100–150 μm from the soma of neurons recorded. Patch pipettes were pulled from borosilicate glass capillary tubes (Warner Instruments) using a PC-10 pipette puller (Narishige). The resistance of pipettes filled with intracellular solution varied between 2–3 MOhm. After formation of the whole-cell configuration and equilibration of the intracellular pipette solution, the series resistance was adjusted to 8–12 MOhm. Synaptic currents were monitored with a Multiclamp 700B amplifier (Molecular Devices). The frequency, duration, and magnitude of the extracellular stimulus were controlled with a Model 2100 Isolated Pulse Stimulator (A-M Systems) and synchronized with the Clampex 9 data acquisition software (Molecular Devices). The whole-cell pipette solution contained (in mM) 120 CsCl, 5 NaCl, 1 MgCl2, 10 HEPES, 10 EGTA, 0.3 Na-GTP, 3 Mg-ATP and 5 QX-314 (pH 7.2, adjusted with CsOH). The bath solution contained (in mM) 140 NaCl, 5 KCl, 2 MgCl2, 2 CaCl2, 10 HEPES, 10 glucose (pH 7.4, adjusted with NaOH). IPSCs and EPSCs were pharmacologically isolated by adding the AMPA and NMDA receptor blockers CNQX (10 μM) and AP-5 (50 μM), or the GABAA-receptor blocker picrotoxin (100 μM) with AP-5 (50 μM), to the extracellular solution. Spontaneous mIPSCs and mEPSCs were monitored in the presence of tetrodotoxin (1 μM) to block action potentials. Miniature events were analyzed in Clampfit 9 (Molecular Devices) using the template matching search and a minimal threshold of 5 pA and each event was visually inspected for inclusion or rejection by an experimenter blind to the recording condition. Sucrose-evoked release was triggered by a 30-s application of 0.5 M sucrose in the presence of AP-5, CNQX, and TTX, puffed by Picospritzer III (Parker).
Data availability
The coordinates of the atomic models and corresponding structure factors have been deposited in the Protein Data Bank (PDB) under the accession codes 5W5C and 5W5D. All other relevant data are included with the manuscript as source data or Supplementary Videos. The original and/or analysed data sets generated during the current study are available from the corresponding author upon reasonable request.
Extended Data
Extended Data Figure 1. Crystal packing and B-factors.
a and b, Views of the crystal lattice of the Syt1-SNARE-Cpx-Syt1 C2AB (a) and Syt1-SNARE-Cpx-Syt1 C2B (b) crystal structures. The red rectangles highlight the C-terminal ends of the SNARE complexes. They are unstructured and form no crystal contacts in either crystal form. c and d, B-factor coloured cartoon representations of the Syt1-SNARE-Cpx-Syt1 C2AB (c) and Syt1-SNARE-Cpx-Syt1 C2B (d) crystal structures (the second syt1 molecule is related to the first by crystallographic symmetry). Both the primary and tripartite interfaces have low B-factors. e and f, Views of the molecular packing arrangements around the SNARE (coloured) and Syt1 C2B (orange) components that form that primary interface in the SNARE-Syt1 crystal structure (e, PDB code 5CCH) and the Syt1-SNARE-Cpx-Syt1 C2AB crystal structure (f). The molecular packing arrangements around the SNARE and Syt1 C2B components that form that primary interface are vastly different these crystal structures, illustrating that the formation of the primary interface is entirely independent from crystal packing environments. We also note that the protein constructs and crystallization conditions were very different for these structures.
Extended Data Figure 2. Additional details of the Syt1-SNARE-Cpx-Syt1 tripartite interface and primary sequence alignment.
a, Close-up view of the contact interface between a pseudo-helix in Syt1 C2B (including the 310 helix T3 situated between β5 and β6, and the loop between α-helices β7 and HB), syntaxin-1A and SNAP-25_N. Syt1 Lys354 and SNAP-25 Glu24 as well as Syt1 Glu350 and SNAP-25 Arg17 interact via salt bridges. Syt1 Gln353 and syntaxin-1A His199, Syt1 Glu350 and SNAP-25 Gln20 form separate hydrogen bonds. b, Close-up view of the contact site between the HB α-helix of the Syt1 C2B domain and the Cpx central α-helix. Interacting residues are shown as sticks and are labeled, while water molecules are shown as red balls. Dashed lines indicate hydrogen bonds or salt bridges. c, Sequence alignment of rat synaptotagmin isoforms, rat Doc2A/B, and rabphilin3A, for residues around the SNARE-Cpx-Syt1 tripartite interface. The arrows show the residues involved in specific sidechain interactions in the tripartite interface (see also discussion the text). The red stars show the mutated residues used in this study. The alignment was performed using Clustal Omega (http://www.ebi.ac.uk/Tools/msa/clustalo/). The figure was prepared with Boxshade3.21 (http://www.ch.embnet.org/software/BOX_form.html). d, Cartoon representation of the known crystal structures of C2A and C2B domains of synaptotagmin isoforms, Doc2 isoforms, rabphilin3A (Rph), and Munc13-1. The black arrows indicate the presence of the HA or T3 helices in these structures.
Extended Data Figure 3. The Syt1 C2B mutants and the SNAREQ complex are well folded.
a, Top panels: CD spectra of WT and mutant Syt1 C2B domains in the absence of Ca2+. Bottom panels: CD thermal melting curves, monitored at 216 nm in the absence of Ca2+ (black) and in the presence of 5 mM Ca2+ (red). The specified melting temperatures were estimated by the mid-point of the melting curves (Methods). b, CD spectra of WT SNARE complex (left) and SNAREQ (right). c, CD thermal melting curves of WT SNARE complex (black circle) and SNAREQ complex (red triangle), monitored at 220 nm.
Extended Data Figure 4. ITC binding data and analyses.
a–k, Differential power traces and heats of injection traces of the specified samples in the syringe and the cell of the ITC instrument. The experimental conditions are described in the Methods. For panels j-l, three independent experimental repeats were performed, and all ITC data curves are shown; shown are means ± s.e.m. for three independent repeat experiments.. For all other ITC experiments, the error bars were obtained from a fit of the data points of the particular ITC-experiments. The schemas in the insets summarize the mutations used in the particular experiments. The ITC experiments produce well-determined n vales for the following experiments: C2BKA titrated into the SNARE complex (n=0.94±0.02), Cpx48-73 titrated into the SNARE complex (n=0.97±0.02) or the SNAREQ complex (n=0.98±0.01). For the other ITC experiments, it was difficult to achieve high enough concentrations of the injected sample to obtain optimal conditions for reliable determination of n. N.D., not detectable. Experimental conditions are described in the Methods.
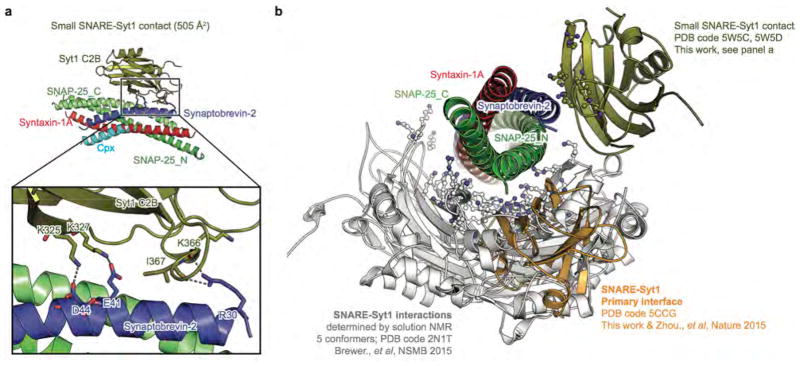
Extended Data Figure 5. Superposition of observed interactions between the Syt1-C2B domain and the SNARE complex in solution and in crystal structures.
a, Close-up view of a small contact between the polybasic region of the Syt1 C2B domain and the SNARE complex in the Syt1-SNARE-Cpx-Syt1 crystal structures. Interacting residues are shown as sticks and are labeled. Dashed lines indicate hydrogen bonds or salt bridges. b, Shown are the primary interface (PDB code 5CCG (ref. 21), and structures in this work), the small contact shown in panel (a), and the deposited 5 conformers derived from solution NMR experiments that involve the polybasic region of Syt1 C2B (sticks-and-balls indicate residues of the polybasic region of Syt1 C2B). These NMR studies revealed that there are dynamic binding modes between the polybasic region of Syt1 C2B and the SNARE complex in solution20. Although other interfaces between Syt1 and SNARE complex have been observed (e.g., secondary and tertiary interfaces in the crystal structure PDB code 5CCG), the ITC data (Extended Data Fig. 4) suggest that these are the only interactions and interfaces that occur in solution (see text).
Extended Data Figure 6. Additional analysis of electrophysiology experiments in neuronal cultures.
a, Quantification of IPSC charge transfer (from the same neurons as in Fig. 4a). b, Recordings of miniature IPSCs (mIPSCs) from cultured cortical neurons with Syt1 conditional KO and Syt7 constitutive KO infected with lentiviruses expressing ΔCre/Cre recombinase and WT Syt1 or Syt1 mutants. Left to right: sample traces, cumulative probability plot of inter-event intervals, and quantification of event frequency, quantification of the amplitude and 10%–90% rise time. c, Quantification of IPSC charge transfer (from the same neurons as in Fig. 4b). d and e, mIPSCs (d) and mEPSCs (e) from cultured cortical neurons infected with lentiviruses expressing Syt1 mutants. Left to right: sample traces, cumulative probability plot of inter-event intervals, and quantification of event frequency, quantification of the amplitude and 10%–90% rise time. f, Quantification of IPSC charge transfer (from the same neurons as in Fig. 4d). g and h, Recordings of mIPSCs and mEPSCs from cultured cortical neurons infected with lentiviruses expressing Syt1WT or Syt1DA, without or with lentiviruses expressing Cpx1/2 shRNAs (Cpx1/2 DKD). Left to right: sample traces, cumulative probability plot of inter-event intervals, and quantification of event frequency, quantification of the amplitude and 10%–90% rise time. Shown are means ± s.e.m; the number of neurons/independent cultures are indicated. Statistical significance was assessed by Student’s t test (*P < 0.05; **P < 0.01; ***P < 0.001; NS, no significant difference) with respect to either the Cre (red) or the Cre+Syt1 group (black) in panels a and b, either the control (black) or the Syt1DA group (red) in panels c–e, between Syt1WT and Syt1DA with or without Cpx1/2 DKD in panels f–h.
Extended Data Figure 7. Syt1DA increases mIPSC frequency in a Ca2+-dependent manner.
Recordings of mIPSCs from cultured cortical neurons infected with lentiviruses expressing Syt1WT or Syt1DA, without or with 10 μM BAPTA-AM preincubated for 30 min at 37 °C. Sample traces (left), cumulative probability plot of inter-event intervals (middle), and quantification of event frequency, amplitude and 10%–90% rise time (right) of mIPSCs. Shown as means ± s.e.m; the number of neurons/independent cultures are indicated. Statistical significance was assessed by Student’s t test (**P < 0.01; ***P < 0.001; NS, no significant difference) with respect to either the Syt1WT (black) or the Syt1DA group (red). The absence of a dominant negative effect of the Syt1DA group on spontaneous release in the presence of BAPTA-AM is consistent with the notion that spontaneous release largely depends on a different Ca2+-sensor. We speculate that this mini-release Ca2+ sensor may compete with Syt1 in binding to the tripartite interface. Elimination of the primary interface or presence of the Syt1DA mutant would affect the binding equilibrium, possibly explaining the increase of spontaneous release. We note that the effect of the Syt1DA mutant on spontaneous release (as assessed by mIPSCs and mEPSCs) is opposite to the effect on evoked release (as assessed by IPSCs and EPSCs) (Fig. 4).
Extended Data Figure 8. Structure comparison of the Syt1-SNARE-Cpx-Syt1 crystal structures and other known crystal structures.
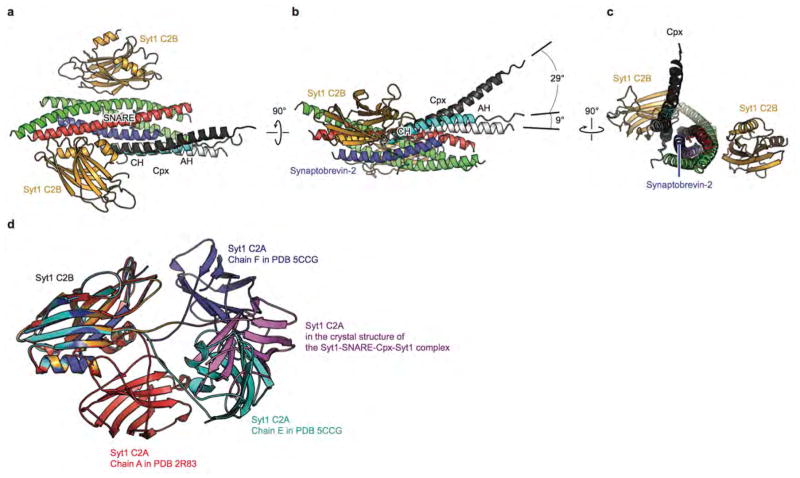
a–c, Conserved and variable regions of the SNARE-Cpx subcomplex in the Syt1-SNARE-Cpx-Syt1 C2B crystal structure (colored), and crystal structures of the SNARE-Cpx subcomplex (PDB code 1KIL29, black and PDB code 3RK334, white). The interaction between the central a-helix of Cpx and the SNARE complex is essentially identical in all crystal structures, while the angle at which the accessory helix protrudes away from the SNARE complex is variable. Such variability was also observed by single molecule fluorescence resonance transfer experiments41. d, The superposition of the Syt1 C2B domain of the Syt1-SNARE-Cpx-Syt1 C2AB crystal structure with crystal structures of uncomplexed C2AB fragments (PDB codes are indicated in the figure) illustrates variability of the position of the C2A domain relative to the C2B domain of Syt1.
Extended Data Figure 9. A possible supramoleular arrangement of one Syt1 C2B molecule bridging two SNARE complexes.
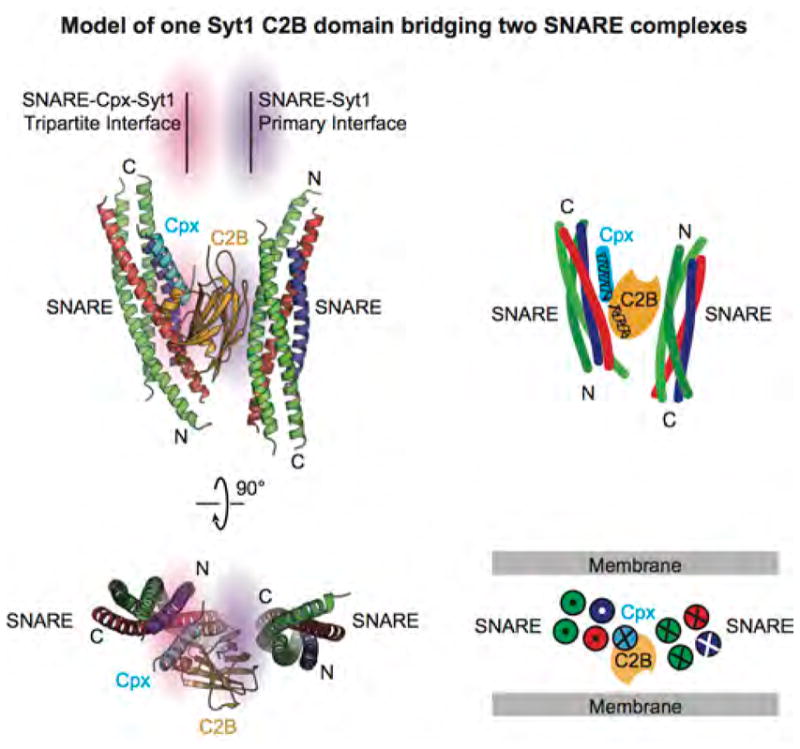
Orthogonal views (cartoon presentation, left; schema, right) of an arrangement where one Syt1 C2B domain bridges two SNARE complexes via the primary and tripartite interfaces, respectively. Directions (N-terminus to C-terminus) of the α-helices of the SNARE complex and Cpx are indicated by crosses (pointing into the page) and dots (pointing out of the page). The bridged complex would be sandwiched between two membranes as suggested in the schema in the lower right panel.
Extended Data Table 1.
Crystallographic data and refinement statistics.
| SNARE-Cpx-Syt1 C2AB | SNARE-Cpx-Syt1 C2B | |
|---|---|---|
| Data collection | ||
| Space group | P21212 | P21212 |
| Cell dimensions | ||
| a, b, c (Å) | 85.7, 89.7, 91.7 | 85.2, 89.2, 87.2 |
| α, β, γ (°) | 90.0, 90.0, 90.0 | 90.0, 90.0, 90.0 |
| Resolution (Å) | 62.6-1.85 (1.92-1.85)# | 44.6-2.5 (2.59-2.50) |
| Rmerge(%) | 9.6 (77.0) | 11.5 (40.8) |
| CC1/2 | 100 (56.6) | 99.7 (91.5) |
| I/σI | 20.6 (0.9) | 17.4 (2.7) |
| Completeness (%) | 99.8 (97.2) | 93.2 (66.1) |
| Redundancy | 17.8 (18.4) | 13.0 (7.3) |
| Refinement | ||
| Resolution (Å) | 62.6-1.85 (1.92-1.85) | 44.6-2.5 (2.59-2.50) |
| No. reflections | 60752 (5849) | 22138 (1537) |
| Rwork/Rfree | 0.194/0.231 | 0.198/0.233 |
| No. of non-hydrogen atoms | ||
| Protein | 3756 | 3113 |
| Mg2+ | 1 | 1 |
| Solvent | 288 | 105 |
| B-factors | ||
| Protein | 77.7 | 69.6 |
| Mg2+ | 69.4 | 73.1 |
| Solvent | 64.2 | 61.0 |
| R.m.s. deviations | ||
| Bond lengths (Å) | 0.016 | 0.003 |
| Bond angles (°) | 1.22 | 0.68 |
Values in parenthesis are for the respective highest-resolution shell.
Supplementary Material
Acknowledgments
We thank P. Gipson, J. Leitz, A. Lyubimov, and W.I. Weis for discussions, S. Muennich and S. Pokutta for assistance with ITC, and support by the National Institutes of Health (R37MH63105 to A.T.B.; P50MH086403 to T.C.S.).
Footnotes
Supplementary Information is linked to the online version of the paper at www.nature.com/nature
Author Contributions Q.Z., P.Z., T.C.S, A.T.B. designed experiments. Q.Z. performed biochemical and structural studies. P.Z., Q.Z. performed electrophysiological studies. A.L.W. assisted with protein purification. D.W. generated cKO mice. M.Z. helped with crystallographic data collection. Q.Z, P.Z., T.C.S, A.T.B. wrote the manuscript.
The authors declare no competing financial interests.
Readers are welcome to comment on the online version of the paper.
References
- 1.Südhof TC. Neurotransmitter release: The last millisecond in the life of a synaptic vesicle. Neuron. 2013;80:675–690. doi: 10.1016/j.neuron.2013.10.022. [DOI] [PMC free article] [PubMed] [Google Scholar]
- 2.Rothman JE. The Principle of Membrane Fusion in the Cell (Nobel Lecture) Angew Chemie - Int Ed. 2014;53:12676–12694. doi: 10.1002/anie.201402380. [DOI] [PubMed] [Google Scholar]
- 3.Sutton RB, Fasshauer D, Jahn R, Brunger AT. Crystal structure of a SNARE complex involved in synaptic exocytosis at 2.4 A resolution. Nature. 1998;395:347–353. doi: 10.1038/26412. [DOI] [PubMed] [Google Scholar]
- 4.Weber T, et al. SNAREpins: Minimal machinery for membrane fusion. Cell. 1998;92:759–772. doi: 10.1016/s0092-8674(00)81404-x. [DOI] [PubMed] [Google Scholar]
- 5.Geppert M, et al. Synaptotagmin I: A major Ca2+ sensor for transmitter release at a central synapse. Cell. 1994;79:717–727. doi: 10.1016/0092-8674(94)90556-8. [DOI] [PubMed] [Google Scholar]
- 6.Fernández-Chacón R, et al. Synaptotagmin I functions as a calcium regulator of release probability. Nature. 2001;410:41–49. doi: 10.1038/35065004. [DOI] [PubMed] [Google Scholar]
- 7.Perin MS, Fried VA, Mignery GA, Jahn R, Südhof TC. Phospholipid binding by a synaptic vesicle protein homologous to the regulatory region of protein kinase C. Nature. 1990;345:260–263. doi: 10.1038/345260a0. [DOI] [PubMed] [Google Scholar]
- 8.Perin MS, et al. Structural and functional conservation of synaptotagmin (p65) in Drosophila and humans. J Biol Chem. 1991;266:615–22. [PubMed] [Google Scholar]
- 9.Xu J, Mashimo T, Südhof TC. Synaptotagmin-1, -2, and -9: Ca2+ Sensors for Fast Release that Specify Distinct Presynaptic Properties in Subsets of Neurons. Neuron. 2007;54:567–581. doi: 10.1016/j.neuron.2007.05.004. [DOI] [PubMed] [Google Scholar]
- 10.Wen H, et al. Distinct roles for two synaptotagmin isoforms in synchronous and asynchronous transmitter release at zebrafish neuromuscular junction. Proc Natl Acad Sci. 2010;107:13906–13911. doi: 10.1073/pnas.1008598107. [DOI] [PMC free article] [PubMed] [Google Scholar]
- 11.Bacaj T, et al. Synaptotagmin-1 and Synaptotagmin-7 Trigger Synchronous and Asynchronous Phases of Neurotransmitter Release. Neuron. 2013;80:947–959. doi: 10.1016/j.neuron.2013.10.026. [DOI] [PMC free article] [PubMed] [Google Scholar]
- 12.Brose N, Petrenko AG, Südhof TC, Jahn R. Synaptotagmin: a calcium sensor on the synaptic vesicle surface. Science. 1992;256:1021–1025. doi: 10.1126/science.1589771. [DOI] [PubMed] [Google Scholar]
- 13.Davletov BA, Südhof TC. A single C2 domain from synaptotagmin I is sufficient for high affinity Ca2+/phospholipid binding. J Biol Chem. 1993;268:26386–26390. [PubMed] [Google Scholar]
- 14.Chapman ER, Davis AF. Direct interaction of a Ca2+-binding loop of synaptotagmin with lipid bilayers. J Biol Chem. 1998;273:13995–14001. doi: 10.1074/jbc.273.22.13995. [DOI] [PubMed] [Google Scholar]
- 15.Fernandez I, et al. Three-dimensional structure of the synaptotagmin 1 C2B-domain: Synaptotagmin 1 as a phospholipid binding machine. Neuron. 2001;32:1057–1069. doi: 10.1016/s0896-6273(01)00548-7. [DOI] [PubMed] [Google Scholar]
- 16.Kuo W, Herrick DZ, Ellena JF, Cafiso DS. The Calcium-Dependent and Calcium-Independent Membrane Binding of Synaptotagmin 1: Two Modes of C2B Binding. J Mol Biol. 2009;387:284–294. doi: 10.1016/j.jmb.2009.01.064. [DOI] [PMC free article] [PubMed] [Google Scholar]
- 17.Choi UB, et al. Single-molecule FRET–derived model of the synaptotagmin 1–SNARE fusion complex. Nat Struct Mol Biol. 2010;17:318–324. doi: 10.1038/nsmb.1763. [DOI] [PMC free article] [PubMed] [Google Scholar]
- 18.Kochubey O, Schneggenburger R. Synaptotagmin Increases the Dynamic Range of Synapses by Driving Ca2+-Evoked Release and by Clamping a Near-Linear Remaining Ca2+ Sensor. Neuron. 2011;69:736–748. doi: 10.1016/j.neuron.2011.01.013. [DOI] [PubMed] [Google Scholar]
- 19.Vrljic M, et al. Post-translational modifications and lipid binding profile of insect cell-expressed full-length mammalian synaptotagmin 1. Biochemistry. 2011;50:9998–10012. doi: 10.1021/bi200998y. [DOI] [PMC free article] [PubMed] [Google Scholar]
- 20.Brewer KD, et al. Dynamic binding mode of a Synaptotagmin-1–SNARE complex in solution. Nat Struct Mol Biol. 2015;22:555–564. doi: 10.1038/nsmb.3035. [DOI] [PMC free article] [PubMed] [Google Scholar]
- 21.Zhou Q, et al. Architecture of the synaptotagmin–SNARE machinery for neuronal exocytosis. Nature. 2015;525:62–67. doi: 10.1038/nature14975. [DOI] [PMC free article] [PubMed] [Google Scholar]
- 22.Pérez-Lara Á, et al. PtdInsP2 and PtdSer cooperate to trap synaptotagmin-1 to the plasma membrane in the presence of calcium. Elife. 2016;5:115–118. doi: 10.7554/eLife.15886. [DOI] [PMC free article] [PubMed] [Google Scholar]
- 23.Wang S, Li Y, Ma C. Synaptotagmin-1 C2B domain interacts simultaneously with SNAREs and membranes to promote membrane fusion. Elife. 2016;5:209–217. doi: 10.7554/eLife.14211. [DOI] [PMC free article] [PubMed] [Google Scholar]
- 24.Mohrmann R, Dhara M, Bruns D. Complexins: Small but capable. Cellular and Molecular Life Sciences. 2015;72:4221–4235. doi: 10.1007/s00018-015-1998-8. [DOI] [PMC free article] [PubMed] [Google Scholar]
- 25.Maximov A, Tang J, Yang X, Pang ZP, Sudhof TC. Complexin Controls the Force Transfer from SNARE Complexes to Membranes in Fusion. Science (80-) 2009;323:516–521. doi: 10.1126/science.1166505. [DOI] [PMC free article] [PubMed] [Google Scholar]
- 26.Xu J, Pang ZP, Shin OH, Südhof TC. Synaptotagmin-1 functions as a Ca2+ sensor for spontaneous release. Nat Neurosci. 2009;12:759–766. doi: 10.1038/nn.2320. [DOI] [PMC free article] [PubMed] [Google Scholar]
- 27.Jorquera RA, Huntwork-Rodriguez S, Akbergenova Y, Cho RW, Littleton JT. Complexin controls spontaneous and evoked neurotransmitter release by regulating the timing and properties of synaptotagmin activity. J Neurosci. 2012;32:18234–45. doi: 10.1523/JNEUROSCI.3212-12.2012. [DOI] [PMC free article] [PubMed] [Google Scholar]
- 28.Dhara M, et al. Complexin synchronizes primed vesicle exocytosis and regulates fusion pore dynamics. J Cell Biol. 2014;204:1123–1140. doi: 10.1083/jcb.201311085. [DOI] [PMC free article] [PubMed] [Google Scholar]
- 29.Chen X, et al. Three-Dimensional Structure of the Complexin/SNARE Complex. Neuron. 2002;33:397–409. doi: 10.1016/s0896-6273(02)00583-4. [DOI] [PubMed] [Google Scholar]
- 30.Wu D, et al. Postsynaptic synaptotagmins mediate AMPA receptor exocytosis during LTP. Nature. 2017;544:316–321. doi: 10.1038/nature21720. [DOI] [PMC free article] [PubMed] [Google Scholar]
- 31.Lee J, Guan Z, Akbergenova Y, Littleton JT. Genetic Analysis of Synaptotagmin C2 Domain Specificity in Regulating Spontaneous and Evoked Neurotransmitter Release. J Neurosci. 2013;33:187–200. doi: 10.1523/JNEUROSCI.3214-12.2013. [DOI] [PMC free article] [PubMed] [Google Scholar]
- 32.Ernst Ja, Brunger AT. High resolution structure, stability, and synaptotagmin binding of a truncated neuronal SNARE complex. J Biol Chem. 2003;278:8630–8636. doi: 10.1074/jbc.M211889200. [DOI] [PubMed] [Google Scholar]
- 33.Bracher A, Kadlec J, Betz H, Weissenhorn W. X-ray structure of a neuronal complexin-SNARE complex from squid. J Biol Chem. 2002;277:26517–26523. doi: 10.1074/jbc.M203460200. [DOI] [PubMed] [Google Scholar]
- 34.Kümmel D, et al. Complexin cross-links prefusion SNAREs into a zigzag array. Nat Struct Mol Biol. 2011;18:927–933. doi: 10.1038/nsmb.2101. [DOI] [PMC free article] [PubMed] [Google Scholar]
- 35.Shin OH, Xu J, Rizo J, Südhof TC. Differential but convergent functions of Ca2+ binding to synaptotagmin-1 C2 domains mediate neurotransmitter release. Proc Natl Acad Sci U S A. 2009;106:16469–74. doi: 10.1073/pnas.0908798106. [DOI] [PMC free article] [PubMed] [Google Scholar]
- 36.Yang X, Kaeser-Woo YJ, Pang ZP, Xu W, Südhof TC. Complexin Clamps Asynchronous Release by Blocking a Secondary Ca2+ Sensor via Its Accessory α Helix. Neuron. 2010;68:907–920. doi: 10.1016/j.neuron.2010.11.001. [DOI] [PMC free article] [PubMed] [Google Scholar]
- 37.Schonn JS, Maximov A, Lao Y, Sudhof TC, Sorensen JB. Synaptotagmin-1 and -7 are functionally overlapping Ca2+ sensors for exocytosis in adrenal chromaffin cells. Proc Natl Acad Sci. 2008;105:3998–4003. doi: 10.1073/pnas.0712373105. [DOI] [PMC free article] [PubMed] [Google Scholar]
- 38.Gustavsson N, Han W. Calcium-sensing beyond neurotransmitters: functions of synaptotagmins in neuroendocrine and endocrine secretion. Biosci Rep. 2009;29:245–259. doi: 10.1042/BSR20090031. [DOI] [PubMed] [Google Scholar]
- 39.Cao P, Yang X, Sudhof TC. Complexin Activates Exocytosis of Distinct Secretory Vesicles Controlled by Different Synaptotagmins. J Neurosci. 2013;33:1714–1727. doi: 10.1523/JNEUROSCI.4087-12.2013. [DOI] [PMC free article] [PubMed] [Google Scholar]
- 40.Lai Y, et al. N-terminal domain of complexin independently activates calcium-triggered fusion. Proc Natl Acad Sci. 2016;113:E4698–E4707. doi: 10.1073/pnas.1604348113. [DOI] [PMC free article] [PubMed] [Google Scholar]
- 41.Choi UB, Zhao M, Zhang Y, Lai Y, Brunger AT. Transport dynamics in a glutamate transporter homologue. Nature. 2013;502:114–118. doi: 10.1038/nature12265. [DOI] [PMC free article] [PubMed] [Google Scholar]
- 42.Tang J, et al. A Complexin/Synaptotagmin 1 Switch Controls Fast Synaptic Vesicle Exocytosis. Cell. 2006;126:1175–1187. doi: 10.1016/j.cell.2006.08.030. [DOI] [PubMed] [Google Scholar]
- 43.Gipson P, et al. Morphologies of synaptic protein membrane fusion interfaces (in press) Proc Natl Acad Sci U S A. 2017 doi: 10.1073/pnas.1708492114. [DOI] [PMC free article] [PubMed] [Google Scholar]
- 44.Cipriano DJ, et al. Processive ATP-driven substrate disassembly by the N-ethylmaleimide- sensitive factor (NSF) molecular machine. J Biol Chem. 2013;288:23436–23445. doi: 10.1074/jbc.M113.476705. [DOI] [PMC free article] [PubMed] [Google Scholar]
- 45.Studier FW. Protein production by auto-induction in high-density shaking cultures. Protein Expression and Purification. 2005;41:207–234. doi: 10.1016/j.pep.2005.01.016. [DOI] [PubMed] [Google Scholar]
- 46.Kabsch W. Xds. Acta Crystallogr Sect D Biol Crystallogr. 2010;66:125–132. doi: 10.1107/S0907444909047337. [DOI] [PMC free article] [PubMed] [Google Scholar]
- 47.Winn MD, et al. Overview of the CCP4 suite and current developments. Acta Crystallogr Sect D Biol Crystallogr. 2011;67:235–242. doi: 10.1107/S0907444910045749. [DOI] [PMC free article] [PubMed] [Google Scholar]
- 48.McCoy AJ, et al. Phaser crystallographic software. J Appl Crystallogr. 2007;40:658–674. doi: 10.1107/S0021889807021206. [DOI] [PMC free article] [PubMed] [Google Scholar]
- 49.Emsley P, et al. Coot: model-building tools for molecular graphics. Acta Crystallogr Sect D Biol Crystallogr. 2004;60:2126–2132. doi: 10.1107/S0907444904019158. [DOI] [PubMed] [Google Scholar]
- 50.Adams PD, et al. Acta Crystallographica Section D: Biological Crystallography. Vol. 58. International Union of Crystallography; 2002. PHENIX: Building new software for automated crystallographic structure determination; pp. 1948–1954. [DOI] [PubMed] [Google Scholar]
- 51.Chen VB, et al. MolProbity: All-atom structure validation for macromolecular crystallography. Acta Crystallogr Sect D Biol Crystallogr. 2010;66:12–21. doi: 10.1107/S0907444909042073. [DOI] [PMC free article] [PubMed] [Google Scholar]
- 52.Krissinel E, Henrick K. Inference of Macromolecular Assemblies from Crystalline State. J Mol Biol. 2007;372:774–797. doi: 10.1016/j.jmb.2007.05.022. [DOI] [PubMed] [Google Scholar]
- 53.Choi HJ, et al. E-catenin is an autoinhibited molecule that coactivates vinculin. Proc Natl Acad Sci. 2012;109:8576–8581. doi: 10.1073/pnas.1203906109. [DOI] [PMC free article] [PubMed] [Google Scholar]
- 54.Radhakrishnan A, Stein A, Jahn R, Fasshauer D. The Ca2+ affinity of synaptotagmin 1 is markedly increased by a specific interaction of its C2B domain with phosphatidylinositol 4,5-bisphosphate. J Biol Chem. 2009;284:25749–25760. doi: 10.1074/jbc.M109.042499. [DOI] [PMC free article] [PubMed] [Google Scholar]
- 55.Evans CS, et al. Functional analysis of the interface between the tandem C2 domains of synaptotagmin-1. Mol Biol Cell. 2016;27:979–989. doi: 10.1091/mbc.E15-07-0503. [DOI] [PMC free article] [PubMed] [Google Scholar]
- 56.Maximov A, Pang ZP, Tervo DGR, Südhof TC. Monitoring synaptic transmission in primary neuronal cultures using local extracellular stimulation. J Neurosci Methods. 2007;161:75–87. doi: 10.1016/j.jneumeth.2006.10.009. [DOI] [PubMed] [Google Scholar]
- 57.Pang ZP, Südhof TC. Cell biology of Ca2+-triggered exocytosis. Curr Opin Cell Biol. 2010;22:496–505. doi: 10.1016/j.ceb.2010.05.001. [DOI] [PMC free article] [PubMed] [Google Scholar]
- 58.Zhou P, et al. Syntaxin-1 N-peptide and Habc-domain perform distinct essential functions in synaptic vesicle fusion. EMBO J. 2013;32:159–71. doi: 10.1038/emboj.2012.307. [DOI] [PMC free article] [PubMed] [Google Scholar]
Associated Data
This section collects any data citations, data availability statements, or supplementary materials included in this article.
Supplementary Materials
Data Availability Statement
The coordinates of the atomic models and corresponding structure factors have been deposited in the Protein Data Bank (PDB) under the accession codes 5W5C and 5W5D. All other relevant data are included with the manuscript as source data or Supplementary Videos. The original and/or analysed data sets generated during the current study are available from the corresponding author upon reasonable request.


