Abstract
Liquid microdroplet arrays on surfaces are a promising approach to the miniaturization of laboratory processes such as high-throughput screening. The fluid nature of these droplets poses unique challenges and opportunities in their fabrication and application, particularly for the scalable integration of multiple materials over large areas and immersion into cell culture solution. Here, we use pin spotting and nanointaglio printing to screen a library of lipids and their mixtures for their compatibility with these fabrication processes, as well as stability upon immersion into aqueous solution. More than 200 combinations of natural and synthetic oils composed of fatty acids, triglycerides, and hydrocarbons were tested for their pin-spotting and nanointaglio print quality and their ability to contain the fluorescent compound tetramethylrhodamine B isothiocyanate (TRITC) upon immersion in water. A combination of castor oil and hexanoic acid at the ratio of 1:1 (w/w) was found optimal for producing reproducible patterns that are stable upon immersion into water. This method is capable of large-scale nanomaterials integration.
Keywords: high-throughput screening, droplet microarray, lipid, lipophilic drug, nanointaglio
INTRODUCTION
A fundamental goal of nanotechnology is to integrate top–down nanofabrication processes with bottom–up chemical assembly to reliably fabricate larger, more complex devices with molecular scale components (Rohrer, 1996). Liquid microdroplet arrays on surfaces are a promising approach toward achieving this goal by allowing multiple solutions to be integrated on a chip (Gosalia and Diamond, 2003; Popova et al., 2016). In principle, each droplet can be viewed as a microscopic test tube, allowing a density of containers limited only by droplet size and the ability to place different reagents into each droplet. For instance, an array with one droplet per square micrometer would allow 100 million containers on 1 cm2 surface. The potential in high-throughput screening (HTS), with the state of the art being 10–30 wells/cm, is comparable to the difference in capabilities between early vacuum tube-based computer mainframes and today’s solid-state computers.
Modern HTS requires robotics, liquid-handling devices, sensitive detectors, and software for data processing and control in order to perform millions of pharmacological tests on samples in parallel. Current robotic systems are burdened by several issues, such as high costs, poor reliability of data, standardization of data types, rapid and accurate dispensing of very small liquid volumes, and uncontrolled evaporation of dispensed liquids from Comley (2006). One promising approach to miniaturization of HTS is microfluidics. Microfluidic systems enable serial processing and analysis and, furthermore, can accomplish massive parallelization through efficient miniaturization and multiplexing (Hong et al., 2009). In particular, droplet microfluidics use small droplets, typically water suspended in oil, to confine reagents and/or cells (Anna et al., 2003; Kim et al., 2015). A challenge in this field is that the droplets move and mix in solution, and a chemical tracker is therefore typically included in the drop for identification. Droplet microarrays provide a different solution to this technical challenge by attaching the droplet to a surface, so that its composition is known by its position in the array, at the cost of limiting the array to two dimensions (Gosalia and Diamond, 2003; Mugherli et al., 2009; Arrabito et al., 2013; Sun et al., 2015; Popova et al., 2016).
Microarrays of covalently attached monolayers are well established and allow the simultaneous analysis of thousands of chemical entities within a single experimental step (Cahill, 2001; Heller, 2002; Pirrung, 2002; Howbrook et al., 2003; Hook et al., 2006; Ma and Horiuchi, 2006). Biomolecules commonly immobilized on microarrays include proteins (Cahill, 2001), oligonucleotides (Heller, 2002; Pirrung, 2002; Howbrook et al., 2003), polymerase chain reaction products (Heller, 2002; Pirrung, 2002), peptides (Cahill, 2001; Howbrook et al., 2003), lipids (Howbrook et al., 2003; Hook et al., 2006), and carbohydrates (Ma and Horiuchi, 2006). Covalent small molecule microarrays are useful for screening for interactions with the surfaces of adherent cells. However, targets inside of the cell are inaccessible to this approach. Alternatives include embedding the small molecules into a matrix such as a hydrogel and allowing them to diffuse out (Bailey et al., 2004), a sandwich assay composed of microwells that are addressable by individual posts (Wu et al., 2011), or by generating arrays of microscopic water droplets for cell culture (Popova et al., 2016). These methods are promising for water-soluble compounds. However, an estimated 40% of approved drugs in the market and nearly 90% of molecules in the developmental pipeline are poorly water soluble (Kalepu and Nekkanti, 2015). This poses a challenge for delivery to cells through aqueous solution. We use lipid multilayer (or droplet) microarrays to temporarily immobilize lipophilic compounds onto a surface, allowing cellular uptake and quantitative dose–response curves (Kusi-Appiah et al., 2012; Kusi-Appiah et al., 2015). A crucial property of lipid multilayer microarrays for drug screening applications is that the layer must be thicker than a single monolayer or bilayer in order to contain enough drug to reach biologically relevant dosages upon cellular uptake.
Lipid multilayer microarrays have been be fabricated by dip pen nanolithography (Lenhert et al., 2007), polymer pen lithography (Hirtz et al., 2015), nanointaglio printing (Lowry et al., 2014), and evaporative edge lithography (Vafai et al., 2015). Here, we use nanointaglio printing, which is a printing mode where ink is transferred from the recesses of a stamp, allowing for control of lipid multilayer film thicknesses by the stamp dimensions as well as the amount of ink on the stamp (Nafday et al., 2012). We have previously demonstrated that three different lipids can be integrated over larger areas by pin spotting of lipid solutions onto a palette, which is subsequently used to ink the intaglio stamp (Lowry et al., 2014). In order to scale this process up for integration of thousands of different lipid encapsulated drug candidates for HTS, several obstacles must be overcome. First of all, we have previously used liposomal solutions in water for the microarray process, yet solvent evaporation becomes an issue as more compounds are added. Second, immersion of the lipid microarrays into water poses a challenge, as the lipids can sometimes be swept away upon addition of aqueous solution. In order to solve these problems, we here screen different fluid lipid carriers as a suitable matrix for solvent-free microarraying followed by intaglio printing and immersion into water. Our main objective here is to identify a fluid lipid composition capable of containing lipophilic small molecules and compatible with pin spotting and microarraying so that this process can be scaled up for HTS applications (Figure 1).
FIGURE 1.

Schematic showing the nanointaglio fabrication process (left) and its application in cell-based high-throughput screening.
MATERIALS AND METHODS
Components
As shown in Figure 2, the components of the lipid formulations screened here include fatty acids [octanoic (caprilic) acid, hexanoic (caproic) acid, oleic acid, linoleic acid], triglycerols (olive oil, soybean oil, sesame oil, peanut oil, linseed oil, corn oil, cottonseed oil, castor oil, lavender oil, mineral oil, sunflower oil, safflower oil, canola oil, fish oil)/hydrocarbon (hexadecane), glycerol, and tetramethylrhodamine B isothiocyanate (TRITC), as the fluorescent hydrophobic model drug, which are purchased from Sigma-Aldrich. The combinations of 1:1 (w/w) liquid lipids and the pure lipids are tested (Table 1). The oil phase must be of high purity and free of undesirable components such as peroxides, pigments, decomposition products, and unsaponifiable matter such as sterols and polymers. Oxidation of oil and drug during preparation and storage must be minimized by manufacturing under a nitrogen atmosphere, as reported by Floyd (1999).
FIGURE 2.
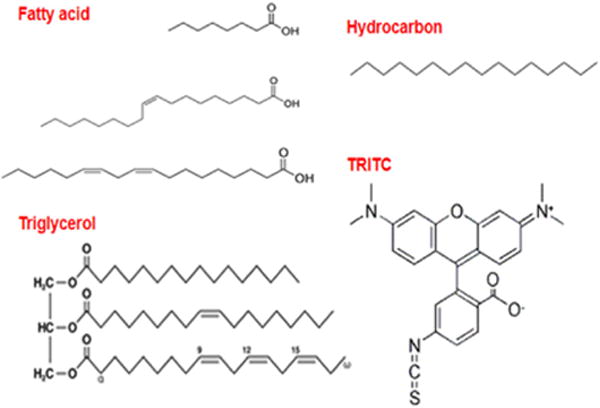
Sample chemical structures of the different classes of compounds screened here (fatty acids, triglycerols, hydrocarbon, and tetramethylrhodamine B isothiocyanate as the fluorescent hydrophobic model drug).
TABLE 1.
List of components [the combinations have the ratio of 1:1 (w/w)].
| 1 Hexanoic acid only 2 Hexanoic and octanoic 3 Hexanoic and oleic 4 Hexanoic and linoleic 5 Hexanoic and soybean 6 Hexanoic and olive 7 Hexanoic and peanut 8 Hexanoic and corn 9 Hexanoic and cottonseed 10 Hexanoic and linseed 11 Hexanoic and safflower 12 Hexanoic and sunflower 13 Hexanoic and canola 14 Hexanoic and sesame 15 Hexanoic and castor 16 Hexanoic and fish 17 Hexanoic and mineral 18 Hexanoic and lavender 19 Hexanoic and hexadecane 20 Hexanoic and glycerol 21 Cottonseed oil only 22 Cottonseed and linseed 23 Cottonseed and safflower 24 Cottonseed and sunflower 25 Cottonseed and canola 26 Cottonseed and sesame 27 Cottonseed and castor 28 Cottonseed and fish 29 Cottonseed and mineral 30 Cottonseed and lavender 31 Cottonseed and hexadecane 32 Cottonseed and glycerol 33 Octanoic acid only 34 Octanoic and oleic 35 Octanoic and linoleic 36 Octanoic and soybean 37 Octanoic and olive 38 Octanoic and peanut 39 Octanoic and corn 40 Octanoic and cottonseed 41 Octanoic and linseed 42 Octanoic and safflower |
43 Octanoic and sunflower 44 Octanoic and canola 45 Octanoic and sesame 46 Octanoic and castor 47 Octanoic and fish 48 Octanoic and mineral 49 Octanoic and lavender 50 Octanoic and hexadecane 51 Octanoic and glycerol 52 Corn oil only 53 Corn and cottonseed 54 Corn and linseed 55 Corn and safflower 56 Corn and sunflower 57 Corn and canola 58 Corn and sesame 59 Corn and castor 60 Corn and fish 61 Corn and mineral 62 Corn and lavender 63 Corn and hexadecane 64 Corn and glycerol 65 Oleic acid only 66 Oleic and linoleic 67 Oleic and soybean 68 Oleic and olive 69 Oleic and peanut 70 Oleic and corn 71 Oleic and cottonseed 72 Oleic and linseed 73 Oleic and safflower 74 Oleic and sunflower 75 Oleic and canola 76 Oleic and sesame 77 Oleic and castor 78 Oleic and fish 79 Oleic and mineral 80 Oleic and lavender 81 Oleic and hexadecane 82 Oleic and glycerol 83 Peanut oil only 84 Peanut and corn |
85 Peanut and cottonseed 86 Peanut and linseed 87 Peanut and safflower 88 Peanut and sunflower 89 Peanut and canola 90 Peanut and sesame 91 Peanut and castor 92 Peanut and fish 93 Peanut and mineral 94 Peanut and lavender 95 Peanut and hexadecane 96 Peanut and glycerol 97 Linoleic acid only 98 Linoleic and soybean 99 Linoleic and olive 100 Linoleic and peanut 101 Linoleic and corn 102 Linoleic and cottonseed 103 Linoleic and linseed 104 Linoleic and safflower 105 Linoleic and sunflower 106 Linoleic and canola 107 Linoleic and sesame 108 Linoleic and castor 109 Linoleic and fish 110 Linoleic and mineral 111 Linoleic and lavender 112 Linoleic and hexadecane 113 Linoleic and glycerol 114 Olive oil only 115 Olive and peanut 116 Olive and corn 117 Olive and cottonseed 118 Olive and linseed 119 Olive and safflower 120 Olive and sunflower 121 Olive and canola 122 Olive and sesame 123 Olive and castor 124 Olive and fish 125 Olive and mineral 126 Olive and lavender |
127 Olive and hexadecane 128 Olive and glycerol 129 Soybean oil only 130 Soybean and olive 131 Soybean and peanut 132 Soybean and corn 133 Soybean and sunflower 134 Soybean and cottonseed 135 Soybean and linseed 136 Soybean and safflower 137 Soybean and canola 138 Soybean and sesame 139 Soybean and castor 140 Soybean and fish 141 Soybean and glycerol 142 Soybean and mineral 143 Soybean and lavender 144 Soybean and hexadecane 145 Fish oil only 146 Fish and mineral 147 Fish and lavender 148 Fish and hexadecane 149 Fish and glycerol 150 Linseed oil only 151 Linseed and safflower 152 Linseed and sunflower 153 Linseed and canola 154 Linseed and mineral 155 Linseed and sesame 156 Linseed and castor 157 Linseed and fish 158 Linseed and lavender 159 Linseed and hexadecane 160 Linseed and glycerol 161 Safflower oil only 162 Safflower and castor 163 Safflower and sunflower 164 Safflower and canola 165 Safflower and sesame 166 Safflower and fish 167 Safflower and mineral 168 Safflower and lavender |
169 Safflower and hexadecane 170 Safflower and glycerol 171 Sunflower oil only 172 Sunflower and canola 173 Sunflower and sesame 174 Sunflower and castor 175 Sunflower and hexadecane 176 Sunflower and fish 177 Sunflower and mineral 178 Sunflower and lavender 179 Sunflower and glycerol 180 Canola oil only 181 Canola and sesame 182 Canola and castor 183 Canola and hexadecane 184 Canola and fish 185 Canola and mineral 186 Canola and lavender 187 Canola and glycerol 188 Mineral oil only 189 Mineral and lavender 190 Mineral and hexadecane 191 Mineral and glycerol 192 Sesame oil only 193 Sesame and castor 194 Sesame and fish 195 Sesame and mineral 196 Castor oil only 197 Sesame and Lavender 198 Sesame and hexadecane 199 Sesame and glycerol 200 Castor and fish 201 Castor and mineral 202 Castor and lavender 203 Castor and hexadecane 204 Lavender and glycerol 205 Castor and glycerol 206 Lavender oil only 207 Lavender and hexadecane 208 Hexadecane only 209 Hexadecane and glycerol 210 Glycerol only |
PDMS Stamps
PDMS micro-well stamps are prepared from a thermoplastic master (EV Group, Inc., Tempe, AZ, USA) cured from a patterned silicon wafer with 5 μm diameter wells, 2.5 μm deep and 10 μm in pitch, covering 19% of the stamp surface. The silicon wafers are initially cleaned with piranha solution or plasma treated and later passivated with a 0.2% (by volume) octadecyltrichlorosilane solution in toluene. The PDMS stamp of desired dimensions is prepared from a Sylgard 184 (Dow Corning, Midland, MI, USA) elastomer gel at a ratio of 1:10 curing agent to base prepolymer poured over the thermoplastic master and cured in an oven at 65°C overnight.
Ink Preparation
For integration of multiple inks, TRITC, as a model drug, is added to the liquid lipids at a proportion of 1% by mass for arraying, screening, and microscopy. The results are microarrayed in an array pattern onto a PDMS ink palette.
Microarraying Lipid Components
The different lipid solutions are microarrayed from standard 384-well microtiter plates (Axygen, Inc., PMI110-07 V1, Union City, CA, USA) using a Microarrayer (Arrayit Corporation, ARYC) onto the PDMS palettes (Figure 3 and Figure S1 in Supplementary Material), using a 200 μm 4 × 4 stainless steel microspot pin tool. Microarray pins are washed to ensure no cross-contamination between inks. It is found that 2 min washes in acetone and then water, followed by 30 sec of drying sufficed.
FIGURE 3. Pin spotting screening of liquid lipid-based components.
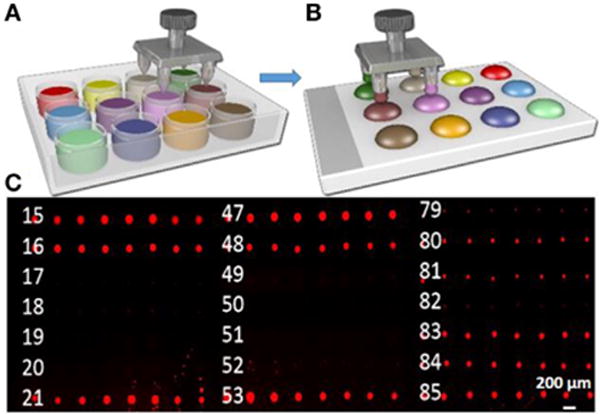
(A,B) Schematic illustrating the process of inking of lipid spots; (C) fluorescence micrographs of palette. Scale bar is 200 μm.
Intaglio Printing
For lipid/dye combination stamping on the cover glass palette surfaces, the PDMS stamp is inked and placed in contact with the substrate. A structured PDMS stamp is inked by pressing the patterned surface onto the ink palette (Lowry et al., 2014). The stamping procedure combines the topographical control of nanoimprint lithography and throughput of microcontact printing with the scalability of pin spotting. The stamps are left in direct contact with the surface and uniform, firm pressure (about 45 N as measured on a bathroom scale) is applied for ~10 sec before careful removal and printing the next pattern. Excess material is removed by sacrificially printing four to six times before pattern would print uniformly. Image analysis for area and intensity of the droplets is done by NIH ImageJ software (http://rsb.info.nih.gov/ij/) (Figure 4A; Figure S2 in Supplementary Material).
FIGURE 4.
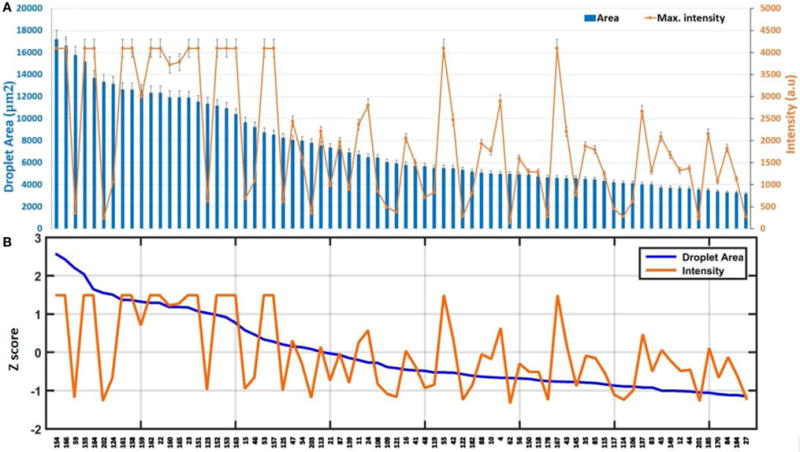
(A) Quantitative analysis of pin spotting screening of liquid lipid-based components in terms of droplet area and intensity. Error bars represent the SEM of at least nine different spots. (B) Z value of the components.
Quantitative analysis of pin spotting screening of liquid lipid-based components, together with the Z value of the components, is shown in Figure 4. Furthermore, a scatter plot of the two parameters tested (intensity and droplet area) is provided (Figure 5).
FIGURE 5. Plot of intensity versus droplet area of pin spotting screening of liquid lipid-based components.
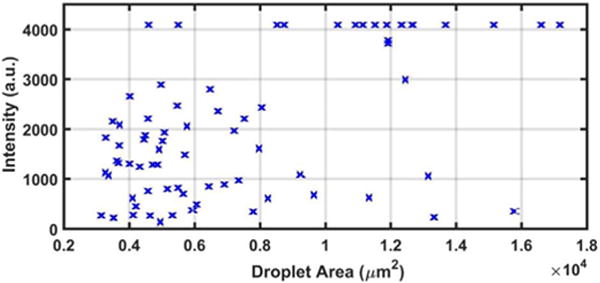
The brightest dots are saturated in fluorescence intensity, indicating sufficient dye content for our purposes.
For Figure 6 and Figure S3 in Supplementary Material, nanointaglio patterns are printed on glass coverslip substrates. Furthermore, quantitative analysis of the printing compatibility screening of liquid lipid-based components and their Z values are shown in Figure 7. The description of the correlation of intensity and print area is provided in Figure 8.
FIGURE 6. Nanointaglio print compatibility screening of liquid lipid-based components in terms of area and intensity.
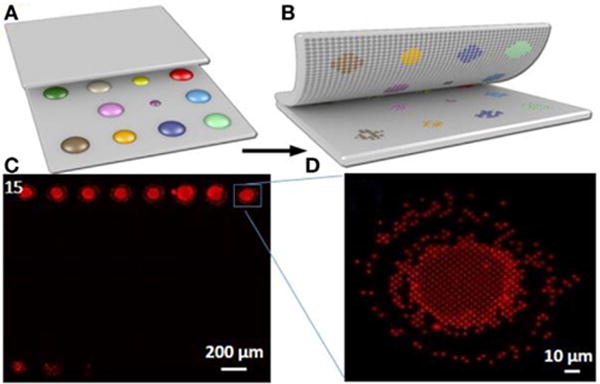
(A,B) Schematic illustrating the process of nanointaglio printing of lipid spots; (C) fluorescence micrograph of a lipid microarray printed using the nanointaglio method; (D) magnified section of (C) indicated by blue square in (C).
FIGURE 7.
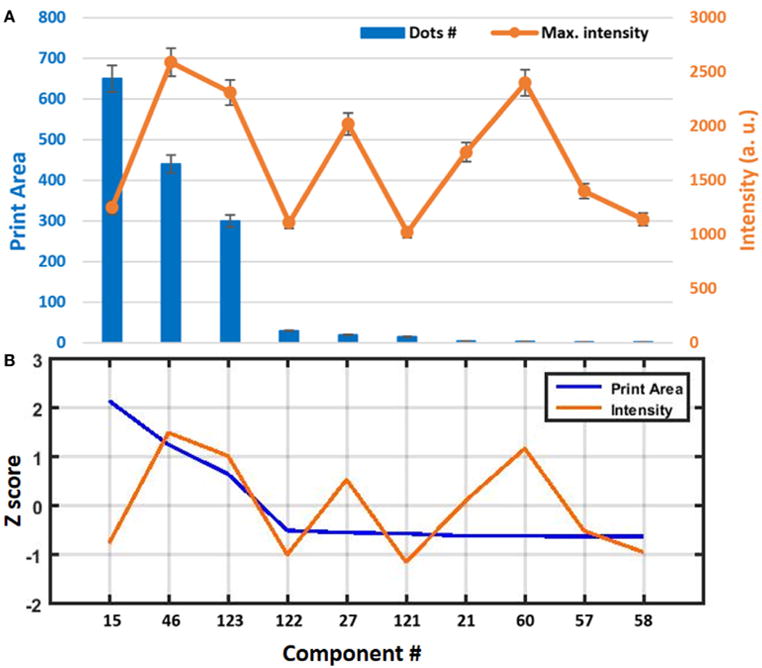
(A) Quantitative analysis of the print compatibility screening of liquid lipid-based components in terms of print area and intensity. Error bars represent the SEM of at least nine different spots. (B) Z value of the components.
FIGURE 8.
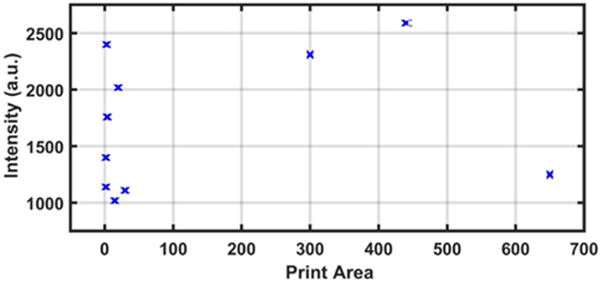
Plot of intensity versus print area of printing compatibility screening of liquid lipid-based components.
Lipid Nanopattern Storage and Immersion
After nanointaglio fabrication, lipid patterns are stored in a nitrogen glovebox (Mbraun, Inc., Model Labstar (1200/780), Stratham, NH, USA) to prevent them from possible oxidation. The nitrogen environment stabilizes the lipid nanostructures by dehydration prior to immersion in water (Lenhert et al., 2010). Then Millipore water is applied for 1 h, using a syringe directly over a section of the lipid pattern on a microscope stage while the pattern is being imaged on fluorescence microscope (Figure 9). Moreover, we repeat the same experiment for the selected components over a large pattern. This time after being imaged for 1 h, the patterns are kept at ambient temperature (25°C ± 2%) for 72 h and are imaged again by fluorescence microscopy.
FIGURE 9. The effect of immersion under water on liquid lipid stability of the samples stored under nitrogen atmosphere.
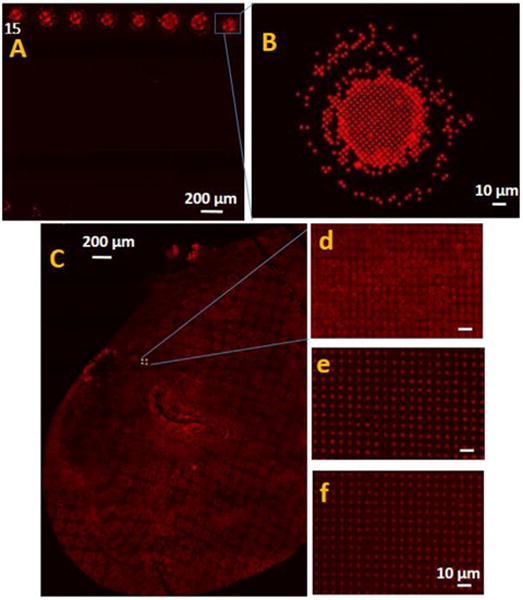
(A) Fluorescence micrographs of castor oil/hexanoic acid combination in lipid microarray format 1 h after immersion under water and (B) magnified section of (A). (C) Fluorescence micrograph of a large spot of castor oil/hexanoic acid combination printed using the nanointaglio method, (D) magnified section of (C) indicated by blue square in (C); (E) fluorescence micrographs of the same spot after 1 h and (F) after 72 h immersion under water.
Preparation of Immersion Chamber
A 0.5 cm diameter cork bore is used to create cutouts in PDMS pieces 1 cm wide by 3 cm long by 0.5 cm thick. This chamber is placed on a glass slide with the lipid patterns to create an enclosed space to contain solution for experiments.
Characterization and Imaging Techniques
A Ti-E epifluorescence inverted microscope (Nikon Instruments, Melville, NY, USA) fitted with a Retiga SRV (QImaging, Canada) CCD camera (1.4 MP, Peltier cooled to −45°C) is used for fluorescence and bright-field imaging of the lipid patterns on glass surfaces. All experiments are performed at ambient temperature.
Statistical Analysis
All experiments are performed at least in triplicate. The screening data are repeated three times on three different days. Means and SEs of the means are calculated using Excel. MATLAB software is used to perform the Z score calculations. The raw intensity and droplet area data for each experiment are used for the calculation of Z scores. Z scores are calculated by subtracting the overall average of either intensity or droplet area (within a single experiment) from the raw intensity or droplet area data for each component and dividing that result by the SD of all the measured intensities or droplet areas, according to the formula:
where C is any component on the microarray and C1 … Cn represent the aggregate measure of all of the components.
RESULTS AND DISCUSSION
Lipids (long-chain triglycerols—LCTs and medium-chain triglycerols—MCTs) approved by the regulatory agencies, alone or in combination, are generally first choice for developing drug carrier formulations (Marten et al., 2006; Hippalgaonkar et al., 2010). LCTs such as soybean oil, safflower oil, sesame oil, and castor oil are approved for clinical use. Some oils (e.g., safflower, olive, sunflower, and castor) that contain more than 70% of oleic, linoleic, or ricinoleic acids make the larger spots. Our microarray includes both LCTs and MCTs and their combinations. Some oils such as linseed, safflower, and olive oils have higher fluorescence intensity, which is attributed to their autofluorescence properties (Sikorska et al., 2012). It is worth mentioning that the maximum fluorescence intensity of each spot is used in analyzing the data. Also, area values that are smaller than 3000 μm2 have not been considered.
In the fluorescence micrograph of the palette presented in Figure 3 (Figure S1 in Supplementary Material), it is evident that not all the lipid mixtures are compatible with the pin-spotting step. Some of the components have not been pin spotted properly, as they show no fluorescence intensity. In addition, some of the samples have covered very limited area, which is almost negligible. In Figure 4B, Z scores provide a relative, semiquantitative estimate of either intensity or droplet area levels and, as such, form the basis of comparison of either intensity or droplet area data among many experiments within the same array type. Thus, Z scores provide a useful and intuitive method for visualizing and interpreting very large amounts of data in their natural physicochemical context. This is in contrast to normalization strategies that express either intensity or droplet area data as ratios of one sample to another (either experimental or to a common reference sample). Positive and negative values in these analyses simply indicate their relationship to the normalizing sample rather than reflecting actual area or intensity levels. The very brightest dots are saturated, indicating that a sufficiently large amount of dye per dot as fluorescence intensity is related to droplet height (Nafday and Lenhert, 2011). Droplet area is likely related to both droplet volume and the contact angle of the oil on the glass surface. The viscosity of the oil and contact time of the tip may also play a role in the lipid transfer from the pin to the surface.
Castor oil, which contains monounsaturated fatty acyls, shows the most stable formulation after immersion, especially when combined with other components. Vegetable oils contain various triglycerides in different proportions; castor oil, in particular, deviates from the other oils by the high content of a monounsaturated fatty acid [ricioleic acid, 18:19 (12OH)] with a hydroxy group. For example, the free fatty acids contained in castor oil can act as a coemulsifier resulting in lower interfacial tension and more stable formulation in comparison with the other oil phases (Mohan et al., 2012). Compared to other vegetable oils, castor oil exhibits enhanced solubilizing effects that can be ascribed to increased hydrogen bonding activities of the hydroxyl groups in ricinoleic acids.
Furthermore, it has been shown that by combining castor oil and a liquid fatty acid, at the ratio of 1:1 (w/w), the stability of the material under water is increased. Jumaa and Muller (1998, 1999) reported the effect of mixing castor oil with medium chain triglycerides on the viscosity of castor oil. The oil combination, at the ratio of 1:1 (w/w), led to a decrease in the viscosity of castor oil and simultaneously to a decrease in the interfacial tension of the oil phase (Mohan et al., 2012). This was related to the free fatty acids contained in castor oil, which can act as a coemulsifier resulting in lower interfacial tension and, simultaneously, in a more stable formulation in comparison with the other oil phases.
In our microarray, castor oil/hexanoic acid (MCT), castor oil/octanoic acid (MCT), and castor oil/olive oil (LCT) combinations make small patterns after pin spotting with almost uniform light intensity distribution throughout the sample, and they make good printed patterns that are reproducible. As shown in Figure 9, for castor oil/hexanoic acid combination, an irregular pattern of droplets is formed.
The dots are stable after immersion under water for 1 h in terms of the size, which demonstrates that the dots are not spreading; however, their intensity decreased during the time. As shown in Figure 10A, castor oil/octanoic acid combination shows almost complete fluorescence recovery 72 h after immersion under water. Intensities shown in Figure 10 represent the average of 30 different areas measured on three different replicate samples (10 images each). The castor/olive oil combination shows a lower fluorescence recovery compared to the castor oil/octanoic acid combination. However, the castor oil/hexanoic acid combination shows a continuous decrease in fluorescence during that time. The latter finding may suggest a mixture more prone to TRITC (and maybe drug) release over time in aqueous solutions.
FIGURE 10.
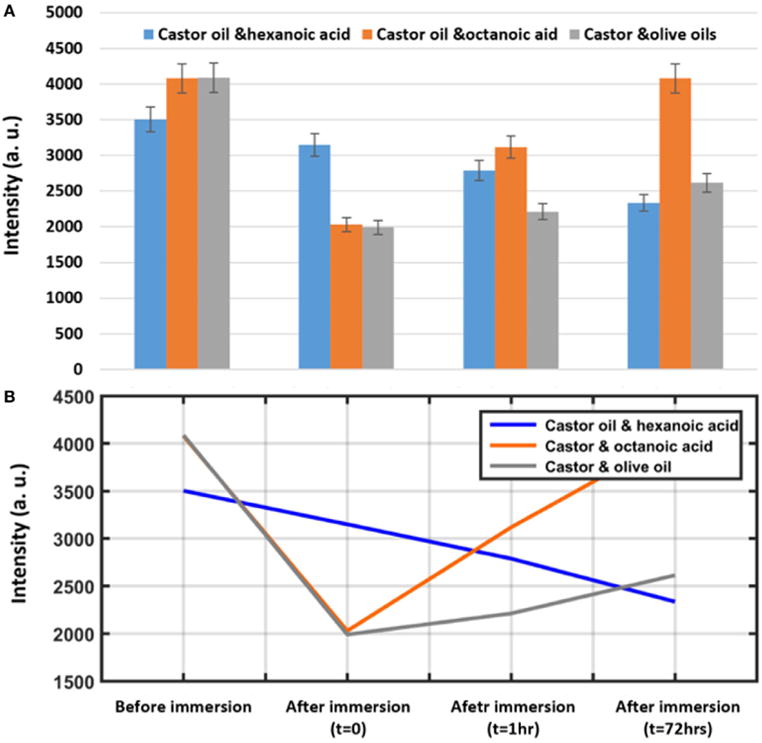
(A) Quantification of fluorescence intensity change of a spot printed using the nanointaglio method before immersion, immediately after immersion (t = 0), and 1and 72 h after immersion under water. Error bars represent the SEM of three different replicates. (B) Descriptive analysis of intensity versus time.
Both castor oil and MCTs (hexanoic acid) are among the excipients that are being used for the manufacturing of ocular compatible lipid emulsion (Mohan et al., 2012). However, prior to the formulation of the lipid emulsions, data are needed concerning drug solubility in the oil vehicle. In addition, information is needed on compatibility of the oil vehicle with other formulation additives and with the established ocular tissue, before the dosage forms can be prepared. Our results indicate that microdroplet arrays of castor oil combinations on surfaces are suitable for screening of drugs in a scalable manner.
CONCLUSION
A screen was carried out to identify oils compatible with pin spotting and nanointaglio, followed by immersion of the microarray into water. We tested 210 lipid formulations, and a 1:1 mixture of castor oil and hexanoic acid was found to be optimal in terms of droplet size, reproducibility of printed patterns, florescence intensity, and stability under immersion. Compared to phospholipid carriers (Kusi-Appiah et al., 2015), this formulation can be arrayed without the need for an additional solvent. The lipid itself can be considered the solvent for the fabrication of drug screening microarrays. These “solvent-free” lipid multilayer microarrays have potential for HTS of lipophilic compounds.
Supplementary Material
FIGURE S1 | Fluorescence micrograph of liquid lipid-based components pin spotted on PDMS palette. Scale bar is 200 μm.
FIGURE S2 | Fluorescence micrograph of a liquid lipid-based microarray printed using the nanointaglio method.
FIGURE S3 | Fluorescence micrograph of the liquid lipid-based microarray 1 h after immersion under water, which shows the effect of immersion under water on samples stability.
Acknowledgments
LG would like to thank Aubrey Kusi-Appiah at the Florida State University for helpful discussions. The authors thank Jen Kennedy for proofreading.
FUNDING
This work was supported by NIH R01 GM107172.
Footnotes
Edited by: Jian Zhong, Shanghai Ocean University, China
Reviewed by: Barbara Sanavio, Fondazione IRCCS Istituto Neurologico Carlo Besta, Italy Sílvia Castro Coelho, Faculdade de Engenharia da Universidade do Porto, Portugal
Specialty section: This article was submitted to Nanobiotechnology, a section of the journal Frontiers in Materials
AUTHOR CONTRIBUTIONS
LG carried out the experiments and wrote the manuscript together with SL. SL conceived of the study and directed the experiments.
SUPPLEMENTARY MATERIAL
The Supplementary Material for this article can be found online at http://journal.frontiersin.org/article/10.3389/fmats.2016.00055/full#supplementary-material.
Conflict of Interest Statement: The authors declare that the research was conducted in the absence of any commercial or financial relationships that could be construed as a potential conflict of interest.
References
- Anna SL, Bontoux N, Stone HA. Formation of dispersions using “flow focusing” in microchannels. Appl Phys Lett. 2003;82:364–366. doi: 10.1063/1.1537519. [DOI] [Google Scholar]
- Arrabito G, Galati C, Castellano S, Pignataro B. Luminometric sub-nanoliter droplet-to-droplet array (LUMDA) and its application to drug screening by phase I metabolism enzymes. Lab Chip. 2013;13:68–72. doi: 10.1039/c2lc40948h. [DOI] [PubMed] [Google Scholar]
- Bailey SN, Sabatini DM, Stockwell BR. Microarrays of small molecules embedded in biodegradable polymers for use in mammalian cell-based screens. Proc Natl Acad Sci USA. 2004;101:16144–16149. doi: 10.1073/pnas.0404425101. [DOI] [PMC free article] [PubMed] [Google Scholar]
- Cahill DJ. Protein and antibody arrays and their medical applications. J Immunol Methods. 2001;250:81–91. doi: 10.1016/S0022-1759(01)00325-8. [DOI] [PubMed] [Google Scholar]
- Comley J. Tools and technologies that facilitate automated screening. In: Hueser J, editor. High-Throughput Screening in Drug Discovery. Weinheim: Wiley-VCH; 2006. pp. 37–73. [Google Scholar]
- Floyd AG. Top ten considerations in the development of parenteral emulsions. Pharm Sci Technol Today. 1999;2:134–143. doi: 10.1016/S1461-5347(99)00141-8. [DOI] [PubMed] [Google Scholar]
- Gosalia DN, Diamond SL. Printing chemical libraries on microarrays for fluid phase nanoliter reactions. Proc Natl Acad Sci USA. 2003;100:8721–8726. doi: 10.1073/pnas.1530261100. [DOI] [PMC free article] [PubMed] [Google Scholar]
- Heller MJ. DNA microarray technology: devices, systems, and applications. Annu Rev Biomed Eng. 2002;4:129–153. doi: 10.1146/annurev.bioeng.4.020702.153438. [DOI] [PubMed] [Google Scholar]
- Hippalgaonkar K, Majumdar S, Kansara V. Injectable lipid emulsions – advancements, opportunities and challenges. AAPS PharmSciTech. 2010;11:1526–1540. doi: 10.1208/s12249-010-9526-5. [DOI] [PMC free article] [PubMed] [Google Scholar]
- Hirtz M, Sekula-Neuner S, Urtizberea A, Fuchs H. Functional lipid assemblies by dip-pen nanolithography and polymer pen lithography. In: Chen X, Fuchs H, editors. Soft Matter Nanotechnology: From Structure to Function. Weinheim: Wiley-VCH; 2015. pp. 161–185. [Google Scholar]
- Hong J, Edel JB, deMello AJ. Micro- and nanofluidic systems for high-throughput biological screening. Drug Discov Today. 2009;14:134–146. doi: 10.1016/j.drudis.2008.10.001. [DOI] [PubMed] [Google Scholar]
- Hook AL, Thissen H, Voelcker NH. Surface manipulation of biomolecules for cell microarray applications. Trends Biotechnol. 2006;24:471–477. doi: 10.1016/j.tibtech.2006.08.001. [DOI] [PubMed] [Google Scholar]
- Howbrook DN, van der Valk AM, O’Shaughnessy MC, Sarker DK, Baker SC, Lloyd AW. Developments in microarray technologies. Drug Discov Today. 2003;8:642–651. doi: 10.1016/S1359-6446(03)02773-9. [DOI] [PubMed] [Google Scholar]
- Jumaa M, Muller BW. The effect of oil components and homogenization condition on the physicochemical properties and stability of parenteral fat emulsions. Int J Pharm. 1998;163:81–89. doi: 10.1016/S0378-5173(97)00369-4. [DOI] [Google Scholar]
- Jumaa M, Muller BW. Physicochemical properties of chitosan-lipid emulsions and their stability during the autoclaving process. Int J Pharm. 1999;183:175–184. doi: 10.1016/S0378-5173(99)00086-1. [DOI] [PubMed] [Google Scholar]
- Kalepu S, Nekkanti V. Insoluble drug delivery strategies: review of recent advances and business prospects. Acta Pharm Sin B. 2015;5:442–453. doi: 10.1016/j.apsb.2015.07.003. [DOI] [PMC free article] [PubMed] [Google Scholar]
- Kim M, Pan M, Gai Y, Pang S, Han C, Yang C, et al. Optofluidic ultrahigh-throughput detection of fluorescent drops. Lab Chip. 2015;15:1417–1423. doi: 10.1039/c4lc01465k. [DOI] [PubMed] [Google Scholar]
- Kusi-Appiah AE, Lowry TW, Darrow EM, Wilson KA, Chadwick BP, Davidson MW, et al. Quantitative dose-response curves from subcellular lipid multilayer microarrays. Lab Chip. 2015;15:3397–3404. doi: 10.1039/c5lc00478k. [DOI] [PMC free article] [PubMed] [Google Scholar]
- Kusi-Appiah AE, Vafai N, Cranfill PJ, Davidson MW, Lenhert S. Lipid multilayer microarrays for in vitro liposomal drug delivery and screening. Biomaterials. 2012;33:4187–4194. doi: 10.1016/j.biomaterials.2012.02.023. [DOI] [PubMed] [Google Scholar]
- Lenhert S, Brinkmann F, Laue T, Walheim S, Vannahme C, Klinkhammer S, et al. Lipid multilayer gratings. Nat Nanotechnol. 2010;5:275–279. doi: 10.1038/nnano.2010.17. [DOI] [PubMed] [Google Scholar]
- Lenhert S, Sun P, Wang Y, Fuchs H, Mirkin CA. Massively parallel dip-pen nanolithography of heterogeneous supported phospholipid multilayer patterns. Small. 2007;3:71–75. doi: 10.1002/smll.200600431. [DOI] [PubMed] [Google Scholar]
- Lowry TW, Kusi-Appiah A, Guan J, Van Winkle DH, Davidson MW, Lenhert S. Materials Integration by nanointaglio. Adv Mater Interfaces. 2014;1:1300121–1300125. doi: 10.1002/admi.201300127. [DOI] [PMC free article] [PubMed] [Google Scholar]
- Ma H, Horiuchi KY. Chemical microarray: a new tool for drug screening and discovery. Drug Discov Today. 2006;11:661–668. doi: 10.1016/j.drudis.2006.05.002. [DOI] [PMC free article] [PubMed] [Google Scholar]
- Marten B, Pfeuffer M, Schrezenmeir J. Medium-chain triglycerides. Int Dairy J. 2006;16:1374–1382. doi: 10.1016/j.idairyj.2006.06.015. [DOI] [Google Scholar]
- Mohan K, Pravin S, Atul B. Ophthalmic microemulsion: a comprehensive review. Int J Pharma Bio Sci. 2012;3:1–13. [Google Scholar]
- Mugherli L, Burchak ON, Balakireva LA, Thomas A, Chatelain F, Balakirev MY. In situ assembly and screening of enzyme inhibitors with surface-tension microarrays. Angew Chem Int Ed. 2009;121:7775–7780. doi: 10.1002/ange.200901139. [DOI] [PubMed] [Google Scholar]
- Nafday OA, Lenhert S. High-throughput optical quality control of lipid multilayers fabricated by dip-pen nanolithography. Nanotechnology. 2011;22:225301. doi: 10.1088/0957-4484/22/22/225301. [DOI] [PubMed] [Google Scholar]
- Nafday OA, Lowry TW, Lenhert S. Multifunctional lipid multilayer stamping. Small. 2012;8:1021–1028. doi: 10.1002/smll.201102096. [DOI] [PubMed] [Google Scholar]
- Pirrung MC. How to make a DNA chip. Angew Chem Int Ed. 2002;41:1276–1289. doi: 10.1002/1521-3773(20020415)41:8. <1276::AID-ANIE1276> 3.0.CO;2-2. [DOI] [PubMed] [Google Scholar]
- Popova AA, Demir K, Hartanto TG, Schmitta E, Levkin PA. Droplet-microarray on superhydrophobic-superhydrophilic patterns for high-throughput live cell screenings. RSC Adv. 2016;6:38263–38276. doi: 10.1039/C6RA06011K. [DOI] [Google Scholar]
- Rohrer H. The nanoworld: chances and challenges. Microelectron Eng. 1996;32:5–14. doi: 10.1016/0167-9317(95)00173-5. [DOI] [Google Scholar]
- Sikorska E, Khmelinskii I, Sikorski M. Analysis of olive oils by fluorescence spectroscopy: methods and applications. Boskou D, editor. Olive Oil – Constituents, Quality, Health Properties and Bioconversions. 2012 (InTech) Available at: http://www.intechopen.com/books/olive-oil-constituents-quality-health-properties-and-bioconversions/analysis-of-olive-oils-by-fluorescence-spectroscopy-methods-and-applications.
- Sun Y, Chen X, Zhou X, Zhu J, Yu Y. Droplet-in-oil array for picoliter-scale analysis based on sequential inkjet printing. Lab Chip. 2015;15:2429–2436. doi: 10.1039/c5lc00356c. [DOI] [PubMed] [Google Scholar]
- Vafai N, Lowry TW, Wilson KA, Davidson MW, Lenhert S. Evaporative edge lithography of a liposomal drug microarray for cell migration assays. Nanofabrication. 2015;2:32–42. doi: 10.1515/nanofab-2015-0004. [DOI] [PMC free article] [PubMed] [Google Scholar]
- Wu J, Wheeldon I, Guo Y, Lu T, Du Y, Wang B, et al. A sandwiched microarray platform for benchtop cell-based high throughput screening. Biomaterials. 2011;32:841–848. doi: 10.1016/j.biomaterials.2010.09.026. [DOI] [PMC free article] [PubMed] [Google Scholar]
Associated Data
This section collects any data citations, data availability statements, or supplementary materials included in this article.
Supplementary Materials
FIGURE S1 | Fluorescence micrograph of liquid lipid-based components pin spotted on PDMS palette. Scale bar is 200 μm.
FIGURE S2 | Fluorescence micrograph of a liquid lipid-based microarray printed using the nanointaglio method.
FIGURE S3 | Fluorescence micrograph of the liquid lipid-based microarray 1 h after immersion under water, which shows the effect of immersion under water on samples stability.


