Abstract
Numerical computation of the expected information content of a prospective experimental design is computationally expensive, requiring calculating the Kullback-Leibler divergence of the posterior distribution from the prior for simulated data from a large sample of points from the prior distribution. In this work, we investigate whether the Unscented Transform (UT) of the prior distribution can provide an adequate estimate of the expected information content in the context of experiment design for a previously validated HIV-1 2-LTR model. Three different schedules with evenly distributed time points have been used to generate the experimental data along with the incorporation of qPCR noise for the study. The UT shows promise in estimating information content by preserving the optimal ordering of 2-LTR sample collection schedules, when compared to completely stochastic sampling from the underlying multivariate distributions.
I. INTRODUCTION
In modeling the dynamics of HIV-1, the formation of 2-LTR circles has been of interest to many researchers [2]-[5], [7], [10]-[12], [14], [16], [18]-[27]. 2-LTR circles are formed when viral DNA fails to integrate into its target host cell. Thus both random failed integration and the use of integrase inhibitor drugs, such as raltegravir, can result in a 2-LTR formation. A previous study [16] formulated a novel model for the formation of 2-LTR circles with and without the presence of raltegravir, based on patient data from the recent INTEGRAL study [5].
The problem of designing an HIV-1 2-LTR study with a sampling schedule that optimizes the amount of information gained from the system is our over-arching goal [6]. This requires developing an accurate estimate of the expected Kullback-Leibler divergence from the prior distribution of the parameters of interest to the posterior distribution of the same. The posterior distribution can be computed easily from any given candidate parameter set drawn from the prior, but numerically approximating the expected value directly from the prior involves taking a large random sample from the prior and averaging the results, which can be very computationally costly. The goal of this study is to see if the Unscented Transform (UT) [15] can be used as an accurate approximation of the multivariate prior distributions for this 2-LTR model. We compare the average information gained as calculated from the UT of the prior versus stochastic Monte Carlo sampling of the prior (see Figure 1). The Monte Carlo simulations are carried through with parameters sampled from prior distributions of our 2-LTR system parameters [16]. The Unscented Transform is also applied to these prior distributions to give us 5 sigma points that are representative of the distributions. Both methods produce a set of 2-LTR system parameters that are used to produce experimental simulations with measurement noise. Markov Chain Monte Carlo (MCMC) [1], [8], [13] methods are used to calculate the posterior distribution associated with each simulated experiment. After the posterior distributions are calculated, they are compared to the prior distributions by computing the Kullback-Leibler divergence between the two. This computation allows us to compare the amount of information gained by running each set of system parameters, and will give insight onto how good the UT method is in estimating the information content of the multivariate distributions. We test the UT method on 3 different sample time schedules to see if the UT preserves optimal schedule ordering, when compared to purely stochastic Monte Carlo simulations.
Fig. 1.
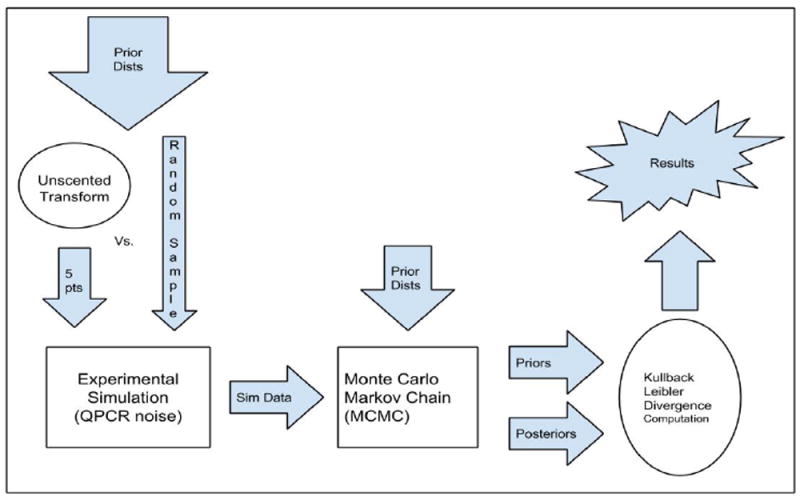
Diagram summarizing simulation procedures of this project.
The paper proceeds as follows: section II will present the 2-LTR model investigated, outline the process of choosing sigma points, discuss models for experimental uncertainty and Monte Carlo simulation, and discuss how information content will be computed. Section III will present results demonstrating preservation of optimal sampling schedules. Section IV will discuss future work and criticisms of our methodology in this study.
II. THEORY AND SIMULATION DESIGN
A. HIV-1 2-LTR Model
This study uses a previously published [16] 2-LTR replication model, described by parameters listed in Table 1. The system characterizes the dynamics of 2-LTR concentration in the blood, and actively infected cell concentration at the site of 2-LTR formation, and can be expressed as:
| (2.1) |
| (2.2) |
TABLE I.
2-LTR Model Parameters
| y | concentration of infected cells | cells/106 PBMC |
| c | concentration of 2-LTR circles in blood | cells/106 PBMC |
| R | probability infected cell infects target cell in a single generation | unitless |
| a | death rate of actively infected cells | day−1 |
| ye | rate of production of actively infected cells by processes other than infection | cells/106 PBMC |
| ηII | ratio-reduction in R following raltegravir intensification (i.e. raltegravir drug efficacy) | unitless |
| uII | 1 when raltegravir applied, 0 otherwise | unitless |
| ϕ | ratio of probability of 2-LTR formation during infection when raltegravir not present to probability raltegravir interrupts infection | unitless |
| kII | probability of 2-LTR formation when raltegravir interrupts infection | 2-LTR circles per infected cell |
| δ | decay rate of 2-LTR circles | day−1 |
It can be shown that the closed-form solution to (2.1)-(2.2) is:
| (2.3) |
where
| (2.4) |
and
| (2.5) |
B. Constrained Parameters and Choosing Sigma Points
A parameter transformation is carried out to reduce covariance by defining a new random variable, A = kyeR/δ, and the parameter a is considered fixed based on extensive prior data establishing its value. Thus, we are left with a system characterized by the 5 random variables: A, R, ηII, ϕ, and δ. For the purposes of this study, we will reduce the system to study A and R, while keeping ηII, ϕ, and δ constant throughout all trials. The Maximum Likelihood values for the parameters ϕ, δ, and η from the previous study are used for all trials, where ϕ = 0.0018 and δ = 0.46 day−1. η varied considerably between patients, but we use the average of the patient-specific maximum-likelihood estimates, ηII = 0.3.
This reduced 2-dimensional system (A and R) will be investigated throughout the rest of the study. It is worth noting that the process and results from this study could be replicated for any combination of 2 of our 5 random variables above, but for aforementioned reasons, A and R were the variables chosen here specifically. From the previous study’s data, our variables assume the following prior distributions:
| (2.6) |
| (2.7) |
Sigma points generated with the above probability distributions poses some practical problems. Figure 2 shows the A-R plane segmented into different zones; the red zone is the useless portion of our plane (noiseless simulations produce all points below the limit of detection), the yellow zone is moderately helpful (simulations produce 1-3 points above the limit of detection), and the blue zone is our target zone (4 or more points are above the limit of detection). Experiments from simulated patients with parameters in this region are non-informative, but numerical issues can result in incorrectly high estimates of the Kullback-Leibler divergence for patients in this region. For the purpose of this study we therefore limited the prior distribution of R to be a beta distribution with the following parameters (20,5) which gave us values mostly around 0.96 - 0.99 indicating viral replication in the patient, and a high probability of an informative experiment.
| (2.8) |
Fig. 2.
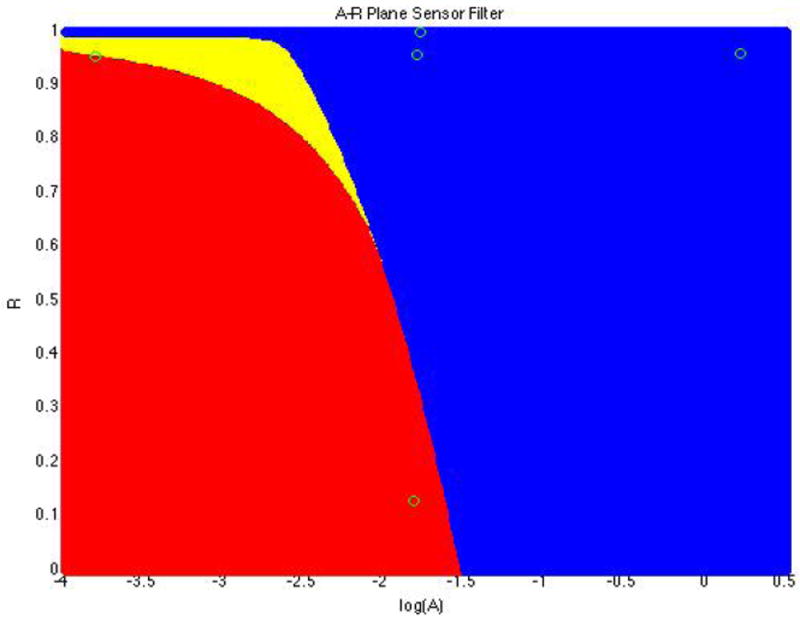
A-R plane filtered into zones where red points produced all measurements below the sensor limit, yellow produce most points below the sensor limit, and blue produce most points above the sensor limit.
We wish to compare the average amount of information gain predicted from running simulations from points randomly sampled from the A-R plane (Monte Carlo simulation), to the amount of information gain predicted from running simulations on the 5 sigma points generated by the 2-dimensional Unscented Transform (UT). The UT equations below, for an N-dimensional set of random variables, produce 2N+1 points that have the same mean and covariance as the original random variables [15]:
| (2.9) |
where μ is the mean of the original set of random variables, Σ is the covariance matrix of the original set of random variables, and is the ith column of the matrix square root of 2Σ. Since R is a probability variable, none of our sigma points can have an R value greater than 1, in our model. However, if we applied the UT to the bivariate A-R distribution as is, we would get R values greater than 1. To fix this, an inverse Normal CDF was applied to the R distribution, and the UT was then applied to this inverse Normal CDF data crossed with the A data. The final sigma points were converted back to R values using the Normal CDF.
C. Modeling Experimental Uncertainty
Once the Sigma points are generated, their A and R values are plugged into equations (2.3)-(2.5), which gives us an ideal, noiseless model for 2-LTR formation for a virtual patient. However, the process of measuring 2-LTR circles produces some experimental noise. As in the previous study [16], noise resulting from the Polymerase Chain Reaction (PCR) process was applied to the concentration data, c, generated by our sigma points. The noise is lognormal with a standard deviation given by [17]:
| (2.10) |
The Poissonian lower sensor limit of 3 copies (as opposed to 50, in the previous study) is 0.072 2-LTR circles/106 PBMC (peripheral blood mononuclear cell). Given 2-LTR measurements, m, and 2-LTR model c, the likelihood that the model fits given our data is given by:
| (2.11) |
where fLN is the lognormal probability density function and FLN is the lognormal cumulative density function.
D. Monte Carlo Simulation
Figure 3 shows the random 1000 points sampled from the A-R plane chosen for our completely stochastic Monte Carlo simulation. This study aims to compare the average amount of information gained from these randomly chosen A-R points (chosen from the underlying prior distributions given by (2.6) and (2.7) to the average amount of information gained by the sigma points.
Fig. 3.
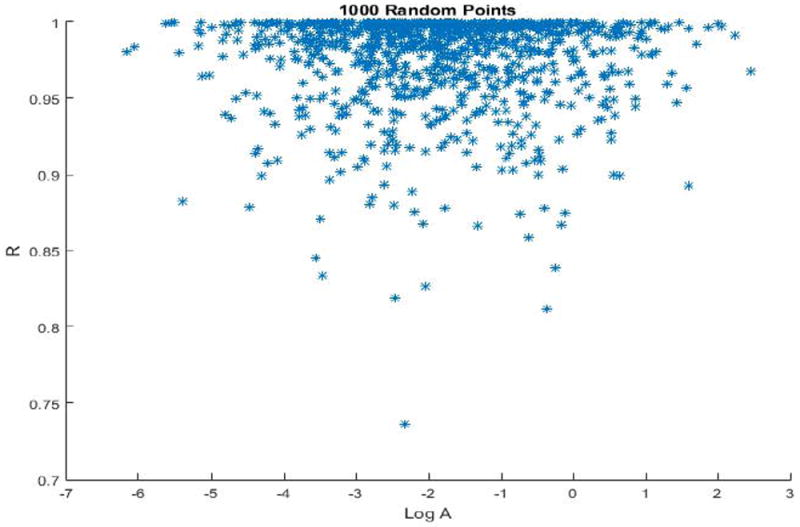
These are the thousand points sampled randomly from the A-R plane for the Monte Carlo simulation, according to distributions 2.6-2.8
E. Information Gain and Kullback-Leibler Divergence Computation
Once the MCMC is run on simulated experimental data, there will be a calculated posterior distribution of A and R values. Use of the Hastings algorithm in our MCMC will ensure noise in A and R choices, producing a distribution of A and R values as opposed to a single values. The posterior distribution of A and the inverse-CDF transformed version of R were approximately normally distributed. Since there were hundreds of thousands of points in our posterior distributions, calculating the Kullback-Leibler divergence by direct computation would be computationally infeasible. However, it can be shown [9] that, for 2 n-dimensional normal distributions with covariance matrices Σ1 and Σ2, and mean vectors of μ1 and μ2, the Kullback-Leibler divergence is given by:
| (2.12) |
Applying an inverse normal cdf to both the prior and posterior R distributions will allow them to be fit with a normal distribution, so the bivariate A-R prior and posterior distributions can both be fit with a multivariate normal distribution, and the Kullback-Leibler divergence can be calculated with the computationally efficient equation 2.12.
F. Optimal Sampling Schedule Preservation
In reality, medical studies are limited in the amount of data that can be collected from each patient. Given this 2-LTR model, the question of which schedule maximizes our information gain becomes increasingly important in designing optimal experiments. A main purpose of this study is to validate the UT method as a good approximation of multivariate distributions. Therefore, the UT method will be tested using experimental sampling from 3 different schedules: schedule 1 will be 10 points evenly spaced from 0 to 335 (in days), schedule 2 will be 10 points evenly spaced from 0 to 165, and schedule 3 will be 10 points evenly spaced from 165 to 335. Figure 4 shows an example experimental simulation with qPCR noise using schedule 1. From previous analysis of the model, peaks tend to happen within the first 2 weeks, as seen in this figure. Intuitively, the expected result of studying information from these schedules is that schedule 2 will give us the most information, followed by schedule 1, then schedule 3.
Fig. 4.
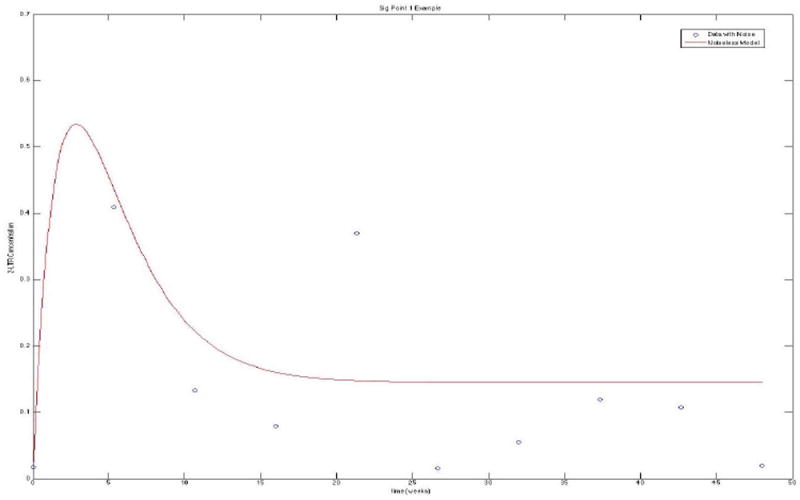
This is an experimental simulation of data from our first sigma point with noise, demonstrating the general behavior of our 2-LTR system
III. RESULTS
For all 3 schedules, MCMC simulations of our stochastic sampling of the 1000 A-R points (displayed in Figure 3) and all 5 sigma points (listed in Table 2) were carried through. The MCMC generates output as posterior distributions for all input simulated data. Posterior distributions from simulations using schedule 3, in general, tended to be more widespread and less informative than distributions using schedule 1 or 2. Stochastic simulations were run with 1000 points due to time limitations. According to Figure 3, this sampling of 1000 points appears to capture the behavior of the multivariate distribution well, although more samples would give us the most accurate results (see the Discussion section for more on this). After the posterior distributions were formed, the process described in section E was used to compute the Kullback-Leibler divergence for each point.
TABLE II.
List of final rotated sigma points given by the UT
| log A | R |
|---|---|
| -1.8450 | 0.9583 |
| -1.6821 | 0.1204 |
| -2.0079 | 0.9721 |
| 0.1805 | 0.9578 |
| -3.8704 | 0.9588 |
In comparing the Kullback-Leibler divergence values for both methods, it is necessary to note that the stochastic sampling tends to produce, mostly, only the A-R points that are most likely to occur according to the multivariate probability distribution. Our sigma points, however, are chosen from all parts of the plane (including the bottom point, which is not likely to occur). Therefore, when computing the average Kullback-Leibler divergence for the 5 sigma points, we weighted each value according to its relative probability of occurring, in order to make our UT results comparable to our Monte Carlo simulation results.
Figure 5,6 displays the average Kullback-Leibler computations for each schedule and method. The intuitive schedule ordering predicted in section II (2,1,3) was preserved in both the UT and the Monte Carlo simulations. The UT methods were simulated 200 times to generate the 95% confidence intervals in order to check the schedule ordering which might vary due to inherent stochastisticity. The results indicate that the schedule ordering did not change as the 95% confidence intervals suggest that the average information content in each schedule for the UT did not overlap. On the other hand obtaining 95% confidence intervals for the Monte Carlo Methods will be very time consuming and hence the simulations were run for a few number of times in order to check the ordering.
Fig. 5.
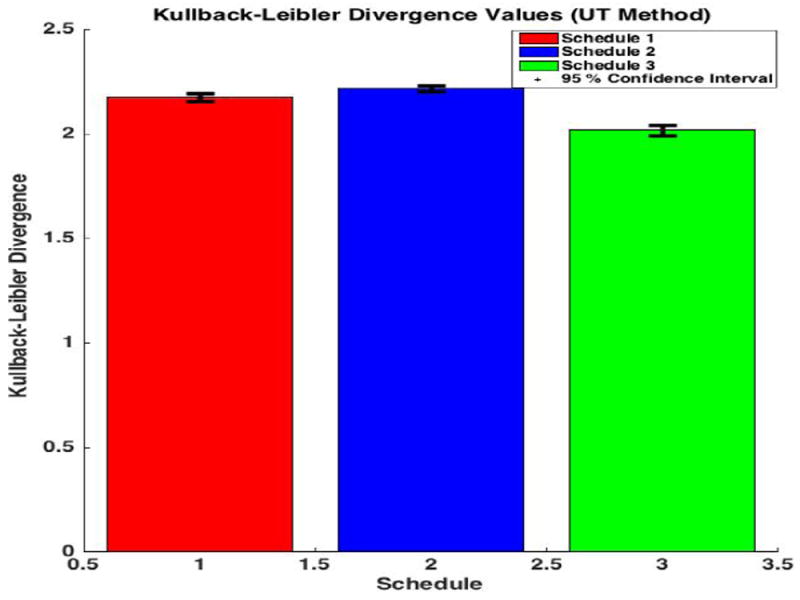
This bar graph displays our final average K-L Divergence values for different schedules using UT method, showing that schedules 2,1,3 as the optimal ordering.
Fig. 6.
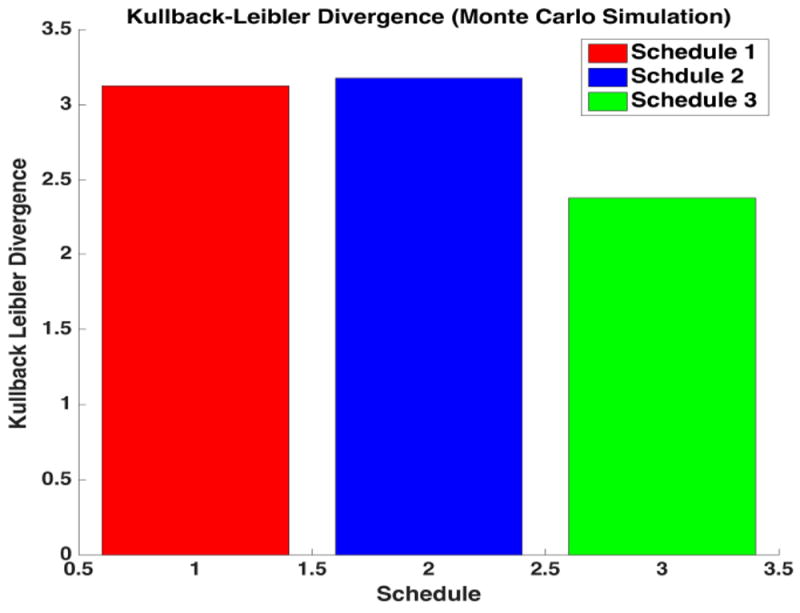
This bar graph displays our final average K-L Divergence values for different schedules using Monte Carlo method, showing that schedules 2,1,3 as the optimal ordering.
IV. DISCUSSION
While there are potential pitfalls in using the UT to model multivariate distributions, this method of sampling shows promise in preserving the optimal ordering of HIV sample schedules.
A problem with using the UT to estimate distributions is that our sigma points do not give us information about our censored measurement region. The method of rotating the sigma points to optimally preserve covariance can still produce the same set of sigma points for cases where the censoring region is quite different (i.e. if there was a censored region in the center of our A-R distributions, where no sigma points were produced, the UT method would fail to take this censoring into account). Thus, in testing this method for other applications in HIV modeling, it is important to note that the UT method does not retain information about censoring regions.
The ultimate goal for this project is to extend the UT method to a 5-dimensional distribution (of all the parameters in our 2-LTR model). Another factor this study did not consider was the actual Monte Carlo sampling itself. Using 1000 points was an arbitrary decision based on time constraints, because, in reality, more samples would give us the most accurate results. For a future study, Monte Carlo sampling could occur for as many points as needed to make the covariance matrix of the sampled points have a normed difference with the original covariance matrix (of the multivariate distribution) within a certain small limit. This would produce a number of samples needed in Monte Carlo simulation to obtain data within a desired error limit.
In order to confirm that the UT method preserves the order of expected information content, the UT method should be tested on many more schedules for optimal schedule order preservation. The performance on the three schedules with 10 time points each used in this study is promising, but cannot truly be generalized to arbitrary sampling schedules. Further study is needed to verify UT preservation of a larger number of schedules (specifically, similar schedules which produce similar results).
TABLE III.
Final Kullback-Leibler Divergence Results
| Schedule | UT K-L Div | MC K-L Div | Percent difference |
|---|---|---|---|
| 1 | 2.175 | 3.125 | 44 |
| 2 | 2.216 | 3.177 | 43 |
| 3 | 2.018 | 2.38 | 18 |
Footnotes
Research reported in this publication was supported by NIH Award Number R21AI110288, Merck, and Swarthmore College’s Eugene Lang Summer Research Grant.
References
- 1.Khalili Samira, Armaou Antonios. A hybrid stochastic/deterministic model of intracellular HIV infection dynamics and estimation of viral production parameters. American Control Conference (ACC); 2013. p. 1522. [Google Scholar]
- 2.Brussel Audrey, Mathez Dominique, Broche-Pierre Sophie, Lancar Rémi, Calvez Thierry, Sonigo Pierre, Leibowitch Jacques. Longitudinal monitoring of 2-long terminal repeat circles in peripheral blood mononuclear cells from patients with chronic HIV-1 infection. AIDS. 2003 Mar;17(5):645–652. doi: 10.1097/00002030-200303280-00001. [DOI] [PubMed] [Google Scholar]
- 3.Bushman Frederic. Measuring covert HIV replication during HAART: the abundance of 2-LTR circles is not a reliable marker. AIDS. 2003 Mar;17(5):749–750. doi: 10.1097/01.aids.0000050868.71999.09. [DOI] [PubMed] [Google Scholar]
- 4.Butler Scott L, Johnson Erik P, Bushman Frederic D. Human immunodeficiency virus cDNA metabolism: notable stability of two-long terminal repeat circles. J Virol. 2002 Apr;76(8):3739–3747. doi: 10.1128/JVI.76.8.3739-3747.2002. [DOI] [PMC free article] [PubMed] [Google Scholar]
- 5.Buzón Maria J, Massanella Marta, Llibre Josep M, Esteve Anna, Dahl Viktor, Puertas Maria C, Gatell Josep M, Domingo Pere, Paredes Roger, Sharkey Mark, Palmer Sarah, Stevenson Mario, Clotet Bonaventura, Blanco Julià, Martinez-Picado Javier. HIV-1 replication and immune dynamics are affected by raltegravir intensification of HAART-suppressed subjects. Nat Med. 2010 Apr;16(4):460–465. doi: 10.1038/nm.2111. [DOI] [PubMed] [Google Scholar]
- 6.Cannon LaMont, Vargas-Garcia Cesar A, Piovoso Michael J, Zurakowski Ryan. Prospective HIV clinical trial comparison by expected Kullback-Leibler divergence. American Control Conference; 2016. pp. 1295–1300. [DOI] [PMC free article] [PubMed] [Google Scholar]
- 7.Cardozo E Fabian, Luo Rutao, Piovoso Michael J, Zurakowski Ryan. Spatial modeling of HIV cryptic viremia and 2-LTR formation during raltegravir intensification. J Theor Biol. 2014 Mar;345:61–69. doi: 10.1016/j.jtbi.2013.12.020. [DOI] [PMC free article] [PubMed] [Google Scholar]
- 8.Quattara DA. Mathematical Analysis of the HIV-1 infection: Parameter estimation, therapies effectiveness and therapeutical failures. Engineering in Medicine and Biology Society 2005 IEEE-EMBS. 2006 Apr;:3029. doi: 10.1109/IEMBS.2005.1616541. [DOI] [PubMed] [Google Scholar]
- 9.Duchi J. Derivations for linear algebra and optimization. 2007 [Google Scholar]
- 10.Friedrich Brian, Li Guangyu, Dziuba Natallia, Ferguson Monique R. Quantitative PCR used to assess HIV-1 integration and 2-LTR circle formation in human macrophages, peripheral blood lymphocytes and a CD4+ cell line. Virol J. 2010;7:354. doi: 10.1186/1743-422X-7-354. [DOI] [PMC free article] [PubMed] [Google Scholar]
- 11.Gandhi Rajesh T, Coombs Robert W, Chan Ellen S, Bosch Ronald J, Zheng Lu, Margolis David M, Read Sarah, Kallungal Beatrice, Chang Ming, Goecker Erin A, Wiegand Ann, Kearney Mary, Jacobson Jeffrey M, D’Aquila Richard, Lederman Michael M, Mellors John W, Eron Joseph J AIDS Clinical Trials Group (ACTG) A5244 Team. No effect of raltegravir intensification on viral replication markers in the blood of HIV-1-infected patients receiving antiretroviral therapy. J Acquir Immune Defic Syndr. 2012 Mar;59(3):229–235. doi: 10.1097/QAI.0b013e31823fd1f2. [DOI] [PMC free article] [PubMed] [Google Scholar]
- 12.Graf Erin H, Mexas Angela M, Yu Jianqing J, Shaheen Farida, Liszewski Megan K, Di Mascio Michele, Migueles Stephen A, Connors Mark, O’Doherty Una. Elite suppressors harbor low levels of integrated HIV DNA and high levels of 2-LTR circular HIV DNA compared to HIV+ patients on and off HAART. PLoS Pathog. 2011 Feb;7(2):e1001300. doi: 10.1371/journal.ppat.1001300. [DOI] [PMC free article] [PubMed] [Google Scholar]
- 13.Hastings WK. Monte Carlo Sampling Methods Using Markov Chains and Their Applications. Biometrika. 1970 Apr;57(1):97–109. [Google Scholar]
- 14.Hatano Hiroyu, Strain Matthew C, Scherzer Rebecca, Bacchetti Peter, Wentworth Deborah, Hoh Rebecca, Martin Jeffrey N, McCune Joseph M, Neaton James D, Tracy Russell P, Hsue Priscilla Y, Richman Douglas D, Deeks Steven G. Increase in 2-long terminal repeat circles and decrease in D-dimer after raltegravir intensification in patients with treated HIV infection: a randomized, placebo-controlled trial. J Infect Dis. 2013 Nov;208(9):1436–1442. doi: 10.1093/infdis/jit453. [DOI] [PMC free article] [PubMed] [Google Scholar]
- 15.Julier S, Uhlmann J, Durrant-Whyte HF. A new method for the nonlinear transformation of means and covariances in filters and estimators. IEEE Transactions on Automatic Control. 2000 Mar;45(3):477–482. [Google Scholar]
- 16.Luo Rutao, Cardozo E Fabian, Piovoso Michael J, Wu Hulin, Buzon Maria J, Martinez-Picado Javier, Zurakowski Ryan. Modelling HIV-1 2-LTR dynamics following raltegravir intensification. Journal of the Royal Society Interface. 2013 Jul;10(84):20130186–20130186. doi: 10.1098/rsif.2013.0186. [DOI] [PMC free article] [PubMed] [Google Scholar]
- 17.Luo Rutao, Piovoso Michael J, Zurakowski Ryan. Modeling Uncertainty in Single-Copy Assays for HIV. J Clin Microbiol. 2012 Jul;50(10):3382–3383. doi: 10.1128/JCM.01254-12. [DOI] [PMC free article] [PubMed] [Google Scholar]
- 18.Morlese John, Teo Ian A, Choi Ji-won, Gazzard Brian, Shaunak Sunil. Identification of two mutually exclusive groups after long-term monitoring of HIV DNA 2-LTR circle copy number in patients on HAART. AIDS. 2003 Mar;17(5):679–683. doi: 10.1097/00002030-200303280-00005. [DOI] [PubMed] [Google Scholar]
- 19.Pace Matthew J, Graf Erin H, O’Doherty Una. HIV 2-long terminal repeat circular DNA is stable in primary CD4+T Cells. Virology. 2013 Jun;441(1):18–21. doi: 10.1016/j.virol.2013.02.028. [DOI] [PMC free article] [PubMed] [Google Scholar]
- 20.Panther LA, Coombs RW, Aung SA, dela Rosa C, Gretch D, Corey L. Unintegrated HIV-1 circular 2-LTR proviral DNA as a marker of recently infected cells: relative effect of recombinant CD4, zidovudine, and saquinavir in vitro. J Med Virol. 1999 Jun;58(2):165–173. doi: 10.1002/(sici)1096-9071(199906)58:2<165::aid-jmv11>3.0.co;2-1. [DOI] [PubMed] [Google Scholar]
- 21.Panther LA, Coombs RW, Zeh JE, Collier AC, Corey L. Unintegrated circular HIV-1 DNA in the peripheral mononuclear cells of HIV-1-infected subjects: association with high levels of plasma HIV-1 RNA, rapid decline in CD4 count, and clinical progression to AIDS. J Acquir Immune Defic Syndr Hum Retrovirol. 1998 Apr;17(4):303–313. doi: 10.1097/00042560-199804010-00003. [DOI] [PubMed] [Google Scholar]
- 22.Pauza CD, Trivedi P, McKechnie TS, Richman DD, Graziano FM. 2-LTR circular viral DNA as a marker for human immunodeficiency virus type 1 infection in vivo. Virology. 1994 Dec;205(2):470–478. doi: 10.1006/viro.1994.1667. [DOI] [PubMed] [Google Scholar]
- 23.Pierson Theodore C, Kieffer Tara L, Ruff Christian T, Buck Christopher, Gange Stephen J, Siliciano Robert F. Intrinsic stability of episomal circles formed during human immunodeficiency virus type 1 replication. J Virol. 2002 Apr;76(8):4138–4144. doi: 10.1128/JVI.76.8.4138-4144.2002. [DOI] [PMC free article] [PubMed] [Google Scholar]
- 24.Piovoso MJ, Zurakowski R. Evaluation of HIV 2-LTR formation models using monotone system theory. American Control Conference (ACC); 2014; IEEE; 2014. pp. 2747–2752. [Google Scholar]
- 25.Reigadas Sandrine, Andréola Marie Line, Wittkop Linda, Cosnefroy Ophélie, Anies Guerric, Recordon-Pinson Patricia, Thiébaut Rodolphe, Masquelier Bernard, Fleury Hervé. Evolution of 2-long terminal repeat (2-LTR) episomal HIV-1 DNA in raltegravir-treated patients and in in vitro infected cells. J Antimicrob Chemother. 2010 Mar;65(3):434–437. doi: 10.1093/jac/dkp473. [DOI] [PubMed] [Google Scholar]
- 26.Teo IA, Morlese J, ChoiJ W, Shaunak S. Reliable and reproducible LightCycler qPCR for HIV-1 DNA 2-LTR circles. J Immunol Methods. 2002 Dec;270(1):109–118. doi: 10.1016/s0022-1759(02)00217-x. [DOI] [PubMed] [Google Scholar]
- 27.Zhu Weijun, Jiao Yanmei, Lei Rongyue, Hua Wei, Wang Rui, Ji Yunxia, Liu Zhiying, Wei Feili, Zhang Tong, Shi Xuanlin, Wu Hao, Zhang Linqi. Rapid turnover of 2-LTR HIV-1 DNA during early stage of highly active antiretroviral therapy. PLoS ONE. 2011;6(6):e21081. doi: 10.1371/journal.pone.0021081. [DOI] [PMC free article] [PubMed] [Google Scholar]


