Abstract
The water-splitting reaction provides a promising mechanism to store renewable energies in the form of hydrogen fuel. The oxidation half-reaction, the oxygen evolution reaction (OER), is a complex four-electron process that constitutes an efficiency bottleneck in water splitting. Here we report a highly active OER catalyst, cobalt vanadium oxide. The catalyst is designed on the basis of a volcano plot of metal–OH bond strength and activity. The catalyst can be synthesized by a facile hydrothermal route. The most active pure-phase material (a-CoVOx) is X-ray amorphous and provides a 10 mA cm–2 current density at an overpotential of 347 mV in 1 M KOH electrolyte when immobilized on a flat substrate. The synthetic method can also be applied to coat a high-surface-area substrate such as nickel foam. On this three-dimensional substrate, the a-CoVOx catalyst is highly active, reaching 10 mA cm–2 at 254 mV overpotential, with a Tafel slope of only 35 mV dec–1. This work demonstrates a-CoVOx as a promising electrocatalyst for oxygen evolution and validates M–OH bond strength as a practical descriptor in OER catalysis.
Keywords: oxygen evolution reaction, cobalt vanadium oxide, electrocatalyst, volcano plot, amorphous materials
1. Introduction
Water splitting (2H2O → 2H2 + O2) is an attractive reaction to enable the storage of intermittent renewable energies such as sunlight and wind, in the form of a chemical fuel, namely, hydrogen.1 Water splitting has a bottleneck that arises from its four-electron oxidative half-reaction, the oxygen evolution reaction (OER), 2H2O → 4H+ + O2 + 4e–. In order to accelerate its sluggish kinetics and to achieve the production of hydrogen fuel at a practicable rate, catalysts are necessary. State-of-the-art OER catalysts, based on precious metals such as IrO2 and RuO2, can perform the OER in acidic solutions with an overpotential close to 200 mV.2 However, the scarcity and cost of those metals limit their potential for large-scale applications. Developing earth-abundant OER catalysts is therefore crucial. A growing number of catalysts based on earth-abundant transition-metal oxides have been studied for OER in alkaline conditions, some of which are reported to surpass IrO2 and RuO2 in activity.3−5
While the development of OER catalysts remains mostly empirical, significant work has been done to search for theoretical guidelines for catalyst discovery. The “descriptor” approach is appealing because it allows systematic tuning of catalysts using a single measurable or calculable parameter. Some of the most successful descriptors for OER include the M–OH bond strength, the eg occupancy and (ΔGO* – ΔGHO*).6−8 Application of these descriptors in experimental work, however, is limited.7,9
We recently measured the intrinsic activity of a range of transition-metal oxide thin film catalysts and found the activity correlated with the M–OH bond strength proposed by Bockris and Otagawa in a volcano-type plot (Figure 1).6,10 Typically, with the descriptor approach, the correlation reveals neither the nature of the active species nor the physical origins of the activity of mixed oxide catalysts such as NiFeOx and CoFeOx, which is still under investigation and actively debated.11,12 However, it explains the superior activity of NiFeOx and CoFeOx in an approximate, yet much simpler way, in that NiOx and CoOx are on a different branch of the volcano plot from FeOx, such that their mixtures may benefit from a balance of M–OH bond strengths to reach optimal activity. Given that the presence of iron is essential in most highly active mixed metal oxide catalysts, we became interested in developing iron-free catalysts to enrich the repertoire of OER catalysts. Since VOx sits in the same branch as FeOx in the volcano plot, we turned our attention of V-containing mixed oxides. As an early transition metal, V is rarely explored for OER with the exception of some recent studies.13−15 For example, Sun et al. described the promising OER activity of a NiV layered double hydroxide (LDH),14 and Wang and co-workers showed lepidocrocite VOOH as a competent OER catalyst.15 According to the volcano plot, we predicted that CoVOx might exhibit high OER activity since CoOx and VOx sit at the two opposite branches. We thus prepared amorphous CoVOx catalysts via a simple hydrothermal method, and they indeed exhibit excellent OER activity.
Figure 1.
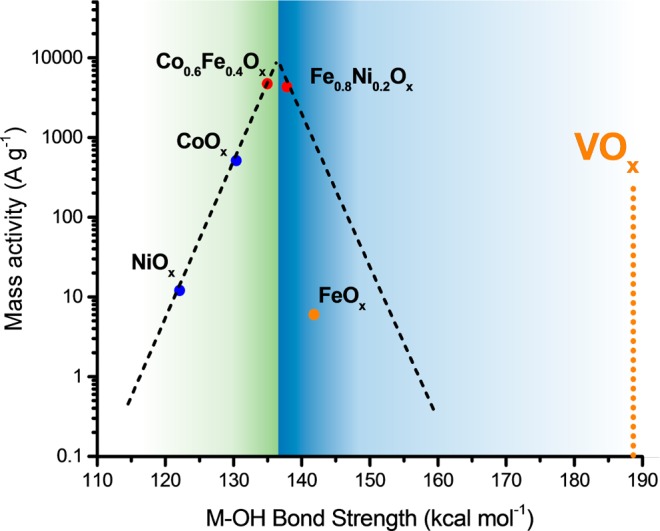
Volcano plot of OER activity versus M–OH bond strength, modified from ref (10) with addition of theoretical M–OH bond strength of vanadium oxide (VOx) from ref (6).
2. Results and Discussion
In order to produce a binary metal oxide made of cobalt and vanadium, a hydrothermal synthesis was performed in a Teflon lined stainless steel autoclave (see Experimental Section for details). Control samples were also prepared by using the same hydrothermal method with individual metal salts in order to obtain cobalt oxide and vanadium oxide (CoOx and VOx). The powdered catalysts were immobilized on a glassy carbon electrode, and cyclic voltammetry was performed in a 1 M KOH electrolyte (pH 13.6). The OER activity is presented in Figure 2. Each oxide was tested in normal KOH electrolyte, as well as in purified Fe-free KOH, where trace iron was removed according to a procedure reported by Trotochaud et al.12 The binary cobalt vanadium oxide (named m-CoVOx in this work due to its mixed-phase composition, vide infra) exhibits high activity for water oxidation, reaching 10 mA cm–2 at an overpotential of 366 and 358 mV in normal and Fe-free KOH, respectively. This current density is taken as a reference as it is the one expected at the anode in a 12.3% efficient solar water-splitting device under 1-sun illumination.4 The control samples made with the unary metal oxide constituents of this catalyst (CoOx and VOx) required higher overpotentials for the same current densities. It was found that the overpotentials for m-CoVOx do not differ noticeably whether a trace amount of iron is present or not in the electrolyte. Thus, iron incorporation seemed not to play an essential role in the OER activity of this material, in contrast to NiOx.5,12,16 The Tafel slopes are 65 (63) mV dec–1 for m-CoVOx, 57 (59) mV dec–1 for CoOx, and 97 (142) mV dec–1 for VOx in normal 1 M KOH (with Fe-free KOH values in parentheses) (Figure S1).
Figure 2.
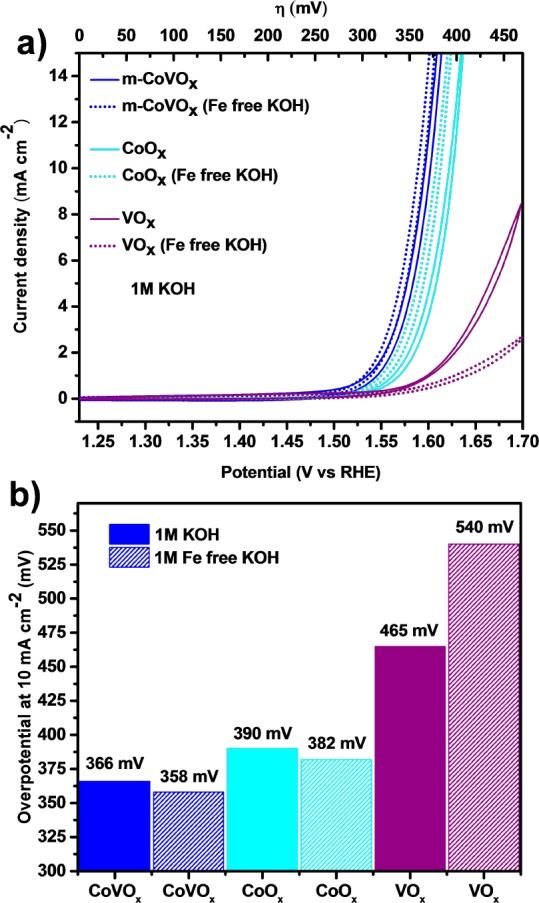
(a) Polarization curves for m-CoVOx, CoOx and VOx (loadings 140 μg cm–2) in 1 M KOH and 1 M Fe-free KOH. Scan rate: 10 mV s–1; iR drop corrected. (b) Extracted overpotentials at 10 mA cm–2.
The composition and crystallinity of both control samples (CoOx and VOx) and m-CoVOx were analyzed by XRD (Figure 3a). All three samples show evidence of crystallinity. The m-CoVOx sample exhibits diffraction peaks similar to those of the control CoOx sample (Figure S2a), and no crystalline cobalt vanadium oxide phase could be identified in the XRD pattern of m-CoVOx. The diffraction peaks of the CoOx control sample correspond to a cobalt chloride carbonate hydroxide hydrate phase (Co(CO3)0.35Cl0.2(OH)1.10·1.74 H2O, JSPDS 00-038-0547) (Figure S2b,c). Therefore, the crystallinity of the m-CoVOx sample is presumed to come from this cobalt chloride carbonate hydroxide hydrate phase, but not from crystalline cobalt vanadium oxide. The vanadium oxide (VOx) control sample was identified as the haggite phase (V2O2(OH)3, JSPDS 01-072-1228) (Figure S2d).
Figure 3.
(a) XRD patterns of m-CoVOx, CoOx and VOx samples. (b) SEM images of m-CoVOx. The disorganized phase is highlighted in blue and the nanoneedles in red.
The morphology of the different metal oxides was analyzed by SEM. Two types of structures were observed in the m-CoVOx sample: the first is composed of nanoneedles, while the second is a more disorganized phase (Figure 3b). The nanoneedles can be attributed to the cobalt chloride carbonate hydroxide hydrate phase by comparison to the SEM image of CoOx control sample (Figure S3). TEM of the disorganized phase reveals its polycrystalline nature and lattice fringes can be observed on the HR-TEM image (Figure S4a). In the STEM-EDX mapping, cobalt and vanadium are continuously observed as a mixture, and the cobalt chloride carbonate hydroxide hydrate phase could be identified as red particles on the Co–V map (Figure S4b). Thus, the m-CoVOx sample here is composed of a heterogeneous mixture with a crystalline cobalt chloride carbonate hydroxide hydrate phase and an X-ray amorphous phase containing cobalt and vanadium.
The hydrothermal method was further applied to grow the m-CoVOx sample directly on nickel foam (NF). The deposited catalyst is also composed of a heterogeneous mixed phase. Intricate nanoleaves and microscopic square crystals can be observed by SEM (Figure S5). The catalyst on nickel foam reached 10 mA cm–2 at overpotentials of 293 and 298 mV in 1 M KOH and 1 M Fe-free KOH, respectively (Figure S6a). The stability of this catalyst was evaluated by monitoring the potential at 10 mA cm–2. No significant changes were observed during 15 h of electrolysis (Figure S6b), indicating good stability.
Because the m-CoVOx sample contains a crystalline Co oxide that was less active toward OER (vide supra), we considered this Co phase as an impurity and concentrated our efforts in synthesizing a pure single-phase cobalt vanadium oxide catalyst in order to yield higher activity. This was successful using the same hydrothermal method but with the addition of trisodium citrate as an additive. Different ratios of cobalt and vanadium salts were used in order to tune the composition of the oxide and optimize the catalytic activity. Five different Co:V ratios were tried (Co:V mole ratios in the hydrothermal solution: 5:1, 3:1, 1:1, 1:3 and 1:5), and the obtained materials were evaluated for OER on a glassy carbon electrode. All catalysts were scanned by cyclic voltammetry in 1 M KOH and 1 M Fe-free KOH, although the presence of trace iron in the KOH did not affect OER activity (Figure S7a). The Co:V ratio yielding the highest activity was 3:1 (Figure S7b).
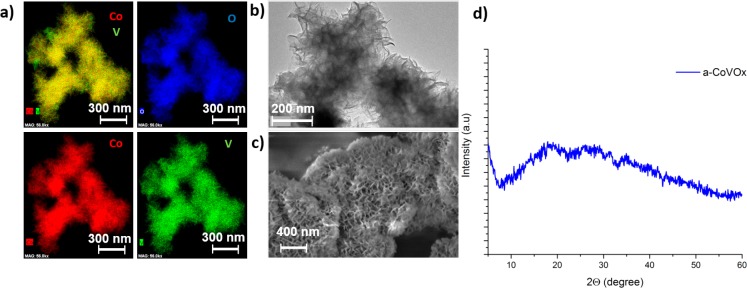
The STEM images and EDX mapping of the cobalt vanadium oxide with a 3:1 Co:V ratio (Figure 4a) confirmed the formation of cobalt vanadium oxide phase. Both Co and V are homogeneously dispersed throughout the sample, and neither CoOx nor VOx particles were observed. The sample has a nanosheet-like morphology (Figure 4b,c), and the absence of diffraction peaks in its XRD pattern suggests it is X-ray amorphous and that no crystalline CoOx or VOx impurities are present. This confirms the formation of a pure-phase cobalt vanadium oxide (Figure 4d), which is labeled as a-CoVOx. When deposited on nickel foam, the a-CoVOx has a similar morphology and homogeneously coats the three-dimensional substrate (Figure S8).
Figure 4.
(a) STEM-EDX map of a-CoVOx. (b) TEM image of a-CoVOx. (c) SEM image of a-CoVOx. (d) XRD pattern of a-CoVOx.
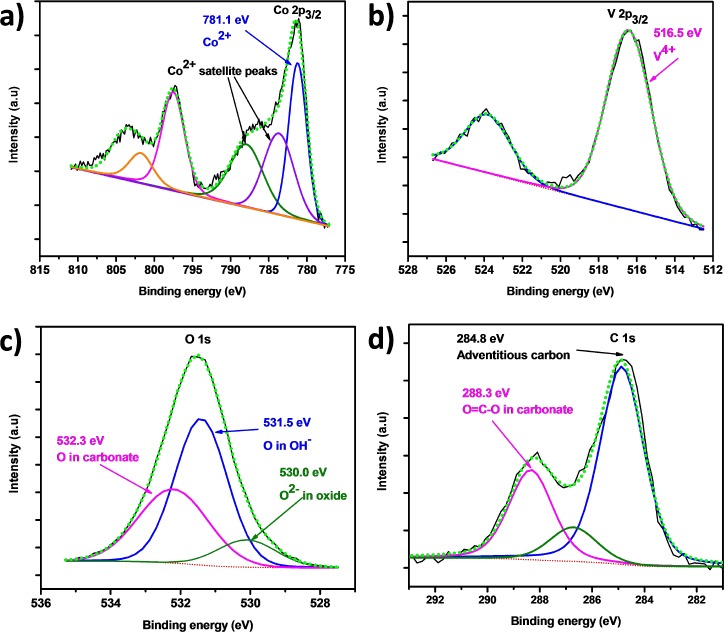
The a-CoVOx catalyst was further characterized by X-ray photoelectron spectroscopy (XPS) (Figure 5). The binding energy (BE) of the Co 2p3/2 signal is 781.1 eV. Moreover, outer-shell excitation satellite peaks are visible at lower BE, indicating high-spin Co2+.17 Vanadium is incorporated into the catalyst in the +4 oxidation state, as suggested by the V 2p3/2 peak at a BE of 516.5 eV.18 The signal at 288.3 eV in the C 1s region is representative of carbon atoms in a carbonate group. The signal at a BE of 531.5 and 530.0 eV, in the O 1s region, is representative of oxygen atoms in OH– groups and O2– in transition-metal (oxy)hydroxides, respectively. The signal at BE = 532.3 eV, characteristic of oxygen atoms in a carbonate group, further suggests the presence of this group in the material.19 The atomic ratio of cobalt to vanadium (Co:V) determined by XPS is approximately 75%/25% (3:1) and is consistent with the ratio of the two metal salts in the precursor solution for the hydrothermal synthesis. However, this agreement was somewhat fortuitous as there was otherwise a modest discrepancy between the ratios of the metal salts used in the precursor solutions and those of final catalysts for the other ratios used (Table S1).
Figure 5.
XPS spectra of a-CoVOx with high resolution spectra of (a) Co 2p3/2 region, (b) V 2p3/2 region, (c) O 1s region, and (d) C 1s region.
As we used a sodium salt (trisodium citrate) as an additive to synthesize the pure phase a-CoVOx, we investigated if sodium incorporation could influence the OER activity of this material. We found that a-CoVOx does not contain sodium in its structure after the hydrothermal synthesis (Figure S9a). We performed cyclic voltammetry in Fe-free NaOH in order to incorporate sodium, and we determined that the OER activity of a-CoVOx did not increase in this electrolyte compared to Fe-free KOH (Figure S9b).
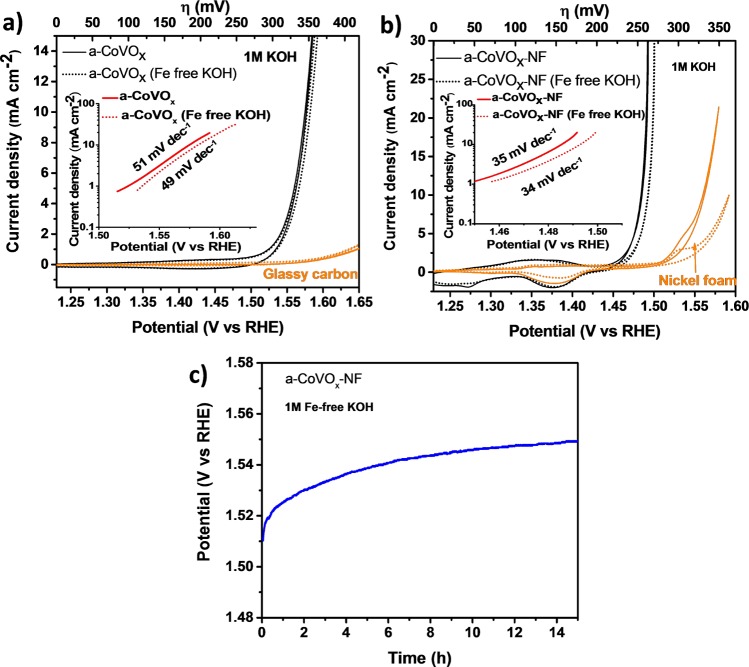
The catalytic activity of a-CoVOx was measured on glassy carbon and nickel foam (Figure 6a,b). In the first case the a-CoVOx reached 10 mA cm–2 at an overpotential of 347 and 351 mV in 1 M KOH and 1 M Fe-free KOH electrolytes, with Tafel slopes of 51 and 49 mV dec–1, respectively. When deposited on nickel foam the catalysts delivered the same current density at an overpotential of 254 and 262 mV in standard and iron-free 1 M KOH, with Tafel slopes of 35 and 34 mV dec–1, respectively. The overpotential for a-CoVOx compares well with other cobalt vanadium oxide catalysts, such as Co2V2O7 (340 mV),20 Co3V2O8 (359 mV),21 and Co3V2O8 nanoroses (391 mV).22 Additionally, a-CoVOx is highly competitive with other cobalt-containing catalysts on nickel foam (NF), such as Co3O4/NF (497 mV),23 NiCo LDH/NF (420 mV),24 NiCo DH/N-graphene/NF (350 mV),25 CoP/NF (290 mV),26 CoFeOx/NF and NiCoFeOx/NF (260 and 240 mV).10 In addition, the a-CoVOx immobilized on NF exhibited considerable catalytic durability and stability, with only a moderate increase of 30 mV in overpotential after 15 h of constant anodic polarization at 10 mA cm–2 (Figure 6c). After the long-term stabilily test, the morphology and elemental composition of a-CoVOx were investigated by SEM and STEM-EDX. Structural degradation can be observed but the a-CoVOx catalyst retains its nanosheet-like morphology (Figure S10a,b,c). The EDX mapping indicates that Co and V are still homogeneously dispersed inside the material (Figure S10d), and no inclusion of nickel could be observed during the 15 h electrolysis (Figure S10e) Furthermore, the faradaic efficiency for OER was measured to be close to 100% (Figure S11).
Figure 6.
(a) Polarization curves for a-CoVOx on glassy carbon (loading 140 μg cm–2) in 1 M KOH and 1 M Fe-free KOH. Scan rate: 10 mV s–1; iR drop corrected. (b) Polarization curves for a-CoVOx on nickel foam in 1 M KOH and 1 M Fe-free KOH. Scan rate: 1 mV s–1; iR drop corrected. (c) Stability of the applied potential of a-CoVOx on nickel foam at 10 mA cm–2.
Our group recently reported a volcano plot that compared the mass activity trends of different electrodeposited transition-metal (oxy)hydroxides based on their respective M–OH bond strength.10 Even though the M–OH bond strength is not a definitive descriptor of OER activity, Bockris and Otagawa proposed that this parameter should allow the extraction of activity trends for metal oxides.6,27 The bond strength D(M–OH) was defined as the sum of the heterolytic Dion(M–OH) and homolytic Dcov(M–OH) bond dissociation of a metal hydroxide in the MIII(OH)3 form. For the determination of D(M–OH) in our a-CoVOx, we simply treated them as a physical binary mixture and used a linear combination of the bond strengths of the respective unary metal hydroxides (Table S2). By taking into consideration the mass activity of a-CoVOx with different Co:V atomic ratios (Figure S12, Table S3), we could correlate it with their respective M–OH bond strength and a volcano-shaped plot was obtained (Figure 7). The agreement between the theoretical lines and the experimental data is surprisingly good given the simplifications made in the construction of this plot. The optimal catalyst found experimentally, a-Co0.75V0.25Ox, sits close to the top of the volcano.
Figure 7.
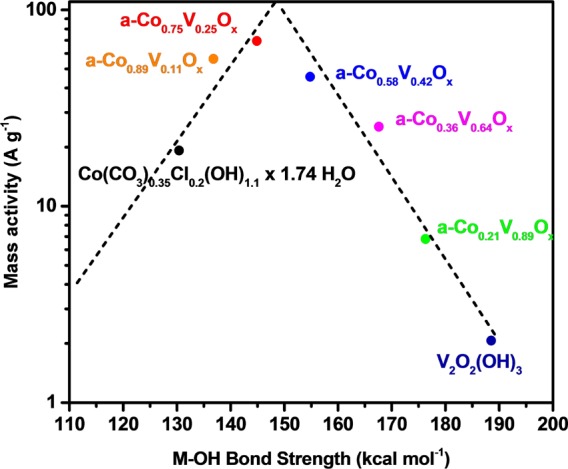
Volcano plot of the mass activity vs M–OH bond strength of various a-CoyV1–yOx and control cobalt and vanadium oxides samples.
3. Conclusions
On the basis of the volcano plot of OER activity versus M–OH bond strength, cobalt vanadium oxide was predicted to be a highly active OER catalyst. A simple hydrothermal route was thus developed to prepare the targeted compound. A pure-phase, amorphous cobaltvanadium oxide (a-CoVOx) was obtained and characterized by XRD, XPS, SEM, and STEM-EDX. This a-CoVOx catalyst showed high catalytic activity for oxygen evolution. On a flat glassy carbon electrode, the catalyst reached 10 mA cm–2 at an overpotential of 347 mV in 1 M KOH electrolyte. When deposited on Ni foam, the a-CoVOx reached reached 10 mA cm–2 at a 254 mV overpotential, making it among the most active electrodes in alkaline conditions. The activity of various a-CoVOx samples with different Co:V ratios correlates with the M–OH bond strength in a volcano-type plot. This work demonstrates the utility of a simple descriptor (M–OH bond strength) for experimental developments of OER catalysts, and advocates the further exploration of vanadium-containing oxides in OER.
4. Experimental Section
All reagents were obtained from commercial sources and used without further purification. Millipore deionized water 18.2 MΩ·cm was used to prepare all the solutions.
All the catalysts were prepared by hydrothermal synthesis in Teflon-lined stainless steel autoclaves. For m-CoVOx, an aqueous solution containing 30 mM of cobalt(II) chloride (CoCl2, anhydrous, > 98%, Fluka), 10 mM of vanadium(III) chloride (VCl3, anhydrous, 97%, Sigma), and 63 mM urea (99%, ACS reagent) was loaded into the autoclave and heated at 150 °C for 14 h. The control samples (CoOx and VOx), based on only one of the two metals, were prepared by the same procedure except only the desired metal salt (CoCl2 or VCl3) was used with a concentration of 40 mM to keep the total amount of metal cations constant. After the hydrothermal step, the powders were separated by centrifugation at 6000 rpm for 10 min and washed three times with a 50:50 mixture of H2O and ethanol, with centrifugation between each washing step. The powders were then collected and dried overnight under vacuum at room temperature.
The amorphous pure-phase catalysts (a-CoVOx) were prepared following a procedure similar to the one described above. The only modifications were the addition of 80 mM trisodium citrate (TSC, anhydrous, 98%, Acros), and purging the solution with N2. a-CoVOx with different Co:V atomic ratios (a-CoyV1–yOx) were synthesized by tuning the ratio of starting materials (CoCl2 and VCl3) while keeping the total metal cation concentration at 40 mM.
The prepared catalyst powders (5 mg) were each sonicated twice for 30 min in a mixture of H2O (1 mL), iPrOH (0.25 mL) and a Nafion solution (10 μL, 5 wt % in EtOH, DuPont) in order to make an homogeneous suspension. Then, 2.5 μL of this suspension was drop cast on a glassy carbon electrode (CH Instruments) with a diameter of 3 mm and previously polished (with 0.05 μm gamma alumina powder on a microcloth polishing pad, CH Instruments). The drop was allowed to dry in ambient conditions for 30 min. The catalyst loading was 140 μg cm–2 in all cases.
The catalysts were also synthesized on nickel foam (thickness 1.6 mm, porosity 95%, Goodfellow Cambridge Limited) by putting the nickel foam substrate in the same solutions as for the hydrothermal synthesis and heating at 150 °C for 14 h. The active area was delimited by applying epoxy glue (SPI Supplies) on the nickel foam and carefully pressing on it with a metal rod to make it fill all the pores in order to prevent electrolyte from reaching the potentiostat clamp by capillary action.
The OER activity and stability were measured by cyclic voltammetry and chronopotentiometry using a Metrohm Autolab potentiostat/galvanostat. The third CV was taken as representative measurement for all samples on glassy carbon and the tenth CV for the nickel foam substrates. A three-electrode setup was used with either the glassy carbon electrode or nickel foam substrate as working electrode, a platinum wire as counter electrode, and Ag/AgCl (sat. KCl) as reference electrode. Stirring was performed only during the stability measurements. Standard 1 M KOH solution (pH 13.6, Merk) and NaOH solution (pH 13.6, Reactolab) were used as received and/or further purified to remove trace iron using a procedure reported by the Boettcher group.12
The uncompensated resistance for each sample was measured by electrochemical impedance spectroscopy (EIS) in order to correct for the iR drop. The EIS data were collected at 1.20 V vs RHE and by applying 41 frequencies from 100 kHz to 1 Hz (10 mV amplitude). The resistance was determined to be 0.6–0.8 Ω cm2 for the samples on glassy carbon, and 1.0–1.4 Ω cm2 on nickel foam.
The faradaic efficiency was measured using an airtight glass H-cell with an optical fluorescence sensor (Ocean Optics). Quantification was done for a-Co0.75V0.25Ox deposited on nickel foam. The cell was purged with N2 to give an initial O2 content lower than 0.5%. The measurement was done at 10 mA cm–2 in 1 M Fe-free KOH.
The X-ray powder diffraction (XRD) was recorded on a PANalytical Empyrean diffractometer with Bragg–Brentano geometry, equipped with a PIXcel-1D detector. For the measurement, powders were mixed with EtOH and drop-dried on glass slides. Data were analyzed with PANanalytical X’Pert HighScore software. XPS analysis was carried out using a PHI VersaProbe II scanning XPS microprobe with monochromatic Al Kα X-ray source of 24.8 W with a beam size of 100 μm. The adventitious carbon 1s peak was calibrated at 284.8 eV and used as an internal standard to compensate for charging effects. Data were fitted by using PHI MultiPak software. SEM images were taken using a Zeiss Merlin microscope operated at 2 kV and equipped with an Inlens secondary electron detector. TEM images and STEM/EDX maps were recorded using a FEI Technai Osiris TEM/STEM operated at 200 kV equipped with a high-brightness XFEG gun and with a FEI Talos operated at 200 kV. TEM samples were prepared by drop-drying either suspension of the powders in EtOH onto carbon coated copper grids or a suspension made by sonicating the nickel foam electrode for 30 min in EtOH to detached catalyst particles from the NF surface
Acknowledgments
This project has received funding from the European Research Council (ERC) under the European Union’s Horizon 2020 research and innovation programme (grant agreement no. 681292). The authors thank Dr. Fang Song (EPFL) for the TEM and STEM-EDX measurements, Dr. Jordan Katz (Denison University) for editing and proofreading of the manuscript, and Ms. Prune Hu (Suricate Design) for the Table of Content graphic.
Supporting Information Available
The Supporting Information is available free of charge on the ACS Publications website at DOI: 10.1021/acscatal.7b03198.
Experimental and spectral data (PDF)
Author Contributions
The manuscript was written through contributions of all authors and they have given their approval to the final version of the manuscript.
The authors declare no competing financial interest.
Supplementary Material
References
- Lewis N. S.; Nocera D. G. Proc. Natl. Acad. Sci. U. S. A. 2006, 103, 15729–15735. 10.1073/pnas.0603395103. [DOI] [PMC free article] [PubMed] [Google Scholar]
- a Lee Y.; Suntivich J.; May K. J.; Perry E. E.; Shao-Horn Y. J. Phys. Chem. Lett. 2012, 3, 399–404. 10.1021/jz2016507. [DOI] [PubMed] [Google Scholar]; b Cook T. R.; Dogutan D. K.; Reece S. Y.; Surendranath Y.; Teets T. S.; Nocera D. G. Chem. Rev. 2010, 110, 6474–6502. 10.1021/cr100246c. [DOI] [PubMed] [Google Scholar]
- a Yeo B. S.; Bell A. T. J. Am. Chem. Soc. 2011, 133, 5587–5593. 10.1021/ja200559j. [DOI] [PubMed] [Google Scholar]; b Smith R. D. L.; Prévot M. S.; Fagan R. D.; Zhang Z.; Sedach P. A.; Siu M. K. J.; Trudel S.; Berlinguette C. P. Science 2013, 340, 60–63. 10.1126/science.1233638. [DOI] [PubMed] [Google Scholar]; c Trotochaud L.; Ranney J. K.; Williams K. N.; Boettcher S. W. J. Am. Chem. Soc. 2012, 134, 17253–17261. 10.1021/ja307507a. [DOI] [PubMed] [Google Scholar]
- McCrory C. C. L.; Jung S.; Peters J. C.; Jaramillo T. F. J. Am. Chem. Soc. 2013, 135, 16977–16987. 10.1021/ja407115p. [DOI] [PubMed] [Google Scholar]
- Louie M. W.; Bell A. T. J. Am. Chem. Soc. 2013, 135, 12329–12337. 10.1021/ja405351s. [DOI] [PubMed] [Google Scholar]
- Bockris J. O. M.; Otagawa T. J. Electrochem. Soc. 1984, 131, 290–302. 10.1149/1.2115565. [DOI] [Google Scholar]
- Suntivich J.; May K. J.; Gasteiger H. A.; Goodenough J. B.; Shao-Horn Y. Science 2011, 334, 1383–1385. 10.1126/science.1212858. [DOI] [PubMed] [Google Scholar]
- Man I. C.; Su H. Y.; Calle-Vallejo F.; Hansen H. A.; Martínez J. I.; Inoglu N. G.; Kitchin J.; Jaramillo T. F.; Nørskov J. K.; Rossmeisl J. ChemCatChem 2011, 3, 1159–1165. 10.1002/cctc.201000397. [DOI] [Google Scholar]
- Grimaud A.; May K. J.; Carlton C. W.; Lee Y. L.; Risch M.; Hong W. T.; Zhou J.; Shao-Horn Y. Nat. Commun. 2013, 4, 2439. 10.1038/ncomms3439. [DOI] [PubMed] [Google Scholar]
- Morales-Guio C. G.; Liardet L.; Hu X. J. Am. Chem. Soc. 2016, 138, 8946–8957. 10.1021/jacs.6b05196. [DOI] [PubMed] [Google Scholar]
- a Friebel D.; Louie M. W.; Bajdich M.; Sanwald K. E.; Cai Y.; Wise A. M.; Cheng M. J.; Sokaras D.; Weng T. C.; Alonso-Mori R.; Davis R. C.; Bargar J. R.; Nørskov J. K.; Nilsson A.; Bell A. T. J. Am. Chem. Soc. 2015, 137, 1305–1313. 10.1021/ja511559d. [DOI] [PubMed] [Google Scholar]; b Stevens M. B.; Trang C. D. M.; Enman L. J.; Deng J.; Boettcher S. W. J. Am. Chem. Soc. 2017, 139, 11361–11364. 10.1021/jacs.7b07117. [DOI] [PubMed] [Google Scholar]; c Burke M. S.; Kast M. G.; Trotochaud L.; Smith A. M.; Boettcher S. W. J. Am. Chem. Soc. 2015, 137, 3638–3648. 10.1021/jacs.5b00281. [DOI] [PubMed] [Google Scholar]
- Trotochaud L.; Young S. L.; Ranney J. K.; Boettcher S. W. J. Am. Chem. Soc. 2014, 136, 6744–6753. 10.1021/ja502379c. [DOI] [PubMed] [Google Scholar]
- Eftekhari A. Mater. Today Energy 2017, 5, 37–57. 10.1016/j.mtener.2017.05.002. [DOI] [Google Scholar]
- Fan K.; Chen H.; Ji Y.; Huang H.; Claesson P. M.; Daniel Q.; Philippe B.; Rensmo H.; Li F.; Luo Y.; Sun L. Nat. Commun. 2016, 7, 11981. 10.1038/ncomms11981. [DOI] [PMC free article] [PubMed] [Google Scholar]
- Shi H.; Liang H.; Ming F.; Wang Z. Angew. Chem., Int. Ed. 2017, 56, 573–577. 10.1002/anie.201610211. [DOI] [PubMed] [Google Scholar]
- Corrigan D. J. Electrochem. Soc. 1987, 134, 377–384. 10.1149/1.2100463. [DOI] [Google Scholar]
- Borod’ko Y. G.; Vetchinkin S. I.; Zimont S. L.; Ivleva I. N.; Shul’ga Y. M. Chem. Phys. Lett. 1976, 42, 264–267. 10.1016/0009-2614(76)80360-0. [DOI] [Google Scholar]
- a Biesinger M. C.; Lau L. W. M.; Gerson A. R.; Smart R. S. C. Appl. Surf. Sci. 2010, 257, 887–898. 10.1016/j.apsusc.2010.07.086. [DOI] [Google Scholar]; b Silversmit G.; Depla D.; Poelman H.; Marin G. B.; De Gryse R. J. Electron Spectrosc. Relat. Phenom. 2004, 135, 167–175. 10.1016/j.elspec.2004.03.004. [DOI] [Google Scholar]
- Moulder J. F.; Stickle W. F.; Sobol P. E.; Bomben K. D.. Handbook of X-ray Photoelectron Spectroscopy; Physical Electronics Inc: Eden Prairie, MN, 1995; pp 41, 45,, 83. [Google Scholar]
- Peng X.; Wang L.; Hu L.; Li Y.; Gao B.; Song H.; Huang C.; Zhang X.; Fu J.; Huo K.; Chu P. K. Nano Energy 2017, 34, 1–7. 10.1016/j.nanoen.2017.02.016. [DOI] [Google Scholar]
- Xing M.; Kong L. B.; Liu M. C.; Liu L. Y.; Kang L.; Luo Y. C. J. Mater. Chem. A 2014, 2, 18435–18443. 10.1039/C4TA03776F. [DOI] [Google Scholar]
- Zhang J.; Yuan B.; Cui S.; Zhang N.; Wei J.; Wang X.; Zhang D.; Zhang R.; Huo Q. Dalton Trans. 2017, 46, 3295–3302. 10.1039/C7DT00435D. [DOI] [PubMed] [Google Scholar]
- Chou N. H.; Ross P. N.; Bell A. T.; Tilley T. D. ChemSusChem 2011, 4, 1566–1569. 10.1002/cssc.201100075. [DOI] [PubMed] [Google Scholar]
- Jiang J.; Zhang A.; Li L.; Ai L. J. Power Sources 2015, 278, 445–451. 10.1016/j.jpowsour.2014.12.085. [DOI] [Google Scholar]
- Chen S.; Duan J.; Jaroniec M.; Qiao S. Z. Angew. Chem., Int. Ed. 2013, 52, 13567–13570. 10.1002/anie.201306166. [DOI] [PubMed] [Google Scholar]
- Zhu Y. P.; Liu Y. P.; Ren T. Z.; Yuan Z. Y. Adv. Funct. Mater. 2015, 25, 7337–7347. 10.1002/adfm.201503666. [DOI] [Google Scholar]
- Fabbri E.; Habereder A.; Waltar K.; Kotz R.; Schmidt T. J. Catal. Sci. Technol. 2014, 4, 3800–3821. 10.1039/C4CY00669K. [DOI] [Google Scholar]
Associated Data
This section collects any data citations, data availability statements, or supplementary materials included in this article.


