

SUMMARY
Macroscopic cortical networks are important for cognitive function, but it remains challenging to construct anatomically plausible individual structural connectomes from human neuroimaging. We introduce a new technique for cortical network mapping based on inter-regional similarity of multiple morphometric parameters measured using multimodal MRI. In three cohorts (two human, one macaque), we find that the resulting morphometric similarity networks (MSNs) have a complex topological organization comprising modules and high-degree hubs. Human MSN modules recapitulate known cortical cytoarchitectonic divisions, and greater inter-regional morphometric similarity was associated with stronger inter-regional coexpression of genes enriched for neuronal terms. Comparing macaque MSNs with tract-tracing data confirmed that morphometric similarity was related to axonal connectivity. Finally, variation in the degree of human MSN nodes accounted for about 40% of between-subject variability in IQ. Morphometric similarity mapping provides a novel, robust, and biologically plausible approach to understanding how human cortical networks underpin individual differences in psychological functions.
INTRODUCTION
Despite decades of neuroscience research using MRI, there is still a lack of validated and widely accessible tools for mapping the large-scale network architecture of anatomically connected regions in an individual human brain. There are currently two standard approaches available for imaging anatomical connectivity in humans: tractography from diffusion-weighted imaging (DWI) and structural covariance network (SCN) analysis.
Diffusion-weighted tractography seeks to reconstruct the trajectory of axonal tracts from the principal directions of the diffusion of water molecules, which tend to move in parallel to bundles of nerve fibers. This technique applies to data collected from a single participant and is a powerful tool for elucidating localized patterns of anatomical connectivity. However, it remains challenging to use tractography to map connectivity between all brain regions because long-distance projections (e.g., between bilaterally homologous areas of the cortex via the corpus callosum) are systematically under-recovered (Dauguet et al., 2007; Donahue et al., 2016). Moreover, there is growing concern that the statistical analysis of diffusionweighted data is compromised by head movement (Walker et al., 2012) and by a large number of false-positive connections (Maier-Hein et al., 2016; Thomas et al., 2014). Future improvements seem likely to depend, in part, on advances in scanner design and image acquisition methods, which may become increasingly the domain of a few highly specialized centers (Lerch et al., 2017).
Structural covariance analysis uses simpler measurements to reconstruct whole-brain networks, but the neurobiological interpretation of SCNs is problematic, and, crucially, this method typically depends on MRI data collected from a large number of participants. The basic idea of structural covariance analysis is simple: a single morphometric feature, like cortical thickness, is measured at each region in multiple images. Then the covariance (usually, in fact, the correlation) between regional estimates of cortical thickness is estimated for each possible pair of regions, resulting in a single SCN for the whole group (Alexander-Bloch et al., 2013a). Despite the existence of methods for generating SCNs in individual subjects (Batalle et al., 2013; Kong et al., 2015; Li et al., 2017; Tijms et al., 2012), these techniques have been restricted to the use of morphometric variables available through standard structural T1-weighted (T1w) MRI sequences.
Here we explore a different approach to human cortical network mapping that leverages the growing capacity to extract multiple different anatomical indices across multiple imaging modalities (Lerch et al., 2017). Rather than estimating the interregional correlation of a single macro-structural variable (like cortical thickness or volume) measured in multiple individuals (structural covariance analysis), we estimated the inter-regional correlation of multiple macro- and micro-structural multimodal MRI variables in a single individual (morphometric similarity mapping). This novel strategy integrates three complementary strands of research for the first time.
First, there is histological evidence from non-human primates that axo-synaptic connectivity is stronger between micro-structurally similar cortical regions than between cytoarchitectonically distinct areas (Barbas, 2015; Goulas et al., 2016, 2017). Second, there is encouraging evidence that conventional MRI sequences can serve as proxy markers of cortical microstructure. Cortical MRI metrics—such as magnetization transfer (MT), a marker of myelination—show spatial gradients in humans (Glasser et al., 2016) that align closely with known histological gradients in non-human primates (Wagstyl et al., 2015). Third, there is emerging evidence that structural properties of the human cortex are more precisely estimated by combined analysis of more than one MRI morphometric index at each region; e.g., cortical thickness and sulcal depth (Vandekar et al., 2016), cortical thickness and myelination (Glasser and Van Essen, 2011; Whitaker et al., 2016), or cortical thickness and gray matter volume (Sabuncu et al., 2016). On this basis, we predicted that morphometric similarity mapping with multiple MRI morphometric indices could provide a new way of estimating the linked patterns of inter-regional histological similarity and anatomical connectivity within an individual human brain.
First we demonstrated the feasibility of morphometric similarity mapping and network analysis of multi-parameter MRI data by estimating individual human brain structural network properties for each member of a cohort of healthy young people (N = 296). Then we assessed the robustness of the methods and results to variation in data acquisition and pre-processing parameters and assessed replicability by analysis of a second, independent human MRI dataset (N = 124). To test the biological validity of human MRI-based morphometric similarity mapping, we focused on two hypotheses: that the edges between nodes in each morphometric similarity network (MSN) linked cortical areas of the same cytoarchitectonic class and that MSN edges linked nodes with high levels of co-expression of genes specialized for neuronal functions. We used MRI and tract-tracing data of the macaque cortex to demonstrate the generalizability of the methods to non-human species and to test a third key biological hypothesis: that MSN edges link nodes that are directly anatomically connected by an axonal projection from one cortical area to another. Finally, on the basis of these critical foundational steps, we tested a fourth hypothesis: that inter-individual differences in human MSNs are related to differences in intelligence (IQ).
RESULTS
Morphometric Similarity Matrices
To investigate the feasibility of morphometric similarity mapping, we first analyzed MRI data on 10 morphometric variables measured at each of 308 cortical regions in a primary cohort of 296 healthy young adults. These data were collected as part of the Neuroscience in Psychiatry Network (NSPN) collaboration between the University of Cambridge and University College London (STAR Methods).
The morphometric similarity analysis pipeline (Figure 1) transformed each individual’s set of multimodal MRI feature maps into a morphometric similarity matrix of pairwise inter-regional Pearson correlations of morphometric feature vectors. The strength of association (morphometric similarity) between regions decayed exponentially as a function of increasing anatomical (Euclidean) distance between areas (median R2 Adjusted across 296 subjects = 0.05, range = 0.02–0.13, σ = 0.02, all p < 0.001). This was also the case in the sample mean MSN (R2 Adjusted = 0.15, p < 0.001) (Figure S4A).
Figure 1. The MSN Processing Pipeline.
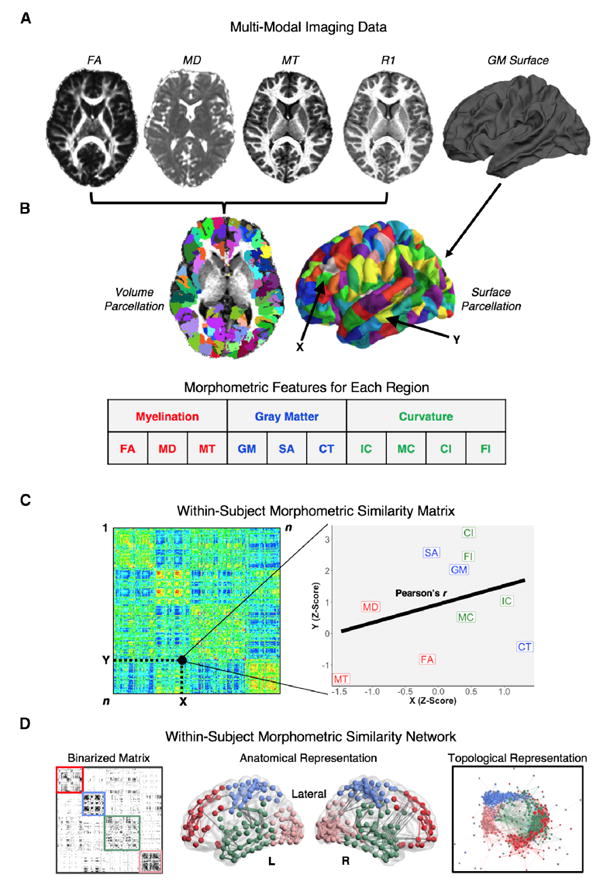
(A) Multiple MRI parameters were available from MRI and DWI data on each subject.
(B) All MRI data were mapped to the same cortical parcellation template, which comprised 308 subregions of the Desikan-Killiany atlas with approximately equal surface areas. 10 regional morphometric features were estimated and normalized to produce a 10 × 308 feature matrix for each subject.
(C) The morphometric similarity between each possible pair of regions was estimated by the Pearson’s correlation between their morphometric feature vectors to produce a 308 × 308 morphometric similarity matrix.
(D) MSNs are binary graphs constructed by thresholding the morphometric similarity matrix so that the strongest (supra-threshold) edges are set equal to 1 (and all others are set equal to 0). The organization of MSNs can be visualized (from left to right) in matrix format, in anatomical space, or in a topological representation, where nodes are located close to each other if they are connected by an edge.
FA, fractional anisotropy; MD, mean diffusivity; MT, magnetization transfer; GM, gray matter volume; SA, surface area; CT, cortical thickness; IC, intrinsic (Gaussian) curvature; MC, mean curvature; CI, curved index; FI, folding index.
For each individual, we also estimated the morphometric similarity of each region to the rest of the regions in the brain simply by averaging the edge weights connecting it to all other nodes (i.e., the average of the off-diagonal elements of a row or column in the morphometric similarity matrix). Consistently across individuals, the regions with morphometric profiles more similar, on average, to all other regions (i.e., high nodal similarity values) were located in the frontal and temporal association cortex, whereas regions with more distinctive morphometric profiles compared, on average, with other regions (i.e., low nodal similarity) were located in the occipital cortex (Figure 2A; Figure S1). Nodal similarity in the sample mean MSN was also patterned anatomically as in typical individual MSNs (Figure 2A; Figure S1), with the highest nodal similarity concentrated in the frontal and temporal cortex (Figure 2B).
Figure 2. Morphometric Similarity Matrices and Networks.
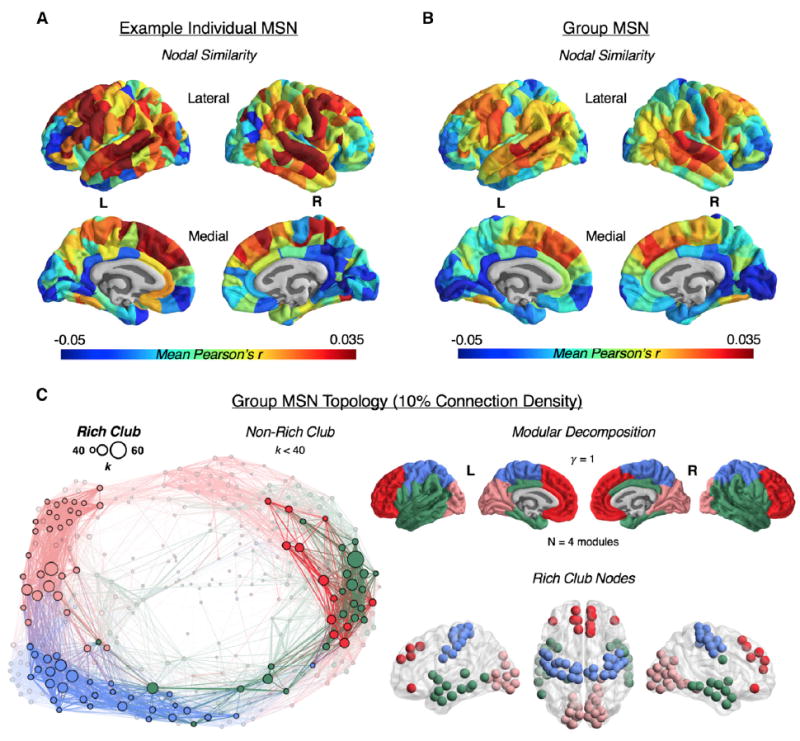
(A and B) Spatial patterning of an individual (A) and group average (B) morphometric similarity matrix. For the individual and group matrix, the row means are plotted on the cortical surface of the template brain, representing the average morphometric similarity (Pearson’s r) of each node. The color scale represents the mean nodal similarity.
(C) Right, top: modular partitioning of the group average morphometric similarity network (MSN), thresholded at 10% connection density, using the Louvain modularity algorithm. The γ resolution parameter dictates the number of detected modules; γ = 1 yielded four distinct spatially contiguous modules that approximately correspond to the lobes of the brain. Left: topological representation of the group MSN, thresholded at 10% connection density, highlighting the rich club of densely inter-connected hub nodes (opaque). The size of the nodes is scaled according to degree, and the thickness of the edges is scaled according to edge weight. Right, bottom: the rich club nodes are shown in their anatomical location and colored according to modular affiliation. See also Figures S1–S3.
We verified that MSN matrices were stable to the use of varying feature sets for calculation of inter-regional similarity by calculating the correlation in edge strengths between the full 10-feature MSN and MSNs with one feature removed. Using this leave-one-feature-out approach, we demonstrate high stability of the MSN edges between NSPN subjects’ 10-feature MSNs and their leave-one-feature-out MSNs (Figure S6).
In light of known artefactual relationships between nodal size and nodal connectivity strength in fMRI studies (Wang et al., 2009), we conducted a series of analyses to quantify the potential contribution of nodal differences in size (surface area) to nodal differences in morphometric similarity (degree). We observed a weak correlation between nodal similarity and nodal density (person-level spatial correlations between density and degree: mean r = 0.03, ranging from −0.20 to 0.13), calculated as the number of distinct regions within 4 cm of the center of mass of the given region. We observed a weak-moderate positive correlation between nodal size and nodal similarity that was highly variable across individuals (person-level spatial correlations between size and degree: mean r = 0.34, ranging from −0.37 to 0.78) and nodes (node-level inter-individual correlations between size and degree: mean r = 0.20, ranging from −0.18 to 0.51). To test whether this positive size-degree relationship generalizes to other parcellations, we regenerated MSNs using a recently published multimodal imaging parcellation (Glasser et al., 2016) that proposes a biologically grounded division of the cortical sheet into 360 nodes (symmetric, 180 per hemisphere) that show a 3-fold greater variation in node size relative to our parcellation. With this parcellation, we observed lower correlations between nodal size and nodal degree across the cortex (sample mean r = −0.05, range = −0.18-0.08) and across individuals (node mean r = −0.18, range = −0.56-0.13). Then, by calculating morphometric similarity matrices using our parcellation for each of 14 T1w scans taken in short succession from a single individual (MyConnectome Project; Poldrack et al., 2015), we established that signal to noise in estimation of nodal degree does not increase with nodal size (correlation between nodal size and median absolute deviation in nodal degree: r = 0.05, p = 0.36).
Morphometric Similarity Networks
We thresholded the individual morphometric similarity matrices to generate binary graphs or MSNs. To characterize the topology of these MSNs, we calculated binarized and weighted graph metrics at a range of connection densities (2%, 3%, 4%, and 5%–40% in 5% increments) generated by thresholding the morphometric similarity matrices to include varying percentages of the most strongly positive edge weights or pairwise interregional correlations (Figure S3A). At all connection densities (Figure S2), the individual MSNs consistently demonstrated a repertoire of complex topological features shared by diverse naturally occurring networks (Barabási, 2016; Fornito et al., 2016), including a fat-tailed (i.e., right or positively skewed) degree distribution, implying the existence of hub nodes; small-worldness (near-random path length or global efficiency combined with greater-than-random clustering); and a community structure comprising hierarchical modules and a rich club (Figure 2).
We next resolved the modular community structure of MSNs by partitioning the sample mean MSN from coarse- to finegrained scales defined by the resolution parameter (γ) of a consensus (1,000 runs) Louvain modularity algorithm (Lancichinetti and Fortunato, 2012; Figure 2C; Figure S2C; STAR Methods). At all scales of the modular hierarchy, the community structure consists of bilaterally symmetric and spatially contiguous modules tiling the cortex in a pattern that respects macro-structural features of the cortical sheet (Figure 2C). For example, the 6-module solution subdivides the temporal module of the 4-module solution into anterior, middle, and superior (encompassing the insula) portions of temporal cortex (Figure S2C). These results are qualitatively consistent with a prior study of the hierarchical patterning of the heritability of cortical surface area (Chen et al., 2012), suggesting that the topological community structure of morphometric similarity could arise, at least in part, from genetic contributions to regional brain morphology.
We also demonstrated another aspect of network community structure—a core/periphery organization comprising a core of highly interconnected hub nodes (a rich club). The rich club of the sample mean MSN included hubs that were distributed across all network modules (Figure 2C), as reported previously for DWI networks (van den Heuvel and Sporns, 2011). Individual MSNs typically demonstrated a similar community structure (modules and rich club) to that of the sample mean MSN (Figure S2D). Moreover, rich club properties were detectable across a range of MSN densities (Figure S5).
Consistency, Robustness, and Replicability of MSNs
First, we established that individual MSNs show moderate-high consistency with the group average MSN, both in terms of the average correlation between individual MSN edge weights and the sample mean MSN edge weights (average r = 0.60, SD = 0.05, all p < 0.001) and the average correlation between individual MSN nodal similarities and the sample mean MSN nodal similarities (average r = 0.66, SD = 0.10, all p < 0.001) (Figure 2; Figure S1).
Second, we quantified the robustness of MSNs to methodological variations, including a reduction in the number of morphometric features available for analysis (i.e., using only 5 T1-weighted features rather than all 10 features estimated in the NSPN cohort) and construction of MSNs using MRI data collected at lower magnetic field strength (1.5 T) in a second, independent cohort and pre-processed using different segmentation and parcellation tools.
We re-analyzed the NSPN cohort of 296 participants using a reduced set of 5 morphometric features that can be derived from any T1-weighted MRI scan: cortical thickness (CT), surface area (SA), gray matter volume (GM), mean curvature (MC), and intrinsic (Gaussian) curvature (IC). We found that the 5-feature MSNs were very similar to the 10-feature MSNs; for example, the sample mean edge weights and nodal similarities were strongly correlated between the 5-feature and 10-feature MSNs (r = 0.68, p < 0.001 and r = 0.91, p < 0.001, respectively). However, the SD for edge weight and nodal similarity was greater in the 5-feature MSNs (0.506 and 0.028, respectively) than in the 10-feature MSNs (0.346 and 0.016, respectively) (Figure S4B), indicating greater precision of MSN estimation based on a larger number of parameters or features per regional node.
To test replicability, we used identical methods to construct MSNs from T1-weighted MRI data collected at 1.5 T field strength from an independent cohort of 124 healthy participants (NIH MRI Study of Normal Brain Development; Giedd et al., 1999, 2015). As shown in Figures S2 and S3, the 5-feature NIH MSNs had a complex topology comparable with the 5- and 10-feature MSNs from the NSPN cohort (i.e., small-worldness, hubs, modularity, and a rich club). The SD of edge-wise and nodal similarity statistics in the NIH 5-feature MSNs (0.431 and 0.028, respectively) was approximately the same as the NSPN 5-feature MSNs but greater than the SDs in the 10-feature MSNs (Figure S4B).
Morphometric Similarity and Cortical Cytoarchitecture
To test the first biological hypothesis that regions connected by an edge in a MSN are more likely to belong to the same cytoarchitectonic class, we compared the anatomical distribution of network edges with the histological classification of cortical areas (Solari and Stoner, 2011; von Economo and Koskinas, 1925). Our adapted cytoarchitectonic parcellation of the human cortex defines 7 spatially contiguous and bilaterally symmetric cortical classes that are microscopically differentiated by cortical lamination patterns (Figure 3A). At a nodal level of analysis, we explored the distribution of nodal similarity in the individual MSNs in relation to the cytoarchitectonic classification of each node. Across subjects, there were significant differences in mean nodal similarity between classes (repeated-measures ANOVA, F(1, 2,077) = 796.5, p < 0.001). Cytoarchitectonic classes 1, 2, and 3 (corresponding to motor and association cortices) comprised cortical areas with a higher nodal similarity and degree than cytoarchitectonic classes 4, 5, and 6 (mostly corresponding to primary and secondary sensory cortical areas) (Figure 3A). These results confirm that MSN hubs are predominantly located in motor and association cortical areas.
Figure 3. Comparison of MSNs and Other MRI Networks to a Cytoarchitectonic Classification of the Cortex.
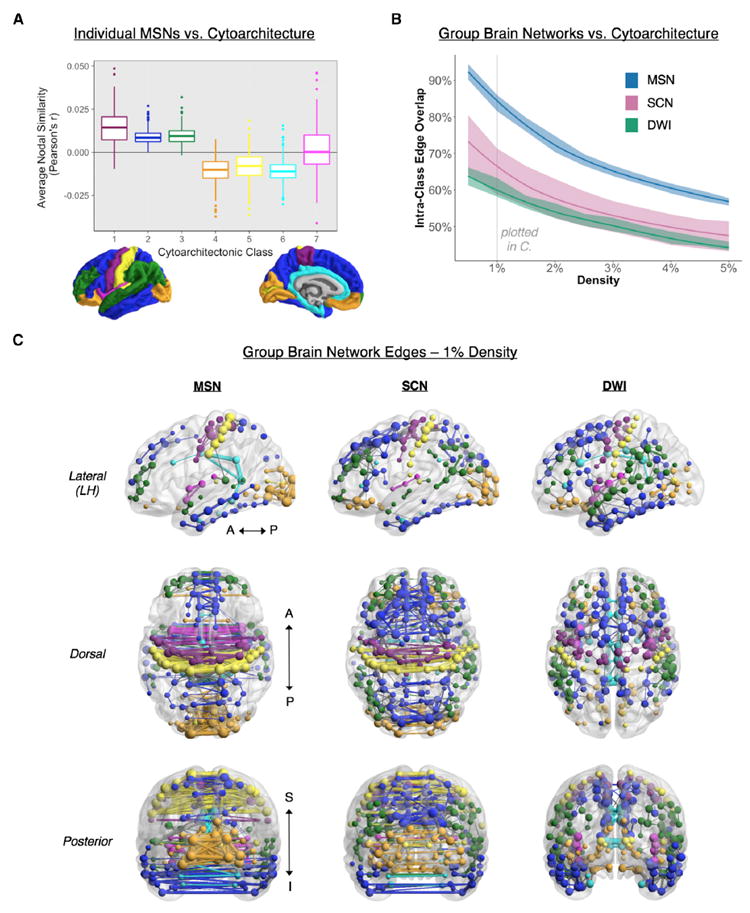
(A) Average nodal similarity scores for individual MSNs within each of the cortical classes of von Economo and Koskinas (1925): 1 (agranular cortex, primary motor), 2 (association cortex), 3 (association cortex), 4 (secondary sensory cortex), 5 (primary sensory cortex), 6 (limbic regions), and 7 (insular cortex). The highest nodal similarity was consistently found in classes 1–3 (motor and association cortex)—areas with the most pyramidal neurons in supragranular layers of the cortex.
(B) Proportion (percentage) of intra-class edges in the group MSN as a function of connection density (0.5%–10%, 0.5% intervals). The MSN has a higher percentage of intra-class edges compared with the SCN and DWI networks at all densities, demonstrating the high correspondence of MSN topology with cortical cytoarchitectonics. Shading represents results of intra-class overlap calculated in 1,000 bootstraps of our participant pool.
(C) Graphs of each of the MRI networks, thresholded at1%density, with nodes and intra-class edges colored according to cytoarchitectonic class and inter-class edges drawn in gray. The MSN shows the greatest connectivity between bilaterally symmetric cortical regions relative to the SCN and DWI networks. Lower and upper bounds of the boxplots represent the 1st (25%) and 3rd (75%) quartiles, respectively. LH, left hemisphere; A, anterior; P, posterior; S, superior; I, inferior.
The cytoarchitectonic parcellation of the cortex also provided a benchmark for triangulating the comparison between MSNs and two other MRI-based networks measured in the same NSPN cohort: the SCN based on inter-regional correlations of a single feature (cortical thickness) measured across all 296 participants and the sample mean DWI network based on tractographic reconstruction of white matter connections between cortical areas (weighted by mean diffusivity) in each participant (STAR Methods). To compare MSN, DWI, and SCN results, we constructed a series of sparsely connected graphs (with connection density ranging from 0.5% to 5% in 0.5% increments) that represented the most strongly connected edges in each of the MRI networks and calculated the percentage of edges that linked areas in the same cytoarchitectonic class. For the most sparsely connected MSN (0.5% density), more than 90% of edges connected areas in the same class, and this declined monotonically as a function of increasing density so that about 60% of edges connected areas in the same class in the MSN at 5% density. The SCN and DWI networks demonstrated similar trends, but the percentage of intra-class connectivity was consistently lower for both of these networks compared with the MSN across all connection densities (Figure 3B). We confirmed the clear separation between MSNs and both SCN and DWI networks in terms of their overlap with cytoarchitectonic classes by re-calculating network-specific overlap percentages across a range of network densities for each of 1,000 bootstrapped resamplings of the participant pool. Additional analyses verified that the non-random relationship of MSN architecture with cytoarchitectonic maps holds after controlling for the effects of distance or spatial auto-correlation. Specifically, we generated 1,000 pseudoparcellations of the cortical sheet into 7 classes that conserved the spatial contiguity of the classes as well as the relative proportion of cortex assigned to each class. Across a range of MSN densities, the percentage of MSN edges that overlapped with true cytoarchitectonic classes was greater than the distribution of these overlap values from all 1,000 pseudoparcellations (Figure S5).
We observed that only about 60% of edges in the DWI network connected areas of the same cytoarchitectonic class, even at the sparsest connection density. This proportion decreased to about 30% when using a distance-dependent consistency thresholding approach for group-level DWI network construction (Mišić et al., 2015; STAR Methods). The weaker coherence between DWI network topology and cytoarchitectonic class compared with MSN network topology appeared to involve the relative failure of DWI tractography to recover inter-hemispheric connections between bilaterally symmetric areas belonging to the same class (Figure 3C). To quantitatively address this hypothesis while controlling for connection length, we compared a binarized grouplevel DWI network with an equally dense binarized group-level MSN network. We then used binomial (logistic) regression analysis to model the presence versus absence of a detected edge as a function of network type (MSN or DWI), connection type (inter- versus intra-hemispheric), and connection length (Euclidean distance deciles). This analysis detected significant effects on edge detection for network type (χ2 = 107.328), connection type (χ2 = 39.096), and distance (χ2 = 13212.262) and the interaction between network type, distance, and connection type (χ2 = 110.383). Visualization of these relationships (Figure S5) indicated that MSNs are more likely to detect inter-hemispheric edges than DWI, that this difference is apparent across the full range of connection lengths, and that this difference is more pronounced for longer versus shorter inter-hemispheric connections.
Taken together, these comparative analyses demonstrate that morphometric similarity can provide a closer approximation to the histological similarity between two cortical regions than analysis of either cortical thickness covariance or DWI measures of white matter connectivity.
Morphometric Similarity and Cortical Gene Co-expression
We tested the second biological hypothesis, that MSN edges link areas with high levels of gene co-expression, using two gene sets: the approximately complete human genome (20,737 genes) and a much smaller subset of 19 HSE (human supragranular enriched) genes that are known to be specifically expressed in the supragranular layers (cortical lamina II and III) of the human cortex (Zeng et al., 2012) that are characteristic of the cytoarchitectonic classes (1–3) with higher nodal similarity scores (Figure 4A). We mapped the whole-genome transcriptional data on 6 adult human post-mortem brains (Hawrylycz et al., 2012) into the same parcellation scheme that was used to define the 308 nodes of the MSNs (STAR Methods). Then we could estimate the inter-regional co-expression of gene transcriptional profiles for each possible pair of nodes in the same anatomical frame of reference as the MSNs.
Figure 4. Topography of Regional HSE Gene Expression and Co-expression and Gene Enrichment Results from the Leave-One-Out Analysis with the Group Average MSN (NSPN).
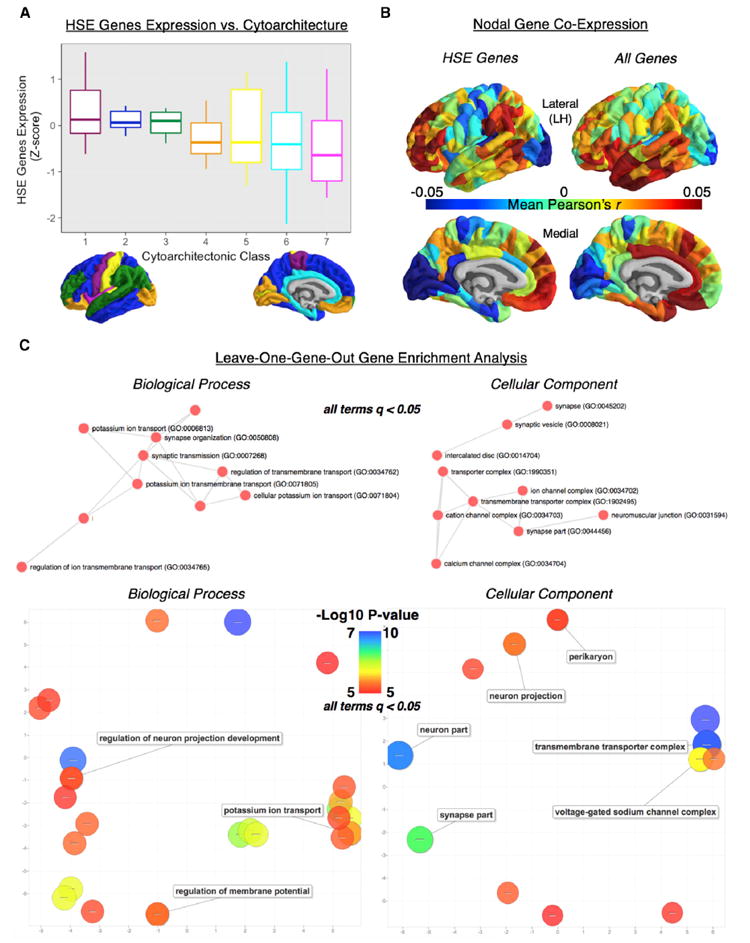
(A) Average expression values for each of the 19 human supragranular enriched (HSE) genes within each of the seven classes of cytoarchitecture. Average expression was highest in classes 1–3, similar to the distribution of nodal similarity for each of the individual 10-feature NSPN MSNs (Figure 3).
(B) Left hemisphere topography of nodal gene co-expression, calculated as the average co-expression (Pearson’s r) values, of the whole-genome and HSE-only gene co-expression networks. The pattern of nodal similarity of the group average 10-feature NSPN MSN was similar to that of nodal co-expression of both the whole-genome (r = 0.41, p < 0.001) and HSE-only networks (r = 0.48, p < 0.001).
(C) Gene enrichment of the list of genes ranked by contribution to the edgewise relationship between the whole-genome gene co-expression network and the group average 10-feature NSPN MSN (r = 0.33, p < 0.001). Contribution for a gene was calculated as the difference between this empirical correlation (r = 0.33) and the correlation when using a gene co-expression network without that given gene. This ranked list was enriched for genes related to potassium ion transport and synaptic transmission (biological process) as well as neuron and synapse morphology (cellular component). The median rank of the 19 HSE genes within this list was 1,889/20,737 and was significantly greater than the median rank of 10,000 random subsets of 19 genes (p < 0.0001). These results demonstrate a link between regional gene expression (and co-expression) and morphometric similarity and further show that this relationship is driven by genes related to cortical cytoarchitecture and neural structure and communication. Lower and upper bounds of the boxplots represent the 1st (25%) and 3rd (75%) quartiles, respectively.
There was a significant positive correlation between the edge weights of the sample mean MSN and inter-regional co-expression of the whole genome (r = 0.33, p < 0.001), meaning that cortical areas with high morphometric similarity also tended to have high transcriptional similarity. This correlation was attenuated, but remained statistically significant (r = 0.19, p < 0.001), after accounting for shared distance effects on inter-regional morphometric and transcriptomic similarity (STAR Methods).
To rank genes by the strength of their contribution to the observed association between morphometric similarity and whole-genome co-expression, we used a leave-one-out procedure whereby the correlation between MSN edge weights and gene co-expression was iteratively re-estimated after systematically removing each one of the genes in turn. This algorithm allowed us to rank all 20,737 genes in terms of the difference their exclusion from the analysis made to the estimated correlation between morphometric similarity and gene co-expression (see Table S2 for the list of genes and their rankings). Gene ontology (GO) enrichment analysis of this gene list revealed that highranking genes, which made a stronger contribution to the association betweenmorphometric and transcriptomic similarity, were enriched for annotations related to neuronal structure and signaling (Figure 4C). The HSE gene list of interest a priori was also high-ranking, with a median rank that was within the top decile of all genes (median HSE gene rank = 1,889/ 20,737 = 9.1%) and significantly greater than the median ranks of 10,000 random gene sets of equal size (n = 19, p < 0.0001). Moreover, the nodal similarity of the sample mean MSN was positively correlated with regional gene expression (r = 0.34, Pbootstrap = 0.0042) and regional co-expression (r = 0.48, Pbootstrap = 0.01) of the HSE gene set (Figure 4B), and HSE gene expression demonstrated the same distribution across cytotarchitectonic areas as nodal morphometric similarity (Figure 4A). Specifically, expression of HSE genes was greater in cytoarchitectonic areas 1–3, where the hubs of the MSNs were also concentrated. In a complementary analysis of phenotype enrichment in mammalian gene knockout models (Smith and Eppig, 2012; STAR Methods), we found that disruption in animal models of high-ranking genes (i.e., those with positive leave-one-out scores) was significantly associated with abnormal synaptic transmission (p < 0.05, false discovery rate [FDR]-corrected).
Collectively, these results indicate that MSN topology is aligned with spatial expression patterns of neuronally expressed genes that are enriched within human cortical layers mediating cortico-cortical connectivity and genes that are critical for normal neuronal functions. We established that these conclusions can be generalized across different assemblies of the Allen Institute for Brain Sciences donor set by demonstrating that coexpression network edge weights and associated gene rankings were highly consistent across all 6 possible leave-one-donor-out transcriptional networks (inter-network correlations: edge weights, mean r = 0.79, range 0.63–0.90; gene rankings, mean r = 0.76, range 0.63–0.91). Additionally, we used spatial permutation methods to confirm that the observed alignment between MSN and gene co-expression topology remained statistically significant after controlling for spatial autocorrelation in gene expression values (p < 0.0001; STAR Methods).
Morphometric Similarity (MRI) Compared with Tract-Tracing Connectivity in the Macaque
To assess the generalizability of the MSN methodology to nonhuman primate MRI datasets, and to test the third biological hypothesis that MSN edges indicate axonal connectivity between cortical areas, we analyzed a publicly available collection of MRI data on a cohort of 31 juvenile rhesus macaque monkeys (16 females; overall age range, 0.9–3.0 years) (Young et al., 2017).We constructed MSNs for each monkey as described previously for each human participant (Figure 1) using 8 morphometric features available from the T1-weighted, T2-weighted, and DWI data on each animal. We defined 91 nodes of the macaque cortex using a histologically defined and anatomical landmark- based parcellation (Markov et al., 2014) that has been used previously to report retrograde axonal tract-tracing experiments on 29 of the 91 nodes (Markov et al., 2014; Figure 5B).
Figure 5. Comparison of Morphometric Similarity with Axonal Tract Tracing in the Macaque.
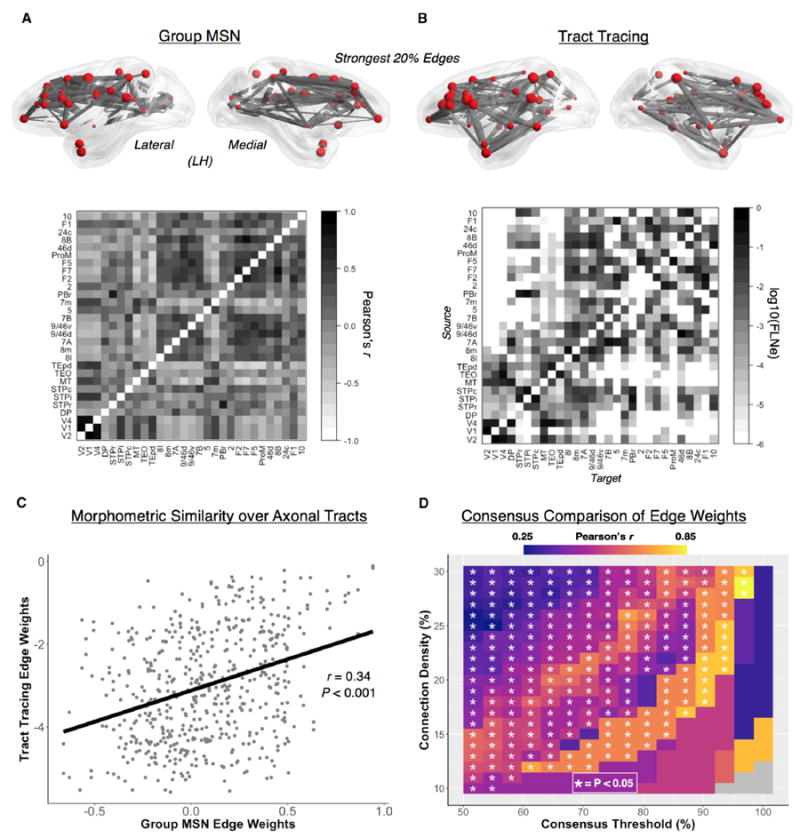
(A and B) Top: the left hemisphere edges of the group average multimodal macaque MSN (A) and axonal tract tracing network (B), each thresholded at 20% connection density. Nodes in both networks are sized according to degree, calculated as the average nodal degree across MSNs (at 66% connection density) and, because of the effects of directionality, averaged nodal degree across both efferent and afferent connections in the tract-tracing network. Center: the 29 × 29 group average multimodal macaque MSN (A) and the connections of the tract tracing matrix (B). The 29 × 29 tract-tracing connectivity matrix is based on retrograde injections in 29 regions of the macaque cerebral cortex (Markov et al., 2012) and is 66% dense. Connection weights are based on the extrinsic fraction of labeled neurons (FLNe) and are plotted on a base 10 logarithmic scale. Diagonals in both networks are whited out.
(C) For the overlapping edges in the two matrices in (B), there was a significant positive correlation between the edges of the group macaque MSN and the edge weights of the tract-tracing network (r = 0.34, p < 0.001).
(D) The correspondence between the edge weights of the group MSN and those of the tract tracing network. The group MSN was masked using a consensus approach that incorporated the most common edges of the individual MSNs at varying connection densities (10%–30%). At each connection density and consensus threshold (determined by the proportion of subjects at a connection density with supra-thresholded edges in common), the group MSN and tracttracing network were masked, and the edge weights were correlated. Generally, we observed a positive relationship in connectivity weights across MSN connection densities and consensus thresholds (median r = 0.58, range = 0.27–0.82), with the highest correlations found using the strongest and most consistent edges in the individual MSNs. Collectively, these results not only suggest a relationship between morphometric similarity (derived in vivo) and axonal tract weights (derived ex vivo) at the group level but also reveal a possible “core” set of associations (measured in individual MSNs) that closely approximate physical anatomical connectivity.
Macaque MSNs demonstrated qualitatively the same suite of complex topological properties as the human MSNs from both the NSPN and NIH cohorts across a range of connection densities (Figure 5A; Figure S3). There was a significant positive correlation between the edge weights of the sample mean macaque MSN and the edge weights of the tract-tracing network (Pearson’s r = 0.34, p < 0.001) (Figures 5B and 5C). To test whether this relationship varied as a function of MSN edge strength and consistency across individuals, the correlation between MSN and tract-tracing edge weights was estimated across a range of MSN connection densities (10%–30%) and edge consistencies across individuals (50%–100%). This analysis revealed that edge weights of the individual MSNs, consistently evident in the more sparsely connected graphs, were strongly correlated with the anatomical connectivity weights derived from axonal tract-tracing data (r = 0.36–0.90, median r = 0.58, 73% of correlations p < 0.05, 34% of correlations Bonferroni-corrected p < 0.05) (Figure 5D). In line with prior studies of distance effects on tract-tracing connectivity data (Goulas et al., 2017), we find that the correlation between MSN and tract-tracing edge weights reduces to 0.11 when including distance (exponential decay function) as a covariate. Taken together, these findings indicate that the morphometric similarity of two cortical regions is directly related to the strength of monosynaptic axonal connectivity between them in the context of known distance effects on cortical organization.
Predicting Individual Differences in Human IQ from Differences in Nodal Degree of MSNs
Having established the technical feasibility, robustness, and biological validity of morphometric similarity mapping, we leveraged the ability of MSNs to represent whole-brain anatomical networks in a single human to investigate relationships between inter-individual differences in brain network topology and interindividual differences in cognitive and behavioral traits.
We focused on general intelligence (IQ) as the cognitive trait of interest given the broad relevance of IQ for adaptive function (Davies et al., 2016; Hagenaars et al., 2016) and the wealth of prior research into biological substrates for IQ (Crossley et al., 2013; Dehaene and Changeux, 2011; van den Heuvel et al., 2009). High-degree hub nodes have been shown to be crucial for the global efficiency of the connectome and to be preferentially affected by clinical brain disorders associated with cognitive impairment (Crossley et al., 2014). On this basis, we predicted specifically that individual differences in verbal and non-verbal IQ should be related to individual differences in nodal degree.
We used the multivariate technique of partial least-squares (PLS) regression to find the optimal low-dimensional relationship between a set of predictor variables and response variables. In our case, the (292 × 308) predictor variable matrix comprised measurements of degree (calculated at 10% connection density) at each of 308 nodes in each of 292 participants in the NSPN cohort and the (292 × 2) response variable matrix comprised t scores on the verbal (vocabulary) and nonverbal (matrix reasoning) scales of the Wechsler abbreviated scale of intelligence (WASI; Wechsler, 1999), standardized for age and gender effects relative to a representative population and measured in the same 292 participants (mean total IQ, 111; SD, 12; range, 76–137). Each of the variables (MSN degree and IQ) was regressed on the potentially confounding effects of intracranial volume (estimated total intracranial volume [eTIV] in Freesurfer), age, gender, and age × gender interaction, before the residuals were used in the PLS analysis.
The first two components of the PLS explained about 40% of the variance in IQ, and this goodness of fit was statistically significant by a nonparametric resampling procedure (p = 0.03) (Vértes et al., 2016). These results maintained statistical significance (p < 0.05) when the analysis was repeated for nodal degree calculated across a range of MSN connection densities (10%– 25%). We focused our attention on the first two PLS components (PLS1 and PLS2), which consistently explained about 25% and 15% of the variance in IQ, respectively (Figure 6).
Figure 6. The Nodal Degree of MSNs Is Highly Predictive of Individual Differences in Intelligence.
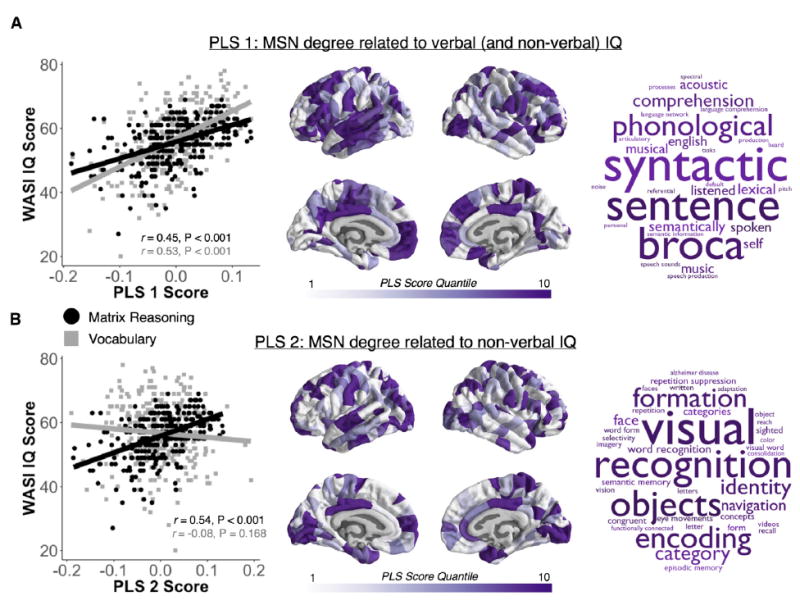
(A and B) The first two components (PLS1 and PLS2) of a partial least-squares regression using individual MSN degree (at 10% connection density) explained about 40% of the variance in vocabulary and matrix reasoning subscales of WASI IQ scores in 292 people. PLS1 was correlated with both vocabulary and matrix reasoning (left) and with the degree or hubness of nodes in left-lateralized temporal and bilateral frontal cortical areas (center), related to language functioning (right) (A). PLS2 was correlated specifically with matrix reasoning and degree or hubness of nodes in bilateral primary sensory cortical areas (center), specialized for visual and sensorimotor processing (B).
The first PLS component was significantly positively correlated with both IQ subscales, vocabulary (r = 0.53, p < 0.001) and matrix reasoning (r = 0.45, p < 0.001), as well as full-scale IQ (r = 0.61, p < 0.001) (Figure 6B). The second PLS component was only significantly positively correlated with matrix reasoning (r = 0.54, p < 0.001) and full-scale IQ (r = 0.21, p < 0.001) but not vocabulary (r = 0.08, p = 0.168) (Figure 6B). We ranked the 308 nodes of the individual MSNs according to their bootstrap standardized weight on each PLS component (Vértes et al., 2016). This analysis revealed that the nodes that loaded strongly on PLS1 were located predominantly in the left frontal and temporal cortical areas, whereas nodes that loaded strongly on PLS2 were located predominantly in the bilateral occipital and frontal cortex. Nodal variation in PLS scores was not related to simple nodal differences in size (correlation with nodal surface area: PLS1 r = −0.01, p = 0.77, PLS2 r = 0.09, p = 0.11). Finally, as a test for validation of observed PLS maps using an orthogonal data modality, we used Neurosynth, a tool for meta-analysis of the large primary literature on task-related fMRI (Yarkoni et al., 2011), to identify which cognitive functions were co-localized with the cortical nodes strongly weighted on PLS1 and PLS2. As expected, the PLS1 nodal score map best converged with Neurosynth meta-analytic maps for language-related functions. whereas the PLS2 nodal score map best converged with Neurosynth meta-analytic maps enriched for visual and memory functions (Figure 6).
Furthermore, we cross-validated our PLS findings by predicting variance in IQ for 1,000 sets of 5 individuals held out from the sample using the PLS model as defined with remaining individuals. The mean proportion of total variance explained across these 1,000 hold-out sets aligned with the proportion of variance explained in our full dataset (35.29%, SD = 19.82). Taken together, these results support the inference that inter-individual variability in MSN architecture shows a reproducible capacity to predict a significant proportion of variance in IQ.
DISCUSSION
We have shown how multimodal MRI measurements of the human and non-human primate cortex can be used to estimate the morphometric similarity between cortical areas and the topological properties of the anatomical connectome of a single brain. This robust and replicable new method of brain structural network analysis allowed us to test (and affirm) three key biological hypotheses about the organization of individual mammalian cortical networks. As theoretically predicted, we found evidence that cortical areas connected by an edge in MSNs were cytoarchitectonically similar and axonally connected to each other and had high levels of co-expression of genes specialized for neuronal functions. These results substantiated the biological validity of MSNs compared with other MRI- or DWI-based estimates of the human connectome and motivated us to test (and affirm) a fourth hypothesis: that individual differences in IQ are related to individual differences in the hubness or nodal degree of cortical nodes in human brain anatomical networks.
Like most spatially embedded real-life networks, including other brain networks, MSNs had a complex topology (Barabási, 2016; Fornito et al., 2016). MSNs were binary graphs with a small-world combination of high clustering and short path length, some high-degree hub nodes with many connections to the rest of the network, and a community structure comprising modules and a rich club. This suite of topological properties was robust to variation in species (human and macaque), the number of morphometric features measured by MRI at each regional node (5 or 10 human or 8 macaque MRI-derived parameters per region), and the contrast between two independent human volunteer samples (NSPN and NIH cohorts) differing in magnetic field strength for MRI (1.5 T and 3 T) and pre-processing steps like cortical parcellation.
This robust and replicable network phenotype or connectome, derived from morphometric similarity mapping, is qualitatively similar to connectomes previously described using comparable graph theoretical metrics in many other neuroimaging and neuroscience datasets. A well-rehearsed interpretation of the complex topology of connectome organization is in terms of its supposed advantages for sensory, motor, or cognitive function. Some topological features, such as clusters and modules, will favor segregated processing of specific channels of information, whereas other features, such as hubs and a rich club, will favor integrated processing of all information (Bullmore and Sporns, 2012; Sporns et al., 2004). This influential hypothesis, linking the topology of the human connectome to the psychological capacities of the brain, has some experimental support. The evidence is strongest for the link between modular or clustered topologies and specialized psychological or information processing functions (Fodor, 1983). At all scales of connectomics, from micro-scale analysis of C. elegans and Drosophila to macro-scale analysis of human MRI data (Meunier et al., 2010; Schröter et al., 2017), there is evidence for topological modules of spatially co-localized (neuronal or areal) nodes with specialized functions. The evidence is not yet so strong for the link between integrative topological features, such as hubs and a rich club, and global or generalized cognitive functions (we return to this point later).
Morphometric Similarity and Anatomical Similarity
By aligning individual MSNs with the classical cytoarchitectonic atlas of von Economo and Koskinas (1925), we demonstrated a close correspondence between MSN topology and this histological classification of cortical areas. Morphometric similarity, measured by MRI, was greater between regional nodes that were histologically similar in the sense of belonging to the same cytoarchitectonic class. This meant that sparse MSNs, representing only a small percentage of the highest morphometric similarity statistics, were dominated by intra-class edges between regions. Correspondence between morphometric similarity and cytoarchitectonic similarity is supportive of the biological validity of the constituent MRI measurements. There is also growing evidence that cytoarchitectonic similarity predicts axonal connectivity between cortical areas, with greater probability of axonal connectivity between histologically similar areas (Goulas et al., 2016, 2017). Thus, we reasoned that alignment of network edges with cytoarchitectonic classes could provide a triangulation point to compare MSNs with other MRI-based methods of human connectome mapping. Because histologically similar nodes are more likely to be axonally connected, then any map of anatomical connectivity derived from MRI should be dominated by intra-class edges.
We compared MSNs with two other MRI-based anatomical networks estimated from the same sample—a single structural covariance network and a set of individual diffusion tractography networks. All three networks had qualitatively and quantitatively similar complex topology, but they were not identical. In relation to the benchmark of cytoarchitectonic classification, all networks were dominated by a high percentage of intra-class edges when graphs were thresholded sparsely to include only the strongest connections between regions. However, across all connection densities considered, the percentage of intra-class edges was greater for MSNs than for the SCN or DWI networks. This indicates that edges in MSNs are more representative of histologically similar pairs of regions, which are more likely to be axonally connected to each other, than edges in the SCN or DWI networks. One reason for the relatively poor performance of DWI networks in aligning to cytoarchitectonic classes seems likely to be the known difficulties in reconstructing interhemispheric connections by tractography analysis of DWI data.
Although cytoarchitectonic classification is a well-established and traditional way of assessing histological similarity between cortical areas, more generally we can assess inter-areal similarity in terms of any locally (spatially) expressed cellular or genomic phenotype. Spatial patterns of gene expression in the mammalian cortex are intimately tied to regional differences in cortical layering and cell composition (Bernard et al., 2012; Hawrylycz et al., 2012). Transcriptomic similarity or gene co-expression was greater between regions of the mouse brain that were known to be axonally connected by analysis of anterograde tract-tracing data (Fulcher and Fornito, 2016). A functionally specialized set of so-called HSE genes, which are overexpressed specifically in supragranular layers of the human association cortex (Zeng et al., 2012) and known to be important for the formation of long-distance inter-areal axonal connectivity (Hawrylycz et al., 2012), were more strongly co-expressed by functionally connected brain regions (Krienen et al., 2016).
In this context, we predicted that morphometrically similar regions should have high levels of gene co-expression in general as well as high levels of HSE gene co-expression in particular. Whole-genome analysis confirmed that co-expression was positively correlated with morphometric similarity, and the genes that contributed most strongly to the overall association between transcriptional and morphometric similarity were specialized for neuronal functions. HSE genes were most strongly expressed in cytoarchitectonic classes 1–3, and HSE gene co-expression was positively correlated with morphometric similarity and degree or hubness of MSN nodes.
We have thus demonstrated that morphometric similarity is strongly associated with cytoarchitectonic and genomic measures of histological similarity between cortical areas. To the extent that histological (cytoarchitectonic or transcriptional) similarity is coupled to axonal connectivity between cortical areas (Fulcher and Fornito, 2016; Goulas et al., 2016, 2017), we can therefore expect morphometric similarity measured by MRI to be at least an approximate marker of axonal connectivity. However, to verify this important interpretation more directly, we generalized the MSN approach to analysis of whole-brain connectomes in the macaque monkey.
We observed a strong positive relationship between the edge weights of the macaque MSN and the edge weights of the tracttracing network, especially for the most consistently and strongly weighted edges in the individual macaque MSNs. The strength of association between tract-tracing and MSNs was comparable in magnitude with previous reports of correspondence between tract-tracing and DWI-based networks in the macaque (Donahue et al., 2016; van den Heuvel et al., 2015). We note that the macaque MRI data were collected at 3 T and provided only 8 morphometric variables per cortical region. It is predictable from the human MRI datasets we analyzed that MSN metrics (and their alignment with tract-tracing data) could be more precisely measured in future macaque MRI experiments at higher field strength or using multi-parameter MRI sequences to sample the cortical micro-structure more comprehensively. Moreover, given the strong inter-hemispheric relationships captured by the MSNs (Figure 3C), their alignment with tract-tracing connectivity is likely under-estimated because of the lack of available bilateral (inter-hemispheric) datasets.
In short, the results of multiple experiments convergently supported all three hypotheses linking the topology of MSNs to both the histological similarity and the axonal connectivity between cortical areas. We consider that micro-structural MRI parameters likely detect differences and similarities in the coupled cytoarchitectonics and myeloarchitectonics of cortical areas. In particular, morphometric similarity mapping identified strong commonality of the MRI micro-structural profile of cytoarchitectonic classes 1–3, where supragranular layers are enriched for pyramidal neurons that send and receive long-distance axonal projections from other cortical areas (Figures 3A and 4A). We speculate that detection of regional differences in the representation of supragranular layers may be especially important for the capacity of morphometric similarity mapping to serve as a proxy for histological similarity and axonal connectivity between cortical regions. Future studies involving higher-field multi-parameter MRI in humans and primates, combined with more fine-grained and quantitative histological data, will be important in elucidating more precisely how different aspects of cortical organization contribute to the morphometric similarity between areas.
Methodological Considerations and Future Directions
The findings detailed above should be considered in light of certain caveats and the need for further examination of MSNs in future work. First, although we show that the basic architecture of MSNs can be recovered across different image acquisition platforms, different image pre-processing steps, and different sets of anatomical features per node, it will be important to more comprehensively explore the full possible search space defined by these three key methodological choices. Similarly, it will be of value to systematically vary the definition, number, and spatial patterning of nodes used for construction of cortical MSNs and to develop methods for MSN analyses beyond the cortex. Nodal definition presents an especially complex issue for connectomics because maximizing the biological validity of nodal definitions (Glasser et al., 2016) can result in a dramatic variability in nodal size, which, in turn, can operate as a confound in graph theoretical analysis. Second, our reported comparisons between MSNs, SCNs, and DWI-based networks in alignment with cytoarchitecture will need to be revisited as new techniques are developed for in vivo measurement of cortical thickness (Das et al., 2009) and white matter connectivity (Fan et al., 2016; Thomas et al., 2014). Third, the remarkable public maps of gene expression in the human brain provided by the Allen Institute for Brain Science (AIBS) allowed us to begin assessing the transcriptomic correlates of MSNs and pave the way for future studies as available post-mortem gene expression data expand with respect to inter-individual variation, spatiotemporal comprehensiveness, and cellular resolution. Fourth, we have considered a limited set of key graph-theoretical metrics in this first presentation and analysis of MSNs. It will be valuable to profile MSN topography with a more exhaustive set of metrics in future work and harness these metrics to more fully characterize the transcriptomic, microstructural, and behavioral correlates of morphometric similarity.
MSNs and Intelligence
The availability of a new method for mapping the anatomical connectome of a single human is likely to be helpful in understanding how its network topology relates to the cognitive or psychological functions of the brain. As noted earlier, it is particularly important to understand more clearly how integrative elements of connectome topology, like hubs and a rich club, might be linked to cognitive processing.
There is a body of theoretical and experimental work in support of the idea that higher-order, more effortful conscious processing depends on a global workspace architecture that coordinates neuronal activity across anatomically distributed areas of the cortex (Baars, 1997; Dehaene and Changeux, 2011). Conceptually related work has highlighted the importance of a multiple demand network of association cortical areas for fluid intelligence (Duncan, 2010). In the language of graph theory, this is compatible with the prediction that topologically integrative features of the connectome, which “break modularity” (Dehaene and Naccache, 2001), should be important for intelligent cognitive function, and there is already some evidence in support of this prediction. For example, it has been shown that higher IQ is negatively correlated with the characteristic path length of fMRI and DWI networks (Li et al., 2009; van den Heuvel et al., 2009), that performance of a cognitively demanding working memory task is associated with greater topological efficiency (shorter path length) of magnetoencephalography (MEG) networks (Kitzbichler et al., 2011), and that the rich club of interconnected hubs in a meta-analysis of task-related fMRI data is co-activated by executive tasks demanding both cognition and action (Crossley et al., 2013).
On this basis, we predicted that individual differences in IQ should be related to inter-individual variability in the hubness or degree of individual MSN nodes. We applied the multivariate, dimension-reducing method of PLS to test the strength of association between the verbal and nonverbal IQ of 292 healthy participants on one hand and the degree of 308 cortical nodes in each of 292 individual MSNs on the other hand. Remarkably, the first two PLS components collectively accounted for approximately 40% of the total variance in IQ. The first PLS component defined a set of cortical areas, functionally specialized for language and located in left frontal and temporal cortex, where a higher degree was strongly predictive of a higher verbal and nonverbal IQ; the second PLS component defined a distinct set of areas, functionally specialized for vision and memory, where a higher degree was specifically predictive of a higher nonverbal IQ. We speculate that the capacity of inter-individual variation in MSN topology to predict inter-individual variation in IQ may reflect the fact that MSNs simultaneously capture information about multiple dimensions of brain organization with relevance for cognitive function. In particular, the high-degree hubs of the MSN are concentrated on association cortical areas that have a high number of pyramidal neurons in supragranular layers (Figures 3 and 4) that send and receive long-distance axonal projections to other cortical areas (Figure 5). The MSN hubs associated with higher IQ are thus expected to be important to workspace theories (Dehaene and Changeux, 2011) that assign higher-order cognitive functions to the coordinated activity of large populations of globally distributed neurons.
The empirical relationships we report between MSN topology and IQ directly support our fourth hypothesis, and they provide some of the strongest evidence yet available in support of the more general hypothesis that inter-individual differences in topologically integrative features of the human brain connectome, like high-degree hubs, are important for “higher-order” cognitive functions (Deary et al., 2010; Saggar et al., 2015) that are theoretically dependent on a global workspace architecture (Dehaene and Changeux, 2011). Indeed, the strength of association between IQ and MSN nodal degree is large compared with many prior studies reporting an association between IQ and other structural MRI phenotypes (Reiss et al., 1996; Ritchie et al., 2015; Toga and Thompson, 2005). We predict, on this basis, that morphometric similarity mapping could provide a powerful technical platform for measuring the anatomical connectome in vivo and for understanding how the cognitive functions of the human brain are related to its topologically complex connectome.
STAR★METHODS
CONTACT FOR REAGENT AND RESOURCE SHARING
Questions and requests regarding the resources detailed in this manuscript should be directed to the Lead Contact, Jakob Seidlitz (jakob.seidlitz@nih.gov).
EXPERIMENTAL MODEL AND SUBJECT DETAILS
Study design – primary NSPN cohort
Subjects were recruited as a part of the Neuroscience in Psychiatry Network (NSPN) study of normative adolescent development. A subgroup of 300 adolescents and young adults aged 14-24 years was assembled by stratified sampling from 5 temporally contiguous strata. Participants were excluded if they were currently being treated for a psychiatric disorder or for drug or alcohol dependence; had a current or past history of neurological disorders or trauma including epilepsy, or head injury causing loss of consciousness; had a learning disability requiring specialist educational support and/or medical treatment; or had a safety contraindication for MRI. Participants provided informed written consent for each aspect of the study and parental consent was obtained for those aged 14-15 years. The study was ethically approved by the National Research Ethics Service and was conducted in accordance with NHS research governance standards.
Study design – secondary NIH cohort
To test the reliability and replicability of morphometric similarity, we constructed MSNs in an independent cohort of human subjects, using different image analysis software for the processing pipeline, a different areal parcellation, and a more limited set of morphometric features (n = 5). The sample consists of 124 typically developing subjects (49 females, mean age = 12.55, σ = 4.27, range = 5.59-25.13; 65 males, mean age = 13.40, σ = 4.52, range = 5.77-32.04) sampled from the National Institutes of Health (NIH) longitudinal study of normative brain development (Giedd et al., 1999, 2015)
Study design – macaque monkey cohort
We additionally constructed MSNs using an independent cohort of 31 healthy young rhesus macaques (13 females; mean age = 1.7 years, range = 0.9 to 3.0 years), whose MRI data were collected as part of the UNC-UW longitudinal study at the University of North Carolina and the University of Wisconsin (Young et al., 2017). Animals were included if they had T1-weighted, T2-weighted and DWI data available at more than one time point. Prior to scanning, each animal was anaesthetised following the protocol from Young et al. (2017). All animal procedures were conducted in compliance with the Institutional Animal Care and Use Committee (IACUC) and the National Institutes of Health Guide for the Care and Use of Laboratory Animals.
METHOD DETAILS
MRI data acquisition – primary NSPN cohort
The anatomical MRI data were acquired using the multi-parametric mapping (MPM) sequence (Weiskopf et al., 2013) implemented on three identical 3T whole-body MRI systems (Magnetom TIM Trio, Siemens Healthcare, Erlangen, Germany; VB17 software version), two located in Cambridge and one in London, operating with the standard 32-channel radio-frequency (RF) receive head coil and RF body coil for transmission. Between-site reliability of all MRI procedures was satisfactorily assessed by a pilot study of 5 healthy volunteers scanned at each site (Weiskopf et al., 2013). The between-site bias was less than 3%, and the betweensite coefficient of variation was less than 8%, for both the longitudinal relaxation rate (R1 = 1/T1) and MT parameters (Weiskopf et al., 2013). R1 and MT were quantified in MATLAB (The MathWorks Inc., Natick, MA, USA) using SPM8 (www.fil.ion.ucl.ac.uk/spm).
Diffusion weighted imaging (DWI) data were collected in the same scanning session as the MPM data. A High-Angular Resolution Diffusion-Weighted Image (HARDI) was acquired using a single-shot echo planar imaging sequence consisting of 63 gradient directions with a b-value = 1000 mm/s2 along with 5 unweighted B0 images. This protocol used 70 consecutive axial slices of thickness 2 mm (FOV = 192 × 192 mm, TE = 90 ms, TR = 8700 ms) resulting in a voxel size of 2.0 mm isotropic.
Human MRI data pre-processing
We used Freesurfer v5.3.0 software for the data pre-processing pipeline (Fischl, 2012; http://surfer.nmr.mgh.harvard.edu). Briefly, the cortical surface for each participant was reconstructed from their R1 image by the following steps: skull stripping (Ségonne et al., 2004), segmentation of cortical gray and white matter (Dale et al., 1999), separation of the two hemispheres and subcortical structures (Dale et al., 1999; Fischl et al., 2002; Fischl et al., 2004); and finally construction of smooth representation of the gray/white interface and the pial surface (Fischl et al., 1999). The DWI volumes were aligned to the R1 image for each subject. After quality control, 3 participants had to be excluded from the analyses due to movement artifacts which prevented accurate surface reconstructions, and 1 due to errors in their DWI volume reconstruction, leaving N = 296 (148 males and 148 females) for the final cohort used for the imaging analyses in this paper.
Quality control of the reconstructed cortical surfaces for each subject was carried out by six independent members of the NSPN Consortium (Supplemental Material). The segmentation was edited by adding control points in Freesurfer, re-processed to obtain the surface reconstructions, and checked again. In addition, the raw reconstructed R1, MT, and DWI volumes were visually inspected for motion artifacts by JS.
Human MRI cortical parcellation
To define the set of nodes, the 68 cortical regions in the Desikan-Killiany atlas (Desikan et al., 2006) were sub-parcellated into 308 spatially contiguous regions, of approximately equal size (~5 cm2), using a backtracking algorithm as described previously (Romero-Garcia et al., 2012). This parcellation was generated once on the surface of the Freesurfer standard anatomical template (fsaverage), and subsequently transformed to each individual subject’s surface. Each subject’s surface parcellation was then interpolated and expanded to their respective R1, MT, and B0 (DWI) volumes.
Estimation of regional morphometric features
A feature matrix consisting of 10 morphometric features measured at each of 308 brain regions was estimated from the combined MPM and DWI data available for each subject (Figure 1A). Surface- and volume-based features were extracted using the respective version of the regional parcellation. For the surface-based features, regional values were estimated for cortical thickness (CT), surface area (SA), intrinsic curvature (IC), mean curvature (MC), curvature index (CI), and folding index (FI). For the volume-based features, regional values were estimated for the diffusion metrics (fractional anisotropy – FA, and mean diffusivity – MD) as well as gray matter volume (GM) and magnetization transfer (MT). The regional MT values were estimated at 70% cortical depth (Whitaker et al., 2016).
Estimation of MSNs
Each of the MRI feature vectors in each region of each individual image were normalized (z-scored) and then the Pearson productmoment correlation coefficient (r) was estimated for each possible regional pair of MRI feature vectors (see Figures 1B and 1C). The resultant zero-centered distributions of the correlation matrices arise from the pre-processing step involving normalization of features across nodes within each brain, before network construction. These pairwise measures of morphometric similarity were compiled to form a morphometric similarity matrix which was thresholded to construct weighted and binary graphs of arbitrary connection density, also known as morphometric similarity networks (MSNs). Explicitly, MSNs were thresholded such that inter-regional correlations less than the threshold value were set to 0, and supra-threshold edges maintained their values (for weighted) or were set to 1 (for binary), in the corresponding elements of the individual MSNs. To create a group level MSN, we averaged the individual morphometric similarity matrices and then thresholded the mean similarity matrix.
Structural covariance network construction
Cortical thickness (CT) of each of the 308 regions in the 296 subjects was used as the morphometric feature for constructing the structural covariance network (SCN), as in Whitaker et al. (2016). This entailed estimating the set of correlations between cortical thickness of each possible pair of regions, over all participants, resulting in a single inter-regional CT correlation matrix which was thresholded to generate a binary graph representation of the whole-sample structural covariance network.
DWI network construction
The entire DWI image analysis pipeline was performed in AFNI, a freely available MRI and DWI analysis software suite (Cox, 1996). For each subject, DWI image volumes were de-obliqued and co-registered to the B0 volume to account for head movement. The 6 principal direction tensors were then estimated from the DWI image volume using the 3dDWItoDT command. Probabilistic tractography for the 308 brain regions was performed using the 3dTrackID command, along with tensor uncertainty estimates from 3dDWUncert to increase robustness (Taylor et al., 2012; Taylor and Saad, 2013). An asymmetric connectivity matrix was estimated for each of the 296 subjects, where each element represents the average mean diffusivity (MD) along the axonal tracts connecting two regions. We chose the measure for estimating tract weights that maximized the proportion of intra-class edges defined by a prior cytoarchitectonic classification (Figure 3).
Inter- versus intra-hemispheric effects on edge detection by DWI versus morphometric similarity mapping required construction of a binarised group-average DWI network for comparison with the binarised group-average MSN. To achieve a binarised DWI network, we used a consensus averaging approach (Mišić et al., 2015), generating a 9% dense group average DWI network, still using mean diffusivity (MD) along the tracts as the measure of connection weight. We then binarised this network, and thresholded the group average MSN to match the connection density of this consensus DWI network. This consensus average group DWI network was also used to provide an alternative test for the overlap between cortical DWI networks and cytoarchitectonic classes.
Digitisation of a cytoarchitectonic atlas
To test the correspondence between morphometric similarity and cytoarchitecture, we used an independent modular decomposition depicting the five typical laminar patterns of the cortex as proposed by von Economo and Koskinas (1925). We manually assigned nodes in our n = 308 parcellation to one of the five cortical classes (Solari and Stoner, 2011), and, in addition, the insula and cingulate cortex were partitioned into separate classes to reflect their distinct cytoarchitectonic profiles, thus producing seven distinct modules (Vértes et al., 2016; Whitaker et al., 2016).
To assess the spatial overlap between morphometric similarity and cytoarchitecture, 1000 pseudo-random communities were created by iteratively permuting the module labels associated to pairs of nodes located at the same distance from each module’s centroid. This procedure randomly shifts the position of the modules along the cortex without splitting apart the components of the module (Bethlehem et al., 2017). The resulting null distribution of community partitions preserves the number and size of modules, as well as the spatial contiguity of the empirical community partition.
Brain gene co-expression estimation
To account for the redundancy of the cRNA hybridization probes, which contained expression levels for overlapping genes, expression values for the same gene were averaged across probes. Probes with unmatched genes were excluded, leaving 20,737 genes from 3,702 samples. Because of the symmetric gene expression values between hemispheres (Pletikos et al., 2014), the AIBS dataset only contains data from both hemispheres for two subjects. Thus, because the right hemisphere was under- sampled, we performed all analyses on the left hemisphere (n = 152 regions). We mapped the gene expression values of each subject to the fsaverage (MNI305) volumetric template space (assigning samples to the nearest centroid of the left hemisphere (n = 152 regions) of our parcellation) using the individual AIBS subjects’ T1-weighted volumes (Vértes et al., 2016; Whitaker et al., 2016). For the two subjects with right hemisphere data, we first reflected the right hemisphere samples’ coordinates and then performed the mapping.
The median regional expression was estimated for each gene across participants (N = 6) and then each gene’s regional values were normalized (z-scored), resulting in a 152 × 20,737 matrix of the genome-wide expression data for the 152 regions of the left hemisphere. The 152 × 152 gene co-expression matrix (i.e., the upper-left quadrant of the group MSN) contained pairwise Pearson correlations, which were computed for each of the left hemisphere regions, representing the intra-hemispheric gene co-expression of two left hemisphere regions across the 20,737 genes. This network, along with the set of regional expression values, was used for comparison to the corresponding left hemisphere of the group MSN.
The Human Supragranular Enriched (HSE) gene set contains 19 genes that were found to be primarily expressed in the upper layers (II/III) of human cortex: BEND5, C1QL2, CACNA1E, COL24A1, COL6A1, CRYM, KCNC3, KCNH4, LGALS1, MFGE8, NEFH, PRSS12, SCN3B, SCN4B, SNCG, SV2C, SYT2, TPBG and VAMP1 (Zeng et al., 2012). The inter-areal co-expression of HSE genes has been related to the emergence of cortico-cortical connectivity in humans (Krienen et al., 2016; Zeng et al., 2012). We therefore created a gene co-expression network using only the HSE genes.
Gene ontology enrichment analysis was performed using GOrilla (Eden et al., 2007; Eden et al., 2009) and visualized using REViGO (Supek et al., 2011), and, in addition, replicated using Enrichr (Chen et al., 2013; Kuleshov et al., 2016).
MRI data acquisition – secondary NIH cohort
Subjects were scanned on a 1.5T GE Signa scanner (axial slice = 1.5 mm, TE = 5 ms, TR = 24 ms, flip angle = 45°, matrix = 256 × 256 × 124, FOV = 24 cm) using a spoiled-gradient recalled echo (3D-SPGR) imaging sequence (Giedd et al., 1999). The T1-weighted scans were processed using the Montreal Neurological Institute’s CIVET pipeline (v1.1.10; Ad-Dab’bagh et al., 2006). Due to the lack of MT, DWI, or T2-weighted imaging, only (gray matter) morphometric features derived from the T1-weighted scans were estimated (CT, SA, GM, MC, IC). GM values were estimated using the T1w volumes of each subject. Vertex-wise CT and SA values were estimated using the resultant pial surface reconstructions from CIVET, while MC and IC metrics of these surfaces were estimated using the freely available Caret software package (Van Essen et al., 2001). The down-sampling of these surface meshes (~80,000 vertices per mesh) into 360 regions was performed (Alexander-Bloch et al., 2013b), where the vertex-wise estimates of the features were averaged (for CT, MC, and IC) or summed (for SA) within a given region in the parcellation. The surface parcellation was projected to the volume for extraction of regional GM for each subject.
For quality control, the CIVET output—tissue segmentation and surface reconstructions—for each subject was visually inspected by multiple independent raters (including JS) for accuracy of processing using a 5-level coding system (i.e., 1 = accurate). Only scans scoring a 1 after coding were used in the analyses presented in this paper.
MRI data acquisition – macaque monkey cohort
T1-weighted (TR = 8.684 ms, TE = 3.652 ms, FOV = 140 × 140 mm, flip angle = 12°, matrix = 256 × 256, thickness = 0.8 mm, gap = −0.4 mm, voxel resolution = 0.55 × 0.55 × 0.8 mm3) and T2-weighted (TR = 2500 ms, TE = 87 ms, FOV = 154 × 154 mm, flip angle = 90°, matrix = 256 × 256, thickness = 0.6 mm, gap = 0 mm, voxel resolution = 0.6 × 0.6 × 0.6mm3), and diffusion-weighted images (120 gradient directions, TR = 8000 ms, TE = 65.7 ms, FOV = 16.7 mm, matrix = 128 3 128, thickness = 2.6 mm, voxel resolution = 0.65 × 0.65 × 1.3 mm3) were acquired using a GE MR750 3T scanner with an 8-channel human brain array coil (Young et al., 2017).
The same 5 morphometric features used to construct the NIH human MSNs were estimated for the macaque data using an automated analysis pipeline (Seidlitz et al., 2017), which combines tools from AFNI as well as from the freely available Advanced Normalization Tools (ANTs) software package (Avants et al., 2011; http://stnava.github.io/ANTs/). Additionally, we estimated MD and FA from the DWI scans, as well as the T1w/T2w ratio (after resampling the T2w scans to match the resolution of the T1w scans) (Glasser and Van Essen, 2011), generating a total of 8 regional morphometric features for each subject. For cross-species comparison of the network properties, and for comparison to retrograde viral tract tracing data, we used the 91-region left hemisphere cortical parcellation from Markov et al. (2014). The individual 91 × 91 region left hemisphere MSNs were averaged to create a group average macaque MSN.
Although initial quality control of the raw data was performed on this dataset in Young et al. (2017), visual assessment of the raw reconstructed volumes (T1w, T2w, and DWI) was also performed by JS. In addition, after processing (described above), the results of image registrations, tissue segmentations, and regional parcellations for each subject were inspected.
MACAQUE TRACT TRACING DATA
Connectivity of the group MSN was evaluated against tract tracing connectivity data from Markov et al. (2012) (downloaded from core-nets.org). Whereas DWI tractography is an in vivo non-invasive indirect approximation of white matter connectivity, “gold standard” anatomical tract tracing is an invasive ex vivo method of measuring directed connectivity. In retrograde tracing, a tracer (typically a dye, molecule, or radioactively tagged amino acid) is injected and physically travels along the axonal projection from its termination site (i.e., site of injection) to the soma from which the axon originates. The measure of connectivity is reliant upon the labeling of neurons in the areas of interest. Markov et al. (2012) generated an index of connectivity called the extrinsic fraction of labeled neurons (FLNe). FLNe was calculated as the number of labeled neurons at the target site that exist above and beyond the fraction of labeled neurons of that site relative to the entire brain and labeled neurons intrinsic to that site (Markov et al., 2012). Thus, this retrograde tract tracing dataset is a weighted and directed 29 × 91 matrix (i.e., 29 injection points), where the 29 × 29 subgraph of the matrix contains all possible connections between those injection sites.
The distribution of edge weights from the tract tracing network follows a logarithmic distribution, thus we transformed the edge weights by the base 10 logarithm function for our analyses. We used the 29 × 29 subgraph of the total 29 × 91 connectivity matrix (Figure 5B). For comparison with the tract tracing data, the 91 × 91 macaque MSNs were matched to the same 29 × 29 dimensions.
QUANTIFICATION AND STATISTICAL ANALYSIS
Relational analyses
We used correlation coefficients as the measure of comparison between the edge weights and nodal statistics of the MSNs. Although we report the Pearson correlation coefficients in the main text, we acknowledge that in some cases the distributions of the variables of comparison violated the assumptions of normality made when using the Pearson correlation. As such, we also report these results using the Spearman rank correlation coefficient, which can be found in Table S1.
Graph theoretic analyses
For each of the individual MSNs (and comparable SCN and DWI networks), a series of graphs was constructed and analyzed over a range of connection densities (2%, 3%, 4%, and 5%–40%, 5% intervals), using both weighted and binarised approaches. Summary statistics for the MSNs, as well as for random networks with the same number of nodes and edges, are reported using the 11 arbitrary thresholds.
The following graph metrics were calculated in MATLAB using the Brain Connectivity Toolbox, a freely available graph analysis software package (Rubinov and Sporns, 2010), as well as in R (http://www.r-project.org/) using the igraph package (Csardi and Nepusz, 2006). Graph visualization was performed using Rstudio (https://www.rstudio.com/), Python (Python Software Foundation; https://www.python.org/), Gephi (Bastian et al., 2009), as well as BrainNet Viewer (Xia et al., 2013) (https://www.nitrc.org/projects/bnv/).
The degree, k, of a graph describes the total number of edges of each node. The clustering coefficient, C, of node i is the ratio of the number of i’s neighbors that are connected to each other with a single edge. As such, the clustering coefficient across an entire graph is the average of the clustering coefficients over all nodes, defined as:
| (1) |
where ki are the neighbors of node i and ki(ki – 1) is the number of possible edges between ki (Watts and Strogatz, 1998). The characteristic path length represents the mean of shortest paths between all pairs of nodes in a network (Watts and Strogatz, 1998), defined as:
| (2) |
where Li is the mean distance between node i and every other node. Global efficiency is the inverse of the characteristic path length. The small-world coefficient of a network (Humphries and Gurney, 2008) is defined as:
| (3) |
where (C/Crand) is the ratio of the average clustering coefficient between the empirical network and average values from a set of corresponding randomized networks with preserved degree distribution, and (L/Lrand) is the ratio of characteristic path lengths of the empirical network and the set of random networks. In this study, 1 random network per participant was generated. As such, a network is generally considered small world when S > 1.
Modularity (Q) is a measure of network segregation, by which nodes are subdivided into communities, or modules, to maximize intra-community edge strength in comparison to a random network null model (Girvan and Newman, 2002; Newman, 2004). It is defined as:
| (4) |
where mi and mj are the modules containing nodes i and j, respectively. If mi = mj, (i.e., nodes i and j are members of the same module) then δmi,mj = 1, but if mi ≠ mj, (i.e., nodes i and j are members of different modules), then δmi,mj = 0. In order to detect a stable consensus community structure, this modularity decomposition algorithm was applied 1000 times (Garcia et al., 2017). A consensus matrix was created defining each element as the number of times that each node had been classified to the same module. Finally, the consensus matrix was used as an input for the community algorithm. The resulting output represented a stable modular structure of the original network (Kwak et al., 2009). We report the modules using the group average NSPN MSN at 10% connection density.
The rich club coefficient is a property of complex networks and measures the amount of inter-connectedness between hubs of a network (Colizza et al., 2006; van den Heuvel and Sporns, 2011), calculated at varying degree cut-offs. The normalized rich club coefficient (Φ) is the ratio of the rich club coefficient of the empirical network (i.e., the MSNs) relative to that of a random network. Thus, the nodes greater than or equal to the degree cut-off at which Φ > 1 denotes membership to the rich club.
Spatial permutation testing
To statistically test the relationship between gene expression and MSN topology, spatial permutation testing was Váša et al. (2017). We first obtained the coordinates of each of our 308 regions on the Freesurfer spherical projection of the parcellation (using the fsaverage brain surface). Then these coordinates were rotated about the three principal axes at three randomly generated angles, θx, θy and θz ∈ [0, 2π), using the following rotation matrices:
| (5) |
Given the separate hemisphere projections onto the surface, the rotation was applied to both hemispheres. To preserve hemispheric symmetry, the same random angles were applied to both hemispheres, with the caveat that the sign of the angles was flipped for the rotations around the y and z axes (i.e., θy = -θyL and θzR = -θzL but θxL = θxR).
Following rotation of the sphere, coordinates of the rotated regions were matched to coordinates of the initial regions, using Euclidean distance and proceeding in a descending order of average Euclidean distance between pairs of regions on the rotated and unrotated spheres (i.e.: starting with the rotated region that is furthest away, on average, from the unrotated regions). The matching then provides a mapping from the set of regions to itself, that allows any regional measure to be permuted while controlling for spatial contiguity and hemispheric symmetry.
Partial least-squares analysis
We assessed the relationship between individual differences in IQ and individual differences in nodal degree of each of 308 regions in each of 292 individual MSNs using the multivariate method of partial least-squares (PLS) regression, as in Whitaker et al. (2016) and Vértes et al. (2016). This dimensionality reduction technique seeks to find the latent variables or PLS components which maximize the correlation between a set of collinear predictor variables and a set of response variables. Here, normalized scores on the vocabulary and matrix reasoning subscales of the Wechsler Abbreviated Scale of Intelligence (WASI) test (Wechsler, 1999) were used as response variables and degree centrality of each node in individual MSNs thresholded at arbitrary connection density were used as predictor variables. We used MSN degree so that only high strength edges were included in the analysis, and so that the robustness of this PLS method could be tested across a range of MSN densities. Four subjects were excluded due to unavailability of WASI IQ data (N = 292). Bootstrapping (resampling with replacement of the 292 individual subjects) was used to estimate the error on the PLS weights for each node so that the nodes could be ranked based on their contribution to each PLS component (Vértes et al., 2016).
DATA AND SOFTWARE AVAILABILITY
Gene expression
We used the freely available Allen Institute of Brain Sciences (AIBS) transciptomic dataset (http://human.brain-map.org/) to estimate gene expression for each region and gene co-expression between each pair of regions. This dataset comprises post-mortem samples collected from 6 adult male donors (H0351.1009, H0351.1016, H0351.1015, H0351.2002, H0351.1012, H0351.2001; 3 Caucasian, 2 African-American, 1 Hispanic; mean age = 42.5 years). For a detailed description on the methods of whole genome microarray analysis at multiple regional locations, see the AIBS technical white paper (http://human.brain-map.org).
Macaque tract tracing
Full details of the macaque tract tracing dataset used in this paper can be found in Markov et al. (2012). The mapping of connections was performed across multiple sites and subjects to form the single cortical connectivity matrix. This tract tracing connectivity matrix and corresponding digital atlas (M132) can be downloaded from core-nets.org.
Macaque MRI dataset
Full details of the UNC-Wisconsin Neurodevelopmental Rhesus Database – a longitudinal multimodal macaque neuroimaging dataset – can be found in Young et al. (2017). Additionally, the data are freely available to the research community (https://data.kitware.com/#collection/54b582c38d777f4362aa9cb3).
NIMH macaque template
Full details on the NIMH Macaque Template (NMT) and corresponding automated processing tools can be found in Seidlitz et al. (2017). The high-resolution NMT represents an average macaque brain, generated from 31 young adult rhesus macaques using an unbiased iterative diffeomorphic registration method from the ANTs software package. Corresponding tissue segmentation, 3D surfaces, and scripts are freely available for download (https://github.com/jms290/NMT).
MyConnectome MRI dataset
The MyConnectome project contains MRI, DWI, fMRI, cognitive, and physiological data from a single individual, mapped during multiple sessions over the course of a year (Poldrack et al., 2015). The data are freely available for download (http://myconnectome.org/wp/).
NSPN dataset
Data for this specific paper (for the primary NSPN cohort) has been uploaded to the Cambridge Data Repository (https://doi.org/10.17863/CAM.17102) and password protected. Our participants did not give informed consent for their measures to be made publicly available, and it is possible that they could be identified from this data set. Access to the data supporting the analyses presented in this paper will be made available to researchers with a reasonable request to openNSPN@medschl.cam.ac.uk.
Supplementary Material
KEY RESOURCES TABLE
Highlights.
Morphometric similarity networks (MSNs) are connectomes generated from structural MRI
MSN topology captures known cortical cytoarchitecture and related gene expression
Macaque MSNs map onto gold-standard connectivity derived from axonal tract tracing
Human IQ is linked to variation in MSN degree of relevant anatomical regions
Acknowledgments
We would like to thank the participants in the NSPN and NIH studies of human brain development. We also thank Claus Hilgetag, Alexandros Goulas, Lisa Ronan, and James Rowe for helpful comments. This study was supported by the Neuroscience in Psychiatry Network and a strategic award by the Wellcome Trust to the University of Cambridge and University College London (095844/Z/11/Z). Additional support was provided by the National Institute for Health Research Cambridge Biomedical Research Centre and the Medical Research Council/Wellcome Trust Behavioural and Clinical Neuroscience Institute at the University of Cambridge. This study was also supported in part by the intramural research program of the NIMH (NCT00001246 and 89-M-0006). J.S. was supported by the NIH-Oxford/ Cambridge Scholars Program. M.S. was supported by the Winston Churchill Foundation of the United States. F.V. was supported by the Gates Cambridge Trust. P.E.V. was supported by Medical Research Council grant MR/K020706/1.
Footnotes
AUTHOR CONTRIBUTIONS
Conceptualization, J.S., A.R., and E.T.B.; Methodology, J.S., F.V., M.S., A.R., and E.T.B.; Validation, J.S., K.W., S.L., A.M., D.A.L., and A.R.; Investigation, J.S., F.V., M.S., R.R.-G., K.J.W., and P.E.V.; Resources, A.M., D.A.L., P.F., R.J.D., P.B.J., I.M.G., A.R., and E.T.B.; Data Curation, J.S., F.V., R.R.-G., K.J.W., P.E.V., K.W., P.K.R., L.C., and S.L.; Writing – Original Draft, J.S., F.V., A.R., and E.T.B.; Writing – Review & Editing, J.S., F.V., M.S., R.R.-G., K.J.W., P.E.V., K.W., P.K.R., L.C., S.L., A.M., D.A.L., P.F., R.J.D., P.B.J., I.M.G., A.R., and E.T.B.; Project Administration, P.F., R.J.D., P.B.J., I.M.G., A.R., and E.T.B.
DECLARATION OF INTERESTS
E.T.B. is employed half-time by the University of Cambridge and half-time by GlaxoSmithKline; he holds stock in GlaxoSmithKline. I.M.G. consults to Lundbeck.
SUPPLEMENTAL INFORMATION
Supplemental Information includes six figures and two tables and can be found with this article online at https://doi.org/10.1016/j.neuron.2017.11.039.
References
- Ad-Dab’bagh Y, Lyttelton O, Muehlboeck J, Lepage C, Einarson D, Mok K, Ivanov O, Vincent R, Lerch J, Fombonne E. In: Corbetta M, editor. The CIVET image-processing environment: a fully automated comprehensive pipeline for anatomical neuroimaging research; Proceedings of the 12th annual meeting of the Organization for Human Brain Mapping; Florence, Italy. 2006. 2266. [Google Scholar]
- Alexander-Bloch A, Giedd JN, Bullmore E. Imaging structural co-variance between human brain regions. Nat Rev Neurosci. 2013a;14:322–336. doi: 10.1038/nrn3465. [DOI] [PMC free article] [PubMed] [Google Scholar]
- Alexander-Bloch A, Raznahan A, Bullmore E, Giedd J. The convergence of maturational change and structural covariance in human cortical networks. J Neurosci. 2013b;33:2889–2899. doi: 10.1523/JNEUROSCI.3554-12.2013. [DOI] [PMC free article] [PubMed] [Google Scholar]
- Avants BB, Tustison NJ, Song G, Cook PA, Klein A, Gee JC. A reproducible evaluation of ANTs similarity metric performance in brain image registration. Neuroimage. 2011;54:2033–2044. doi: 10.1016/j.neuroimage.2010.09.025. [DOI] [PMC free article] [PubMed] [Google Scholar]
- Baars BJ. Spatial brain coherence during the establishment of a conscious event. Conscious Cogn. 1997;6:1–2. doi: 10.1006/ccog.1996.0289. [DOI] [PubMed] [Google Scholar]
- Barabási AL. Network science. Cambridge University Press; 2016. [Google Scholar]
- Barbas H. General cortical and special prefrontal connections: principles from structure to function. Annu Rev Neurosci. 2015;38:269–289. doi: 10.1146/annurev-neuro-071714-033936. [DOI] [PubMed] [Google Scholar]
- Bastian M, Heymann S, Jacomy M. Gephi: an open source software for exploring and manipulating networks. Icwsm. 2009;8:361–362. [Google Scholar]
- Batalle D, Muñoz-Moreno E, Figueras F, Bargallo N, Eixarch E, Gratacos E. Normalization of similarity-based individual brain networks from gray matter MRI and its association with neurodevelopment in infants with intrauterine growth restriction. Neuroimage. 2013;83:901–911. doi: 10.1016/j.neuroimage.2013.07.045. [DOI] [PubMed] [Google Scholar]
- Bernard A, Lubbers LS, Tanis KQ, Luo R, Podtelezhnikov AA, Finney EM, McWhorter MM, Serikawa K, Lemon T, Morgan R, et al. Transcriptional architecture of the primate neocortex. Neuron. 2012;73:1083–1099. doi: 10.1016/j.neuron.2012.03.002. [DOI] [PMC free article] [PubMed] [Google Scholar]
- Bethlehem RAI, Romero-Garcia R, Mak E, Bullmore ET, Baron-Cohen S. Structural covariance networks in children with autism or ADHD. Cereb Cortex. 2017;27:4267–4276. doi: 10.1093/cercor/bhx135. [DOI] [PMC free article] [PubMed] [Google Scholar]
- Bullmore E, Sporns O. The economy of brain network organization. Nat Rev Neurosci. 2012;13:336–349. doi: 10.1038/nrn3214. [DOI] [PubMed] [Google Scholar]
- Chen CH, Gutierrez ED, Thompson W, Panizzon MS, Jernigan TL, Eyler LT, Fennema-Notestine C, Jak AJ, Neale MC, Franz CE, et al. Hierarchical genetic organization of human cortical surface area. Science. 2012;335:1634–1636. doi: 10.1126/science.1215330. [DOI] [PMC free article] [PubMed] [Google Scholar]
- Chen EY, Tan CM, Kou Y, Duan Q, Wang Z, Meirelles GV, Clark NR, Ma’ayan A. Enrichr: interactive and collaborative HTML5 gene list enrichment analysis tool. BMC Bioinformatics. 2013;14:128. doi: 10.1186/1471-2105-14-128. [DOI] [PMC free article] [PubMed] [Google Scholar]
- Colizza V, Flammini A, Serrano MA, Vespignani A. Detecting rich-club ordering in complex networks. Nat Phys. 2006;2:110–115. [Google Scholar]
- Cox RW. AFNI: software for analysis and visualization of functional magnetic resonance neuroimages. Comput Biomed Res. 1996;29:162–173. doi: 10.1006/cbmr.1996.0014. [DOI] [PubMed] [Google Scholar]
- Crossley NA, Mechelli A, Vértes PE, Winton-Brown TT, Patel AX, Ginestet CE, McGuire P, Bullmore ET. Cognitive relevance of the community structure of the human brain functional coactivation network. Proc Natl Acad Sci USA. 2013;110:11583–11588. doi: 10.1073/pnas.1220826110. [DOI] [PMC free article] [PubMed] [Google Scholar]
- Crossley NA, Mechelli A, Scott J, Carletti F, Fox PT, McGuire P, Bullmore ET. The hubs of the human connectome are generally implicated in the anatomy of brain disorders. Brain. 2014;137:2382–2395. doi: 10.1093/brain/awu132. [DOI] [PMC free article] [PubMed] [Google Scholar]
- Csardi G, Nepusz T. The igraph software package for complex network research. InterJ Complex Syst. 2006;1695:1–9. [Google Scholar]
- Dale AM, Fischl B, Sereno MI. Cortical surface-based analysis. I. Segmentation and surface reconstruction. Neuroimage. 1999;9:179–194. doi: 10.1006/nimg.1998.0395. [DOI] [PubMed] [Google Scholar]
- Das SR, Avants BB, Grossman M, Gee JC. Registration based cortical thickness measurement. Neuroimage. 2009;45:867–879. doi: 10.1016/j.neuroimage.2008.12.016. [DOI] [PMC free article] [PubMed] [Google Scholar]
- Dauguet J, Peled S, Berezovskii V, Delzescaux T, Warfield SK, Born R, Westin CF. Comparison of fiber tracts derived from in-vivo DTI tractography with 3D histological neural tract tracer reconstruction on a macaque brain. Neuroimage. 2007;37:530–538. doi: 10.1016/j.neuroimage.2007.04.067. [DOI] [PubMed] [Google Scholar]
- Davies G, Marioni RE, Liewald DC, Hill WD, Hagenaars SP, Harris SE, Ritchie SJ, Luciano M, Fawns-Ritchie C, Lyall D, et al. Genome-wide association study of cognitive functions and educational attainment in UK Biobank (N=112 151) Mol Psychiatry. 2016;21:758–767. doi: 10.1038/mp.2016.45. [DOI] [PMC free article] [PubMed] [Google Scholar]
- Deary IJ, Penke L, Johnson W. The neuroscience of human intelligence differences. Nat Rev Neurosci. 2010;11:201–211. doi: 10.1038/nrn2793. [DOI] [PubMed] [Google Scholar]
- Dehaene S, Changeux JP. Experimental and theoretical approaches to conscious processing. Neuron. 2011;70:200–227. doi: 10.1016/j.neuron.2011.03.018. [DOI] [PubMed] [Google Scholar]
- Dehaene S, Naccache L. Towards a cognitive neuroscience of consciousness: basic evidence and a workspace framework. Cognition. 2001;79:1–37. doi: 10.1016/s0010-0277(00)00123-2. [DOI] [PubMed] [Google Scholar]
- Desikan RS, Ségonne F, Fischl B, Quinn BT, Dickerson BC, Blacker D, Buckner RL, Dale AM, Maguire RP, Hyman BT, Albert MS, Killiany RJ. An automated labeling system for subdividing the human cerebral cortex on MRI scans into gyral based regions of interest. Neuroimage. 2006;31:968–980. doi: 10.1016/j.neuroimage.2006.01.021. [DOI] [PubMed] [Google Scholar]
- Donahue CJ, Sotiropoulos SN, Jbabdi S, Hernandez-Fernandez M, Behrens TE, Dyrby TB, Coalson T, Kennedy H, Knoblauch K, Van Essen DC, Glasser MF. Using diffusion tractography to predict cortical connection strength and distance: a quantitative comparison with tracers in the monkey. J Neurosci. 2016;36:6758–6770. doi: 10.1523/JNEUROSCI.0493-16.2016. [DOI] [PMC free article] [PubMed] [Google Scholar]
- Duncan J. The multiple-demand (MD) system of the primate brain: mental programs for intelligent behaviour. Trends Cogn Sci. 2010;14:172–179. doi: 10.1016/j.tics.2010.01.004. [DOI] [PubMed] [Google Scholar]
- Eden E, Lipson D, Yogev S, Yakhini Z. Discovering motifs in ranked lists of DNA sequences. PLoS Comput Biol. 2007;3:e39. doi: 10.1371/journal.pcbi.0030039. [DOI] [PMC free article] [PubMed] [Google Scholar]
- Eden E, Navon R, Steinfeld I, Lipson D, Yakhini Z. GOrilla: a tool for discovery and visualization of enriched GO terms in ranked gene lists. BMC Bioinformatics. 2009;10:48. doi: 10.1186/1471-2105-10-48. [DOI] [PMC free article] [PubMed] [Google Scholar]
- Fan Q, Witzel T, Nummenmaa A, Van Dijk KR, Van Horn JD, Drews MK, Somerville LH, Sheridan MA, Santillana RM, Snyder J, et al. MGH-USC Human Connectome Project datasets with ultra-high b-value diffusion MRI. Neuroimage. 2016;124(Pt B):1108–1114. doi: 10.1016/j.neuroimage.2015.08.075. [DOI] [PMC free article] [PubMed] [Google Scholar]
- Fischl B. FreeSurfer. Neuroimage. 2012;62:774–781. doi: 10.1016/j.neuroimage.2012.01.021. [DOI] [PMC free article] [PubMed] [Google Scholar]
- Fischl B, Sereno MI, Dale AM. Cortical surface-based analysis. II: Inflation, flattening, and a surface-based coordinate system. Neuroimage. 1999;9:195–207. doi: 10.1006/nimg.1998.0396. [DOI] [PubMed] [Google Scholar]
- Fischl B, Salat DH, Busa E, Albert M, Dieterich M, Haselgrove C, van der Kouwe A, Killiany R, Kennedy D, Klaveness S, et al. Whole brain segmentation: automated labeling of neuroanatomical structures in the human brain. Neuron. 2002;33:341–355. doi: 10.1016/s0896-6273(02)00569-x. [DOI] [PubMed] [Google Scholar]
- Fischl B, van der Kouwe A, Destrieux C, Halgren E, Segonne F, Salat DH, Busa E, Seidman LJ, Goldstein J, Kennedy D, et al. Automatically parcellating the human cerebral cortex. Cereb Cortex. 2004;14:11–22. doi: 10.1093/cercor/bhg087. [DOI] [PubMed] [Google Scholar]
- Fodor JA. The modularity of mind: an essay on faculty psychology. MIT Press; 1983. [Google Scholar]
- Fornito A, Zalesky A, Bullmore E. Fundamentals of brain network analysis. Academic Press; 2016. [Google Scholar]
- Fulcher BD, Fornito A. A transcriptional signature of hub connectivity in the mouse connectome. Proc Natl Acad Sci USA. 2016;113:1435–1440. doi: 10.1073/pnas.1513302113. [DOI] [PMC free article] [PubMed] [Google Scholar]
- Garcia RR, Whitaker K, Váša F, Seidlitz J, Shinn M, Fonagy P, Dolan R, Jones P, Goodyer I, Bullmore E, Vértes P. Structural covariance networks are coupled to expression of genes enriched in supragranular layers of the human cortex. bioRxiv. 2017 doi: 10.1016/j.neuroimage.2017.12.060. https://doi.org/10.1101/163758. [DOI] [PMC free article] [PubMed]
- Giedd JN, Blumenthal J, Jeffries NO, Castellanos FX, Liu H, Zijdenbos A, Paus T, Evans AC, Rapoport JL. Brain development during childhood and adolescence: a longitudinal MRI study. Nat Neurosci. 1999;2:861–863. doi: 10.1038/13158. [DOI] [PubMed] [Google Scholar]
- Giedd JN, Raznahan A, Alexander-Bloch A, Schmitt E, Gogtay N, Rapoport JL. Child psychiatry branch of the National Institute of Mental Health longitudinal structural magnetic resonance imaging study of human brain development. Neuropsychopharmacology. 2015;40:43–49. doi: 10.1038/npp.2014.236. [DOI] [PMC free article] [PubMed] [Google Scholar]
- Girvan M, Newman ME. Community structure in social and biological networks. Proc Natl Acad Sci USA. 2002;99:7821–7826. doi: 10.1073/pnas.122653799. [DOI] [PMC free article] [PubMed] [Google Scholar]
- Glasser MF, Van Essen DC. Mapping human cortical areas in vivo based on myelin content as revealed by T1- and T2-weighted MRI. J Neurosci. 2011;31:11597–11616. doi: 10.1523/JNEUROSCI.2180-11.2011. [DOI] [PMC free article] [PubMed] [Google Scholar]
- Glasser MF, Coalson TS, Robinson EC, Hacker CD, Harwell J, Yacoub E, Ugurbil K, Andersson J, Beckmann CF, Jenkinson M, et al. A multi-modal parcellation of human cerebral cortex. Nature. 2016;536:171–178. doi: 10.1038/nature18933. [DOI] [PMC free article] [PubMed] [Google Scholar]
- Goulas A, Werner R, Beul SF, Saering D, van den Heuvel M, Triarhou LC, Hilgetag CC. Cytoarchitectonic similarity is a wiring principle of the human connectome. bioRxiv. 2016 https://doi.org/10.1101/068254.
- Goulas A, Uylings HB, Hilgetag CC. Principles of ipsilateral and contralateral cortico-cortical connectivity in the mouse. Brain Struct Funct. 2017;222:1281–1295. doi: 10.1007/s00429-016-1277-y. [DOI] [PubMed] [Google Scholar]
- Hagenaars SP, Harris SE, Davies G, Hill WD, Liewald DC, Ritchie SJ, Marioni RE, Fawns-Ritchie C, Cullen B, Malik R, et al. METASTROKE Consortium, International Consortium for Blood Pressure GWAS; SpiroMeta Consortium; CHARGE Consortium Pulmonary Group, CHARGE Consortium Aging and Longevity Group. Shared genetic aetiology between cognitive functions and physical and mental health in UK Biobank N=112 151 and 24 GWAS consortia. Mol Psychiatry. 2016;21:1624–1632. doi: 10.1038/mp.2015.225. [DOI] [PMC free article] [PubMed] [Google Scholar]
- Hawrylycz MJ, Lein ES, Guillozet-Bongaarts AL, Shen EH, Ng L, Miller JA, van de Lagemaat LN, Smith KA, Ebbert A, Riley ZL, et al. An anatomically comprehensive atlas of the adult human brain transcriptome. Nature. 2012;489:391–399. doi: 10.1038/nature11405. [DOI] [PMC free article] [PubMed] [Google Scholar]
- Humphries MD, Gurney K. Network ‘small-world-ness’: a quantitative method for determining canonical network equivalence. PLoS ONE. 2008;3:e0002051. doi: 10.1371/journal.pone.0002051. [DOI] [PMC free article] [PubMed] [Google Scholar]
- Kitzbichler MG, Henson RN, Smith ML, Nathan PJ, Bullmore ET. Cognitive effort drives workspace configuration of human brain functional networks. J Neurosci. 2011;31:8259–8270. doi: 10.1523/JNEUROSCI.0440-11.2011. [DOI] [PMC free article] [PubMed] [Google Scholar]
- Kong XZ, Liu Z, Huang L, Wang X, Yang Z, Zhou G, Zhen Z, Liu J. Mapping individual brain networks using statistical similarity in regional morphology from MRI. PLoS ONE. 2015;10:e0141840. doi: 10.1371/journal.pone.0141840. [DOI] [PMC free article] [PubMed] [Google Scholar]
- Krienen FM, Yeo BT, Ge T, Buckner RL, Sherwood CC. Transcriptional profiles of supragranular-enriched genes associate with corticocortical network architecture in the human brain. Proc Natl Acad Sci USA. 2016;113:E469–E478. doi: 10.1073/pnas.1510903113. [DOI] [PMC free article] [PubMed] [Google Scholar]
- Kuleshov MV, Jones MR, Rouillard AD, Fernandez NF, Duan Q, Wang Z, Koplev S, Jenkins SL, Jagodnik KM, Lachmann A, et al. Enrichr: a comprehensive gene set enrichment analysis web server 2016 update. Nucleic Acids Res. 2016;44(W1):W90–W97. doi: 10.1093/nar/gkw377. [DOI] [PMC free article] [PubMed] [Google Scholar]
- Kwak H, Eom Y-H, Choi Y, Jeong H, Moon S. Consistent community identification in complex networks. Measurement. 2009;59:4. [Google Scholar]
- Lancichinetti A, Fortunato S. Consensus clustering in complex networks. Sci Rep. 2012;2:336. doi: 10.1038/srep00336. [DOI] [PMC free article] [PubMed] [Google Scholar]
- Lerch JP, van der Kouwe AJ, Raznahan A, Paus T, Johansen-Berg H, Miller KL, Smith SM, Fischl B, Sotiropoulos SN. Studying neuroanatomy using MRI. Nat Neurosci. 2017;20:314–326. doi: 10.1038/nn.4501. [DOI] [PubMed] [Google Scholar]
- Li J, Yu C, Li Y, Liu B, Liu Y, Shu N, Song M, Zhou Y, Zhu W, Li K, Jiang T. COMT val158met modulates association between brain white matter architecture and IQ. Am J Med Genet B Neuropsychiatr Genet. 2009;150B:375–380. doi: 10.1002/ajmg.b.30825. [DOI] [PubMed] [Google Scholar]
- Li W, Yang C, Shi F, Wu S, Wang Q, Nie Y, Zhang X. Construction of individual morphological brain networks with multiple morphometric features. Front Neuroanat. 2017;11:34. doi: 10.3389/fnana.2017.00034. [DOI] [PMC free article] [PubMed] [Google Scholar]
- Maier-Hein K, Neher P, Houde J-C, Cote M-A, Garyfallidis E, Zhong J, Chamberland M, Yeh F-C, Lin YC, Ji Q, et al. Tractography-based connectomes are dominated by false-positive connections. bioRxiv. 2016 https://doi.org/10.1101/084137.
- Markov NT, Ercsey-Ravasz MM, Ribeiro Gomes AR, Lamy C, Magrou L, Vezoli J, Misery P, Falchier A, Quilodran R, Gariel MA, et al. A weighted and directed interareal connectivity matrix for macaque cerebral cortex. [September 25, 2012];Cereb Cortex. 2014 24:17–36. doi: 10.1093/cercor/bhs270. [DOI] [PMC free article] [PubMed] [Google Scholar]
- Meunier D, Lambiotte R, Bullmore ET. Modular and hierarchically modular organization of brain networks. Front Neurosci. 2010;4:200. doi: 10.3389/fnins.2010.00200. [DOI] [PMC free article] [PubMed] [Google Scholar]
- Mišić B, Betzel RF, Nematzadeh A, Goñi J, Griffa A, Hagmann P, Flammini A, Ahn YY, Sporns O. Cooperative and competitive spreading dynamics on the human connectome. Neuron. 2015;86:1518–1529. doi: 10.1016/j.neuron.2015.05.035. [DOI] [PubMed] [Google Scholar]
- Newman ME. Fast algorithm for detecting community structure in networks. Phys Rev E Stat Nonlin Soft Matter Phys. 2004;69:066133. doi: 10.1103/PhysRevE.69.066133. [DOI] [PubMed] [Google Scholar]
- Pletikos M, Sousa AM, Sedmak G, Meyer KA, Zhu Y, Cheng F, Li M, Kawasawa YI, Sestan N. Temporal specification and bilaterality of human neocortical topographic gene expression. Neuron. 2014;81:321–332. doi: 10.1016/j.neuron.2013.11.018. [DOI] [PMC free article] [PubMed] [Google Scholar]
- Poldrack RA, Laumann TO, Koyejo O, Gregory B, Hover A, Chen MY, Gorgolewski KJ, Luci J, Joo SJ, Boyd RL, et al. Long-term neural and physiological phenotyping of a single human. Nat Commun. 2015;6:8885. doi: 10.1038/ncomms9885. [DOI] [PMC free article] [PubMed] [Google Scholar]
- Reiss AL, Abrams MT, Singer HS, Ross JL, Denckla MB. Brain development, gender and IQ in children. A volumetric imaging study Brain. 1996;119:1763–1774. doi: 10.1093/brain/119.5.1763. [DOI] [PubMed] [Google Scholar]
- Ritchie SJ, Booth T, Valdés Hernández MD, Corley J, Maniega SM, Gow AJ, Royle NA, Pattie A, Karama S, Starr JM, et al. Beyond a bigger brain: Multivariable structural brain imaging and intelligence. Intelligence. 2015;51:47–56. doi: 10.1016/j.intell.2015.05.001. [DOI] [PMC free article] [PubMed] [Google Scholar]
- Romero-Garcia R, Atienza M, Clemmensen LH, Cantero JL. Effects of network resolution on topological properties of human neocortex. Neuroimage. 2012;59:3522–3532. doi: 10.1016/j.neuroimage.2011.10.086. [DOI] [PubMed] [Google Scholar]
- Rubinov M, Sporns O. Complex network measures of brain connectivity: uses and interpretations. Neuroimage. 2010;52:1059–1069. doi: 10.1016/j.neuroimage.2009.10.003. [DOI] [PubMed] [Google Scholar]
- Sabuncu MR, Ge T, Holmes AJ, Smoller JW, Buckner RL, Fischl B Alzheimer’s Disease Neuroimaging Initiative. Morphometricity as a measure of the neuroanatomical signature of a trait. Proc Natl Acad Sci USA. 2016;113:E5749–E5756. doi: 10.1073/pnas.1604378113. [DOI] [PMC free article] [PubMed] [Google Scholar]
- Saggar M, Hosseini SM, Bruno JL, Quintin E-M, Raman MM, Kesler SR, Reiss AL. Estimating individual contribution from group-based structural correlation networks. Neuroimage. 2015;120:274–284. doi: 10.1016/j.neuroimage.2015.07.006. [DOI] [PMC free article] [PubMed] [Google Scholar]
- Schröter M, Paulsen O, Bullmore ET. Micro-connectomics: probing the organization of neuronal networks at the cellular scale. Nat Rev Neurosci. 2017;18:131–146. doi: 10.1038/nrn.2016.182. [DOI] [PubMed] [Google Scholar]
- Ségonne F, Dale AM, Busa E, Glessner M, Salat D, Hahn HK, Fischl B. A hybrid approach to the skull stripping problem in MRI. Neuroimage. 2004;22:1060–1075. doi: 10.1016/j.neuroimage.2004.03.032. [DOI] [PubMed] [Google Scholar]
- Seidlitz J, Sponheim C, Glen D, Ye FQ, Saleem KS, Leopold DA, Ungerleider L, Messinger A. A population MRI brain template and analysis tools for the macaque. Neuroimage. 2017 doi: 10.1016/j.neuroimage.2017.04.063. [DOI] [PMC free article] [PubMed] [Google Scholar]
- Smith CL, Eppig JT. The Mammalian Phenotype Ontology as a unifying standard for experimental and high-throughput phenotyping data. Mamm Genome. 2012;23:653–668. doi: 10.1007/s00335-012-9421-3. [DOI] [PMC free article] [PubMed] [Google Scholar]
- Solari SV, Stoner R. Cognitive consilience: primate non-primary neuroanatomical circuits underlying cognition. Front Neuroanat. 2011;5:65. doi: 10.3389/fnana.2011.00065. [DOI] [PMC free article] [PubMed] [Google Scholar]
- Sporns O, Chialvo DR, Kaiser M, Hilgetag CC. Organization, development and function of complex brain networks. Trends Cogn Sci. 2004;8:418–425. doi: 10.1016/j.tics.2004.07.008. [DOI] [PubMed] [Google Scholar]
- Supek F, Bošnjak M, Škunca N, Šmuc T. REVIGO summarizes and visualizes long lists of gene ontology terms. PLoS ONE. 2011;6:e21800. doi: 10.1371/journal.pone.0021800. [DOI] [PMC free article] [PubMed] [Google Scholar]
- Taylor PA, Saad ZS. FATCAT: (an efficient) Functional and Tractographic Connectivity Analysis Toolbox. Brain Connect. 2013;3:523–535. doi: 10.1089/brain.2013.0154. [DOI] [PMC free article] [PubMed] [Google Scholar]
- Taylor PA, Cho KH, Lin CP, Biswal BB. Improving DTI tractography by including diagonal tract propagation. PLoS ONE. 2012;7:e43415. doi: 10.1371/journal.pone.0043415. [DOI] [PMC free article] [PubMed] [Google Scholar]
- Thomas C, Ye FQ, Irfanoglu MO, Modi P, Saleem KS, Leopold DA, Pierpaoli C. Anatomical accuracy of brain connections derived from diffusion MRI tractography is inherently limited. Proc Natl Acad Sci USA. 2014;111:16574–16579. doi: 10.1073/pnas.1405672111. [DOI] [PMC free article] [PubMed] [Google Scholar]
- Tijms BM, Seriès P, Willshaw DJ, Lawrie SM. Similarity-based extraction of individual networks from gray matter MRI scans. Cereb Cortex. 2012;22:1530–1541. doi: 10.1093/cercor/bhr221. [DOI] [PubMed] [Google Scholar]
- Toga AW, Thompson PM. Genetics of brain structure and intelligence. Annu Rev Neurosci. 2005;28:1–23. doi: 10.1146/annurev.neuro.28.061604.135655. [DOI] [PubMed] [Google Scholar]
- van den Heuvel MP, Sporns O. Rich-club organization of the human connectome. J Neurosci. 2011;31:15775–15786. doi: 10.1523/JNEUROSCI.3539-11.2011. [DOI] [PMC free article] [PubMed] [Google Scholar]
- van den Heuvel MP, Stam CJ, Kahn RS, Hulshoff Pol HE. Efficiency of functional brain networks and intellectual performance. J Neurosci. 2009;29:7619–7624. doi: 10.1523/JNEUROSCI.1443-09.2009. [DOI] [PMC free article] [PubMed] [Google Scholar]
- Van den Heuvel MP, de Reus MA, Feldman Barrett L, Scholtens LH, Coopmans FM, Schmidt R, Preuss TM, Rilling JK, Li L. Comparison of diffusion tractography and tract-tracing measures of connectivity strength in rhesus macaque connectome. Hum Brain Mapp. 2015;36:3064–3075. doi: 10.1002/hbm.22828. [DOI] [PMC free article] [PubMed] [Google Scholar]
- Van Essen DC, Drury HA, Dickson J, Harwell J, Hanlon D, Anderson CH. An integrated software suite for surface-based analyses of cerebral cortex. J Am Med Inform Assoc. 2001;8:443–459. doi: 10.1136/jamia.2001.0080443. [DOI] [PMC free article] [PubMed] [Google Scholar]
- Vandekar SN, Shinohara RT, Raznahan A, Hopson RD, Roalf DR, Ruparel K, Gur RC, Gur RE, Satterthwaite TD. Subject-level measurement of local cortical coupling. Neuroimage. 2016;133:88–97. doi: 10.1016/j.neuroimage.2016.03.002. [DOI] [PMC free article] [PubMed] [Google Scholar]
- Váša F, Seidlitz J, Romero-Garcia R, Whitaker KJ, Rosenthal G, Vértes PE, Shinn M, Alexander-Bloch A, Fonagy P, Dolan RJ, et al. NSPN consortium. Adolescent tuning of association cortex in human structural brain networks. Cereb Cortex. 2017:1–14. doi: 10.1093/cercor/bhx249. [DOI] [PMC free article] [PubMed] [Google Scholar]
- Vértes PE, Rittman T, Whitaker KJ, Romero-Garcia R, Váša F, Kitzbichler MG, Wagstyl K, Fonagy P, Dolan RJ, Jones PB, et al. NSPN Consortium. Gene transcription profiles associated with inter-modular hubs and connection distance in human functional magnetic resonance imaging networks. Philos Trans R Soc Lond B Biol Sci. 2016;371:371. doi: 10.1098/rstb.2015.0362. [DOI] [PMC free article] [PubMed] [Google Scholar]
- von Economo CF, Koskinas GN. Die cytoarchitektonik der hirnrinde des erwachsenen menschen. J. Springer; 1925. [Google Scholar]
- Wagstyl K, Ronan L, Goodyer IM, Fletcher PC. Cortical thickness gradients in structural hierarchies. Neuroimage. 2015;111:241–250. doi: 10.1016/j.neuroimage.2015.02.036. [DOI] [PMC free article] [PubMed] [Google Scholar]
- Walker L, Gozzi M, Lenroot R, Thurm A, Behseta B, Swedo S, Pierpaoli C. Diffusion tensor imaging in young children with autism: biological effects and potential confounds. Biol Psychiatry. 2012;72:1043–1051. doi: 10.1016/j.biopsych.2012.08.001. [DOI] [PMC free article] [PubMed] [Google Scholar]
- Wang J, Wang L, Zang Y, Yang H, Tang H, Gong Q, Chen Z, Zhu C, He Y. Parcellation-dependent small-world brain functional networks: a resting-state fMRI study. Hum Brain Mapp. 2009;30:1511–1523. doi: 10.1002/hbm.20623. [DOI] [PMC free article] [PubMed] [Google Scholar]
- Watts DJ, Strogatz SH. Collective dynamics of ‘small-world’ networks. Nature. 1998;393:440–442. doi: 10.1038/30918. [DOI] [PubMed] [Google Scholar]
- Wechsler D. Manual for the Wechsler abbreviated intelligence scale (WASI) The Psychological Corporation; 1999. [Google Scholar]
- Weiskopf N, Suckling J, Williams G, Correia MM, Inkster B, Tait R, Ooi C, Bullmore ET, Lutti A. Quantitative multi-parameter mapping of R1, PD(*), MT, and R2(*) at 3T: a multi-center validation. Front Neurosci. 2013;7:95. doi: 10.3389/fnins.2013.00095. [DOI] [PMC free article] [PubMed] [Google Scholar]
- Whitaker KJ, Vértes PE, Romero-Garcia R, Váša F, Moutoussis M, Prabhu G, Weiskopf N, Callaghan MF, Wagstyl K, Rittman T, et al. NSPN Consortium. Adolescence is associated with genomically patterned consolidation of the hubs of the human brain connectome. Proc Natl Acad Sci USA. 2016;113:9105–9110. doi: 10.1073/pnas.1601745113. [DOI] [PMC free article] [PubMed] [Google Scholar]
- Xia M, Wang J, He Y. BrainNet Viewer: a network visualization tool for human brain connectomics. PLoS ONE. 2013;8:e68910. doi: 10.1371/journal.pone.0068910. [DOI] [PMC free article] [PubMed] [Google Scholar]
- Yarkoni T, Poldrack RA, Nichols TE, Van Essen DC, Wager TD. Large-scale automated synthesis of human functional neuroimaging data. Nat Methods. 2011;8:665–670. doi: 10.1038/nmeth.1635. [DOI] [PMC free article] [PubMed] [Google Scholar]
- Young JT, Shi Y, Niethammer M, Grauer M, Coe CL, Lubach GR, Davis B, Budin F, Knickmeyer RC, Alexander AL, Styner MA. The UNC-Wisconsin Rhesus Macaque Neurodevelopment Database: A Structural MRI and DTI Database of Early Postnatal Development. Front Neurosci. 2017;11:29. doi: 10.3389/fnins.2017.00029. [DOI] [PMC free article] [PubMed] [Google Scholar]
- Zeng H, Shen EH, Hohmann JG, Oh SW, Bernard A, Royall JJ, Glattfelder KJ, Sunkin SM, Morris JA, Guillozet-Bongaarts AL, et al. Large-scale cellular-resolution gene profiling in human neocortex reveals species-specific molecular signatures. Cell. 2012;149:483–496. doi: 10.1016/j.cell.2012.02.052. [DOI] [PMC free article] [PubMed] [Google Scholar]
Associated Data
This section collects any data citations, data availability statements, or supplementary materials included in this article.