

SUMMARY
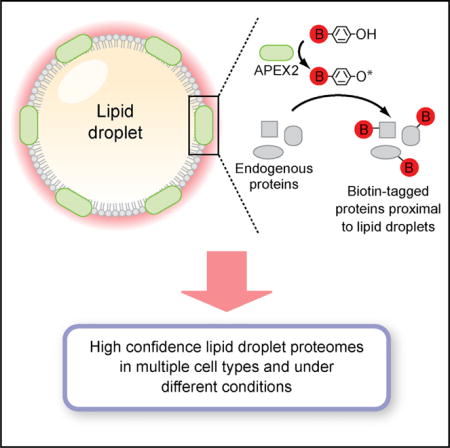
Lipid droplet (LD) functions are regulated by a complement of integral and peripheral proteins that associate with the bounding LD phospholipid monolayer. Defining the composition of the LD proteome has remained a challenge due to the presence of contaminating proteins in LD-enriched buoyant fractions. To overcome this limitation, we developed a proximity labeling strategy that exploits LD-targeted APEX2 to biotinylate LD proteins in living cells. Application of this approach to two different cell types identified the vast majority of previously validated LD proteins, excluded common contaminating proteins, and revealed new LD proteins. Moreover, quantitative analysis of LD proteome dynamics uncovered a role for endoplasmic reticulum-associated degradation in controlling the composition of the LD proteome. These data provide an important resource for future LD studies and demonstrate the utility of proximity labeling to study the regulation of LD proteomes.
Graphical abstract
INTRODUCTION
Lipid droplets (LDs) are conserved neutral lipid (e.g., triacylglycerol and sterols esters) storage organelles that are present in nearly all cells (Hashemi and Goodman, 2015; Pol et al., 2014; Walther and Farese, 2012). Although the mechanisms of LD biogenesis are not well understood, emerging data suggest that LDs are formed de novo through deposition of neutral lipids between the leaflets of the ER, followed by vectorial budding of the nascent LD from the outer leaflet of the ER into the cytoplasm (Chen and Goodman, 2017). The mature LD contains a neutral lipid core encircled by a phospholipid monolayer decorated with integral and peripheral proteins that regulate LD functions (Bersuker and Olzmann, 2017). LDs are lipid storage depots that can be rapidly accessed to provide cells with fatty acids for energy production, membrane biosynthesis, and lipid signaling (Hashemi and Goodman, 2015; Pol et al., 2014; Walther and Farese, 2012). In addition, LDs prevent lipotoxicity caused by free fatty acids and their flux into toxic lipid species (Koliwad et al., 2010; Listenberger et al., 2003; Nguyen et al., 2017; Senkal et al., 2017). The accumulation of LDs in non-adipose tissues is a pathological feature of metabolic disease such as obesity, diabetes, and atherosclerosis (Greenberg et al., 2011; Krahmer et al., 2013a). A role for LDs in the pathogenesis of metabolic diseases is further supported by the identification of mutations in LD-associated proteins that cause familial lipodystrophies and neutral lipid storage diseases (Greenberg et al., 2011; Krahmer et al., 2013a).
The hydrophobic core of LDs is an energetically unfavorable environment for hydrophilic protein domains. Thus, proteins are absent from the LD core and are embedded within the bounding phospholipid monolayer through a variety of structural motifs, including hairpin-forming hydrophobic elements, short hydrophobic regions, amphipathic helices, and lipid anchors (Bersuker and Olzmann, 2017). Proteins also associate peripherally with LDs by binding to proteins integrated into the LD membrane. LD functions are intrinsically connected to the composition of the LD proteome. For example, LD-associated acyltransferases such as GPAT4, AGPAT3, and DGAT2 regulate TAG synthesis and LD expansion during LD biogenesis (Wilfling et al., 2013). Conversely, LD-associated lipases mediate TAG catabolism and LD degradation (Lass et al., 2011). LD metabolism is also controlled by recruitment of proteins to LDs in response to changes in cellular metabolism; e.g., CCT1 (Krahmer et al., 2011), GPAT4 (Wilfling et al., 2013), and hormone-sensitive lipase (HSL) (Sztalryd et al., 2003). Defining a comprehensive inventory of LD proteins, their functions, and their mechanisms of regulation is paramount for understanding the role of LDs in health and disease. Numerous studies have attempted to catalog the LD proteome through proteomic analysis of LD-enriched, biochemically isolated buoyant fractions (Table S1). The interpretation of these studies has been complicated by the presence of proteins from co-fractionating organelles and/or membrane fragments. Common false positives include ER and mitochondrial proteins whose spatial segregation from LDs (e.g., proteins in the ER lumen) or membrane-integrated motifs (e.g., polytopic proteins integrated into ER and mitochondrial bilayer membranes) prevent them from accessing the LD monolayer (Bersuker and Olzmann, 2017). Thus, accurately defining the LD proteome and its mechanisms of regulation remains an outstanding challenge.
The limitations associated with proteomic analysis of biochemically purified organelles spurred the development of proximity labeling strategies to define organelle proteomes (Kim and Roux, 2016; Rees et al., 2015). Engineered ascorbate peroxidase (APEX), and its more active version, APEX2 (Lam et al., 2015), have been used to map the proteomes of the mitochondrial matrix (Rhee et al., 2013), intermembrane space (Hung et al., 2014), and outer membrane (Hung et al., 2017), as well as the proteomes of the ER outer membrane (Hung et al., 2017), the autophagosome lumen (Le Guerroué et al., 2017), and the primary cilium (Mick et al., 2015). In the presence of the APEX2 substrate biotin-phenol (also known as biotin-tyramide), a brief pulse of hydrogen peroxide (H2O2, <1 min) results in the APEX2-catalyzed generation of short-lived, membrane-impermeable biotin-phenoxyl radicals that form covalent adducts with electron-rich amino acids in proteins located within a 10–20 nm radius (Bendayan, 2001; Hung et al., 2014). The irreversible conjugation of biotin enables the capture of labeled proteins for proteomic analysis. Labeling of proteins is performed in intact, living cells, thus preserving organelle architecture and minimizing post-lysis artifacts.
In this study, APEX2 targeted to LDs in two cell types labeled the vast majority of previously validated LD proteins and identified proteins whose localization on LDs was not previously established. Importantly, the high-confidence LD proteomes generated using LD-targeted APEX2 are free of common contaminating proteins. We further demonstrate the utility of LD-targeted APEX2 to examine LD proteome dynamics and discover that the composition of the LD proteome is in part regulated by ER-associated degradation (ERAD), a process that mediates ubiquitin-dependent protein quality and quantity control in the early secretory pathway (Olzmann et al., 2013a; Ruggiano et al., 2014; Stevenson et al., 2016). These data provide an important LD proteomics resource (http://dropletproteome.org) and reveal a mechanism that regulates the composition of LD proteomes.
RESULTS
Generation and Characterization of LD-Targeted APEX2
To target APEX2 to the LD membrane, we generated osteosarcoma (U2OS) Flp-In cell lines that inducibly express V5-tagged APEX2 genetically fused to the C terminus of the perilipin family member PLIN2 (PLIN2-APEX2) and a mutant version of the lipase ATGL (ATGL*-APEX2) containing an inactivating S47A mutation that prevents ATGL-mediated lipolysis of LDs (Figure 1A). Cells expressing a cytosolic version of APEX2 (Cyto-APEX2) were also generated to control for non-specific labeling of cytosolic proteins by LD-targeted APEX2. Incubation of cells with doxycycline induced expression of the APEX2 fusions and the addition of biotin-phenol/H2O2 increased the levels of biotinylated proteins (Figures 1B, S1A, and S1B), indicating that the APEX2 fusion proteins are catalytically active.
Figure 1. Lipid Droplet-Targeted APEX2 Biotinylates Proteins on Lipid Droplets.
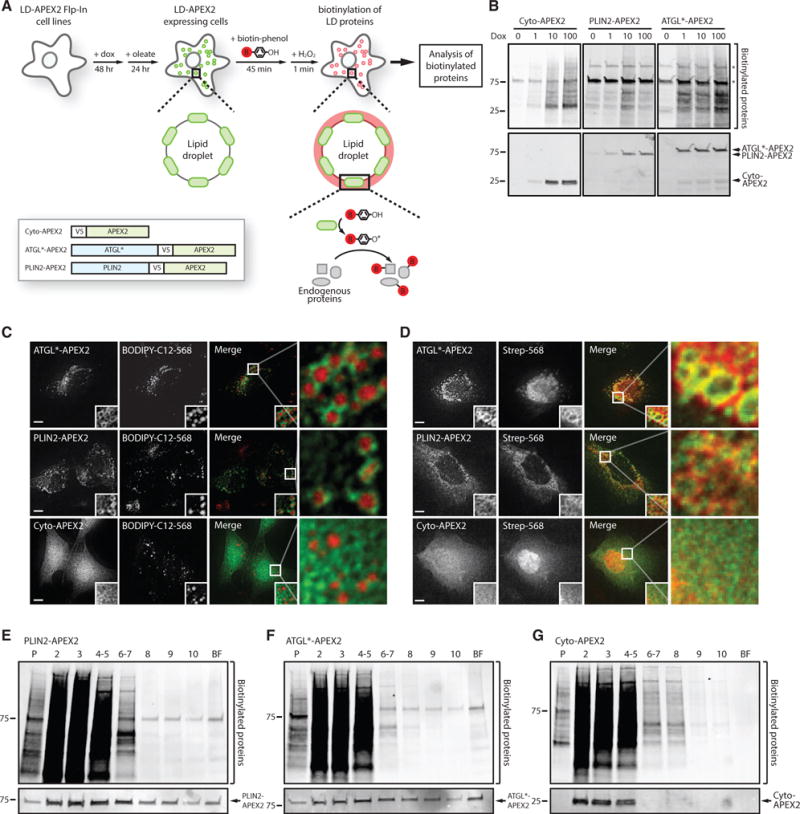
(A) Illustration of the proximity labeling strategy to identify lipid droplets (LD) proteins. Cells stably expressing ATGL*-V5-APEX2, PLIN2-V5-APEX2, or Cyto-V5-APEX2 are treated with doxycycline (dox) for 48 hr to induce expression of LD-targeted or cytosolic APEX2 proteins, and then treated with oleate for 24 hr to induce formation of LDs. LD-targeted APEX2 covalently modifies proximal LD proteins with biotin upon addition of biotin-phenol and hydrogen peroxide (H2O2). Biotinylated proteins are subsequently affinity purified and identified by mass spectrometry.
(B) U2OS cells stably expressing cytosolic or LD-targeted APEX2 were treated with 0–100 ng/mL dox for 48 hr and biotin-phenol/H2O2. Total proteins from lysed cells were separated by SDS-PAGE and analyzed by blotting with fluorescently labeled streptavidin and antibodies against the V5 epitope tag.
(C) U2OS cells stably expressing cytosolic or LD-targeted APEX2 were treated with 200 μM oleate and 1 μM BODIPY-C12-568 for 24 hr to induce formation of BODIPY-C12-568-positive LDs (red). Cells were imaged by fluorescence microscopy and the APEX2 fusion proteins were detected using antibodies against the V5 epitope tag (green). Magnified insets show cellular regions with LDs. Scale bars represent 10 μm.
(D) U2OS cells stably expressing cytosolic or LD-targeted APEX2 incubated with 200 μM oleate for 24 hr were treated with biotin-phenol/H2O2 and imaged by fluorescence microscopy using fluorescent streptavidin-568 (red) and antibodies against the V5-epitope tag (green). Scale bars represent 10 μm.
(E–G) Lysates from U2OS cells stably expressing LD-targeted or cytosolic APEX2 were fractionated by sucrose gradient centrifugation. Proteins in individual fractions were separated by SDS-PAGE and analyzed by blotting with fluorescent streptavidin-568 and antibodies against the V5 epitope tag.
To confirm that the LD-targeted APEX2 proteins are recruited to LDs, the localization of V5-APEX2 fusions was determined after induction of LD biogenesis with oleate. Both PLIN2-APEX2 and ATGL*-APEX2 decorated the periphery of LDs labeled by the fluorescent fatty acid BODIPY-C12-568, indicating that APEX2 is recruited to the LD monolayer (Figure 1C). In contrast, Cyto-APEX2 was diffusely distributed throughout the cytoplasm and nucleoplasm (Figure 1C). Fluorescently labeled streptavidin stained the periphery of LDs in PLIN2-APEX2 and ATGL*-APEX2 cells treated with biotin-phenol/H2O2 (Figure 1D), but not in the Cyto-APEX2 cells, indicating that LD-targeted APEX2 biotinylates proteins on the LD surface. To further verify that LD-targeted APEX2 biotinylates proteins on LDs, we analyzed the distribution of biotinylated proteins in LD-enriched buoyant fractions isolated by sucrose gradient centrifugation (Figures 1E–1G). PLIN2-APEX2 and ATGL*-APEX2 were not exclusively present in the buoyant fraction and, like Cyto-APEX2, biotinylated proteins in the cytosolic fractions (Figures 1E–1G, fractions 2–5), and, to a lesser extent, proteins in the membrane fraction (Figures 1E–1G, fraction P). Importantly, biotinylated proteins were only observed in LD-enriched buoyant fractions isolated from the PLIN2-APEX2 and ATGL*-APEX2 cells (Figures 1E–1G, fraction BF). Together, these results demonstrate that LD-targeted APEX2 biotinylates proteins on LDs.
Identification of a High-Confidence LD Proteome
Non-specific labeling of cytosolic proteins has been reported in previous proteomics studies of organelles in which APEX2 was exposed to the cytosol (Hung et al., 2014, 2017). This limitation was addressed by using ratiometric stable isotope labeling with amino acids in cell culture (SILAC) to subtract the cytosolic background (Hung et al., 2014, 2017). However, this approach selects against proteins that localize to more than one cellular compartment. Given that several known LD proteins localize to LDs/ER (e.g., UBXD8, GPAT4, and AUP1) and LDs/cytosol (e.g., VCP, UBE2G2, and HSL), we chose to use subcellular fractionation in lieu of SILAC to separate the biotinylated proteins on LDs from those present in the cytosol and on other organelles (Figure 2A). Liquid chromatography-tandem mass spectrometry was used to determine the identity and abundance (i.e., normalized total spectral counts) of proteins isolated by affinity purification and of proteins in the total buoyant fraction. The proteins identified in the PLIN2-APEX2 samples (152 proteins) and ATGL*-APEX2 samples (192 proteins) represented a small subset of the proteins identified in the total buoyant fraction (1,227 proteins) (Figures 2B and 2C; Table S2), but the spectral counts from these two samples were highly correlated (R2 = 0.76991) (Figure 2D). Fifty-two proteins were also identified in the Cyto-APEX2 samples, accounting for non-specific labeling by LD-targeted APEX2 (Figure 2B; Table S2).
Figure 2. Proteomic Analysis of Biotinylated LD Proteins.

(A) Illustration depicting the two-step strategy to identify biotinylated LD proteins. Following the induction of biotinylation in cells stably expressing cytosolic or LD-targeted APEX2, LD-enriched buoyant fractions are isolated by sucrose gradient centrifugation. Biotinylated proteins are then affinity purified from buoyant fractions using streptavidin-conjugated beads and identified by mass spectrometry.
(B) Proteins identified in total buoyant fraction and in streptavidin affinity purifications from the indicated APEX2 cell lines were ranked by descending LD confidence score (CSN). Data from two independent experimental replicates for each sample are shown. The intensity of the blue color represents the CSN value and the intensity of the red color represents the normalized spectral abundance factor (NSAF) value. The heatmap scale is linear. A black box indicates if a protein was previously validated as an LD protein by microscopy. The boxed inset shows the high-confidence LD proteins (CSN > 1).
(C) Venn diagram illustrating the overlap between proteomes identified in the LD-targeted APEX2 cell lines and in the buoyant fraction.
(D) Comparison of average spectral abundance factors (SAF) for proteins identified in the affinity purifications from ATGL*-V5-APEX2 and PLIN2-V5-APEX2 cells. Each symbol corresponds to an LD protein identified in both cell lines. The R2 coefficient for the linear regression line is indicated.
(E–G) The average SAF for proteins identified in the affinity purifications from the ATGL*-V5-APEX2 (E) or PLIN2-V5-APEX2 (F) cells or in the total buoyant fractions isolated from parental cells (G).
(H) Selected enriched gene ontology (GO)-term categories for high-confidence LD proteins.
See also Figures S1 and S2; Tables S2 and S3.
The buoyant fraction contained 44 proteins that were previously observed to localize to LDs by microscopy analyses of endogenous or tagged proteins (Figure 2B; Table S2), all of which were labeled by at least one of the LD-targeted APEX2 proteins (Figures 2B, S2A, and S2B; Table S2). The LD protein SPG20 (Eastman et al., 2009) was labeled by APEX2, but was not identified in the buoyant fraction (Figure S2A; Table S2), suggesting that LD-targeted APEX2 can identify low-abundance LD proteins. The relative abundance of biotinylated proteins isolated from the APEX2 lines was used to compute a confidence score (CS) for each identified protein. The CS accounts for protein abundance, identification in replicate experiments, labeling by both LD-targeted APEX2 proteins, and specificity (i.e., absence or low abundance in Cyto-APEX2 control samples) (see the STAR Methods and Figure S1C for details). To define a high-confidence LD proteome, we set a threshold CS value that included >85% of previously validated LD proteins, yielding a high-confidence proteome consisting of 153 proteins (Figure 2B; Table S2). The abundant proteins in the buoyant fraction that were not labeled by PLIN2-APEX2 or ATGL*-APEX2 included many common contaminants identified in previous proteomic studies, including ER luminal proteins (disulfide isomerases PDIA1, PDIA3, and PDIA6), chaperones (GRP78, GRP94, and SerpinA1), and polytopic ER membrane proteins (CALR, CANX, and VAPA) (Figures 2E–2G and S2C; Table S2). Thus, the proximity labeling approach discriminates between proteins on LDs and contaminating proteins in the buoyant fraction.
Gene ontology-term analysis of high-confidence LD proteins showed enrichment of pathways that control TAG metabolism, lipid biosynthesis, and sterol biosynthesis (Figure 2H; Table S3). Other pathways included protein and vesicle-mediated transport, small GTPase signaling, oxidation-reduction processes, and membrane organization (Figure 2H; Table S3). To visualize functional relationships between LD proteins, high-confidence proteins were grouped into modules, and physical interactions between proteins were retrieved from the Bio-GRID database (Figure 3). The high-confidence LD proteome contained a group of previously validated LD regulatory scaffold proteins and TAG metabolism enzymes, including the perilipin family members (PLIN2, PLIN3, and PLIN4), acyl-coenzyme A (acyl-CoA) synthetases (ACSL3 and ACSL4), glycerol-3-phosphate acyltransferases (GPAT3 and GPAT4), lipases (PNPLA2, PNPLA3, and LIPE), and the PNPLA2 lipase regulator (ABHD5, also known as CGI-58). Another group within the metabolism-related module contained several enzymes from the cholesterol biosynthesis (SQLE, LSS, and NSDHL) and retinol metabolism (RDH10 and RDH11) pathways. Proteins that function in oxidation-reduction reactions (AIFM2, CYB5R3, HSDL1, and DHRS1) were also identified, the majority of which have not been validated as LD proteins. Surprisingly, half of all human Rab GTPases were present within the vesicular trafficking module, several of which (RAB1A, RAB7A, RAB8A, and RAB11B) were previously demonstrated to have functional roles on LDs. This result suggests that the large number of RAB GTPases identified in previous LD proteomics studies (Table S1 and Bartz et al., 2007; Liu et al., 2004, 2007) are present on LDs. Another prominent module has functions related to the ubiquitin system and several of these proteins (FAF2, UBXN4, AUP1, UBE2G2, and VCP) form protein complexes on the ER membrane that function in degrading luminal and membrane ER proteins through the ERAD pathway (Christianson et al., 2011; Stevenson et al., 2016). The identification of UBE2G2 and VCP, which associate with LDs by binding to their membrane-integrated adaptors AUP1 (Klemm et al., 2011; Spandl et al., 2011) and UBXD8 (Olzmann et al., 2013b; Suzuki et al., 2012), respectively, demonstrates that LD-targeted APEX2 can identify peripherally associated LD proteins.
Figure 3. Illustration of the High-Confidence LD Proteome.
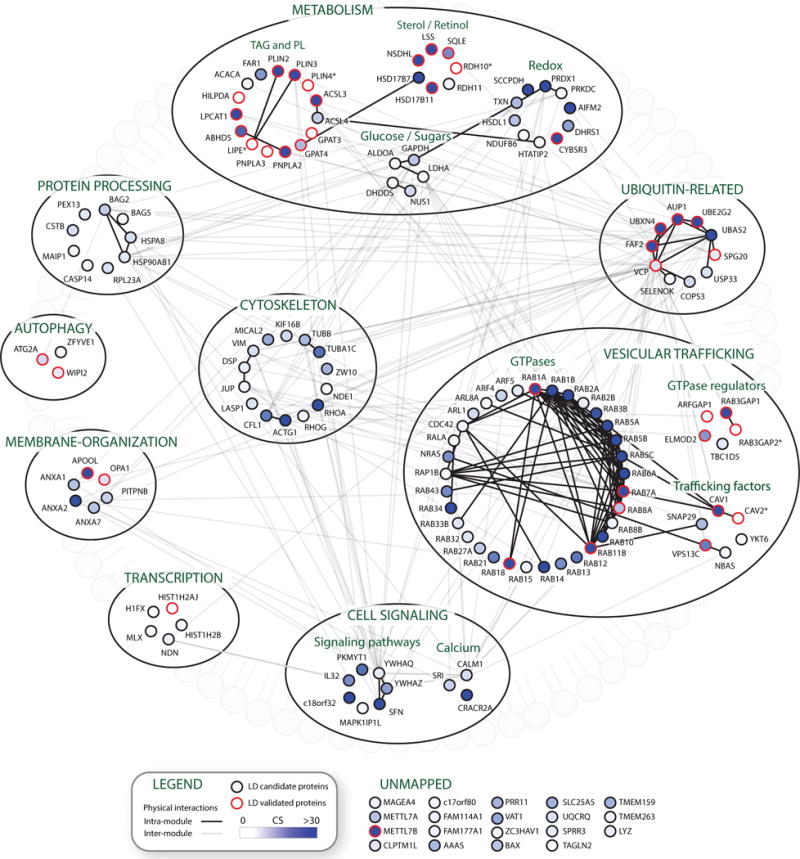
High-confidence LD proteins are grouped into functional modules based on GO analysis and UNIPROT functional annotations. Solid lines represent physical interactions within functional modules and transparent lines represent interactions between proteins in distinct modules, as annotated in Bio-GRID. The intensity of the blue color in a node indicates the confidence score. Nodes outlined in red represent proteins that have been previously validated to localize to LDs by microscopy.
To examine if LD-targeted APEX2 identified new LD proteins, we fused GFP to the C terminus of 13 high-confidence proteins that have not been shown to localize to LDs. As expected, cytosolic (GFP) and ER-targeted (Sec61β-GFP) proteins were not recruited to LDs (Figure 4). In contrast, we found that 11/13 GFP-tagged high-confidence proteins decorated the periphery of LDs (Figure 4). Some of the fusion proteins were also present in the cytosol (AIFM2-GFP and PITPNB-GFP), reticular structures resembling ER (RDH11-GFP), or elongated perinuclear structures resembling Golgi (RAB1B-GFP) (Figure 4), indicating that our approach identifies LD proteins present in more than one cellular compartment. For the proteins that did not localize to LDs (ANXA7-GFP and CRACR2A-GFP), we cannot exclude the possibility that their localization on LDs was masked by high expression in the cytosol or disrupted by fusion to GFP. We also noted that the overexpression of several proteins (c18orf32-GFP, LSS-GFP, HSD17B7-GFP, SCCPDH-GFP, and ZFYVE1-GFP) resulted in increased LD abundance and/or clustering (Figure 4), but the functional role of these proteins on LDs will require further investigation. These results indicate that LD-targeted APEX2 identifies new LD proteins that have potentially important functions in LD biology.
Figure 4. Validation of High-Confidence LD Proteins.
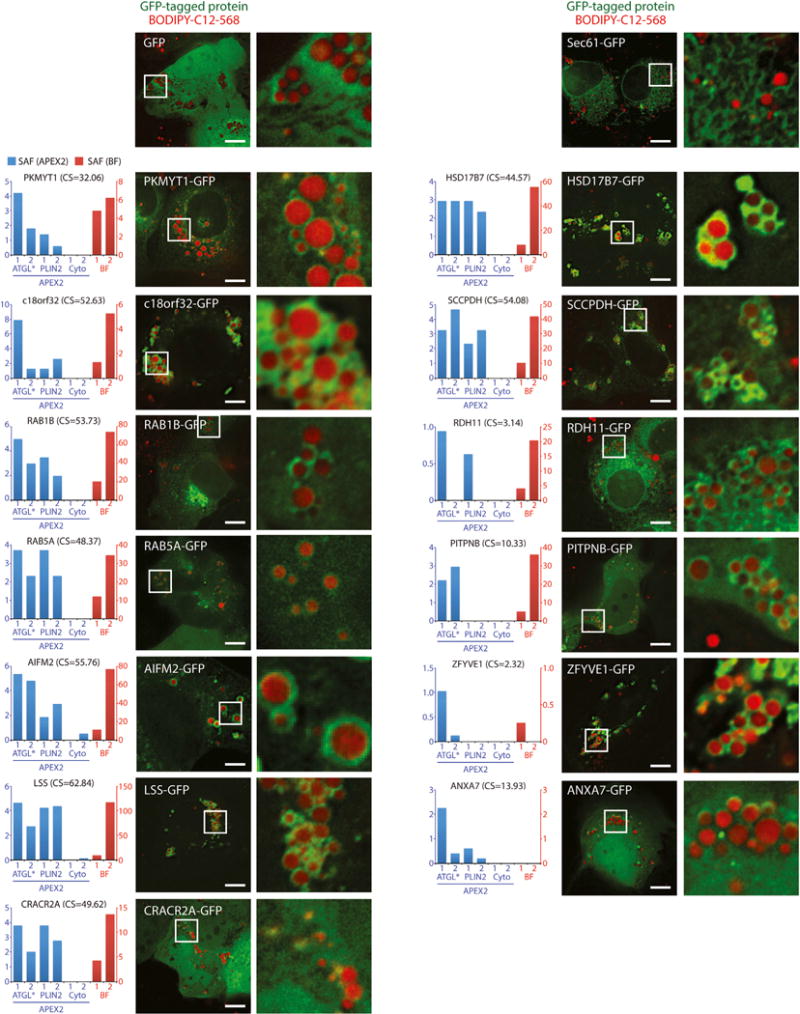
Cells transiently transfected with selected high-confidence LD proteins C-terminally fused to GFP were treated with 200 μM oleate and 1 μM BODIPY-C12-568 for 24 hr and imaged using fluorescence microscopy. Magnified insets show regions with LDs. The graphs to the left show the SAF in affinity purifications from APEX2 cell lines (blue) and in the buoyant fraction (BF) (red). Control cells were transfected with GFP or Sec61β-mCherry to label the cytosol and ER, respectively. Scale bars represent 10 μm. CS, confidence score.
An Integrated U2OS and Huh7 High-Confidence LD Proteome
LDs in different cell types have unique attributes (e.g., differences in size, regulatory mechanisms, or lipid composition) and express distinct LD proteins that specify these features. Liver is a metabolic organ that mediates the packaging and secretion of very low density lipoproteins, de novo lipogenesis, and recycling of lipoprotein remnants (Gluchowski et al., 2017). The aberrant accumulation of LDs in the liver, or hepatic steatosis, is a feature of many metabolic diseases and a pathogenic hallmark of infection by the hepatitis C virus (Gluchowski et al., 2017). Thus, the differences between U2OS and liver cells, as well as the physiological importance of LDs in liver function, led us to investigate the LD proteome in a liver-derived cell model.
To map the liver LD proteome, we introduced the APEX2 proximity biotinylation system into the Huh7 human hepatocellular carcinoma cell line (Figures S3A and S3B), which has been extensively utilized to study hepatocyte function. LDs were more abundant in Huh7 than in U2OS cells, and exhibited a larger heterogeneity in size (Figures 1C, S3C, and S3D). Similarly to LD-targeted APEX2 in U2OS cells, PLIN2-APEX2 and ATGL*-APEX2, but not Cyto-APEX2, localized to LDs and biotinylated proteins in buoyant fractions (Figures S3C–S3G). Proteomic analyses identified 197 biotinylated proteins purified from PLIN2-APEX2 and 124 biotinylated proteins purified from ATGL*-APEX2 cells among 624 total proteins in the Huh7 buoyant fraction (Figures S4A–S4F; Table S4). Despite the lower number of high-confidence LD proteins identified in Huh7 cells, all 37 previously validated proteins present in the Huh7 buoyant fraction were labeled by at least one version of LD-targeted APEX2 (Figures S5A and S5B; Table S4). In addition, several validated LD proteins (e.g., CIDEB and MGLL) that were not identified in the buoyant fraction were labeled by LD-targeted APEX2 (Figures S5A and S5B; Table S4), further supporting the ability of LD-targeted APEX2 to identify low-abundance LD proteins, while avoiding abundant contaminants (e.g., CALR, CANX, and HSPA5) (Figures S4D–S4F and S5C; Table S4).
When comparing the high-confidence LD proteomes from U2OS and Huh7 cells, we found 63 shared high-confidence LD proteins (Figures S6A and S6B). These proteins included 9 of the 11 new proteins validated in U2OS cells (Figures 4 and 5). CIDEB, which belongs to a family of CIDE proteins that mediate LD fusion (Gao et al., 2017), was only identified in Huh7 cells, consistent with the larger LDs in this cell line. The absence of other CIDE proteins (CIDEA and CIDEC) indicates that CIDEB is the dominant member of this protein family in Huh7 cells and is consistent with the expression pattern of CIDE family genes in mouse tissues (Figure S6C). Interestingly, we identified SQSTM1 (also known as p62) as a Huh7-specific LD protein. SQSTM1 mediates selective autophagy by binding ubiquitin-conjugated cargo through its ubiquitin-associated domain and autophagosome membranes conjugated to LC3 through its LC3-interacting region motifs (Johansen and Lamark, 2011), thus physically linking cargo to autophagic machinery. Since LDs in Huh7 cells and mouse liver are degraded by a selective autophagy pathway known as lipophagy (Li et al., 2016; Singh et al., 2009), our data raise the possibility that SQSTM1 may be an adaptor that targets LDs for degradation by lipophagy.
Figure 5. Combined High-Confidence LD Proteomes from U2OS and Huh7 Cells.
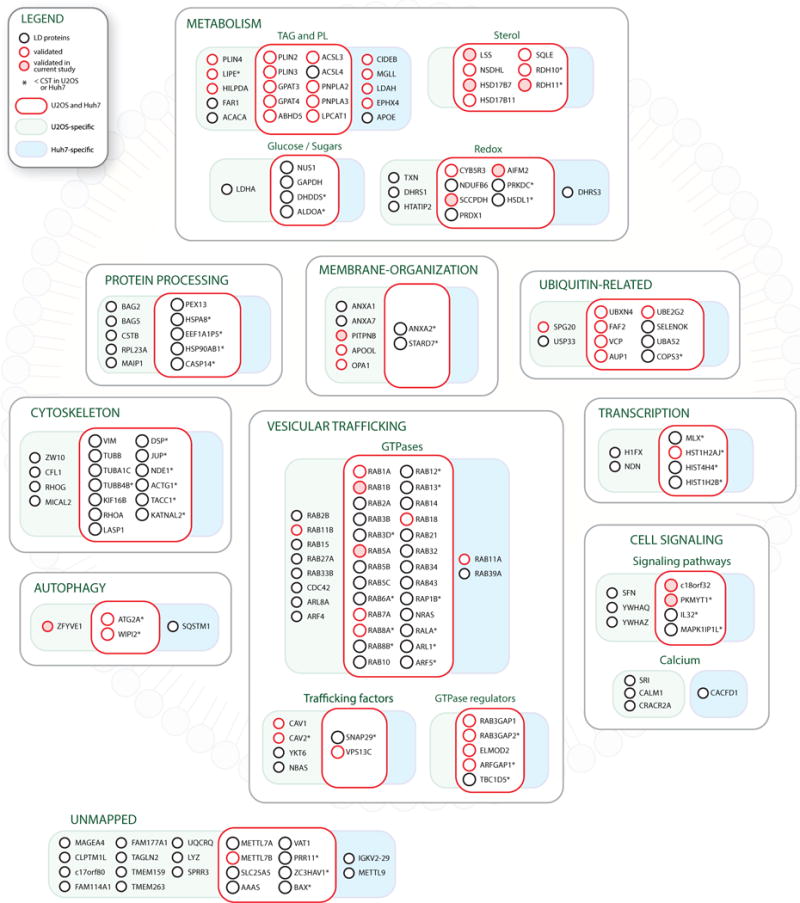
Composite illustration of high-confidence LD proteins identified in U2OS and Huh7 cells. Proteins are grouped into functional modules. Boxes indicate U2OS-specific proteins (green), Huh7-specific proteins (blue), and shared proteins (red). Microscopic validation of individual nodes at LDs in previous studies (red circle) and in this study (shaded red circle) is also indicated. Asterisk indicates that the protein was identified, but was below the high-confidence threshold (CSN < 1) in one or both cell lines.
See also Figures S3–S6; Tables S2, S3, and S4.
Quantitative Analysis of LD Proteome Composition Following Inhibition of VCP
The temporal resolution afforded by the APEX2 proximity labeling system could enable the study of LD proteome remodeling by allowing capture of “snapshots” of the LD proteome under different conditions, such as after pharmacological treatments or changes in metabolic state. To examine this possibility, we employed LD-targeted APEX2 to investigate the role of ubiquitin-dependent protein degradation pathways in regulating the composition of the LD proteome.
Several proteins in the ubiquitin module (Figure 5) are present in macromolecular ER ubiquitination complexes that mediate the degradation of ER proteins in the ERAD pathway (Christianson et al., 2011). These components could regulate the composition of the LD proteome through two non-mutually exclusive mechanisms: (1) through the degradation of LD proteins by canonical ERAD pathways as they transit between the ER and LDs, or (2) through the degradation of LD proteins by ubiquitination machinery on LDs. We anticipated that degradation of LD proteins through either mechanism would require the AAA ATPase VCP, which in ERAD is essential for the extraction of ubiquitinated proteins from the ER membrane for degradation by cytosolic 26S proteasomes (Meyer et al., 2012; Olzmann et al., 2013a). To investigate if VCP regulates the stability of LD proteins, and thus the steady-state levels of proteins on LDs, we performed ratiometric SILAC analysis of biotinylated LD proteins purified from ATGL*-APEX2 control cells (light) and cells treated with the VCP inhibitor CB5083 (heavy) (Anderson et al., 2015; To et al., 2017) (Figure 6A). While the levels of the majority of high-confidence proteins were unaffected by CB5083 treatment, levels of c18orf32 increased by ~1.8-fold (Figure 6B; Table S5).
Figure 6. VCP Regulates the Levels of c18orf32 on LDs.
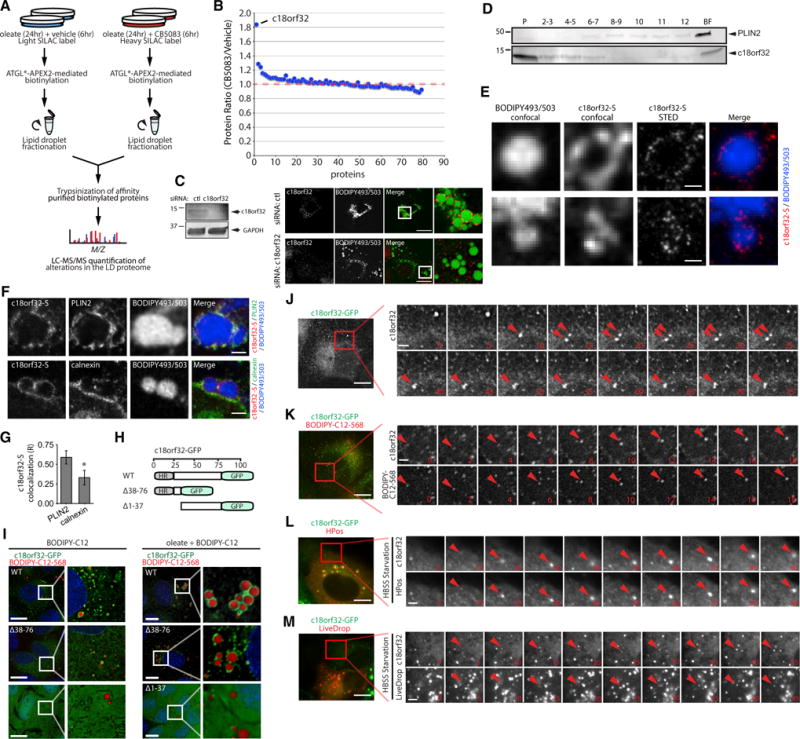
(A) SILAC strategy to identify VCP-regulated LD proteins. ATGL*-V5-APEX2 cells were cultured in light or heavy lysine-containing SILAC medium and incubated with 200 μM oleate for 24 hr. U2OS cells were subsequently treated with vehicle (light) or 5 μM VCP inhibitor CB5083 (heavy) for 6 hr. Cells were incubated with biotin-phenol/H2O2, biotinylated buoyant fractions from light- and heavy-labeled cells were combined, and light/heavy-labeled biotinylated proteins were affinity purified for identification by mass spectrometry.
(B) The heavy-to-light fold change ratio of biotinylated proteins purified from cells treated with CB5083 and vehicle as depicted in (A).
(C) U2OS cells were transfected with control or c18orf32-targeting small interfering RNA (siRNA) for 48 hr, incubated with 200 μM oleate for 24 hr, and analyzed by SDS-PAGE or fluorescence microscopy using antibodies against c18orf32 (red) and the neutral lipid dye BODIPY 493/503 (green) to stain LDs. Magnified insets show cellular regions with LDs. Scale bars represent 10 μm.
(D) U2OS cells were incubated with 200 μM oleate for 24 hr. Cellular homogenates were fractionated by sucrose gradient centrifugation, and proteins in individual fractions were separated by SDS-PAGE and immunoblotted with antibodies against c18orf32 and PLIN2. P, pellet; BF, buoyant fraction.
(E) U2OS cells stably expressing c18orf32-S were incubated with 200 μM oleate and fixed cells were sequentially imaged by confocal and STED microscopy using the neutral lipid dye BODIPY 493/503 and antibody against S-tag. In both examples shown, LDs were only visualized using confocal microscopy. Scale bars represent 500 nm.
(F) U2OS cells stably expressing c18orf32-S were incubated with 200 μM oleate and fixed cells were sequentially imaged by confocal microscopy to visualize BODIPY 493/503-positive LDs and STED microscopy to visualize c18orf32-S and PLIN2 or calnexin. Scale bars represent 1 μm.
(G) The degree of colocalization between c18orf32-S and PLIN2 or calnexin in (F) was assessed by recording the Pearson’s correlation coefficient across multiple regions (n = 16) per condition. Values represent mean ± SD. Asterisk indicates a significant difference (*p < 0.001).
(H) Illustration of c18orf32-GFP truncation mutants lacking the N-terminal hydrophobic region (HR) (Δ1-37) or the C-terminal region (Δ38-76).
(I) U2OS cells stably expressing full-length c18orf32-GFP or truncation mutants c18orf32(Δ38-76)-GFP and c18orf32(Δ1-37)-GFP were treated with dox for 48 hr and incubated in the presence and absence of 200 μM oleate supplemented with 1 μM BODIPY-C12-568 for 24 hr. Cells incubated in the absence of oleate were treated with 0.5 μM BODIPY-C12-568 to label LDs. Live cells were imaged by fluorescence microscopy. Magnified insets show cellular regions with LDs. Scale bars represent 10 μm.
(J) U2OS cells stably expressing c18orf32-GFP were treated with dox for 48 hr and imaged by time-lapse fluorescence microscopy. C18orf32-GFP puncta are indicated by arrowheads. Time stamp indicates elapsed time in seconds after start of imaging. Scale bars represent 2.5 μm in the montage.
(K) U2OS cells stably expressing c18orf32-GFP were treated with dox for 48 hr and subsequently treated with 1 μM BODIPY-C12-568. Colocalized c18orf32-GFP and BODIPY-C12-568 puncta are indicated by arrowheads. Time stamp indicates elapsed time in minutes after addition of BODIPY-C12-568. Scale bars represent 2.5 μm in the montage.
(L and M) U2OS cells stably expressing c18orf32-GFP were transiently transfected with HPos-mOrange or LiveDrop for 48 hr and treated with dox for 24 hr. Cells were subsequently incubated in HBSS medium and imaged by time-lapse fluorescence microscopy. Colocalized c18orf32-GFP and HPos-mOrange (L) or LiveDrop (M) puncta are indicated by arrowheads. Time stamp indicates time elapsed in minutes after addition of HBSS. Scale bars represent 2.5 μm in the montage.
C18orf32 is an uncharacterized 76 amino acid protein that contains a predicted hydrophobic N-terminal domain and a C-terminal unstructured region. C18orf32 was identified as a high-confidence LD protein in both U2OS and Huh7 cells (Figure 5). In the absence of oleate, GFP-tagged c18orf32 was present in the ER (Figure S7A). Addition of oleate caused a fraction of c18orf32-GFP to redistribute to LDs (Figures S7A and S7E). To confirm the localization of c18orf32 on LDs, we performed immunofluorescence microscopy using a polyclonal antibody that recognizes endogenous c18orf32. Endogenous c18orf32 was distributed in puncta most apparent at the periphery of LD clusters, confirming that the localization of c18orf32 at LDs is not an artifact of overexpression (Figure 6C). As expected, small interfering RNA-mediated depletion of c18orf32 abolished the LD-localized puncta (Figure 6C). Consistent with the localization of c18orf32 on LDs and the ER, immunoblot analysis of subcellular fractions identified a single major band that resolved at 12 kDa in size, and was present only in the pellet and buoyant ~fractions (Figure 6D). Genetic deletion of c18orf32 using CRISPR/Cas9 resulted in the disappearance of the 12 kDa immunoreactive band, indicating that the antibody recognizes c18orf32 (Figure S7B). To address the possibility that localization of c18orf32 at the periphery of LDs was due to wrapping of c18orf32-positive ER around LDs, we generated cell lines expressing an S-tagged version of c18orf32 (c18orf32-S) and determined the extent of colocalization of c18orf32-S with the LD protein PLIN2 and the ER protein calnexin. C18orf32-S exhibited strong colocalization with PLIN2 (Figure S7C), but not calnexin (Figure S7D), around LDs. In addition, we employed stimulated emission depletion (STED) microscopy to generate high resolution (~40 nm) images of c18orf32-S (Figure 6E). C18orf32-S formed discrete puncta that decorated the LD periphery (Figure 6E) and exhibited more colocalization with PLIN2 than with calnexin around LDs (Figures 6F and 6G). Although we observed calnexin-positive ER juxtaposed to LDs, STED imaging indicated that c18orf32-S and calnexin signals are discrete (Figure 6F).
To determine which region of c18orf32 targets the protein to LDs, we generated GFP fusions of c18orf32 mutants lacking the hydrophobic N-terminal region (Δ1-37) or the C-terminal region (Δ38-76) (Figure 6H). Similar to full-length c18orf32-GFP, c18orf32(Δ38-76)-GFP exhibited a reticular and punctate distribution in the ER under basal conditions and localized to LDs in oleate-treated cells (Figure 6I). In contrast, the c18orf32(Δ1-37)-GFP mutant was diffusely distributed throughout the cell and was absent from LDs (Figure 6I). These data indicate that the N-terminal hydrophobic domain is necessary and sufficient for recruitment of c18orf32 to ER and LDs.
We noted that c18orf32-GFP was also present in highly dynamic puncta in proximity to reticular ER (Figures 6I and 6J). These puncta were reminiscent of nascent LDs that bud from the ER during LD biogenesis (Kassan et al., 2013; Wang et al., 2016). In agreement with this possibility, time-lapse microscopy revealed that c18orf32-GFP puncta colocalized with emerging BODIPY-C12-568-positive LDs (Figure 6K). We further explored if c18orf32-GFP is recruited to nascent LDs by co-expressing markers of early LDs. HPos-mOrange, a fusion of mOrange to the hydrophobic region of the LD protein ALDI and the positively charged region of Caveolin-1, is recruited into puncta in the ER that mark sites of LD biogenesis in cells starved in Hank’s buffered salt solution (HBSS) (Kassan et al., 2013). C18or32-GFP completely colocalized with HPos-mOrange and was recruited into HBSS-induced, HPos-positive puncta (Figure 6L). Under these conditions, c18orf32-GFP also exhibited partial colocalization with puncta marked by LiveDrop (Figure 6M), a fusion of mCherry to the hairpin region of GPAT4 (Wang et al., 2016). Together, these findings indicate that c18orf32 is an ER protein that traffics to emerging LDs.
c18orf32 Is Degraded by a gp78- and derlin-1-Dependent ERAD Pathway
Our proteomics results (Figure 6B; Table S5) suggest that VCP regulates the levels of c18orf32 on LDs. To determine if VCP regulates the stability of c18orf32, we measured the degradation kinetics of c18orf32 after inhibiting protein synthesis with the translation inhibitor emetine. The levels of c18orf32 decreased by ~50% after 6 hr of emetine treatment (Figures 7A–7C), indicating that a fraction of c18orf32 is constitutively degraded. Addition of CB5083 blocked the degradation of c18orf32, similar to its effect on the degradation of the ERAD substrate, core-glycosylated CD147(C.G.) (To et al., 2017; Tyler et al., 2012) (Figures 7A–7C). Furthermore, even a modest depletion of VCP by RNAi markedly increased the steady-state levels and stability of c18orf32 (Figure 7E). To assess if the degradation of c18orf32 requires ubiquitin conjugation and proteolysis by the 26S proteasome, we measured the degradation kinetics of c18orf32 in cells treated with MLN-7243, an inhibitor of the E1 ubiquitin-activating enzyme, and with MG132, an inhibitor of the 26S proteasome. Treatment with MLN-7243 or MG132 prevented the degradation of c18orf32 to the same extent as CB5083 (Figures 7A–7C). LD induction with oleate did not affect the kinetics of c18orf32 degradation (Figures 7A and 7D), indicating that LD induction is not sufficient to stabilize c18orf32. However, since a significant fraction of c18rf32 remains in the ER in oleate-treated cells (Figures 6D, 6I, and S7D), it is possible that the smaller, LD-associated pool of c18orf32 is stabilized under these conditions. Thus, c18orf32 is constitutively degraded through a pathway that requires ubiquitin conjugation, VCP, and the proteasome.
Figure 7. C18orf32 Is Degraded by a gp78 and derlin-1-dependent ERAD Pathway.
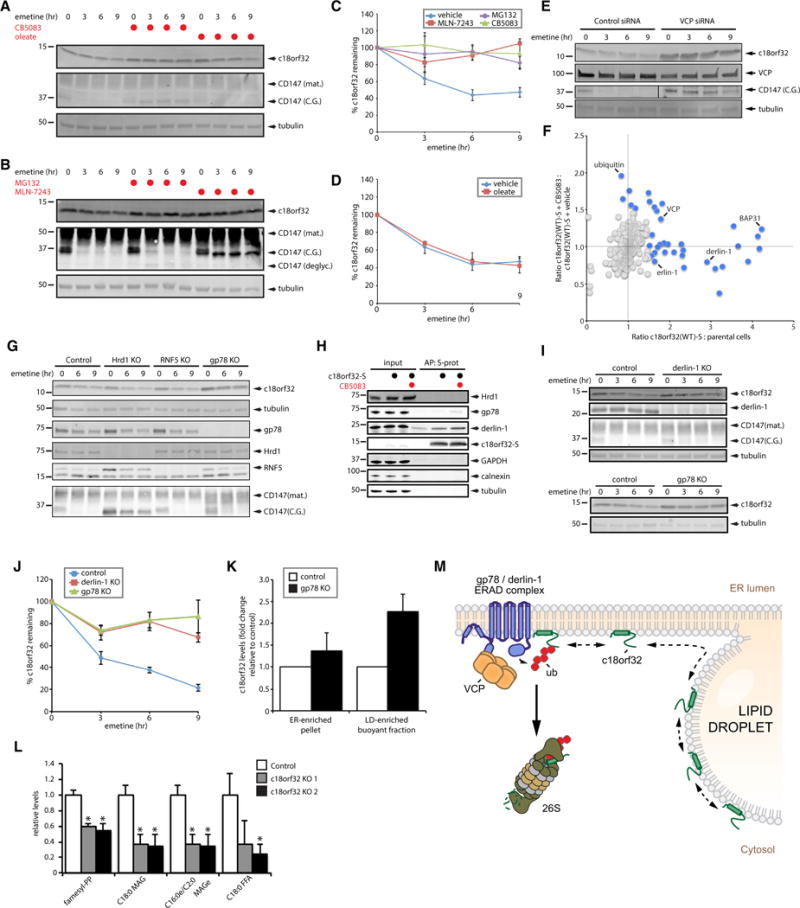
(A) U2OS cells were treated with 75 μM emetine and vehicle or 5 μM CB5083 as indicated. A separate series of cells was pretreated with 200 μM oleate for 24 hr prior to addition of emetine. Proteins from cell lysates were separated by SDS-PAGE and analyzed by blotting with antibodies against c18orf32, CD147, and tubulin. C.G., core-glycosylated; mat., mature.
(B) U2OS cells were treated with 75 μM emetine and vehicle, 10 μM MG132, or 10 μM MLN-7243 as indicated. Proteins from cell lysates were separated by SDS-PAGE and analyzed by blotting with antibodies against c18orf32, CD147, and tubulin. C.G., core-glycosylated; deglyc., deglycosylated; mat., mature.
(C and D) The percentage of c18orf32 remaining (relative to time = 0 hr) was quantified by densitometry analysis of immunoblots in (A and B). Data points represent mean ± SEM (n ≥ 3 independent experiments).
(E) U2OS cells were transfected with scrambled control siRNA or siRNA targeting VCP for 72 hr and subsequently treated with emetine as indicated. Proteins from cell lysates were separated by SDS-PAGE and analyzed by blotting with antibodies against c18orf32, VCP, tubulin, and CD147.
(F) U2OS cells stably expressing c18orf32(WT)-S or parental cells were cultured in SILAC medium and treated with dox for 48 hr. c18orf32(WT)-S cells were subsequently treated with vehicle or 5 μM CB5083 for 6 hr. Proteins from cell lysates were combined in equal ratios, c18orf32(WT)-S was affinity purified using S-protein-conjugated agarose beads, and interacting proteins were identified by mass spectrometry. For each identified protein, the x axis represents fold change abundance ratio of proteins associated with c18orf32(WT)-S relative to parental cells, and the y axis represent fold change abundance ratio of proteins associated with c18orf32(WT)-S in cells treated with CB5083 relative to cells treated with vehicle. Background proteins are indicated as gray data points and interactors (above a SILAC ratio of 1.5) are indicated as blue data points.
(G) Control HEK293 cells or cells lacking Hrd1, RNF5, or gp78 were treated with emetine as indicated. Proteins from whole-cell lysates were separated by SDS-PAGE and analyzed by blotting with antibodies against c18orf32, tubulin, CD147, Hrd1, RNF5, and gp78.
(H) Control cells or U2OS cells stably expressing c18orf32-S were treated with vehicle or 5 μM CB5083 for 6 hr as indicated. C18orf32-S was affinity purified, and the cell lysates (input, 0.2%, w/w) and eluted proteins (AP) were analyzed by immunoblotting with antibodies against gp78, derlin-1, Hrd1, and c18orf32-S. Antibodies against GAPDH, calnexin, and tubulin were included to control for loading and affinity purification.
(I) Control HEK293 cells or cells lacking derlin-1 (upper panel) or gp78 (lower panel) were treated with emetine as indicated. Proteins from whole-cell lysates were separated by SDS-PAGE and analyzed by immunoblotting with antibodies against c18orf32, derlin-1, CD147, and tubulin.
(J) The percentage of c18orf32 remaining (relative to time = 0 hr) was quantified by densitometry analysis of immunoblots in (I). Data points represent mean ± SEM (n ≥ 3 independent experiments).
(K) Control HEK293 cells or cells lacking gp78 were treated with 200 μM oleate for 24 hr and pellet and buoyant fractions were purified by density gradient centrifugation. Levels of c18orf32 in pellet and buoyant fractions were determined by SDS-PAGE/immunoblot and normalized to the levels of calnexin and UBXD8, respectively. Data points represent mean ± SEM (n ≥ 3 independent experiments).
(L) Lipids from buoyant fractions (n = 4) isolated from clonal, c18orf32-null cells or cas9-expressing control cells were extracted and analyzed by mass spectrometry. Levels of all lipid species were compared with those present in control cells. Significantly altered lipids are shown. Asterisk indicates a significant difference (*p < 0.001).
(M) Model depicting the c18orf32 degradation pathway. C18orf32 traffics between the ER membrane and LDs. Levels of c18orf32 on LDs are controlled by an ERAD pathway that includes derlin-1, gp78, and the AAA ATPase VCP.
See also Figure S7; Tables S6 and S7.
To determine if c18orf32 is degraded by ERAD, or alternatively, by ubiquitin/VCP-dependent machinery on LDs, we analyzed the proteins that interact with S-tagged c18orf32. We confirmed that the degradation kinetics of c18orf32-S, but not of the cytosolic mutant c18orf32(Δ1-37)-S, were similar to that of endogenous c18orf32 and were impaired by depletion of VCP (Figures S7F and S7G). Quantitative proteomic analyses showed that c18orf32-S (Table S6) co-purified erlin-1 and derlin-1, two well-defined components of the ERAD pathway (Figure 7F). Treatment with CB5083 also increased the levels of ubiquitin and VCP that co-purified with c18orf32-S (Figure 7F), consistent with impaired extraction of ubiquitinated c18orf32-S by bound VCP. Analysis of c18orf32-S interactors did not identify E3 ubiquitin ligases that mediate the degradation of c18orf32-S. To identify a potential E3 ligase for c18orf32, we conducted a candidate screen using HEK293 cells in which we deleted known E3 ligases of the ERAD pathway, including RNF5, Hrd1, and gp78. Deletion of gp78, but not deletion of Hrd1 or RNF5, impaired the degradation of c18orf32 (Figure 7G). In contrast, CD147(C.G.) was stabilized by the deletion of its cognate E3 ligase, Hrd1 (Tyler et al., 2012) (Figure 7G). Affinity purification revealed that c18orf32-S interacts with both derlin-1 and gp78 (Figure 7H). The levels of gp78 that co-purified with c18orf32-S increased with CB5083 treatment (Figure 7H), suggesting that inhibition of VCP traps c18orf32 in complex with an ERAD dislocation apparatus containing gp78 and derlin-1. Indeed, we found that c18orf32 was stabilized to the same extent in gp78 knockout (KO) and derlin-1 KO cells (Figures 7I and 7J). We next examined if deletion of gp78, like inhibition of VCP, increased levels of c18orf32 on LDs. Levels of c18orf32 in ER-enriched pellet fractions from gp78 KO cells were modestly increased (~1.4-fold) relative to control cells (Figure 7K). The increase in c18orf32 levels in LD-enriched buoyant fractions from gp78 KO cells was significantly greater (~2.3-fold) (Figure 7K). Thus, these results indicate that ERAD regulates the levels of c18orf32 on LDs.
To investigate potential functions of c18orf32 on LDs, such as in LD biogenesis or turnover, we determined the size distribution of LDs in c18orf32 null cells that were either treated with oleate to induce formation of new LDs or starved in glucose-free medium after oleate treatment to promote degradation of existing LDs. In control experiments, transient depletion of ACSL3 by RNAi inhibited formation of large LDs in oleate-treated cells, consistent with the critical function of ACSL3 in neutral lipid synthesis (Figures S7H and S7J). Conversely, depletion of ATGL resulted in higher LD numbers in oleate-treated cells and reduced lipolytic degradation of LDs in starved cells (Figures S7I and S7J). Deletion of c18orf32 did not significantly alter the LD distribution after oleate treatment or starvation (Figure S7K). Similarly, overexpression of c18orf32-S did not have an overt effect on LDs (Figure S7L), suggesting that neither deletion nor overexpression of c18orf32 affects LD dynamics in a manner that can be observed by light microscopy. To determine if loss of c18orf32 affects other LD features, such as lipid composition, lipids extracted from buoyant fractions were analyzed by single-reaction monitoring-based liquid chromatography-mass spectrometry lipidomic profiling (Table S7). Although the levels of most lipids (e.g., triacylglycerol) were unaltered, loss of c18orf32 resulted in altered levels of several lipid species, including monoacylglycerol (C18:0 MAG), monoacylglycerol ether (C16:0e/C2:0 MAGe), and stearic acid (C18:0) (Figure 7L; Table S7). The decrease in MAG and increase in stearic acid raises the possibility that c18orf32 may regulate HSL, which generates MAG and free fatty acids during the lipolytic degradation of diacylglycerol. Although additional studies are required to examine the potential regulation of HSL by c18orf32, these results indicate that LD-associated c18orf32 modulates LD lipid composition.
DISCUSSION
LDs are regulators of lipid and energy metabolism that are central to the pathogenesis of human metabolic diseases. Attempts to define the LD proteome through proteomic analysis of biochemically isolated buoyant fractions have been plagued by the presence of contaminating proteins. Recent studies combined fractionation of LDs with protein correlation profiling to yield more specific LD proteomes in Drosophila S2 cells (Krahmer et al., 2013b) and yeast (Currie et al., 2014), but potentially failed to detect proteins that localize to multiple cellular compartments. Refined fractionation approaches have further increased the purity of LD preparations, but have been unable to completely separate LDs from other associated organelles (Zhang et al., 2016). Thus, the inability to accurately define LD proteomes has remained an obstacle to understanding the role of LD-associated proteins in LD biology. In this study, we implemented a proximity labeling strategy to generate high-confidence LD proteomic maps in two human cell lines and established the utility of this approach to study LD proteome dynamics.
Our results indicate that proximity labeling proteomics identifies a complete and specific LD proteome. LD-targeted APEX2 labeled all proteins in the total buoyant faction that were previously shown to localize to LDs, and identified previously validated LD proteins (e.g., SPG20, CIDEB, and MGLL) that were not detected in the LD-enriched buoyant fraction. The method also identified a significant number of new proteins on LDs, many of which were identified in both U2OS and Huh7 cells. These proteins may constitute functionally important LD machinery and therefore warrant further investigation. Importantly, LD-targeted APEX2 effectively excluded abundant non-LD proteins that are frequently identified in LD proteomic studies and comprise the vast majority of proteins present in buoyant fractions.
Some limitations have been ascribed to proximity labeling approaches. For example, proteins that are buried within macromolecular complexes may not be accessible for labeling. While this may be a limitation in our study, LD-targeted APEX2 fusions labeled all known LD proteins in the buoyant fraction, suggesting that APEX2 labeling achieves high coverage of the LD proteome. Recent APEX2 studies using ratiometric SILAC to subtract cytosolic background labeling reported that some proteins that localize to more than one cellular compartment may be filtered out, contributing to the incomplete coverage of organelle proteomes: 53% coverage of the outer mitochondrial membrane proteome (Hung et al., 2017), 44% coverage of the outer ER membrane proteome (Hung et al., 2017), and 67% coverage of the mitochondrial intermembrane space proteome (Hung et al., 2014). In light of this limitation, we used a subcellular fractionation step to isolate LD proteins from labeled cytosolic proteins. Although it remains possible that some peripherally associated LD proteins were lost during the fractionation procedure, we successfully identified peripheral proteins that are known to have both LD and cytosolic localization (e.g., VCP [Meyer et al., 2012; Olzmann et al., 2013b; Peters et al., 1990], HSL [Egan et al., 1992; Sztalryd et al., 2003], and UBE2G2 [Klemm et al., 2011; Spandl et al., 2011]).
We used LD-targeted APEX2 in combination with quantitative proteomics to advance our understanding of how the composition of the LD proteome is regulated. Protein degradation by the ubiquitin-proteasome system is a fundamental mechanism of protein quantity control (Komander and Rape, 2012). Although several LD proteins are degraded by the proteasome (Bersuker and Olzmann, 2017), the mechanisms and machinery that target these proteins for degradation are mostly unknown. Comparative proteomic analyses of LD proteomes identified c18orf32 as an ER-LD protein whose levels on LDs are regulated by ERAD. Our results support a model (Figure 7M) in which c18orf32, like many other LD proteins, is inserted into the ER during or following translation, and then laterally diffuses from the ER bilayer into the monolayer of emerging LDs. ERAD regulates the levels of c18orf32 in the ER, and thus determines the amount of c18orf32 that is available to traffic to LDs (Figure 7M). This model is in strong agreement with a recent study in yeast (Ruggiano et al., 2016), which demonstrated that the ERAD E3 ligase Doa10p, the E2 ubiquitin-conjugating enzyme Ubc7p (yeast ortholog of UBE2G2), and the AAA ATPase Cdc48p (yeast ortholog of VCP) regulated the levels of several proteins on LDs by mediating their degradation in the ER. That study (Ruggiano et al., 2016) and our findings demonstrate that ERAD is a general mechanism that regulates the abundance of select proteins on LDs. Consistent with this possibility, gp78 and VCP regulate the stability of the ER-LD protein DGAT2 (Choi et al., 2014), although it is unclear if this mechanism of regulation determines the levels of DGAT2 on LDs. In addition to regulating the stability of LD proteins initially inserted into the ER, ERAD may also degrade LD proteins that traffic from LDs to the ER through ER-LD membrane bridges (Wilfling et al., 2013). Further studies will be required to determine the overall contribution and importance of ERAD in regulating the composition of the LD proteome under different metabolic conditions. Together, these findings establish the utility of proximity labeling in investigating LD proteome dynamics and provide a foundation for future studies that will investigate how the LD proteome is remodeled in response to metabolic signals in diverse models of cellular metabolism.
STAR★METHODS
KEY RESOURCES TABLE
| REAGENT or RESOURCE | SOURCE | IDENTIFIER |
|---|---|---|
| Antibodies | ||
| Mouse monoclonal anti-V5 tag | Invitrogen | Cat. # 46-0705; RRID: AB_2556564 |
| Rabbit polyclonal anti-Plin2 | Abgent | Cat. # AP5118C; RRID: AB_10662954 |
| Rabbit polyclonal anti-c18orf32 | Abcam | Cat. # Ab122677; RRID: AB_11130470 |
| Mouse monoclonal anti-CD147 | Santa Cruz Biotechnology | Cat. # Sc-21746; RRID: AB_626911 |
| Rabbit polyclonal anti-α-tubulin | Cell Signaling Technology, Inc. | Cat. # 2144; RRID: AB_2210548 |
| Rabbit polyclonal anti-p97/VCP | Novus Biologicals | Cat. # NB100-1558; RRID: AB_2304347 |
| Rabbit polyclonal anti-gp78 | Kind gift from Yihong Ye (National Institutes of Health) | N/A |
| Rabbit polyclonal anti-derlin1 | Kind gift from Yihong Ye (National Institutes of Health) | N/A |
| Rabbit polyclonal anti-HRD1 | Bethyl Laboratories, Inc. | Cat. # A302-946A; RRID: AB_10690984 |
| Rabbit polyclonal anti-RNF5 | Abcam | Cat. # ab83466; RRID: AB_1861192 |
| Mouse monoclonal anti-GAPDH | EMD Millipore | Cat. # MAB374; RRID: AB_2107445 |
| Rabbit polyclonal anti-calnexin | Proteintech Group, Inc. | Cat. # 10427-2-AP; RRID: AB_2069033 |
| Mouse monoclonal anti-S-Tag | EMD Millipore | Cat. # 71549-3; RRID: AB_10806301 |
| Bacterial and Virus Strains | ||
| Cyto-V5-APEX2, pLenti CMV/TO Puro DEST | This study | N/A |
| Plin2-V5-APEX2, pLenti CMV/TO Puro DEST | This study | N/A |
| ATGL*-V5-APEX2, pLenti CMV/TO Puro DEST | This study | N/A |
| Bacterial and Virus Strains | ||
| Chemicals, Peptides, and Recombinant Proteins | ||
| Oleate (200 μM) | Sigma-Aldrich | Cat. # O1383 |
| BODIPY 493/503 (4,4-Difluoro-1,3,5,7,8-Pentamethyl-4-Bora-3a,4a-Diaza-s-Indacene) | Life Technologies Co. | Cat. # D3922 |
| BODIPY 558/568 C12 (4,4-Difluoro-5-(2-Thienyl)-4-Bora-3a,4a-Diaza-s-Indacene-3-Dodecanoic Acid) | Life Technologies Co. | Cat. # D3835 |
| AUTOdot | Abgent | Cat. # SM1000a |
| Blasticidin S HCl | Thermo Fisher Scientific | Cat. # A1113903 |
| Puromycin Dihydrochloride | Thermo Fisher Scientific | Cat. # A1113803 |
| Hygromycin B | Thermo Fisher Scientific | Cat. # 10687010 |
| Doxycycline | Sigma-Aldrich | Cat. # D9891 |
| Emetine dihydrochloride hydrate | Sigma-Aldrich | Cat. # E2375-500MG |
| CB-5083 | A gift from Cleave Biosciences | N/A |
| MLN-7243 | AOBIOUS | Cat. # AOB87172 |
| Biotin-phenol | Iris Biotech GmbH | Cat. # LS-3500.0250 |
| Hemin | Sigma-Aldrich | Cat. # H9039 |
| Trolox | Sigma-Aldrich | Cat. # 238813 |
| MG132 | Enzo Life Sciences | Cat. # BML-PI102-0005 |
| L-Lysine | Cambridge Isotope Laboratories, Inc. | Cat. # ULM-8766-0.1 |
| L-Arginine | Cambridge Isotope Laboratories, Inc. | Cat. # ULM-8347-PK |
| 4,4,5,5-D4-L-lysine | Cambridge Isotope Laboratories, Inc. | Cat. # DLM-2640-PK |
| 13C6-L-arginine | Cambridge Isotope Laboratories, Inc. | Cat. # CLM-2265-H-PK |
| 13C615N2-L-Lysine | Cambridge Isotope Laboratories, Inc. | Cat. # CNLM-3454-PK |
| 13C615N4-L-arginine | Cambridge Isotope Laboratories, Inc. | Cat. # CNLM-9007-CA-0.1MG |
| STAR 635P | Aberrior GmbH | N/A |
| STAR 580 | Aberrior GmbH | N/A |
| Pierce Protease Inhibitor Mini Tablets, EDTA-free | Thermo Fisher Scientific | Cat. # A32955 |
| Digitonin | EMD Millipore | Cat. # 300410 |
| Pierce Streptavidin Agarose | Thermo Fisher Scientific | Cat. # 20347 |
| S-Protein Agarose | EMD Millipore | Cat. # 69704 |
| Rapigest SF Surfactant | Waters | Cat. # 186001861 |
| Pierce Trypsin Protease, MS Grade | Thermo Fisher Scientific | Cat. # 90057 |
| Fugene6 | Promega | Cat. # E2691 |
| X-tremeGENE HP | Roche | Cat. # 6366244001 |
| Lipofectamine RNAiMAX | Thermo Fisher Scientific | Cat. # 13778-075 |
| Deposited Data | ||
| Mass spectrometry data | PRIDE Archive | PXD007695 |
| Experimental Models: Cell Lines | ||
| U2OS T-Rex Flp-In parental cells | Kind gift from Dr. Daniel Durocher (The Lunenfeld-Tanenbaum Research Institute) | N/A |
| Huh7 | Kind gift from Dr. Holly Ramage (University of Pennsylvania) | N/A |
| HEK293T/17 | ATCC | Cat. # CRL-11268 |
| HEK293 | Kind gift from Dr. Ron Kopito (Stanford University) | N/A |
| Oligonucleotides | ||
| c18of32 forward PCR primer ATGGTGTGCATTCCTTGTATCGTCATTCC |
This study | N/A |
| c18of32 reverse PCR primer GTCTTTCTTTTTATCACAGATTTCTGTTGGTCC |
This study | N/A |
| c18orf32 gRNA #1 CACCGTCGTCATTCCAGTTCTGCTC |
This study, http://crispr.mit.edu | N/A |
| c18orf32 gRNA #2 CACCGAGAACTGGAATGACGATACA |
This study, http://crispr.mit.edu | N/A |
| derllin-1 gRNA CACCGTCCCGGCGATCACGCGCTAT |
This study, http://crispr.mit.edu | N/A |
| Hrd1 gRNA CACCGCCGCCATCATCACTGCCGTG |
This study, http://crispr.mit.edu | N/A |
| RNF5 gRNA CACCGCGCTCGCGATTTGGCCCTTC |
This study, http://crispr.mit.edu | N/A |
| gp78 gRNA CACCGCGTTAGCTGGTCCGGCTCGC |
This study, http://crispr.mit.edu | N/A |
| Recombinant DNA | ||
| Mito-V5-APEX2 | Kind gift from Dr. Alice Ting (Stanford University) | N/A |
| pSpCas9(BB)-2A-Puro (PX459) | Kind gift from Dr. Feng Zhang | Addgene plasmid # 48139 |
| pLenti CMV TetR Blast virus (716-1) | Campeau et al., 2009 | Addgene plasmid #17492 |
| Plin2-V5-APEX2, pcDNA5/FRT/TO | This study | N/A |
| Cyto-V5-APEX2, pcDNA5/FRT/TO | This study | N/A |
| ATGL*-V5-APEX2, pcDNA5/FRT/TO | This study | N/A |
| pcDNA5/FRT/TO | Thermo Fisher Scientific | Cat. # V652020 |
| pLenti CMV/TO Puro DEST | Campeau et al., 2009 | Addgene plasmid # 17293 |
| Plin2-V5-APEX2, pLenti CMV/TO Puro DEST | This study | N/A |
| Cyto-V5-APEX2, pLenti CMV/TO Puro DEST | This study | N/A |
| ATGL*-V5-APEX2, pLenti CMV/TO Puro DEST | This study | N/A |
| c18orf32-GFP, pcDNA5/FRT/TO | This study | N/A |
| c18orf32(Δ1-37)-GFP, pcDNA5/FRT/TO | This study | N/A |
| c18orf32(Δ38-76)-GFP, pcDNA5/FRT/TO | This study | N/A |
| c18orf32-S, pcDNA5/FRT/TO | This study | N/A |
| c18orf32(Δ1-37)-S, pcDNA5/FRT/TO | This study | N/A |
| HPos-mOrange | Kind gift from Dr. Albert Pol (Institut d’Invѐstigacions) | N/A |
| LiveDrop | Kind gift from Drs. Tobias Walther and Robert Farese Jr. (Harvard University) | N/A |
| mCherry-Sec61 | Kind gift from Dr. Gia Voeltz (University of Colorado) | Addgene plasmid # 49155 |
| pcDNA-DEST47 | Kind gift from Dr. Tim Stearns (Stanford University) | N/A |
| PKMYT1, pLPS-5′ EGFP | Harvard PlasmID Database | Clone ID: HsCD00036160 |
| LSS, pcDNA-DEST47 | Harvard PlasmID Database | Clone ID: HsCD00365307 |
| RAB5A, pcDNA-DEST47 | Harvard PlasmID Database | Clone ID: HsCD00366783 |
| PITPNB, pcDNA-DEST47 | Harvard PlasmID Database | Clone ID: HsCD00368405 |
| RAB1B, pcDNA-DEST47 | Harvard PlasmID Database | Clone ID: HsCD00369274 |
| HSD17B7, pcDNA-DEST47 | Harvard PlasmID Database | Clone ID: HsCD00369892 |
| EFCAB4B, pcDNA-DEST47 | Harvard PlasmID Database | Clone ID: HsCD00370875 |
| SCCPDH, pcDNA-DEST47 | Harvard PlasmID Database | Clone ID: HsCD00372204 |
| ANXA7, pcDNA-DEST47 | Harvard PlasmID Database | Clone ID: HsCD00372992 |
| ZFYVE1, pcDNA-DEST47 | Harvard PlasmID Database | Clone ID: HsCD00377491 |
| RDH11, pcDNA-DEST47 | Harvard PlasmID Database | Clone ID: HsCD00382748 |
| RAB2A, pcDNA-DEST47 | Harvard PlasmID Database | Clone ID: HsCD00383517 |
| AIFM2, pcDNA-DEST47 | Harvard PlasmID Database | Clone ID: HsCD00370652 |
| Software and Algorithms | ||
| ImageJ Software | Schneider et al., 2012 | https://imagej.nih.gov/ij/ |
| MATLAB | MathWorks | https://www.mathworks.com/products/matlab.html |
| MaxQuant | Max Planck institute of Biochemistry | http://www.biochem.mpg.de/5111795/maxquant |
| Database for Annotation, Visualization and Integrated Discovery (DAVID) v6.8 | National Institutes of Health | https://david.ncifcrf.gov/ |
| REVIGO | Supek et al., 2011 | http://revigo.irb.hr/ |
| CytoScape | Shannon et al., 2003 | http://www.cytoscape.org/ |
CONTACT FOR REAGENT AND RESOURCE SHARING
Further information and requests for resources and reagents should be directed to and will be fulfilled by the Lead Contact, James Olzmann (olzmann@berkeley.edu). Requests will be handled according to the University of California, Berkeley policies regarding MTA and related matters.
EXPERIMENTAL MODEL AND SUBJECT DETAILS
Cell Culture
U2OS, Huh7, and HEK293 cells were cultured in DMEM containing 4.5 g/L glucose and L-glutamine (Corning) supplemented with 10% fetal bovine serum (FBS, Thermo Fisher Scientific and Gemini Bio Products) at 37°C with 5% CO2. SILAC isotope labeling was performed by growing cells for at least 6 days in DMEM lacking arginine and lysine (Corning) supplemented with 10% dialyzed FBS and the appropriate SILAC amino acids (Cambridge Isotope Laboratories, Inc.): light (K0R0), L-Lysine (Lys0) and L-Arginine (Arg0); medium (K4R6), 4,4,5,5-D4-L-lysine (Lys4) and 13C6-L-arginine (Arg6); heavy (K8R10), 13C615N2-L-Lysine (Lys8) and 13C615N4-L-arginine (Arg10).
All U2OS expression lines were generated by transfection of U2OS T-Rex Flp-In cells, a gift from Dr. Daniel Durocher (The Lunenfeld-Tanenbaum Research Institute), with pOG44 Flp-Recombinase plasmid (Thermo Fisher Scientific) and pCDNA5/FRT/TO plasmid at a 9:1 ratio followed by selection in 500 μg/mL hygromycin. HEK293 and U2OS null cell lines were generated using CRISPR/Cas9 technology by transfection with pSpCas9(BB)-2A-Puro (PX459) (Ran et al., 2013), a gift from Feng Zhang (Addgene plasmid # 48139), followed by selection in 1 ug/mL puromycin and isolation of individual clones by limited dilution. Huh7 TetR expression lines were generated by infection with pLenti CMV TetR Blast virus (716-1) (Addgene plasmid #17492) and treatment with 8 μg/mL polybrene followed by selection in media containing 4 μg/mL blasticidin. Huh7 TetR cells were subsequently infected with pLenti CMV/TO Puro DEST virus (670-1) (Addgene plasmid #17293) containing V5-APEX2 fusion constructs and expressing cells were selected in media containing 2 μg/mL puromycin.
METHOD DETAILS
Plasmids
ATGL*-V5-APEX2 and PLIN2-V5-APEX2 were generated by insertion of ATGL* and PLIN2 between the NotI and BamHI sites in pcDNA3.1+ followed by insertion of V5-APEX2 between downstream BamHI and XhoI sites. V5-APEX2 was amplified by PCR from Mito-APEX2, a gift from Dr. Alice Ting (Stanford University). The resulting V5-APEX2 fusion constructs were cloned into pcDNA5/FRT/TO using polymerase incomplete primer extension (PIPE) (Stevenson et al., 2013). Lentiviral constructs were generated by insertion of V5-APEX2 constructs between the NotI and XhoI sites in pLenti CMV/TO Puro DEST. Generation of C-terminally GFP-tagged LD proteins of interest was performed by employing Gateway recombination cloning (Thermo Fisher Scientific) with donor sequences in pENTR2 or pDONR vectors (Harvard PlasmID Database) and the pDEST47 destination vector. C18orf32-GFP was generated by PCR amplification of c18orf32 from human cDNA with the forward primer 5′ – ATGGTGTGCATTCCTTGTATCGTC ATTCC – 3′ and reverse primer 5′ GTCTTTCTTTTTATCACAGATTTCTGTTGGTCC 3′ and inserted into EGFP-N1 vector (Clontech) using PIPE. C18orf32-GFP was subsequently PCR amplified and inserted into pcDNA5/FRT/TO by PIPE. C18orf32(Δ1-37)-GFP and c18orf32(Δ38-76)-GFP were generated by site-directed mutagenesis. C18orf32-S was generated by replacing the GFP in c18orf32-GFP with S-peptide using PIPE. HPos-mOrange was a gift from Dr. Albert Pol (Institut d’Invèstigacions) (Kassan et al., 2013) and LiveDrop was a gift from Drs. Tobias Walther and Robert Farese Jr. (Harvard University) (Wang et al., 2016). mCherry-Sec61 (Addgene plasmid # 49155) was a gift from Dr. Gia Voeltz (University of Colorado) (Zurek et al., 2011).
Plasmid transfections were performed using Fugene6 (Promega) transfection reagent for U2OS cells and X-tremeGENE HP (Roche) transfection reagent for HEK293 cells according to the manufacturer’s instructions. siRNAs against c18orf32, VCP, ATGL, and ACSL3 were obtained from Sigma and transfected using Lipofectamine RNAiMAX (Thermo Fisher Scientific) according to the manufacturer’s instructions.
CRISPR guide RNA (sgRNA) sequences targeting c18orf32, derlin-1, RNF5, HRD1 and gp78 were designed using the online-available CRISPR design tool developed by the Zhang laboratory (http://crispr.mit.edu/). The seed sequence preceding the protospacer motif were: c18orf32 guide 1, 5′ CACCGTCGTCATTCCAGTTCTGCTC 3′, c18orf32 guide 2, 5′ CACCGAGAACTGGAATGACGAT ACA 3′, derlin-1, 5′ CACCGTCCCGGCGATCACGCGCTAT 3′, HRD1, 5′ CACCGCCGCCATCATCACTGCCGTG 3′, RNF5, 5′ CACCGCGCTCGCGATTTGGCCCTTC 3′, and gp78, 5′ CACCGCGTTAGCTGGTCCGGCTCGC 3′. Nucleotides in italics show the overhangs necessary for incorporation into the BbsI restriction site of PX459 vector.
Reagents used in this study include: doxycycline (Sigma), emetine (Sigma), oleic acid (Sigma), CB5083 (Anderson et al., 2015) (Cleave Biosciences), MLN-7243 (AOBIOUS, Inc.), biotin-phenol (Iris Biotech GmbH), puromycin (Invitrogen), hygromycin (Invitrogen), and MG132 (Enzo Life Sciences).
Immunoblotting
Cells were washed in PBS, lysed in 1% SDS, sonicated for 10-30 sec, and boiled for 5 min at 100°C. Protein concentrations were determined using the bicinchoninic acid (BCA) protein assay (Thermo Fisher Scientific), and equal amounts of protein by weight were combined with 1X Laemmli buffer, separated on 4-20% polyacrylamide gradient gels (Bio-Rad Laboratories, Inc.), and transferred onto low fluorescence PVDF or nitrocellulose membranes (Bio-Rad Laboratories, Inc.). Membranes were washed in PBS with 0.1% Tween-20 (PBST) and blocked in PBST containing 5% (wt/vol) dried milk for 30 min. Membranes were incubated for 2-24 hr in PBST containing 5% bovine serum albumin (BSA) (Sigma Aldrich) and primary antibodies. After washing with PBST, membranes were incubated with fluorescent secondary antibodies diluted in 5% BSA/PBST at room temperature for 30-60 min. All immunoblots were imaged on a LI-COR imager (LI-COR Biosciences).
The following blotting reagents and antibodies were used: anti-V5 tag (Invitrogen), anti-Plin2 (Abgent), anti-c18orf32 (Abcam), anti-CD147 (Santa Cruz Biotechnology), anti-α-tubulin (Cell Signaling Technology, Inc.), anti-VCP (Novus Biologicals), anti-gp78 and anti-derlin1 (gifts from Yihong Ye (National Institutes of Health), anti-Hrd1 (Bethyl Laboratories, Inc.), anti-RNF5 (Abcam), anti-GAPDH (EMD Millipore), anti-calnexin (Proteintech Group, Inc), anti-S-Tag (EMD Millipore), IRDye800 conjugated streptavidin (LI-COR Biosciences), anti-rabbit IRDye800 conjugated secondary (LI-COR Biosciences), anti-mouse Alexa Fluor 680 conjugated secondary (Invitrogen).
Fluorescence Microscopy
For fluorescence microscopy of fixed cells, cells grown on coverslips were incubated in the presence of 200 μM oleate for 24 hr. Cells were washed 3X in PBS, fixed for 15 min in PBS containing 4% (wt/vol) paraformaldehyde, and washed 3X with PBS. Cells were permeabilized and blocked for 15 min with 1% BSA/PBS containing 0.01% digitonin (prior to staining LDs) or for 5 min with 1% BSA/PBS containing 0.1% Triton-X100 (prior to staining ER) followed by blocking in 1% BSA/PBS for 15 min. Cells were washed 3X with 1% BSA/PBS and incubated in primary antibody for 2 hr at RT. Cells were washed 3X and incubated for 1 hr in blocking solution containing anti-rabbit or anti-mouse secondary antibodies conjugated to Alexa Fluor 488 or 594, or in solution containing streptavidin-568 (Thermo Fisher Scientific). Droplets were stained with 10 ug/ml BODIPY 493/503 (Thermo Fisher Scientific) that was added to the secondary antibody solution. Cells were subsequently washed 3X and mounted using Fluoromount G (Southern Biotech).
For live-cell microscopy, cells were grown in 4-well or 8-well Lab-Tek II Chambered Coverglass (Thermo Fisher Scientific). To image LDs, cells were incubated for 24 hr with 200 μM oleate and 1 μM Bodipy-C12-568 (Thermo Fisher Scientific) or incubated with 100 μM AUTOdot (Abgent).
Cells were imaged using a Deltavision Elite widefield epifluoresence deconvolution microscope (GE Healthcare) equipped with a 60× oil immersion objective (Olympus) using DAPI, FITC, Tx-Red and Cy5 filters. For live-cell microscopy, cells were imaged in an enclosure heated to 37°C and exposed to continuous perfusion of a gas mixture containing 5% CO2, 21% O2 and 74% N2 (BioBlend, Praxair). Images were analyzed using ImageJ (http://imagej.nih.gov/ij/) and line scan intensities were generated using softWoRx (GE Healthcare Life Sciences).
STED Microscopy
For STED imaging experiments, anti-mouse and anti-rabbit secondary antibodies (Dianova) were labeled with STAR635P and STAR580 dyes (Abberior) respectively using standard protocols. STED imaging was performed on a two-color Abberior STED 775 QUAD scanning microscope (Abberior Instruments GmbH), equipped with 488 nm, 561 nm, and 640 nm pulsed excitation laser sources, a pulsed 775 nm laser for fluorophore de-excitation by STED and a 100× oil immersion objective lens. The pixel size was 20 nm for all STED recordings. Effective pixel dwell times were ~30 μs for the Cy5 detection window (640 nm excitation) and ~20 μs for the Cy3 detection window (561 nm excitation), with the excitation laser power adjusted to achieve good image contrast. BODIPY493 was imaged in confocal mode using the 488 nm laser. For quantification of colocalization, the Pearson’s R values were calculated for n =16 2×2 μm2 regions per condition. All acquired images were processed and visualized using the ImSpector software package (Max-Planck Innovation) and ImageJ. Nearest-pixel-neighbor smoothing of STED images (for display) and calculation of Pearson’s unthresholded R coefficient based on the raw data were performed using ImageJ.
LD Proteome Labeling and LD Isolation
For each APEX2 cell line, 18 15-cm plates of cells were treated with 5-10 ng/uL doxycycline for 48 h followed by incubation in 200 μM oleate and 7 μM Hemin for 24 hr. Cells were subsequently treated with 500 μM biotin-phenol for 45 min. Prior to harvesting, biotinylation of proteins was catalyzed by addition of 1 μM H2O2 for 1 min, and the reaction was quenched by washing cells 2X with PBS containing 10 mM sodium ascorbate and 5 mM Trolox. Cells were harvested in PBS, centrifuged for 10 min at 500 × g, and cell pellets were incubated for 10 min in cold hypotonic lysis medium (HLM, 20 mM Tris-HCl pH 7.4 and 1 mM EDTA) containing cOmplete, Mini, EDTA-free Protease Inhibitor Cocktail (Sigma-Aldrich). Cells were dounced 80X strokes in a 7 mL dounce and lysates were centrifuged at 1000 × g for 10 min. The supernatant was subsequently transferred to Ultra-Clear ultracentrifuge tubes (Beckman-Coulter), diluted to a final concentration of 20% sucrose/HLM, and overlaid by 4 mL of 5% sucrose/HLM followed by 4 mL of HLM. Overlaid samples were centrifuged for 30 min at 15,000 × g in an ultracentrifuge using an SW41 swinging bucket rotor (Beckman-Coulter). Buoyant fractions were isolated using a tube cutter (Beckman-Coulter), additional fractions were pipetted from the top of the sucrose gradient in 1 mL increments and pellets were resuspended in 1 mL HLM. 100 μL of 10% SDS was added to each fraction, yielding a final concentration of 1% SDS. Samples were then sonicated for 15 sec. Buoyant fractions were additionally incubated at 37°C for 1 hr with sonication every 20 min, followed by a final incubation for 10 min at 65°C.
Proteomic Analysis of LD Proteins
For isolation of biotinylated proteins from U2OS cells, buoyant fractions containing 1% SDS were diluted with PBS/0.1% Tween-20 (PBST) to a final concentration of 0.1% SDS. 0.4 mL of streptavidin-conjugated agarose bead slurry (Thermo Fisher Scientific) was washed 3X with PBST and added to the diluted buoyant fractions for 4 hr at RT with constant mixing. Beads were centrifuged at 2000 × g and washed 5X with PBST, followed by 3X washes with PBS and 3X washes with 50 mM ammonium bicarbonate. The beads were resuspended in one bead volume of 50 mM ammonium bicarbonate containing 0.02% Rapigest (Waters) (w/v), heated at 65°C for 15 min and bound proteins were digested O/N at 37°C with 1 μg mass spectrometry grade trypsin (Promega). After protein digestion, beads were removed and the supernatant was acidified to pH < 2 by addition of 500 mM HCl and incubation at RT for 45 min. All precipitated material was removed by centrifugation at 20,000 × g for 15 min. Peptides were dried down to a final volume of 15-20 μl in a vacuum centrifuge.
For isolation of biotinylated proteins from Huh7 cells, an in-gel digestion protocol was used to minimize contamination of samples with streptavidin from the beads. Buoyant fractions containing 1% SDS were diluted with HLM buffer to a final concentration of 0.1% SDS. 0.2 mL of streptavidin-conjugated agarose bead slurry (Thermo Fisher Scientific) was washed 3X with PBST and 1X with HLM buffer and added to the diluted buoyant fractions for 4 hr at RT with constant mixing. Beads were centrifuged at 2000 × g and washed 5X with PBST, followed by 3X washes with PBS. Proteins were eluted with 2% SDS + 3 mM biotin by incubating at RT for 15 min with constant mixing followed by heating at 95°C for 15 min. The eluted proteins were mixed with 1X Laemmli buffer and run into a mini-PROTEAN TGX 4-20% polyacrylamide gel (Bio-Rad), and proteins were digested in-gel overnight with 0.5 μg trypsin in 5% acetonitrile/5 mM ammonium bicarbonate. Digested peptides were extracted by addition of 5% formic acid in acetonitrile and incubation at 37°C for 15 min with constant agitation. The resulting supernatant was dried down to a final volume of 15-20 μL in a vacuum centrifuge.
Total proteins from U2OS and Huh7 buoyant fractions were isolated by dilution of fractions to a final volume of 1% SDS and addition of trichloroacetic acid (TCA) to a final concentration of 15%. Precipitated proteins were pelleted by centrifuging at 20,000 × g for 30 min at 4°C, washed twice with cold acetone and resuspended in 0.02% Rapigest.
1 μg of peptides was analyzed by LC-MS/MS on a Thermo Scientific Q Exactive Orbitrap Mass spectrometer connected to a Proxeon Easy-nLC II HPLC (Thermo Fisher Scientific) and Proxeon nanospray source at the University of California, Davis Proteomics Core Facility. Peptide identity and MS/MS counts were determined by analyzing RAW output files in MaxQuant (Max Planck Institute of Biochemistry) using the reviewed human protein database obtained from UniProt. Variable modifications were set to include N-terminal acetylation and oxidation. The FDR was set to 1% and minimum peptide length was set to 6 amino acids. All proteomic data files are available through the PRoteomics IDEntifications (PRIDE) database (Project PXD007695).
Lipidomics
Buoyant fractions (n = 4 per condition) were isolated from Cas9 control cells or clonal c18orf32 null lines generated using two different sgRNA sequence (guides 1 and 2). As previously described (Benjamin et al., 2013; Nguyen et al., 2017; To et al., 2017), lipids were extracted from buoyant fractions in a 2:1:1 chloroform:methanol:PBS solution following addition of internal standards (10 nmoles of dodecylglycerol and 10 nmoles of pentadecanoic acid). The organic layer was collected, and the remaining organic material was extracted from the aqueous layer following acidification with 0.1% formic acid and re-extraction in chloroform. The two extractions were combined and dried down under a stream of nitrogen. Dried extracts were resolubilized in chloroform and injected into an Agilent 6400 triple quadrupole (QQQ)-liquid chromatography-mass spectrometry (LC-MS) instrument. Metabolites were quantified by integrating the area under the curve and the resulting values were normalized to internal standards.
Bioinformatic Characterization of the LD Proteome
A LD confidence score was calculated using the equations depicted in Figure S1C. This algorithm accounts for protein abundance (i.e. SAF), replication in multiple experiments with different LD-targeted APEX2 fusion proteins, and specificity (i.e. absence from Cyto-APEX2 samples). The confidence score is equal to the sum of the SAF of a protein identified in the LD-targeted APEX2 samples (PLIN2 or ATGL*) minus the SAF in the corresponding Cyto-APEX2 control sample, multiplied by the number of times the protein was identified in the LD-targeted APEX2 experimental replicates. Thus, proteins that are detected with high numbers of spectral counts in multiple LD-targeted APEX2 samples and are not detected in the Cyto-APEX2 sample are assigned a high LD confidence score. Proteins that have low spectral counts or have high abundance in the Cyto-APEX2 sample are assigned a low LD confidence score. The threshold value CST was manually determined to include the largest number of validated proteins while excluding likely contaminant proteins. Ultimately, the threshold is not a definitive cutoff and validated LD proteins are detected below the threshold, but with reduced likelihood.
Heatmaps were generated using Multiple Experiment Viewer Version 10.2. To represent the proteomics data on a heatmap for comparison we used a normalized SAF (NSAF) to account for the difference in protein abundance between the different samples. The NSAF was calculated by dividing the SAF by the average SAF in the sample (Figure S1C).
GO analysis of high confidence LD proteomes was performed using the Database for Annotation, Visualization and Integrated Discovery (DAVID) v6.8 (Huang et al., 2009). Complete DAVID GO analyses are shown in Tables S3. GO terms were then summarized, simplified, and visualized by analyzing the GO terms and the Benjamini corrected P-values using REVIGO (Supek et al., 2011). GO networks were downloaded from REVIGO and the final GO networks were generated using cytoscape (Shannon et al., 2003).
Proteomic Analysis of c18orf32 Interactors
U2OS cells expressing c18orf32-S were cultured in SILAC media (Corning) containing K4R6 or K8R10 amino acids and non-expressing U2OS cells were cultured in SILAC media containing K0R0, all for at least 6 days. For each SILAC condition, three 15-cm plates were induced with 10 ng/mL dox for 48 hr. Cells cultured in K8R10 media were subsequently treated with 5 μM CB5083 for 6 hr. Following harvest, cells were lysed in lysis buffer containing 1% digitonin, 150 mM NaCl, 50 mM Tris-HCl pH 7.4 and 1X protease inhibitors, and rotated at 4°C for 30 min. Lysates were centrifuged at 4°C for 15 min at 20,000 × g, and protein concentration in supernatants was quantified by BCA protein quantification assay. Proteins combined in a 1:1:1 w/w/w ratio were mixed with 0.4 mL slurry of S-Protein agarose beads and rotated for 2 hr at 4°C. Beads were washed 5X with AP buffer containing 150 mM NaCl, 50 mM Tris and 0.1% Digitonin, followed by 3X washes with AP buffer without digitonin and 3X washes with 50 mM ammonium bicarbonate, and prepared for mass spectrometry (see Proteomic Analysis of LD Proteins). Fold change ratios of c18orf32-S inter-actors were calculated using MaxQuant. As anticipated, c18orf32 (bait protein) had a high SILAC ratio (26.264-fold, Table S6). For presentation purposes, c18orf32 was removed from the plot in Figure 7F to enable visualization of interactors. All proteomic data files are available through the PRIDE database (Project PXD007695).
QUANTIFICATION AND STATISTICAL ANALYSIS
Quantification of LDs
To quantify LD size distributions, cells were treated with 200 μM oleate for 24 hr or treated with 200 μM oleate for 24 hr and then starved in glucose-free DMEM (Life Technologies) supplemented with 10% FBS and 1X glutamate (Life Technologies) for 16 hr. Live cells were stained with BODIPY 493/503 and Hoechst, and >100 positions were automatically acquired in a grid pattern for each experimental condition using a 60× objective. The resulting BODIPY 493/503 images were loaded into a custom package written in MATLAB (MathWorks) that uses a built-in algorithm to detect circular objects (LDs), a recursive segmentation algorithm to quantify nuclei number and a data analyzer to bin, normalize and compile the data of LD size distributions into histograms. All histograms were normalized by the number of nuclei to determine mean LD size distribution per cell. The MATLAB programs and supporting documentation can be found at http://dropletproteome.org.
Quantification of Immunoblotting
All immunoblots were visualized using a LI-COR imager (LI-COR Biosciences). Band density was quantified using ImageJ software and the mean ± SEM was determined from three independent experiments.
DATA AND SOFTWARE AVAILABILITY
The accession number for the proteomics data reported in this paper is PRIDE database: PXD007695.
Supplementary Material
Highlights.
Selective enzymatic tagging of lipid droplet proteins using APEX2 fusion proteins
Mapping of high-confidence lipid droplet proteomes in two human cell lines
Inhibition of the AAA ATPase VCP stabilizes c18orf32, an ER-lipid droplet protein
C18orf32 levels on lipid droplets are regulated by a gp78 and derlin-1 ERAD pathway
Acknowledgments
We thank members of the Olzmann lab for useful discussions and Dr. Camille Pataki for critical reading of the manuscript. This research was supported by grants from the NIH (R00DK095921 to J.A.O., R01GM112948 to J.A.O., and R01CA172667 to D.K.N.) and from the American Heart Association (16GRNT30870005 to J.A.O.). V.S. was supported by the Department of Defense through the National Defense Science and Engineering Graduate Fellowship (NDSEG) program.
Footnotes
SUPPLEMENTAL INFORMATION
Supplemental Information includes seven figures and seven tables and can be found with this article online at https://doi.org/10.1016/j.devcel.2017.11.020.
AUTHOR CONTRIBUTIONS
J.A.O., K.B., and C.W.H.P. conceived of and designed experiments. K.B., C.W.H.P., M.T., S.J.S., and E.A.G. generated key reagents and performed the experiments. J.A.O., K.B., C.W.H.P., M.T., S.J.S., V.S., E.A.G., and D.K.N. analyzed data and interpreted results. J.A.O. and K.B. wrote the manuscript. All authors read and edited the manuscript.
References
- Anderson DJ, Le Moigne R, Djakovic S, Kumar B, Rice J, Wong S, Wang J, Yao B, Valle E, Kiss von Soly S, et al. Targeting the AAA ATPase p97 as an approach to treat cancer through disruption of protein homeostasis. Cancer Cell. 2015;28:653–665. doi: 10.1016/j.ccell.2015.10.002. [DOI] [PMC free article] [PubMed] [Google Scholar]
- Bartz R, Zehmer JK, Zhu M, Chen Y, Serrero G, Zhao Y, Liu P. Dynamic activity of lipid droplets: protein phosphorylation and GTP-mediated protein translocation. J Proteome Res. 2007;6:3256–3265. doi: 10.1021/pr070158j. [DOI] [PubMed] [Google Scholar]
- Bendayan M. Tech.Sight Worth its weight in gold. Science. 2001;291:1363–1365. doi: 10.1126/science.291.5507.1363. [DOI] [PubMed] [Google Scholar]
- Benjamin DI, Cozzo A, Ji X, Roberts LS, Louie SM, Mulvihill MM, Luo K, Nomura DK. Ether lipid generating enzyme AGPS alters the balance of structural and signaling lipids to fuel cancer pathogenicity. Proc Natl Acad Sci USA. 2013;110:14912–14917. doi: 10.1073/pnas.1310894110. [DOI] [PMC free article] [PubMed] [Google Scholar]
- Bersuker K, Olzmann JA. Establishing the lipid droplet proteome: mechanisms of lipid droplet protein targeting and degradation. Biochim Biophys Acta. 2017;1862:1166–1177. doi: 10.1016/j.bbalip.2017.06.006. [DOI] [PMC free article] [PubMed] [Google Scholar]
- Campeau E, Ruhl VE, Rodier F, Smith CL, Rahmberg BL, Fuss JO, Campisi J, Yaswen P, Cooper PK, Kaufman PD. A versatile viral system for expression and depletion of proteins in mammalian cells. PLoS One. 2009;4:e6529. doi: 10.1371/journal.pone.0006529. [DOI] [PMC free article] [PubMed] [Google Scholar]
- Chen X, Goodman JM. The collaborative work of droplet assembly. Biochim Biophys Acta. 2017;1862:1205–1211. doi: 10.1016/j.bbalip.2017.07.003. [DOI] [PMC free article] [PubMed] [Google Scholar]
- Choi K, Kim H, Kang H, Lee SY, Lee SJ, Back SH, Lee SH, Kim MS, Lee JE, Park JY, et al. Regulation of diacylglycerol acyltransferase 2 protein stability by gp78-associated endoplasmic-reticulum-associated degradation. FEBS J. 2014;281:3048–3060. doi: 10.1111/febs.12841. [DOI] [PubMed] [Google Scholar]
- Christianson JC, Olzmann JA, Shaler TA, Sowa ME, Bennett EJ, Richter CM, Tyler RE, Greenblatt EJ, Harper JW, Kopito RR. Defining human ERAD networks through an integrative mapping strategy. Nat Cell Biol. 2011;14:93–105. doi: 10.1038/ncb2383. [DOI] [PMC free article] [PubMed] [Google Scholar]
- Currie E, Guo X, Christiano R, Chitraju C, Kory N, Harrison K, Haas J, Walther TC, Farese RV. High confidence proteomic analysis of yeast LDs identifies additional droplet proteins and reveals connections to dolichol synthesis and sterol acetylation. J Lipid Res. 2014;55:1465–1477. doi: 10.1194/jlr.M050229. [DOI] [PMC free article] [PubMed] [Google Scholar]
- Eastman SW, Yassaee M, Bieniasz PD. A role for ubiquitin ligases and Spartin/SPG20 in lipid droplet turnover. J Cell Biol. 2009;184:881–894. doi: 10.1083/jcb.200808041. [DOI] [PMC free article] [PubMed] [Google Scholar]
- Egan JJ, Greenberg AS, Chang MK, Wek SA, Moos MC, Londos C. Mechanism of hormone-stimulated lipolysis in adipocytes: translocation of hormone-sensitive lipase to the lipid storage droplet. Proc Natl Acad Sci USA. 1992;89:8537–8541. doi: 10.1073/pnas.89.18.8537. [DOI] [PMC free article] [PubMed] [Google Scholar]
- Gao G, Chen FJ, Zhou L, Su L, Xu D, Xu L, Li P. Control of lipid droplet fusion and growth by CIDE family proteins. Biochim Biophys Acta. 2017;1862:1197–1204. doi: 10.1016/j.bbalip.2017.06.009. [DOI] [PubMed] [Google Scholar]
- Gluchowski NL, Becuwe M, Walther TC, Farese RV. Lipid droplets and liver disease: from basic biology to clinical implications. Nat Rev Gastroenterol Hepatol. 2017;14:343–355. doi: 10.1038/nrgastro.2017.32. [DOI] [PMC free article] [PubMed] [Google Scholar]
- Greenberg AS, Coleman RA, Kraemer FB, McManaman JL, Obin MS, Puri V, Yan QW, Miyoshi H, Mashek DG. The role of lipid droplets in metabolic disease in rodents and humans. J Clin Invest. 2011;121:2102–2110. doi: 10.1172/JCI46069. [DOI] [PMC free article] [PubMed] [Google Scholar]
- Le Guerroué F, Eck F, Jung J, Starzetz T, Mittelbronn M, Kaulich M, Behrends C. Autophagosomal content profiling reveals an LC3C-dependent piecemeal mitophagy pathway. Mol Cell. 2017;68:786–796.e6. doi: 10.1016/j.molcel.2017.10.029. [DOI] [PubMed] [Google Scholar]
- Hashemi HF, Goodman JM. The life cycle of lipid droplets. Curr Opin Cell Biol. 2015;33:119–124. doi: 10.1016/j.ceb.2015.02.002. [DOI] [PMC free article] [PubMed] [Google Scholar]
- Huang DW, Sherman BT, Lempicki RA. Systematic and integrative analysis of large gene lists using DAVID bioinformatics resources. Nat Protoc. 2009;4:44–57. doi: 10.1038/nprot.2008.211. [DOI] [PubMed] [Google Scholar]
- Hung V, Zou P, Rhee HW, Udeshi ND, Cracan V, Svinkina T, Carr SA, Mootha VK, Ting AY. Proteomic mapping of the human mitochondrial intermembrane space in live cells via ratiometric APEX tagging. Mol Cell. 2014;55:332–341. doi: 10.1016/j.molcel.2014.06.003. [DOI] [PMC free article] [PubMed] [Google Scholar]
- Hung V, Lam SS, Udeshi ND, Svinkina T, Guzman G, Mootha VK, Carr SA, Ting AY. Proteomic mapping of cytosol-facing outer mitochondrial and ER membranes in living human cells by proximity biotinylation. Elife. 2017;6 doi: 10.7554/eLife.24463. https://doi.org/10.7554/eLife.24463. [DOI] [PMC free article] [PubMed] [Google Scholar]
- Johansen T, Lamark T. Selective autophagy mediated by autophagic adapter proteins. Autophagy. 2011;7:279–296. doi: 10.4161/auto.7.3.14487. [DOI] [PMC free article] [PubMed] [Google Scholar]
- Kassan A, Herms A, Fernández-Vidal A, Bosch M, Schieber NL, Reddy BJN, Fajardo A, Gelabert-Baldrich M, Tebar F, Enrich C, et al. Acyl-CoA synthetase 3 promotes lipid droplet biogenesis in ER microdomains. J Cell Biol. 2013;203:985–1001. doi: 10.1083/jcb.201305142. [DOI] [PMC free article] [PubMed] [Google Scholar]
- Kim DI, Roux KJ. Filling the void: proximity-based labeling of proteins in living cells. Trends Cell Biol. 2016;26:804–817. doi: 10.1016/j.tcb.2016.09.004. [DOI] [PMC free article] [PubMed] [Google Scholar]
- Klemm EJ, Spooner E, Ploegh HL. Dual role of ancient ubiquitous protein 1 (AUP1) in lipid droplet accumulation and endoplasmic reticulum (ER) protein quality control. J Biol Chem. 2011;286:37602–37614. doi: 10.1074/jbc.M111.284794. [DOI] [PMC free article] [PubMed] [Google Scholar]
- Koliwad SK, Streeper RS, Monetti M, Cornelissen I, Chan L, Terayama K, Naylor S, Rao M, Hubbard B, Farese RV. DGAT1-dependent triacylglycerol storage by macrophages protects mice from diet-induced insulin resistance and inflammation. J Clin Invest. 2010;120:756–767. doi: 10.1172/JCI36066. [DOI] [PMC free article] [PubMed] [Google Scholar]
- Komander D, Rape M. The ubiquitin code. Annu Rev Biochem. 2012;81:203–229. doi: 10.1146/annurev-biochem-060310-170328. [DOI] [PubMed] [Google Scholar]
- Krahmer N, Guo Y, Wilfling F, Hilger M, Lingrell S, Heger K, Newman HW, Schmidt-Supprian M, Vance DE, Mann M, et al. Phosphatidylcholine synthesis for lipid droplet expansion is mediated by localized activation of CTP:phosphocholine cytidylyltransferase. Cell Metab. 2011;14:504–515. doi: 10.1016/j.cmet.2011.07.013. [DOI] [PMC free article] [PubMed] [Google Scholar]
- Krahmer N, Farese RV, Walther TC. Balancing the fat: lipid droplets and human disease. EMBO Mol Med. 2013a;5:973–983. doi: 10.1002/emmm.201100671. [DOI] [PMC free article] [PubMed] [Google Scholar]
- Krahmer N, Hilger M, Kory N, Wilfling F, Stoehr G, Mann M, Farese RV, Walther TC. Protein correlation profiles identify lipid droplet proteins with high confidence. Mol Cell Proteomics. 2013b;12:1115–1126. doi: 10.1074/mcp.M112.020230. [DOI] [PMC free article] [PubMed] [Google Scholar]
- Lam SS, Martell JD, Kamer KJ, Deerinck TJ, Ellisman MH, Mootha VK, Ting AY. Directed evolution of APEX2 for electron microscopy and proximity labeling. Nat Methods. 2015;12:51–54. doi: 10.1038/nmeth.3179. [DOI] [PMC free article] [PubMed] [Google Scholar]
- Lass A, Zimmermann R, Oberer M, Zechner R. Lipolysis – a highly regulated multi-enzyme complex mediates the catabolism of cellular fat stores. Prog Lipid Res. 2011;50:14–27. doi: 10.1016/j.plipres.2010.10.004. [DOI] [PMC free article] [PubMed] [Google Scholar]
- Li Z, Schulze RJ, Weller SG, Krueger EW, Schott MB, Zhang X, Casey CA, Liu J, Stöckli J, James DE, et al. A novel Rab10-EHBP1-EHD2 complex essential for the autophagic engulfment of lipid droplets. Sci Adv. 2016;2:e1601470. doi: 10.1126/sciadv.1601470. [DOI] [PMC free article] [PubMed] [Google Scholar]
- Listenberger LL, Han X, Lewis SE, Cases S, Farese RV, Ory DS, Schaffer JE. Triglyceride accumulation protects against fatty acid-induced lipotoxicity. Proc Natl Acad Sci USA. 2003;100:3077–3082. doi: 10.1073/pnas.0630588100. [DOI] [PMC free article] [PubMed] [Google Scholar]
- Liu P, Ying Y, Zhao Y, Mundy DI, Zhu M, Anderson RGW. Chinese hamster ovary K2 cell lipid droplets appear to be metabolic organelles involved in membrane traffic. J Biol Chem. 2004;279:3787–3792. doi: 10.1074/jbc.M311945200. [DOI] [PubMed] [Google Scholar]
- Liu P, Bartz R, Zehmer JK, Ying Y, Zhu M, Serrero G, Anderson RGW. Rab-regulated interaction of early endosomes with lipid droplets. Biochim Biophys Acta. 2007;1773:784–793. doi: 10.1016/j.bbamcr.2007.02.004. [DOI] [PMC free article] [PubMed] [Google Scholar]
- Meyer H, Bug M, Bremer S. Emerging functions of the VCP/p97 AAA-ATPase in the ubiquitin system. Nat Cell Biol. 2012;14:117–123. doi: 10.1038/ncb2407. [DOI] [PubMed] [Google Scholar]
- Mick DU, Rodrigues RB, Leib RD, Adams CM, Chien AS, Gygi SP, Nachury MV. Proteomics of primary cilia by proximity labeling. Dev Cell. 2015;35:497–512. doi: 10.1016/j.devcel.2015.10.015. [DOI] [PMC free article] [PubMed] [Google Scholar]
- Nguyen TB, Louie SM, Daniele JR, Tran Q, Dillin A, Zoncu R, Nomura DK, Olzmann JA. DGAT1-Dependent lipid droplet biogenesis protects mitochondrial function during starvation-induced autophagy. Dev Cell. 2017;42:9–21.e5. doi: 10.1016/j.devcel.2017.06.003. [DOI] [PMC free article] [PubMed] [Google Scholar]
- Olzmann JA, Kopito RR, Christianson JC. The mammalian endoplasmic reticulum-associated degradation system. Cold Spring Harb Perspect Biol. 2013a;5 doi: 10.1101/cshperspect.a013185. https://doi.org/10.1101/cshperspect.a013185. [DOI] [PMC free article] [PubMed] [Google Scholar]
- Olzmann JA, Richter CM, Kopito RR. Spatial regulation of UBXD8 and p97/VCP controls ATGL-mediated lipid droplet turnover. Proc Natl Acad Sci USA. 2013b;110:1345–1350. doi: 10.1073/pnas.1213738110. [DOI] [PMC free article] [PubMed] [Google Scholar]
- Peters JM, Walsh MJ, Franke WW. An abundant and ubiquitous homo-oligomeric ring-shaped ATPase particle related to the putative vesicle fusion proteins Sec18p and NSF. EMBO J. 1990;9:1757–1767. doi: 10.1002/j.1460-2075.1990.tb08300.x. [DOI] [PMC free article] [PubMed] [Google Scholar]
- Pol A, Gross SP, Parton RG. Review: biogenesis of the multifunctional lipid droplet: lipids, proteins, and sites. J Cell Biol. 2014;204:635–646. doi: 10.1083/jcb.201311051. [DOI] [PMC free article] [PubMed] [Google Scholar]
- Ran FA, Hsu PD, Wright J, Agarwala V, Scott DA, Zhang F. Genome engineering using the CRISPR-Cas9 system. Nat Protoc. 2013;8:2281–2308. doi: 10.1038/nprot.2013.143. [DOI] [PMC free article] [PubMed] [Google Scholar]
- Rees JS, Li XW, Perrett S, Lilley KS, Jackson AP. Protein neighbors and proximity proteomics. Mol Cell Proteomics. 2015;14:2848–2856. doi: 10.1074/mcp.R115.052902. [DOI] [PMC free article] [PubMed] [Google Scholar]
- Rhee HW, Zou P, Udeshi ND, Martell JD, Mootha VK, Carr SA, Ting AY. Proteomic mapping of mitochondria in living cells via spatially restricted enzymatic tagging. Science. 2013;339:1328–1331. doi: 10.1126/science.1230593. [DOI] [PMC free article] [PubMed] [Google Scholar]
- Ruggiano A, Foresti O, Carvalho P. Quality control: ER-associated degradation: protein quality control and beyond. J Cell Biol. 2014;204:869–879. doi: 10.1083/jcb.201312042. [DOI] [PMC free article] [PubMed] [Google Scholar]
- Ruggiano A, Mora G, Buxó L, Carvalho P. Spatial control of lipid droplet proteins by the ERAD ubiquitin ligase Doa10. EMBO J. 2016;35:1644–1655. doi: 10.15252/embj.201593106. [DOI] [PMC free article] [PubMed] [Google Scholar]
- Schneider CA, Rasband WS, Eliceiri KW. NIH Image to ImageJ: 25 years of image analysis. Nat Methods. 2012;9:671–675. doi: 10.1038/nmeth.2089. [DOI] [PMC free article] [PubMed] [Google Scholar]
- Senkal CE, Salama MF, Snider AJ, Allopenna JJ, Rana NA, Koller A, Hannun YA, Obeid LM. Ceramide is metabolized to acylceramide and stored in lipid droplets. Cell Metab. 2017;25:686–697. doi: 10.1016/j.cmet.2017.02.010. [DOI] [PMC free article] [PubMed] [Google Scholar]
- Shannon P, Markiel A, Ozier O, Baliga NS, Wang JT, Ramage D, Amin N, Schwikowski B, Ideker T. Cytoscape: a software environment for integrated models of biomolecular interaction networks. Genome Res. 2003;13:2498–2504. doi: 10.1101/gr.1239303. [DOI] [PMC free article] [PubMed] [Google Scholar]
- Singh R, Kaushik S, Wang Y, Xiang Y, Novak I, Komatsu M, Tanaka K, Cuervo AM, Czaja MJ. Autophagy regulates lipid metabolism. Nature. 2009;458:1131–1135. doi: 10.1038/nature07976. [DOI] [PMC free article] [PubMed] [Google Scholar]
- Spandl J, Lohmann D, Kuerschner L, Moessinger C, Thiele C. Ancient ubiquitous protein 1 (AUP1) localizes to lipid droplets and binds the E2 ubiquitin conjugase G2 (Ube2g2) via its G2 binding region. J Biol Chem. 2011;286:5599–5606. doi: 10.1074/jbc.M110.190785. [DOI] [PMC free article] [PubMed] [Google Scholar]
- Stevenson J, Krycer JR, Phan L, Brown AJ. A practical comparison of ligation-independent cloning techniques. PLoS One. 2013;8:e83888. doi: 10.1371/journal.pone.0083888. [DOI] [PMC free article] [PubMed] [Google Scholar]
- Stevenson J, Huang EY, Olzmann JA. Endoplasmic reticulum-associated degradation and lipid homeostasis. Annu Rev Nutr. 2016;36:511–542. doi: 10.1146/annurev-nutr-071715-051030. [DOI] [PMC free article] [PubMed] [Google Scholar]
- Supek F, Bošnjak M, Škunca N, Šmuc T. REVIGO summarizes and visualizes long lists of gene ontology terms. PLoS One. 2011;6:e21800. doi: 10.1371/journal.pone.0021800. [DOI] [PMC free article] [PubMed] [Google Scholar]
- Suzuki M, Otsuka T, Ohsaki Y, Cheng J, Taniguchi T, Hashimoto H, Taniguchi H, Fujimoto T. Derlin-1 and UBXD8 are engaged in dislocation and degradation of lipidated ApoB-100 at lipid droplets. Mol Biol Cell. 2012;23:800–810. doi: 10.1091/mbc.E11-11-0950. [DOI] [PMC free article] [PubMed] [Google Scholar]
- Sztalryd C, Xu G, Dorward H, Tansey JT, Contreras JA, Kimmel AR, Londos C. Perilipin A is essential for the translocation of hormone-sensitive lipase during lipolytic activation. J Cell Biol. 2003;161:1093–1103. doi: 10.1083/jcb.200210169. [DOI] [PMC free article] [PubMed] [Google Scholar]
- To M, Peterson CWH, Roberts MA, Counihan JL, Wu TT, Forster MS, Nomura DK, Olzmann JA. Lipid disequilibrium disrupts ER proteostasis by impairing ERAD substrate glycan trimming and dislocation. Mol Biol Cell. 2017;28:270–284. doi: 10.1091/mbc.E16-07-0483. [DOI] [PMC free article] [PubMed] [Google Scholar]
- Tyler RE, Pearce MMP, Shaler TA, Olzmann JA, Greenblatt EJ, Kopito RR. Unassembled CD147 is an endogenous endoplasmic reticulum-associated degradation substrate. Mol Biol Cell. 2012;23:4668–4678. doi: 10.1091/mbc.E12-06-0428. [DOI] [PMC free article] [PubMed] [Google Scholar]
- Walther TC, Farese RV. Lipid droplets and cellular lipid metabolism. Annu Rev Biochem. 2012;81:687–714. doi: 10.1146/annurev-biochem-061009-102430. [DOI] [PMC free article] [PubMed] [Google Scholar]
- Wang H, Becuwe M, Housden BE, Chitraju C, Porras AJ, Graham MM, Liu XN, Thiam AR, Savage DB, Agarwal AK, et al. Seipin is required for converting nascent to mature lipid droplets. Elife. 2016;5 doi: 10.7554/eLife.16582. https://doi.org/10.7554/eLife.16582. [DOI] [PMC free article] [PubMed] [Google Scholar]
- Wilfling F, Wang H, Haas JT, Krahmer N, Gould TJ, Uchida A, Cheng JX, Graham M, Christiano R, Fröhlich F, et al. Triacylglycerol synthesis enzymes mediate lipid droplet growth by relocalizing from the ER to lipid droplets. Dev Cell. 2013;24:384–399. doi: 10.1016/j.devcel.2013.01.013. [DOI] [PMC free article] [PubMed] [Google Scholar]
- Zhang S, Wang Y, Cui L, Deng Y, Xu S, Yu J, Cichello S, Serrero G, Ying Y, Liu P. Morphologically and functionally distinct lipid droplet subpopulations. Sci Rep. 2016;6:29539. doi: 10.1038/srep29539. [DOI] [PMC free article] [PubMed] [Google Scholar]
- Zurek N, Sparks L, Voeltz G. Reticulon short hairpin transmembrane domains are used to shape ER tubules. Traffic. 2011;12:28–41. doi: 10.1111/j.1600-0854.2010.01134.x. [DOI] [PMC free article] [PubMed] [Google Scholar]
Associated Data
This section collects any data citations, data availability statements, or supplementary materials included in this article.