

Summary
The unicellular green alga Lobomonas rostrata requires an external supply of vitamin B12 (cobalamin) for growth, which it can obtain in stable laboratory cultures from the soil bacterium Mesorhizobium loti in exchange for photosynthate. We investigated changes in protein expression in the alga that allow it to engage in this mutualism.
We used quantitative isobaric tagging (iTRAQ) proteomics to determine the L. rostrata proteome grown axenically with B12 supplementation or in coculture with M. loti. Data are available via ProteomeXchange (PXD005046).
Using the related Chlamydomonas reinhardtii as a reference genome, 588 algal proteins could be identified. Enzymes of amino acid biosynthesis were higher in coculture than in axenic culture, and this was reflected in increased amounts of total cellular protein and several free amino acids. A number of heat shock proteins were also elevated. Conversely, photosynthetic proteins and those of chloroplast protein synthesis were significantly lower in L. rostrata cells in coculture. These observations were confirmed by measurement of electron transfer rates in cells grown under the two conditions.
The results indicate that, despite the stability of the mutualism, L. rostrata experiences stress in coculture with M. loti, and must adjust its metabolism accordingly.
Keywords: iTRAQ proteomics, Lobomonas rostrata, Mesorhizobium loti, mutualism, photosynthesis, vitamin B12
Introduction
Microalgae are a polyphyletic set of photosynthetic eukaryotes found across the eukaryotic tree of life which are estimated to be responsible for c. 50% of global CO2 fixation (Falkowski, 1998). In both soil and aquatic (marine and freshwater) habitats, algae exist alongside a wide spectrum of other microbes, including bacteria, archaea, fungi and cyanobacteria. This has led to millions of years of coevolution between contemporaneous species. It is therefore not surprising that a broad range of interactions between different microbial players within the ecosystem have been observed. As well as harmful interactions (Fernandes et al., 2011), many examples of beneficial associations have been documented between algae and bacteria, including promotion of algal growth (Park et al., 2008), support of cellular differentiation (Matsuo et al., 2005), provision of bactericidal/algaecidal protection (Hold et al., 2001; Geng et al., 2008; Thiel et al., 2010), stress tolerance (Xie et al., 2013), and hormonal stimulation (Ashen et al., 1999; Amin et al., 2015). Underpinning many mutualistic interactions is nutrient exchange (Cooper & Smith, 2015), where algal photosynthate is exchanged for micronutrients provided by bacteria, for example by facilitation of iron uptake (Amin et al., 2009), or provision of the vitamins thiamine (vitamin B1) (Paerl et al., 2015) or cobalamin (vitamin B12) (Croft et al., 2005; Wagner‐Döbler et al., 2010; Kazamia et al., 2012; Durham et al., 2015). Vitamins are organic micronutrients, which perform essential functions within the cell as enzyme cofactors. Increasingly, it is recognized that many algae, despite their photosynthetic lifestyles, require an exogenous source of one or more of these compounds, or their precursors, for growth (reviewed in Helliwell, 2017). Analysis of environmental samples has detected the co‐occurrence of bacterial producers and algal requirers of cobalamin in a variety of marine environments (Koch et al., 2013; Bertrand et al., 2015), and fertilization experiments have demonstrated that these compounds are limiting for algal productivity (Koch et al., 2012), providing evidence that algal–bacterial interactions are likely to be widespread and of considerable significance for global net primary production.
Cobalamin is required by over 50% of all microalgal species surveyed (Croft et al., 2005), but with no phylogenetic relationship between dependent and nondependent species, implying that this trait has arisen multiple times during algal evolution. The requirement for cobalamin is as a cofactor for B12‐dependent methionine synthase (METH), which is involved in the synthesis of the amino acid methionine, as well as more generally in cellular C1 metabolism. Species that do not require vitamin B12 have an alternative, B12‐independent, enzyme, METE (Helliwell et al., 2011), which performs the same function, albeit at lower efficiency (González et al., 1992; Croft et al., 2005; Helliwell et al., 2015). Several species of algae, such as Chlamydomonas reinhardtii and Phaeodactylum tricornutum, encode both isoforms of methionine synthase, and can use METE when B12 is not available. The presence of an external supply of the vitamin allows these species to use METH, and at the same time METE gene expression is repressed, in both laboratory cultures (Helliwell et al., 2011; Bertrand et al., 2012) and environmental samples (Bertrand et al., 2015). Long‐term exposure to B12 in the environment might therefore lead to loss of the METE gene, and indeed an metE mutant was generated by an experimental evolution approach after growth of C. reinhardtii cells in B12 for c. 500 generations (Helliwell et al., 2015). It is conceivable, therefore, that interactions with B12‐producing bacteria in the environment over evolutionary time might lead to the frequent loss of METE in diverse algal lineages (Kazamia et al., 2016), which would account for the widespread occurrence of B12 auxotrophy across the algal lineages.
A major challenge now is to dissect the specific molecular mechanisms that underpin the exchange of cobalamin, but this is difficult in the dilute conditions of the aquatic environment. To study aspects such as signalling, regulation, transporter proteins and dynamics over time, defined model systems are required. In our laboratory we developed a model partnership between the vitamin B12‐requiring freshwater green alga Lobomonas rostrata, a close relative of C. reinhardtii, and the rhizobial bacterium Mesorhizobium loti, which supplies vitamin B12 in exchange for fixed carbon (Kazamia et al., 2012). Although a synthetic interaction, the ease with which it formed mirrors that of other artificial systems, such as the mutualism established between C. reinhardtii and the yeast Saccharomyces cerevisiae based on the exchange of carbon and nitrogen (Hom & Murray, 2014). Moreover, physiological experiments with our L. rostrata and M. loti cocultures under both batch and semicontinuous conditions revealed that an equilibrium in terms of cell number was established and maintained (Kazamia et al., 2012), demonstrating that the partnership exhibits a degree of regulation. The direct exchange of B12 could be modelled using growth dynamics of algal–bacterial cocultures (Grant et al., 2014), and the model implicated specific release from live bacterial cells, rather than simply release of the vitamin once the cells had died and lysed. With this observation of true mutualism between the algae and bacteria, we might expect specific metabolic changes in L. rostrata when grown in coculture, as compared with axenic growth with B12 supplementation.
Genome‐scale approaches to dissect metabolic shifts occurring on account of interspecies microbial interactions have been applied to a variety of different phytoplankton–bacteria coculture systems. Such work has revealed important insights into alterations in core metabolism, including amino acid biosynthesis in associations between cyanobacteria and heterotrophic bacteria (Beliaev et al., 2014; Biller et al., 2016), as well as sulphur cycling (Durham et al., 2015), and signalling and production of infochemicals (Amin et al., 2015) in diatom–bacterial interactions. However, the majority of the studies were at the transcript level, whereas it is proteins that are responsible for performing cellular processes. A requirement for proteomics analyses is the need for databases of peptides that can be matched to experimental mass spectra. Until recently, this required annotated genome sequence information of the organism under study, which is not currently available for L. rostrata, but as more organisms have been sequenced, this has resulted in many more shared peptides in the databases. In this study, we performed a series of preliminary bioinformatics and proteomics experiments to evaluate the applicability of the global quantitative proteomics chemical isobaric tags (iTRAQ) methodology to our system. Once the feasibility was confirmed, the approach was used to identify metabolic differences between L. rostrata cells grown in media supplemented with vitamin B12 and those grown in cultures where B12 is provided by M. loti in a mutualistic exchange. This has provided novel insights into the metabolic consequences of mutualism between a photosynthetic green alga and its heterotrophic bacterial partner.
Materials and Methods
Algal and bacterial strains and cultivation
Lobomonas rostrata (SAG 45‐1) was obtained from the Experimental Phycology and Culture Collection of Algae at the University of Goettingen (EPSAG), Germany. It was grown autotrophically on TP+ medium (Kazamia et al., 2012). Vitamin B12 was provided as cyanocobalamin (Sigma‐Aldrich) at 100 ng l−1, as this supports the maximum carrying capacity of L. rostrata (Kazamia et al., 2012). The L. rostrata–M. loti coculture was an established coculture that had been maintained over many generations without a source of organic carbon or vitamin B12. Cultures were maintained on a 16 : 8 h, light : dark cycle, with shaking (140 rpm) at 25°C. M. loti (MAFF 303099) was a gift from Prof. Allan Downie at the John Innes Centre, Norwich, UK. It was maintained axenically in TP+ with 0.1% v/v glycerol at 28°C. Cells were harvested by centrifugation, and, if not analysed immediately, cell pellets were frozen in liquid N2 and stored at −80°C. Algal cell counts were determined using a Dual Threshold Beckman Coulter (Z2) Particle Counter and Size Analyser (Indianapolis, IN, USA). Bacterial cell numbers were determined by plating on solid media.
Protein preparation and iTRAQ labelling
Full experimental details are provided in Supporting Information Methods S1. In brief, cultures were harvested at 3000 g for 10 min at 4°C. The resulting cell pellets were washed in 0.5 M triethylammonium bicarbonate buffer, and then extracted by grinding in liquid nitrogen and sonication. Insoluble protein was removed by centrifugation. The soluble protein fraction was precipitated using acetone, then the resuspended pellet was reduced with tris‐(2‐carboxyethyl)‐phosphine, followed by alkylation with methyl methanethiosulfonate in isopropanol. Samples were digested with trypsin and the resulting peptides were either taken forward for mass spectrometry analysis for preliminary proteomics analysis or labelled with iTRAQ reagents following the manufacturer's instructions (AB Sciex, Famingham, MA, USA). Labels 113, 114, 115 and 116 were used to label biological replicates of L. rostrata cells cultured with B12 supplemented in the media, and labels 117, 118, 119 and 121 were used for L. rostrata cells cultured with M. loti.
Hydrophilic interaction liquid chromatography and mass spectrometry
All eight labelled peptide samples were combined before being dried in a vacuum concentrator (Concentrator 5301; Eppendorf, Stevenage, UK). The sample was resuspended in 200 μl of buffer A (10 mM ammonium formate, 90% ACN, pH 3 (adjusted with formic acid)) and 100 μl was loaded onto a PolyHydroxyethyl A column (particle size, 5 μm; length, 20 cm; diameter, 2.1 mm; pore size, 200 Å; PolyLC, Colombia, MD, USA) using an Agilent 1100‐series HPLC (Agilent, Wokingham, UK). With a flow of 0.5 ml min−1, buffer A was exchanged with buffer B (10 mM ammonium formate, 10% ACN, pH 4 (adjusted with formic acid)) to form a linear gradient as follows: 0% B (0–5 min), 0–15% B (5–7 min), 15% B (7–10 min), 15–60% B (10–50 min), 60–100% B (50–55 min), 100% B (55–65 min), 0% B (65–75 min). Beginning at 18 min, 22 fractions of 1 min length, followed by three fractions of 3 min length were collected and dried by vacuum centrifugation ready for reverse‐phase LC‐MS/MS.
Liquid chromatography‐tandem mass spectrometry was conducted using an Ultimate 3000 high‐performance liquid chromatograph (Dionex, Sunnyvale, CA, USA) coupled to a QStar XL Hybrid electrospray ionization (ESI) quadrupole time‐of‐flight tandem mass spectrometer (Applied Biosystems (now ABSciex), Framingham, MA, USA). Samples were resuspended in 20 μl buffer A (3% ACN, 0.1% FA) before loading 9 μl onto a Acclaim PepMap 100 C18 column (particle size, 3 μm; length, 15 cm; diameter, 75 μm; pore size, 100 Å; Dionex, Sunnyvale, CA, USA). With a flow of 300 μl min−1 buffer A was exchanged with buffer B (97% ACN, 0.1% FA) to form a linear gradient as follows. 3% B (05 min), 3–35% B (5–95 min), 35–90% B (95–97 min), 90% B (97–102 min), 3% B (102–130 min). The mass detector range was set to 350–1800 m/z and operated in positive ion mode. Peptides with +2, +3, and +4 were selected for fragmentation. The mass spectrometry proteomics data have been deposited to the ProteomeXchange Consortium via the PRIDE (Vizcaíno et al., 2014) partner repository with the dataset identifier PXD005046.
Protein identification and quantification
The work flow for proteomic identifications is shown in Fig. S1. Searches were conducted using Mascot, Ommsa, X!Tandem, Peaks and ProteinPilot against the Uniprot reference proteome for C. reinhardtii (Uniprot ID 3055) and M. loti (Uniprot ID 266835). Each search was conducted with the target‐decoy database method to calculate false discovery rate (FDR; Elias & Gygi, 2007). The decoy was formed using either reversed sequences (Mascot, Ommsa, X!Tandem and ProteinPilot) or randomized sequence (Peaks) of the C. reinhardtii and M. loti proteomes. Searches were restricted to a peptide FDR of 3% before decoy hits were removed at the peptide spectral match (PSM) level. PSMs are the individual matches made by the search engine algorithm between the mass spectrometer's output product ion scan and the potential peptides contained within the search database. They combine to form the peptide and protein identifications. PSMs from the five search engines were merged using an R‐based script that also removed PSMs showing disagreement in terms of peptide assignment or protein identification between the search engines, as performed previously (Longworth et al., 2016). Separately, reporter ion intensities for each PSM were extracted and matched to the merged results. For quantitation, these reporter ion intensities were extracted followed by variance stabilization normalization, isotopic correction and median correction, and finally averaging by protein. To avoid using arbitrary thresholds for highlighting differentially expressed proteins, a t‐test was performed between replicate conditions to determine significance with fold change. Transmembrane domains were identified using Tmhmm server 2.0 (http://www.cbs.dtu.dk/services/TMHMM/). We identified all putative transmembrane domains in each of the proteins identified in the iTRAQ experiment. If a sequence had one or more transmembrane domains, this was classified as likely to be membrane‐associated rather than soluble.
Analytical methods
Maximum potential photosynthetic capacity as electron transfer rate (ETR) was estimated using pulse amplitude modulation (PAM). Cells were prepared to a density of 2.5 × 10⁶ cells ml−1, placed in cuvettes and mixed with a magnetic stirrer in order to maintain an even cell suspension. Instant light response curves of Chl fluorescence were generated for each sample using a Mini‐PAM (Heinz Walz GmbH, Effeltrich, Germany). The ETR was calculated as follows:
| (Eqn 1) |
where Y/1000 is equal to (F m′ − F)/F m′, or ΦPSII, the quantum yield of photosystem II. The ETR factor described refers to the fraction of incident photons absorbed by the sample, for which a default value of 0.83 was used (Maxwell & Johnson, 2000).
Protein was measured using Bradford's reagent as previously described (Bradford, 1976) using BSA as a standard. For amino acid analysis, full experimental details are provided in the Supporting Information Methods S1. In brief, c. 5 mg of a freeze‐dried sample of cultures were extracted in acetonitrile, and then re‐extracted with 20% methanol spiked with an internal standard containing stable isotope‐labelled amino acids (l‐amino acid mix; Sigma‐Aldrich). The supernatants were pooled and amino acids were derivatised with an AccQ•Tag Ultra derivatization kit (Waters Corp., Milford, MA, USA). HPLC‐ESI‐MS/MS quantitative analysis of the amino acids was performed using an Agilent 6420B triple quadrupole (QQQ) mass spectrometer (Agilent Technologies, Palo Alto, CA, USA). All ions were scanned in positive ion mode and given a dwell time of 50 ms. Data analysis was undertaken using Agilent Mass Hunter Quantitative analysis software for QQQ (v.B.07.01). Accurate quantification used the stable isotope‐labelled internal standards added during sample extraction, and data were normalized to the DW of the samples.
Reverse transcriptase‐quantitative polymerase chain reaction (RT‐qPCR)
RNA was extracted from the cell pellet from 10 ml of day 14 (late‐log) cultures using RNeasy Plant Mini Kit (Qiagen), treated with Turbo DNA‐free™ kit (Ambion) to remove genomic DNA, and reverse‐transcribed with the Superscript III First‐trand synthesis system for RT‐PCR (Invitrogen). Selected C. reinhardtii coding sequences from the NCBI database were aligned with scaffolds produced from L. rostrata RNA‐seq data (U.J. Kudahl et al., unpublished) in order to find genes of interest; homologues were found to be 90% similar at the nucleotide level. Primers were designed with melting temperatures of 61–63°C, and to amplify products of 150–200 nucleotides (Untergasser et al., 2012), and the sequences are shown in Table S1. Quantitative PCR reactions were prepared in 10 μl volumes using SYBR Green JumpStart™ Taq ReadyMix™ (Sigma‐Aldrich). Reactions were performed in a Rotor‐Gene Q (Qiagen) with an initial denaturation at 95°C for 2 min followed by cycling 45 times between 58°C for 30 s and 95°C for 15 s, and finally a melt curve was generated by increasing the temperature from 55 to 95°C in 1°C steps held for 5 s. Amplification efficiency and cycle threshold values were calculated with the Rotor‐Gene Q software v.2.02. Quantification and normalization were carried out using the Pfaffl model (Pfaffl, 2001) with three reference genes: Ubiquitin (UBQ), Eukaryotic translation initiation factor 4A (EIF4A) and Receptor of activated protein kinase C1 (RACK1) (Mus et al., 2007).
Results
Preliminary bioinformatics and proteomic analyses
To ascertain whether it was feasible to use iTRAQ for global analysis of the proteome of unsequenced L. rostrata, a series of preliminary experiments was carried out. The first aim was to find a suitable reference proteome for matching experimental spectra sourced from L. rostrata. This process relies on shared peptides from sequenced organisms being present within existing protein databases. The closely related freshwater green alga C. reinhardtii (Uniprot ID 3055) was a prime candidate and also has the advantage of having a relatively well annotated genome (https://phytozome.jgi.doe.gov/pz/portal.html). A search against C. reinhardtii produced 1% PSMs, similar to a previous cross‐species proteomics study (Pandhal et al., 2008), implying that sufficient proteins could be identified in a global proteomics study to uncover biological insights into the metabolic processes of the unsequenced alga.
Our iTRAQ experiment was aimed at identifying proteins from organisms in coculture, so proteins from both L. rostrata and M. loti would be present. Therefore, it was important to consider the possibility that shared peptides between the two organisms might influence the results, namely that peptides from M. loti might be assumed to be from L. rostrata, and thus interfere with protein quantifications. To evaluate this, a theoretical tryptic digest was undertaken. The identification of shared peptides between the alga and bacteria was done using protein sequences for M. loti and C. reinhardtii retrieved from Uniprot (02‐07‐2016 ). A python script was written to read the protein sequences and theoretically digest them into tryptic peptides, by cleaving them after arginine and lysine unless followed by a proline. Peptides between six and 16 amino acids long were identified and compared, calculating the shared fraction using the total number of unique peptides in C. reinhardtii. The result was that 0.31% of tryptic peptides within this size range were shared between C. reinhardtii and M. loti. Given this low number, and the close phylogenetic relationship between C. reinhardtii and L. rostrata, it was unlikely that interpretation of the iTRAQ experiment would be confounded by peptides shared between the alga and bacterium in the cocultures.
Finally, the iTRAQ approach rests on the relative quantification of peptides across samples, with the general assumption that proteins are present in all samples, whereas in our study comparing cocultures and axenic cultures of L. rostrata, only half would contain M. loti cells. Moreover, the aim of the experiment was to look for metabolic differences in L. rostrata under the two conditions, and therefore it would be ideal to minimize spectra sourced from M. loti, which could potentially reduce the total alga spectra generated per sample injection. This was potentially problematic, as the ratio of cell counts for L. rostrata to M. loti cells in stable cocultures is between 1 : 30 and 1 : 100 (Kazamia et al., 2012), averaging 1 : 50 in the samples used for the iTRAQ experiment here. Moreover, proteins from sequenced organisms are more likely to be identified compared with those from unsequenced organisms, in bottom‐up proteomics experiments. The latter was confirmed with proteins from axenic cultures of M. loti, where the PSM was 11% (compared with 1% PSM for L. rostrata). However, the much larger algal cell volume (c. 500 μm3, compared with c. 0.5 μm3 for the bacteria) means that in the coculture this would correspond to significantly more algal protein than bacterial protein, even with the higher number of bacterial cells. In order to test this, a protein per cell measurement was made for axenic cultures of the two organisms, and found to be 2.29 × 10⁻⁷ mg cell−1 for L. rostrata and 3.25 × 10⁻¹⁰ mg cell−1 for M. loti. At the cell densities in the coculture, this corresponds to c. 0.45 mg ml−1 for L. rostrata protein, compared with 0.033 mg ml−1 for M. loti, a 14‐fold higher amount. This, together with the nature of peptide fractionation in bottom‐up mass spectrometry‐based proteomics, where there is a bias towards identification of high‐abundance peptides and thus proteins, provided confidence in our approach.
Overview of the L. rostrata proteome determined by iTRAQ analysis
Having established the parameters and methodology for the experiment, four biological replicates of both axenic L. rostrata supplemented with 100 ng l−1 B12 and established cocultures of L. rostrata and M. loti were grown in autotrophic medium. Cells were harvested after 14 d when the algae were at mid‐to‐late exponential growth phase (Fig. S2), and total soluble protein was extracted for proteomic analysis. Altogether, 588 proteins were identified based on one high‐confidence peptide hit, and about half of these (293) had a minimum of two high‐confidence peptide hits per protein. A total of 47 proteins were predicted to be membrane‐associated by virtue of the presence of at least one transmembrane domain. A search of the same mass spectral data against the M. loti database (Uniprot ID 266835) identified just four proteins (all based on one high‐confidence peptide hit), indicating that the vast majority of proteins identified were of algal origin. Comparison of proteins from the two different conditions revealed 153 proteins that were significantly differentially expressed (P > 0.05). Of these, 70 were present in higher amounts in L. rostrata when grown with M. loti in comparison to the axenic condition, and 83 were less abundant. A heat map representation of these data showing fold changes between co‐ and monoculture illustrates the consistency between individual replicates of the treatments (Fig. S3).
Comparative proteomics reveals fundamental changes in metabolism of L. rostrata when grown in coculture with M. loti
To establish how the metabolism of L. rostrata differed between the two treatments, we used a combined KEGG/Mercator‐based analysis (Kanehisa & Goto, 2000; Lohse et al., 2014) to assign function to the differentially expressed proteins, and to classify them into particular cellular processes and metabolic pathways (Table 1; Fig. 1). This analysis revealed that the metabolic processes most affected were those involved in protein metabolism (38 proteins, 24.8% of total), amino acid metabolism (23 proteins, 15%) and photosynthesis (24 proteins, 15.7%). Within the first category, which included those involved in general protein metabolism, translation, targeting and folding, about half were found in higher abundance in cocultured L. rostrata than in axenic culture, and half in lower amounts. Several chaperonins were elevated, along with cytosolic elongation and initiation factors. Four ribosomal proteins (S19, S20, L12 and L40) were in higher amounts, although another four (S2, S9, L3 and L8) were reduced. Strikingly, of the remaining 16 proteins of protein metabolism that were lower in cocultures, 15 were those of plastid protein synthesis, including several ribosomal proteins and elongation factors EF‐Tu and EF‐G.
Table 1.
List of identified proteins altered in abundance in cocultures of Lobomonas rostrata vs axenic cultures
| General function | Uniprot entry | Protein ID | Protein function | Fold‐change |
|---|---|---|---|---|
| Protein metabolism | A8ISZ1 | EF‐3 | Elongation factor EF‐3 | 2.69 |
| A8HX38 | eEF1a1 | Eukaryotic translation elongation factor 1 alpha 1 (EC 3.6.5.3) | 2.55 | |
| A8J597 | RPL12 | Ribosomal protein L12 | 2.42 | |
| I2FKQ9 | CPN60C | Mitochondrial chaperonin 60 | 2.41 | |
| A8J8M9 | RPS20 | Ribosomal protein S20 | 2.18 | |
| A8J7C8 | KtRS | Lysine–tRNA ligase (EC 6.1.1.6) (Lysyl‐tRNA synthetase) | 2.00 | |
| Q66YD0 | VIPP1 | Chloroplast vesicle‐inducing protein in plastids 1 | 1.98 | |
| A8J5Z0 | RPP0 | Acidic ribosomal protein P0 | 1.93 | |
| A8I403 | RPS19 | Ribosomal protein S19 | 1.89 | |
| A8HTK7 | TBA1 | PsbA translation factor | 1.72 | |
| A8JIB7 | CPN60A | Chaperonin 60A | 1.72 | |
| P25840 | HSP70 | Heat shock 70 kDa protein | 1.70 | |
| A8ITH8 | CPN60B2 | Chaperonin 60B2 | 1.52 | |
| A8JHX9 | EFG2 | Elongation factor 2 (EC 3.6.5.3) | 1.51 | |
| A8JCX9 | RPL40 | Ribosomal protein L40 | 1.44 | |
| A8J9Q1 | IPA1 | Importin subunit alpha | 1.33 | |
| A8I232 | EIF2G | Eukaryotic initiation factor | 1.28 | |
| A8JIE0 | CPN20 | Chaperonin 20 | 1.17 | |
| A8IV59 | TIIC22 | 22 kDa translocon at the inner membrane of chloroplasts (Fragment) | −1.14 | |
| A8J7T7 | CEP1 | Cysteine endopeptidase | −1.16 | |
| Q70DX8 | S1PRPS1 | Plastid ribosomal protein S1 (Ribosomal protein S1 homologue) | −1.27 | |
| P17746 | TUFA | Elongation factor Tu, chloroplastic (EF‐Tu) | −1.30 | |
| E3SC57 | RPL3 | 60S ribosomal protein L3 (Fragment) | −1.34 | |
| Q5QEB2 | EFTs | Elongation factor Ts | −1.34 | |
| A8HME4 | RPS2 | Ribosomal protein S2 | −1.37 | |
| A8IA39 | EFG1 | Chloroplast elongation factor G (EC 3.6.5.3) | −1.41 | |
| A8J282 | CYN20 | Peptidyl‐prolyl cis‐trans isomerase (EC 5.2.1.8) plastid | −1.41 | |
| E3SC50 | RPS9 | 40S ribosomal protein S9 (Fragment) | −1.42 | |
| Q6Y683 | RAP41 | 41 kDa ribosome‐associated protein (chloroplast) | −1.49 | |
| Q6Y682 | RAP38 | 38 kDa ribosome‐associated protein (Chloroplast stem‐loop‐binding protein) | −1.52 | |
| Q8HTL1 | RPL5 | 50S ribosomal protein L5, chloroplastic | −1.52 | |
| A8IVK1 | RPL8 | Ribosomal protein L8 | −1.53 | |
| Q84U21 | ERY2 | 50S ribosomal protein L22, chloroplastic | −1.60 | |
| Q7Y258 | PRPS5 | Ribosomal protein S5 (plastid) | −1.61 | |
| Q8GV23 | NAB1 | Nucleic acid binding protein (Putative nucleic acid binding protein) | −1.90 | |
| A8I8Z4 | PRPL1 | Plastid ribosomal protein L1 | −1.91 | |
| A8IRU6 | CYN38 | Peptidyl‐prolyl cis‐trans isomerase, cyclophilin‐type (plastid) | −1.97 | |
| O20032 | RPS18 | 30S ribosomal protein S18, chloroplastic | −1.98 | |
| A8HWS8 | PRPL28 | Plastid ribosomal protein L28 | −2.75 | |
| Photosynthetic electron transfer | A8IV40 | Fd | Apoferredoxin | −1.18 |
| A8I9I9 | Re | Rieske ferredoxin | −1.19 | |
| A8J0E4 | PSBO | Oxygen‐evolving enhancer protein 1 of photosystem II | −1.21 | |
| A8HXL8 | ATPC | Chloroplast ATP synthase gamma chain | −1.25 | |
| B7U1J0 | ATPA | ATP synthase subunit alpha, chloroplastic (EC 3.6.3.14) | −1.32 | |
| Q6PSL4 | HYDG | Fe‐hydrogenase assembly protein (Hydrogenase assembly factor) | −1.36 | |
| A8J6Y8 | FNR2 | Ferredoxin–NADP reductase (EC 1.18.1.2) | −1.63 | |
| P53991 | PETH | Ferredoxin–NADP reductase, chloroplastic (FNR) (EC 1.18.1.2) | −1.66 | |
| Carbon assimilation | A8IVM9 | GCSP | Glycine cleavage system, P protein (EC 1.4.4.2) | −1.15 |
| Q6SA05 | RCA1 | Rubisco activase | −1.23 | |
| P23489 | RA | Ribulose bisphosphate carboxylase/oxygenase activase, chloroplastic | −1.36 | |
| Q0ZAZ1 | GDH | Glycolate dehydrogenase | −1.37 | |
| A8HP84 | GAP3 | Glyceraldehyde‐3‐phosphate dehydrogenase (EC 1.2.1.12) (EC 4.3.2.1) | −1.47 | |
| A8IPI7 | HPR1 | Hydroxypyruvate reductase | −1.51 | |
| A8IRK4 | SEBP1 | Sedoheptulose‐1,7‐bisphosphatase (EC 3.1.3.37) | −1.53 | |
| A8IKW6 | RPE1 | Ribulose‐phosphate 3‐epimerase (EC 5.1.3.1) | −1.57 | |
| A8I5A0 | CPLD45 | Predicted protein | −1.58 | |
| A8IKQ0 | FBP1 | Fructose‐1,6‐bisphosphatase (EC 3.1.3.11) | −1.65 | |
| Q42690 | FBA1 | Fructose‐bisphosphate aldolase 1, chloroplastic (EC 4.1.2.13) | −1.71 | |
| A8IRQ1 | RPI1 | Ribose‐5‐phosphate isomerase (EC 5.3.1.6) | −1.72 | |
| Q75NZ2 | LCIB | Low‐CO2 inducible protein LCIB | −1.77 | |
| A8JC04 | PGK1 | Phosphoglycerate kinase (EC 2.7.2.3) | −1.81 | |
| P93109 | CA2 | Beta‐carbonic anhydrase | −1.95 | |
| Q39589 | BETA‐CA1 | Carbonic anhydrase | −2.91 | |
| Starch metabolism | Q2VA40 | PHOA | Phosphorylase (EC 2.4.1.1) | 1.48 |
| Q2VA41 | PHOB | Phosphorylase (EC 2.4.1.1) | 1.42 | |
| A8HS14 | STA1 | ADP‐glucose pyrophosphorylase (EC 2.7.7.27) | −1.23 | |
| Q9LLL6 | STA6 | ADP‐glucose pyrophosphorylase (EC 2.7.7.27) | −1.34 | |
| O64926 | SS | Soluble starch synthase (EC 2.4.1.21) | −1.81 | |
| Glycolysis | A8JHR9 | GAP1A | Glyceraldehyde 3‐phosphate dehydrogenase, dominant splicing variant (EC 1.2.1.12) | 3.01 |
| A8 IE23 | PGI1 | Glucose‐6‐phosphate isomerase (EC 5.3.1.9) | −1.22 | |
| A8IVR6 | PYK2 | Pyruvate kinase (EC 2.7.1.40) | −1.70 | |
| A8JC04 | PGK1 | Phosphoglycerate kinase (EC 2.7.2.3) | −1.81 | |
| TCA cycle | A8J2S0 | CIS2 | Citrate synthase (EC 2.3.3.1) | 1.82 |
| A8JHC9 | CIS1 | Citrate synthase | 1.49 | |
| A8HMQ1 | ACH1 | Aconitate hydratase (EC 4.2.1.3) | 1.41 | |
| Q9FNS5 | MDH5 | NADP‐Malate dehydrogenase (EC 1.1.1.82) | −1.27 | |
| A8HPL8 | DLD2 | Dihydrolipoamide dehydrogenase (EC 1.8.1.4) | −1.58 | |
| A8J7F6 | DLA2 | Dihydrolipoamide acetyltransferase (EC 2.3.1.12) | −1.59 | |
| Mitochondrial electron transfer chain | A8JDV9 | ATP3 | F1F0 ATP synthase gamma subunit | −1.17 |
| Q96550 | ATPA | ATP synthase subunit alpha | −1.32 | |
| Q6V9B1 | NUOS8 | NADH:ubiquinone oxidoreductase subunit 8 (EC 1.6.5.3) | −1.32 | |
| A8IVJ7 | NUOS1 | NADH:ubiquinone oxidoreductase 76 kDa subunit | −1.49 | |
| Q6V9A8 | NUO7 | NADH:ubiquinone oxidoreductase 49 kD subunit (EC 1.6.5.3) | −1.77 | |
| Fatty acid biosynthesis | A8HPL8 | DLD2* | Dihydrolipoamide dehydrogenase (EC 1.8.1.4) | −1.58 |
| A8J7F6 | DLA2* | Dihydrolipoamide acetyltransferase (EC 2.3.1.12) | −1.59 | |
| A8JFI7 | EAR | enoyl ACP reductase | −1.92 | |
| A8JGF4 | BC | Biotin carboxylase, acetyl‐CoA carboxylase component | −1.98 | |
| Tetrapyrrole metabolism | A8I980 | ALAD | Delta‐aminolevulinic acid dehydratase (EC 4.2.1.24) | 1.41 |
| A8J7H3 | GSA | Glutamate‐1‐semialdehyde aminotransferase (EC 5.4.3.8) | −1.23 | |
| A8HNE8 | CHLP | Geranylgeranyl reductase (EC 1.3.1.‐) | −1.33 | |
| A8HPJ2 | POR | Light‐dependent protochlorophyllide reductase (EC 1.3.1.33) | −1.59 | |
| Amino acid metabolism | A8IH03 | PSAT | Phosphoserine aminotransferase (EC 2.6.1.52) | 3.11 |
| A8J786 | HIS7 | Imidazole glycerol phosphate synthase (Fragment) | 2.95 | |
| A8J2X6 | AGGPR | N‐acetyl‐gamma‐glutamyl‐phosphate reductase | 2.29 | |
| A8HXS9 | LEU2 | Isopropylmalate synthase (EC 2.3.3.13) (Fragment) | 2.18 | |
| A8IXE0 | SAHH | S‐Adenosylhomocysteine hydrolase (EC 3.3.1.1) | 1.99 | |
| A8JFR4 | OTA1 | Ornithine transaminase (EC 2.6.1.13) | 1.95 | |
| A8JG03 | LEU1 | Isopropylmalate dehydratase, large subunit | 1.94 | |
| A8J979 | MCCA | Methylcrotonoyl‐CoA carboxylase alpha subunit | 1.85 | |
| A8I826 | HSK1 | Homoserine kinase (EC 2.7.1.39) | 1.81 | |
| A8IMY5 | ANS1 | Anthranilate synthase, alpha subunit (Fragment) | 1.70 | |
| A8J173 | ASD1 | Aspartate semialdehyde dehydrogenase | 1.62 | |
| A8J2Z6 | ChS1 | Chorismate synthase (EC 4.2.3.5) | 1.47 | |
| A8IX80 | AAD1 | Acetohydroxyacid dehydratase | 1.46 | |
| A8ISB0 | OASTL4 | O‐acetylserine sulphydrolase; cysteine synthase (EC 2.5.1.47) | 1.42 | |
| A8J355 | CGS1 | Cystathionine gamma‐synthase | 1.42 | |
| A8J3D3 | HIS5 | Histidinol phosphate aminotransferase | 1.41 | |
| A8ITU7 | PGD1 | D‐3‐phosphoglycerate dehydrogenase (EC 1.1.1.95) | 1.37 | |
| O22547 | ALAS | Acetolactate synthase | 1.20 | |
| A8JIR0 | CPS1 | Carbamoyl phosphate synthase, large subunit (EC 6.3.5.5) | −1.17 | |
| P22675 | ARG7 | Argininosuccinate lyase (ASAL) (EC 4.3.2.1) (Arginosuccinase) | −1.26 | |
| A8I305 | GLN1 | Glutamine synthetase (EC 6.3.1.2) | −1.43 | |
| A8JBL3 | NAGS | N‐acetylglutamate synthase (Fragment) | −1.49 | |
| Other | A8IJL3 | MEP‐S | 2‐C‐methyl‐d‐erythritol 2,4‐cyclodiphosphate synthase (EC 4.6.1.12) | 2.02 |
| A8J841 | THICb | Hydroxymethylpyrimidine phosphate synthase | 2.00 | |
| A8HMC0 | CRT2 | Calreticulin 2, calcium‐binding protein | 1.53 | |
| Q8LRU1 | FER1 | Pre‐apoferritin | 1.41 | |
| Kinases | A8JDN2 | ADK3 | Adenylate kinase 3 (EC 2.7.4.3) | −1.97 |
| A8JH12 | – | Nucleoside diphosphate kinase | −1.97 | |
| Redox proteins | O22472 | CAT | Catalase (EC 1.11.1.6) | 2.16 |
| A8HQT1 | PDI2 | Protein disulfide isomerase | 1.54 | |
| A8IA77 | GSH1 | Gamma‐glutamylcysteine synthetase (EC 6.3.2.2) | 1.54 | |
| A8IVV9 | Flavodoxin‐like protein (Fragment) | −1.16 | ||
| A8IWK2 | – | Ferredoxin thioredoxin reductase, catalytic chain | −2.14 | |
| N & S metabolism | A8JHB4 | GSF1 | Ferredoxin‐dependent glutamate synthase | 1.29 |
| A8IXF1 | ATS1 | ATP‐sulfurylase | 1.15 | |
| A8J6A7 | MET16 | Adenylylphosphosulfate reductase | −1.27 | |
| A8JGD1 | GDH2 | Glutamate dehydrogenase | −1.36 | |
| Cell structure/organization | A8JB85 | APG8 | Autophagy protein | 3.84 |
| A8HW56 | CDC48 | Flagellar associated protein (EC 3.6.1.3) | 2.08 | |
| A8J614 | FAP42 | Flagellar associated protein, adenylate/guanylate kinase‐like protein | 1.80 | |
| A8IFL6 | FAP262 | Flagellar associated protein | 1.70 | |
| A8JEQ8 | FAP79 | Flagellar associated protein | 1.31 | |
| A8JAV1 | IDA5 | Actin | −1.31 | |
| P09205 | TUBA2 | Tubulin alpha‐2 chain | −1.90 | |
| A8IXZ0 | TUB1 | Beta tubulin 1 (Beta tubulin 2) | −2.11 | |
| Stress response | Q39603 | HSP70B | Heat shock protein 70B | 2.06 |
| A8IZU0 | HSP70C | Heat shock protein 70C | 1.77 | |
| P25840 | HSP70 | Heat shock 70 kDa protein | 1.70 | |
| A8I7T1 | HSP90B | Heat shock protein 90B (Fragment) | 1.62 | |
| A8I972 | CLPB3 | ClpB chaperone, Hsp100 family | 1.61 | |
| A8HYV3 | HSP70B | Heat shock protein 70B | 1.32 | |
| DNA and RNA metabolism | A8JFP3 | – | Histone methyltransferase | 1.34 |
| Q1G2Y1 | PNP | Chloroplast polyribonucleotide phosphorylase | 1.30 | |
| A8IZS5 | – | Glycine‐rich RNA‐binding protein | 1.23 | |
| A8I0F5 | ORC1 | Origin recognition complex subunit 1 | 1.21 | |
| A8JCT1 | HBV1 | Histone H2B | −1.77 | |
| A8HWY2 | HTR14 | Histone H3 (Fragment) | −1.88 | |
| A8HVA3 | HFO4 | Histone H4 | −1.91 | |
| A8JIN9 | HFO43 | Histone H4 | −1.92 | |
| A8HRZ9 | H2A | Histone H2A | −1.95 | |
| Transporters | A8JGB0 | – | Arsenite translocating ATPase‐like protein (Fragment) | 1.44 |
| A8I164 | ATPVA1 | Vacuolar ATP synthase, subunit A | −1.18 | |
| A8I268 | HLA3 | ABC transporter | −2.40 |
Peptides from the quantitative isobaric tagging (iTRAQ) experiment were identified by comparison with the Chlamydomonas reinhardtii proteome (indicated by the Uniprot ID). A total of 70 proteins were found to be significantly (P < 0.05) more abundant in the cocultures with Mesorhizobium loti (positive values), and 83 were less abundant (negative values). Identified proteins are grouped into functional categories as in Fig. 1, ranked according to fold‐change. Data are available via ProteomeXchange (PXD005046). *Also involved in the tricarboxylic acid (TCA) cycle.
Figure 1.

Overview of annotated functions ascribed to Lobomonas rostrata proteins. Proteins were extracted from 14 d cultures of L. rostrata grown in coculture with Mesorhizobium loti, or axenically supplemented with 100 ng l−1 cyanocobalamin (vitamin B12). (a) Relative proportions of each protein category determined by the quantitative isobaric tagging (iTRAQ) experiment to be more abundant in coculture (a total of 70 proteins). (b) Relative proportions of each protein category found in lower amounts (a total of 83 proteins). Proteins were categorized into major functional groups based on combined KEGG/Mercator (Kanehisa & Goto, 2000; Lohse et al., 2014) analysis. TCA, tricarboxylic acid; N & S, nitrogen & sulphur; ETC, electron transfer chain.
This effect on chloroplast biology was further reflected in the substantial number of proteins associated with both the light‐dependent reactions of photosynthesis and CO2 fixation, which were much lower in the coculture; none were elevated (Table 1; red boxes in Fig. 2). There is reduced abundance of subunits of the chloroplast ATP synthase alongside those from the oxygen‐evolving complex of PSII, cytochrome b6f complex (Rieske Fe.S protein, Re), and soluble electron carriers ferredoxin (Fd) and ferredoxin‐NADP reductase (FNR). Several enzymes in the Calvin cycle were also in lower abundance, including RuBisCO activase (RCA1) and two enzymes involved in photorespiration, hydropyruvate reductase and glycolate dehydrogenase (Chauvin et al., 2008). In addition, there was a decrease in two carbonic anhydrases, which catalyse conversion of carbon dioxide to bicarbonate, one of which showed the greatest log2‐fold change (−2.91) of all detected proteins.
Figure 2.
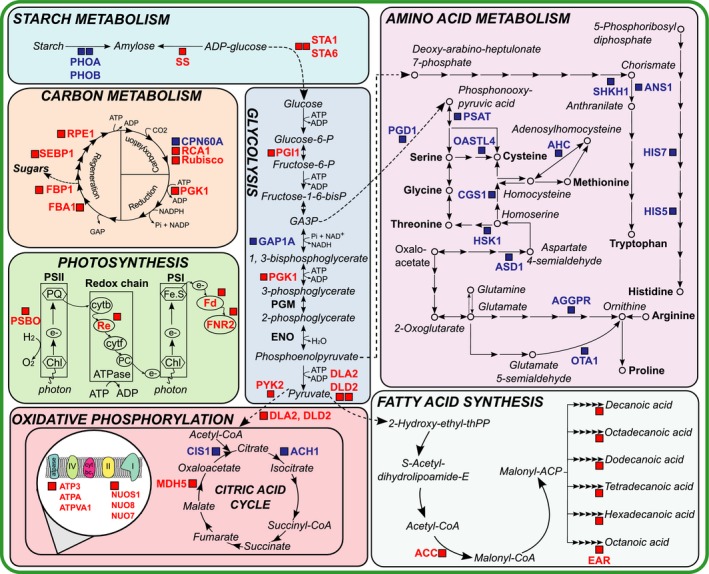
Schematic diagram summarizing changes in primary metabolic enzymes of Lobomonas rostrata in coculture vs in axenic culture with B12 supplementation. Proteins found in higher amounts in coculture are indicated in blue, whereas those that are less abundant are shown in red. Abbreviations are provided in Table 1.
Subunits of soluble starch synthase and ADP‐glucose pyrophosphorylase (STA1, STA6), both involved in starch synthesis, were less abundant in the coculture, whereas starch phosphorylase, important for starch remobilization, was higher. Similarly, enzymes of glycolysis and the tricarboxylic acid (TCA) cycle also showed a mixture of higher and lower abundance, but all the subunits of the mitochondrial electron transfer chain that were detected (three subunits of NADH:ubiquinone oxidoreductase and two subunits of mitochondrial ATP synthase) were reduced in cocultures compared with axenic L. rostrata, as were enzymes involved in fatty acid biosynthesis, enoyl ACP reductase and the biotin carboxylase subunit of the acetyl‐CoA carboxylase enzyme complex (Ohlrogge & Jaworski, 1997), and three out of four enzymes of tetrapyrrole biosynthesis, including two of the Chl branch, light‐dependent protochlorophyllide reductase and geranylgeranyl PP reductase. The impression is that in L. rostrata grown with M. loti there is a reduction in biosynthesis of the photosynthetic apparatus and activity.
By contrast, many enzymes of amino acid metabolism were in higher abundance in cocultured L. rostrata compared with monocultures, with a total of 18 enzymes involved in both the degradation and biosynthesis of amino acids being elevated (Fig. 2). Among them were anthranilate synthase, involved in the tryptophan biosynthesis pathway (Liu et al., 2010), cysteine synthase (O‐acetylserine sulphydrolase, OASTL4), the final enzyme of the synthesis of cysteine (Tai et al., 2001), methylcrotonoyl‐CoA carboxylase, used in the degradation of leucine to acetoacetate (Song et al., 1994), and S‐adenosylhomocysteine hydrolase, involved in the methylation cycle of C1 metabolism (Palmer & Abeles, 1979). Just two proteins involved in amino acid metabolism were lower in cocultured L. rostrata, N‐acetylglutamate kinase and argininosuccinate lysase, enzymes of the urea cycle and important for production of fumarate for the TCA cycle (Shargool et al., 1988). Ferredoxin‐glutamate synthase (Fd‐GOGAT), involved in nitrate assimilation, was also elevated in cocultures, as was ATP‐sulphurylase involved in S‐assimilation, although adenylylphosphosulfate reductase was reduced. Two other enzymes of biosynthetic pathways were elevated: 2‐C‐methyl‐d‐erythritol 2,4‐cyclodiphosphate synthase, an enzyme of the nonmevalonate pathway for the production of the isoprenoid precursor isopentenyl‐pyrophosphate (Eisenreich et al., 2001); and THIC, encoding an enzyme of de novo thiamine biosynthesis.
Of particular note in the other functional categories was the higher abundance in the cocultures of stress‐response related proteins, comprising six proteins annotated as heat shock proteins (HSPs): four annotated as members of the HSP70 family, the others as a chloroplast‐targeted HSP101 homologue and an HSP90‐like protein. Also elevated were four flagellar‐associated proteins and autophagy protein (APG8), the latter being the most highly altered relative to axenic L. rostrata (3.84). And whilst five histones are lower in abundance in coculture, histone methylase and three other enzymes of DNA metabolism were found in higher amounts.
Given the observed reduction in amounts of almost all the proteins of the Calvin cycle, we decided to determine if this was a result of changes in transcript expression levels. We therefore carried out RT‐qPCR using as template RNA extracted from cultures grown in conditions identical to those used for proteomics analysis. We were able to identify sequences for eight proteins involved in carbon fixation by searching an RNAseq dataset from L. rostrata (U.J. Kudahl et al., unpublished) using the C. reinhardtii homologues, to allow design of appropriate PCR primers. We also found L. rostrata homologues for three of the most elevated proteins, THIC, APG8, and GAP1A, encoding cytosolic glyceraldehyde 3‐phosphate dehydrogenase. Fig. 3 shows the results in order of the fold‐abundance detected in the iTRAQ experiment, with those lower in coculture than in monoculture on the left, and those higher on the right. In general, the trend in the transcript abundances mirrored that of the proteins, with significant (P < 0.001) up‐regulation of GAP1A and APG8 in coculture (c. three‐ and fivefold, respectively). The thiamine biosynthesis enzyme THIC was also elevated, although this was not statistically significant. Similarly, there was significant (P‐value < 0.001) down‐regulation of phosphoglycerate kinase 1(PGK1) and chloroplast glyceraldehyde 3‐phosphate dehydrogenase 3 (GAP3), as well as sedoheptulose‐1,7‐bisphosphatase (SEBP1; P < 0.01). The transcript abundances for the other photosynthetic genes were unaltered or slightly higher in coculture, but not significantly. It should be noted that the CAH1 gene, encoding a carbonic anhydrase, may encode a different isoform to the proteins detected in the iTRAQ experiment.
Figure 3.
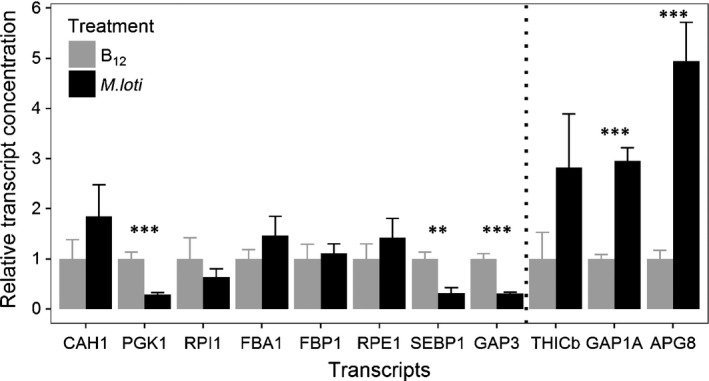
Reverse transcriptase‐quantitative polymerase chain reaction (RT‐qPCR) measurements of transcript abundance. Transcripts of genes encoding enzymes of photosynthesis that were found in lower abundance in cocultures, plus three proteins highly elevated in cocultures were quantified using cDNA prepared from RNA extracted from 14‐d‐old cultures. The transcripts labelled on the x‐axis are in ascending order of protein fold‐change measured by the quantitative isobaric tagging (iTRAQ) experiment. The vertical dashed line separates proteins that are lower in abundance in coculture (left) from those that are higher (right). Transcript abundance was normalized against three housekeeping genes (EIF4A, UBQ, RACK1) and then levels in cocultures with Mesorhizobium loti (black columns) are shown relative to the level in axenic Lobomonas rostrata cultures (grey columns) set as 1. Error bars, + SE; n ≥ 3; P‐value (Student's t‐test): **, P < 0.01; ***, P < 0.001. Abbreviations are as in Table 1.
Photosynthetic ETR is reduced in coculture with M. loti
Our observation that several proteins involved in both the light reactions of photosynthesis and carbon dioxide fixation were less abundant in L. rostrata cells in coculture with M. loti prompted us to investigate whether these altered protein abundances impacted photosynthetic activities of cells in the symbiotic vs axenic treatments. Accordingly, we made photophysiological measurements of cells in the two treatments using PAM fluorimetry. Quantification of the quantum yield of PSII and photosynthetic ETR provides information concerning the overall photosynthetic performance of a culture. L. rostrata cultures, with either 100 ng l−1 B12 or M. loti, were grown in identical conditions to those described for the proteomics experiment. Measurements of ETR were made at 7, 11 and 14 d after inoculation into fresh medium, corresponding to three different growth stages of the culture (Fig. S2). As can be seen in Fig. 4, at 7 d, there is little difference in ETR, but at both days 11 and 14, it was significantly lower in cells grown in the presence of M. loti, with the effect becoming more pronounced, so that at day 14 (corresponding to samples used for the proteomics analysis) the rate was only c. 60% of that in axenic cultures.
Figure 4.
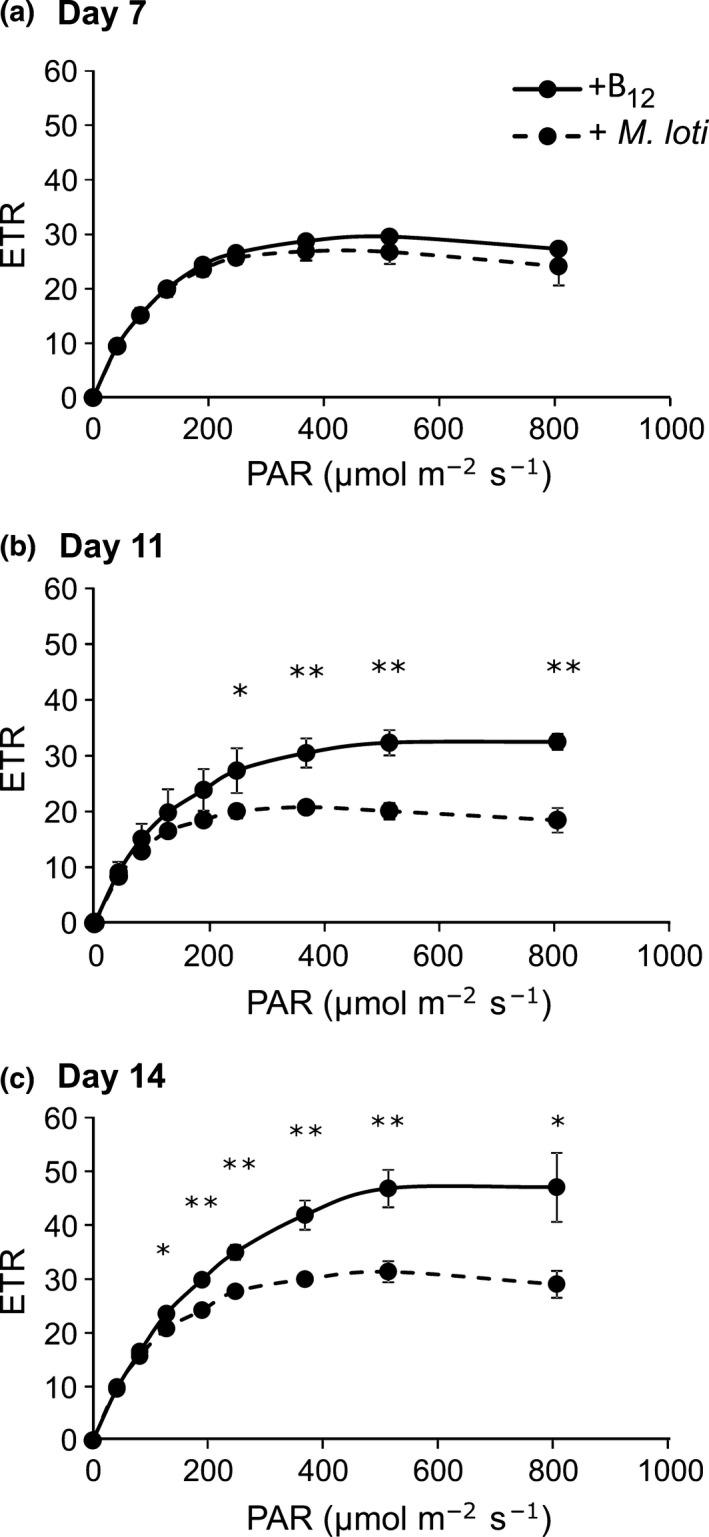
Photosynthetic capacity of Lobomonas rostrata cultures. Pulse amplitude modulation (PAM) measurements of the electron transfer rate (ETR) were made to estimate overall photosynthetic capacity. The solid line shows data from cultures grown axenically with 100 ng l−1 cyanocobalamin, while dashed lines show the ETR from cocultures with Mesorhizobium loti. Rates were measured in samples taken from cultures at (a) day 7, (b) day 11, and (c) day 14 after inoculation. Cells were diluted to equivalent cell densities (2.5 × 10⁶ cells ml−1). Data are the mean of three replicates ± SEM. Significant differences in ETR between treatments (two‐sample t‐test): *, P ≤ 0.05; **, P ≤ 0.01.
L. rostrata cells grown in coculture with M. loti have higher amounts of amino acids and total protein
The other major group of proteins that were altered were enzymes of amino acid biosynthesis. Accordingly we measured total protein in the cultures and found that for both the cell pellet and the media, the amount in the coculture was approximately double that in the axenic cultures (Fig. 5a). Whilst the former contain bacterial cells in addition, the estimated contribution of the bacterial cells to the total protein is probably < 10% (see earlier). We also determined the profile of free amino acids in the cells using HPLC‐MS (Fig. 5b; note the log scale for the y‐axis; Table S2). The majority of the 15 protein amino acids that could be identified by this method were elevated in coculture, with up to twofold changes seen for asparagine (Asn), glutamate (Glu) and histidine (His). The exceptions were methionine and serine, for which slight decreases were observed. Given that methionine is the product of the enzyme in L. rostrata that requires B12 (cobalamin‐dependent methionine synthase, METH), this might indicate B12 limitation, a conclusion supported by elevation of SAHH in coculture, and the observation that addition of B12 to the media of cocultures enhances growth of L. rostrata (Kazamia et al., 2012).
Figure 5.
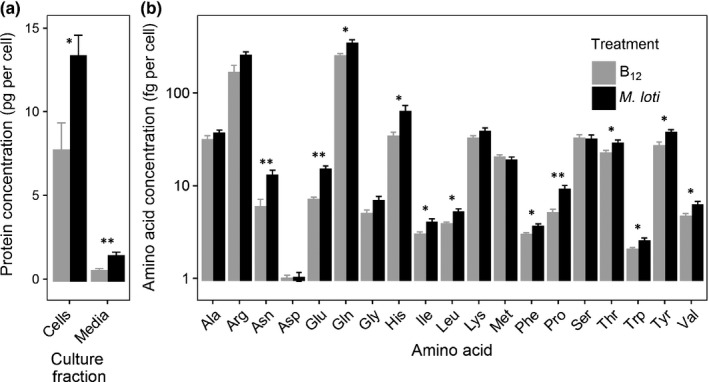
Protein and amino acid content of Lobomonas rostrata cultures. (a) Total protein from the cell pellet or media of 14‐d‐old cultures of axenic L. rostrata or of L. rostrata in coculture with Mesorhizobium loti. Protein is expressed in pg per algal cell relative to a standard of BSA. (b) Amino acids from the cell pellet on day 14 were separated by high‐performance liquid chromatography (HPLC) and quantified by MS. Amino acids are labelled on the x‐axis in alphabetical order, and quantities are expressed in fg per algal cell on the y‐axis. Axenic L. rostrata + 100 ng l−1 B12, grey columns; L. rostrata + M. loti, black columns. Error bars, + SE; n = 4; P‐value (Student's t‐test): *, P < 0.05; **, P < 0.01.
Discussion
In this study we applied quantitative iTRAQ proteomics to understand the metabolic differences in L. rostrata cells when grown in media supplemented with vitamin B12 as compared with cultures in which B12 is provided by M. loti cells. L. rostrata does not have a sequenced genome, and therefore its proteome is unknown, and the presence of bacterial cells within the coculture samples also complicated the analysis. A series of preliminary experiments were undertaken, an approach that is essential for these sorts of coculture, cross‐species proteomics experiments. Through these analyses we demonstrated that C. reinhardtii would provide a suitable reference database by a 1% PSM rate to L. rostrata peptides; that a low (0.31%) shared tryptic peptide (length of six to 16 amino acids) between C. reinhardtii and M. loti minimized interference by shared peptides; and that the c. 14‐fold less bacterial protein compared with algal protein in the coculture would not be detrimental to the overall algal protein numbers confidently identified and relatively quantified using iTRAQ. The value of these preliminary experiments was successfully demonstrated during the iTRAQ experiment, where we were able to identify 588 L. rostrata proteins with at least one high‐confidence peptide hit. Protein fold changes were comparable to previous iTRAQ studies, where relative values are significantly lower than usually seen for transcript‐level quantifications. To avoid using arbitrary thresholds for highlighting differentially expressed proteins, stringent quantitative statistics were applied (Noirel et al., 2011) and revealed 153 proteins that were significantly differentially expressed (P‐value < 0.05). (Table 1; Fig. 1). Furthermore, whilst transcript expression may not necessarily reflect protein abundance, qRT‐PCR analysis showed that transcript and protein expression were correlated in the two treatments for several of the genes we sampled (Fig. 3), providing further verification of our approach.
Inspection of the classes of protein that were altered revealed a higher abundance of proteins related to amino acid biosynthesis (Fig. 2a), and this was accompanied by modest but significant increases in several protein amino acids in the algal cells (Fig. 5b). M. loti is dependent on L. rostrata for fixed carbon in the cocultures, but the specific compound (or compounds) that the alga supplies is currently unknown. It is possible, therefore, that amino acids are involved, as has been documented for several other symbiotic interactions. For example, growth of the heterotrophic bacterium Shewanella W3‐18‐1 with the cyanobacterium Synechococcus sp. PCC 7002 modulates amino acid metabolism in Shewanella (Beliaev et al., 2014). A reduction in the expression of genes involved in alanine and methionine biosynthesis in this bacterium appear to have resulted from enhanced excretion of these amino acids by the cyanobacterial partner, indicative of metabolite exchange. Perhaps the best‐known example of amino acids exchange is provided by legume–rhizobial interactions, where the nitrogen fixed by the symbiotic bacteria is transferred to their legume partners in the form of ammonium, some of which is metabolized by the plant and returned to the bacteria in the form of amino acids in order to support their growth (Lodwig et al., 2003). There are further similarities between proteins significantly up‐regulated in cocultured L. rostrata and those in the nodule symbiosome, the membrane bordering the nitrogen‐fixing root nodule. These include a 60 kDa chaperonin, a homologue of that found in symbiosomes of Glycine max (Panter et al., 2000), HSP 70 found in symbiosomes of Lotus japonicus and Medicago truncatula (Wienkoop & Saalbach, 2003; Catalano et al., 2004), and calreticulin, also found in L. japonicus (Wienkoop & Saalbach, 2003). The canonical function of chaperonins and HSPs is in assisting correct protein folding and preventing protein aggregation in cells undergoing some form of stress (Saibil, 2013). Other proteins up‐regulated in cocultured L. rostrata that are also found in the symbiosome membrane are D‐3‐phosphoglycerate dehydrogenase involved in amino acid biosynthesis (Wienkoop & Saalbach, 2003), citrate synthase (Saalbach et al., 2002), cysteine synthase (Wienkoop & Saalbach, 2003) and lysine‐tRNA ligase (Catalano et al., 2004). The prokaryotic isoforms of some of these proteins have also been found to be present in the symbiosome space (the area between the plant and bacterial cell membranes in the symbiosome) rather than the membrane, indicating that they share a common symbiotic function between kingdoms (Emerich & Krishnan, 2014). The exact function these proteins have acquired in the symbiosome is still largely unknown. In other symbiotic systems, mostly parasitic, the prokaryotic isoforms of these proteins are thought to be important in the cell‐to‐cell adhesion of symbiont and host and it could be that the same is true for the eukaryotic isoforms (Copley, 2012), although it is known that cell‐to‐cell contact is not an obligate requirement for our L. rostrata and M. loti system (Kazamia et al., 2012).
Perhaps the most striking feature of L. rostrata grown in coculture with M. loti is that there is an overall reduction in many chloroplast proteins. First, proteins involved in chloroplast protein synthesis and import are much lower in coculture, whereas several of the cytosolic equivalents are elevated. Correlating with this observation is a reduction in two chloroplast‐encoded subunits of the ATP synthase. At the same time, many components of the nucleus‐encoded, light‐dependent reactions of photosynthesis (Fig. 2), including the Rieske Fe.S subunit (Re) of the cytochrome complex, ferredoxin (Fd), and Fd‐NADP reductase (FNR), and virtually all of the Calvin cycle enzymes are also found in lower amounts in the coculture cells. Measurement of the ETR confirmed that the photosynthetic capacity of L. rostrata cells grown with M. loti in coculture is significantly lower than that in cells grown in axenic culture (Fig. 4). This is in contrast to a transcriptomics analysis of the cyanobacterium Prochlorococcus NATL2A grown in coculture with the heterotrophic bacterium Alteromonas macleodii MIT 1002, where a notable enhancement of genes encoding photosynthetic apparatus, including subunits of PSI and Chl biosynthesis proteins, was seen in the cyanobacterium. The profound impact that interactions can have on growth and Chl fluorescence parameters has also been highlighted by a systematic physiological study that screened a library of hundreds of heterotrophic marine bacteria in pairwise cocultures with different Prochlorococcus ecotypes (Sher et al., 2011). In general, this study identified that ‘enhancing interactions’, whereby the presence of heterotrophic bacteria enhanced cyanobacterial growth rate and/or Chl fluorescence, were more common than the other way round. However, in this work, the treatment conditions were such that all the necessary nutrients for growth were present in the medium (in this case Pro99 medium supplemented with pyruvate, acetate, lactate, glycerol, alongside vitamins) even in the presence of the bacterium, which is in contrast to our setup in which the coculture treatment lacked a bacterial carbon source, alongside a vital micronutrient necessary for L. rostrata growth. Thus, in a scenario in which growth of both microbial partners is absolutely dependent of the presence of the other, a fine balance between mutualism and competition appears to be in play. Whilst L. rostrata growth (and photosynthetic output) is supported by a B12‐synthesizing bacterium, it is nevertheless constrained compared with growth in media where all necessary nutrients are in adequate supply. There may also be a degree of competition between the two species for other nutrients in the media (such as nitrogen and trace elements) and the cocultured alga may dedicate efforts to producing resource acquisition proteins rather than photosynthesis‐related proteins. In fact, in the closely related algae C. reinhardtii, it is well known that photosynthetic gene expression declines during early nutrient deprivation (Zhang et al., 2004; Schmollinger et al., 2014), which has been suggested to be a result in part of accumulation of transcripts for rls1, a putative transcriptional repressor of nuclear‐encoded chloroplast proteins (Nedelcu, 2009). This competition may also provide another explanation for the up‐regulation of amino acid biosynthesis enzymes in cocultured L. rostrata, the cocultured alga requiring more resource acquisition machinery rather than providing amino acids to its symbiont (Arrigo, 2005).
A previous study of a mutualistic coculture based on B12 exchange, in this case between the marine diatom Thalassiosira pseudonana and a roseobacter Ruegeria pomeroyi DSS‐3, looked at transcript‐level changes and identified that the likely compound supplied by the alga was the sulphur‐containing compound 2,3‐dihydroxypropane‐1‐sulfonate (Durham et al., 2015). They found no evidence of alterations in transcripts for enzymes of the photosynthetic machinery, nor any change in photosynthetic activity. By contrast, the results of our study at the protein level, which is a more direct indication of cellular activity, suggest, perhaps counterintuitively, that a photosynthetic organism grown mutualistically with a bacterium does not increase its photosynthetic activity to support both organisms. Instead, the photosynthetic capacity of the alga is probably more constrained by its own nutrient status than by the demands of its partner. In this system, where the nutrient (B12) status of the alga is effectively set by the bacterium, and vice versa (in terms of carbon supply), there appears to be a tradeoff in terms of the algal response. The striking impact that cohabiting bacteria can have on algal physiology, evolution and metabolism is becoming increasingly recognized. Algae and bacteria are among the most abundant organisms on the planet, and together their metabolism impacts global nutrient cycling and energy flow. Thus, enhancing our knowledge of the molecular basis of algal–bacterial interactions is critical to establishing the fundamental core principles governing microbial community function in the aquatic biosphere.
Author contributions
J.P., K.E.H., P.C.W. and A.G.S. conceived the project and designed the research; K.E.H., M.B.C., J.L., U.J.K, D.A.R., E.V.T., F.B., D.L.S. and N.S. carried out the research; K.E.H., M.B.C, U.J.K, F.B., N.S., J.P. and A.G.S. carried out the data analysis and interpretation; K.E.H., M.B.C., J.P. and A.G.S. wrote the manuscript, with input from all authors. All authors read and approved the final manuscript.
Supporting information
Please note: Wiley Blackwell are not responsible for the content or functionality of any Supporting Information supplied by the authors. Any queries (other than missing material) should be directed to the New Phytologist Central Office.
Fig. S1 Proteomics work flow.
Fig. S2 Growth over time of L. rostrata grown in axenic culture with B12 supplementation (100 ng l−1) versus in coculture with M. loti.
Fig. S3 Heat map of proteins identified from iTRAQ analysis.
Table S1 List of primers used for reverse transcriptase‐quantitative polymerase chain reaction (RT‐qPCR)
Table S2 Optimized values for MS analysis of amino acids
Methods S1 Amino acid analysis.
Acknowledgements
The work in this manuscript was supported by funding from the Biotechnology and Biological Sciences Research Council (BBSRC) of the UK (grant BB/I013164/1, a CASE studentship for M.B.C. joint with PML Applications Ltd, Plymouth, UK, and a DTP studentship for F.B.); an EU FP7 Marie Curie ITN Photo.Comm, no. 317184 for U.J.K.; Engineering and Physical Science Research Council (EPSRC) grant EP/E036252/1; and the Natural Environment Research Council (NERC) grant NE/J024767/1.
Contributor Information
Jagroop Pandhal, Email: j.pandhal@sheffield.ac.uk.
Alison G. Smith, Email: as25@cam.ac.uk
References
- Amin SA, Green DH, Hart MC, Küpper FC, Sunda WG, Carrano CJ. 2009. Photolysis of iron‐siderophore chelates promotes bacterial‐algal mutualism. Proceedings of the National Academy of Sciences, USA 106: 17071–17076. [DOI] [PMC free article] [PubMed] [Google Scholar]
- Amin SA, Hmelo LR, van Tol HM, Durham BP, Carlson LT, Heal KR, Morales RL, Berthiaume CT, Parker MS, Djunaedi B et al 2015. Interaction and signalling between a cosmopolitan phytoplankton and associated bacteria. Nature 522: 98–101. [DOI] [PubMed] [Google Scholar]
- Arrigo KR. 2005. Marine microorganisms and global nutrient cycles. Nature 437: 349–355. [DOI] [PubMed] [Google Scholar]
- Ashen JB, Cohen JD, Goff LJ. 1999. Detection and quantification of free indole‐3‐acetic acid in bacterial galls on the marine alga Prionitis lanceolata (Rhodophyta). Journal of Phycology 35: 493–500. [Google Scholar]
- Beliaev AS, Romine MF, Serres M, Bernstein HC, Linggi BE, Markillie LM, Isern NG, Chrisler WB, Kucek LA, Hill EA et al 2014. Inference of interactions in cyanobacterial–heterotrophic co‐cultures via transcriptome sequencing. ISME Journal 8: 2243–2255. [DOI] [PMC free article] [PubMed] [Google Scholar]
- Bertrand EM, Allen AE, Dupont CL, Norden‐Krichmar TM, Bai J, Valas RE, Saito MA. 2012. Influence of cobalamin scarcity on diatom molecular physiology and identification of a cobalamin acquisition protein. Proceedings of the National Academy of Sciences, USA 109: E1762–E1771. [DOI] [PMC free article] [PubMed] [Google Scholar]
- Bertrand EM, McCrow JP, Moustafa A, Zheng H, McQuaid JB, Delmont TO, Post AF, Sipler RE, Spackeen JL, Xu K et al 2015. Phytoplankton‐bacterial interactions mediate micronutrient colimitation at the coastal Antarctic sea ice edge. Proceedings of the National Academy of Sciences, USA 112: 9938–9943. [DOI] [PMC free article] [PubMed] [Google Scholar]
- Biller SJ, Coe A, Chisholm SW. 2016. Torn apart and reunited: impact of a heterotroph on the transcriptome of Prochlorococcus . ISME Journal 10: 2831–2843. [DOI] [PMC free article] [PubMed] [Google Scholar]
- Bradford MM. 1976. A rapid and sensitive method for the quantitation of microgram quantities of protein utilizing the principle of protein‐dye binding. Analytical Biochemisty 72: 248–254. [DOI] [PubMed] [Google Scholar]
- Catalano CM, Lane WS, Sherrier DJ. 2004. Biochemical characterization of symbiosome membrane proteins from Medicago truncatula root nodules. Electrophoresis 25: 519–531. [DOI] [PubMed] [Google Scholar]
- Chauvin L, Tural B, Moroney JV. 2008. Chlamydomonas reinhardtii has genes for both glycolate oxidase and glycolate dehydrogenase In: John A, Gantt E, Golbeck J, Osmond B, eds. Photosynthesis energy from the sun. Dordrecht, the Netherlands: Springer, 823–827. [Google Scholar]
- Cooper MB, Smith AG. 2015. Exploring mutualistic interactions between microalgae and bacteria in the omics age. Current Opinion in Plant Biology 26: 147–153. [DOI] [PubMed] [Google Scholar]
- Copley SD. 2012. Moonlighting is mainstream: paradigm adjustment required. BioEssays 34: 578–588. [DOI] [PubMed] [Google Scholar]
- Croft MT, Lawrence AD, Raux‐Deery E, Warren MJ, Smith AG. 2005. Algae acquire vitamin B12 through a symbiotic relationship with bacteria. Nature 438: 90–93. [DOI] [PubMed] [Google Scholar]
- Durham BP, Sharma S, Luo H, Smith CB, Amin SA, Bender SJ, Dearth SP, Van Mooy BAS, Campagna SR, Kujawinski EB et al 2015. Cryptic carbon and sulfur cycling between surface ocean plankton. Proceedings of the National Academy of Sciences, USA 112: 453–457. [DOI] [PMC free article] [PubMed] [Google Scholar]
- Eisenreich W, Rohdich F, Bacher A. 2001. Deoxyxylulose phosphate pathway to terpenoids. Trends in Plant Science 6: 78–84. [DOI] [PubMed] [Google Scholar]
- Elias JE, Gygi SP. 2007. Target‐decoy search strategy for increased confidence in large‐scale protein identifications by mass spectrometry. Nature Methods 4: 207–214. [DOI] [PubMed] [Google Scholar]
- Emerich DW, Krishnan HB. 2014. Symbiosomes: temporary moonlighting organelles. Biochemical Journal 460: 1–11. [DOI] [PubMed] [Google Scholar]
- Falkowski PG. 1998. Biogeochemical controls and feedbacks on ocean primary production. Science 281: 200–206. [DOI] [PubMed] [Google Scholar]
- Fernandes N, Case RJ, Longford SR, Seyedsayamdost MR, Steinberg PD, Kjelleberg S, Thomas T. 2011. Genomes and virulence factors of novel bacterial pathogens causing bleaching disease in the marine red alga Delisea pulchra . PLoS ONE 6: e27387. [DOI] [PMC free article] [PubMed] [Google Scholar]
- Geng H, Bruhn JB, Nielsen KF, Gram L, Belas R. 2008. Genetic dissection of tropodithietic acid biosynthesis by marine roseobacters. Applied and Environmental Microbiology 74: 1535–1545. [DOI] [PMC free article] [PubMed] [Google Scholar]
- González JC, Banerjee RV, Huang S, Sumner JS, Matthews RG. 1992. Comparison of cobalamin‐independent and cobalamin‐dependent methionine synthases from Escherichia coli: two solutions to the same chemical problem. Biochemistry 31: 6045–6056. [DOI] [PubMed] [Google Scholar]
- Grant MAA, Kazamia E, Cicuta P, Smith AG. 2014. Direct exchange of vitamin B12 is demonstrated by modelling the growth dynamics of algal‐bacterial cocultures. ISME Journal 8: 1418–1427. [DOI] [PMC free article] [PubMed] [Google Scholar]
- Helliwell KE. 2017. The roles of B vitamins in phytoplankton nutrition: new perspectives and prospects. New Phytologist 216: 62–68. [DOI] [PubMed] [Google Scholar]
- Helliwell KE, Collins S, Kazamia E, Purton S, Wheeler GL, Smith AG. 2015. Fundamental shift in vitamin B12 eco‐physiology of a model alga demonstrated by experimental evolution. ISME Journal 9: 1446–1455. [DOI] [PMC free article] [PubMed] [Google Scholar]
- Helliwell KE, Wheeler GL, Leptos KC, Goldstein RE, Smith AG. 2011. Insights into the evolution of vitamin B12 auxotrophy from sequenced algal genomes. Molecular Biology and Evolution 28: 2921–2933. [DOI] [PubMed] [Google Scholar]
- Hold GL, Smith EA, Birkbeck TH, Gallacher S. 2001. Comparison of paralytic shellfish toxin (PST) production by the dinoflagellates Alexandrium lusitanicum NEPCC 253 and Alexandrium tamarense NEPCC 407 in the presence and absence of bacteria. FEMS Microbiology Ecology 36: 223–234. [DOI] [PubMed] [Google Scholar]
- Hom EFY, Murray AW. 2014. Niche engineering demonstrates a latent capacity for fungal–algal mutualism. Science 345: 94–98. [DOI] [PMC free article] [PubMed] [Google Scholar]
- Kanehisa M, Goto S. 2000. KEGG: kyoto encyclopedia of genes and genomes. Nucleic Acids Research 28: 27–30. [DOI] [PMC free article] [PubMed] [Google Scholar]
- Kazamia E, Czesnick H, Van Nguyen TT, Croft MT, Sherwood E, Sasso S, Hodson SJ, Warren MJ, Smith AG. 2012. Mutualistic interactions between vitamin B12 ‐dependent algae and heterotrophic bacteria exhibit regulation. Environmental Microbiology 14: 1466–1476. [DOI] [PubMed] [Google Scholar]
- Kazamia E, Helliwell KE, Purton S, Smith AG. 2016. How mutualisms arise in phytoplankton communities: building eco‐evolutionary principles for aquatic microbes. Ecology Letters 19: 810–822. [DOI] [PMC free article] [PubMed] [Google Scholar]
- Koch F, Hattenrath‐Lehmann TK, Goleski JA, Sañudo‐Wilhelmy S, Fisher NS, Gobler CJ. 2012. Vitamin B1 and B12 uptake and cycling by plankton communities in coastal ecosystems. Frontiers in Microbiology 3: 363. [DOI] [PMC free article] [PubMed] [Google Scholar]
- Koch F, Sañudo‐Wilhelmy SA, Fisher NS, Gobler CJ. 2013. Effect of vitamins B1 and B12 on bloom dynamics of the harmful brown tide alga, Aureococcus anophagefferens (Pelagophyceae). Limnology and Oceanography 58: 1761–1774. [Google Scholar]
- Liu X, Dong Y, Li X, Ren Y, Li Y, Wang W, Wang L, Feng L. 2010. Characterization of the anthranilate degradation pathway in Geobacillus thermodenitrificans NG80‐2. Microbiology 156: 589–595. [DOI] [PubMed] [Google Scholar]
- Lodwig EM, Hosle AHF, Bourdes A, Findlay K, Allaway D, Karunakaran R, Downle JA, Poole PS. 2003. Amino‐acid cycling drives nitrogen fixation in the legume–Rhizobium symbiosis. Nature 422: 722–726. [DOI] [PubMed] [Google Scholar]
- Lohse M, Nagel A, Herter T, May P, Schroda M, Zrenner R, Tohge T, Fernie A, Stitt M, Usadel B. 2014. Mercator: a fast and simple web server for genome scale functional annotation of plant sequence data. Plant, Cell & Environment 37: 1250–1258. [DOI] [PubMed] [Google Scholar]
- Longworth J, Wu D, Huete‐Ortega M, Wright PC, Vaidyanathan S. 2016. Proteome response of Phaeodactylum tricornutum, during lipid accumulation induced by nitrogen depletion. Algal Research 18: 213–224. [DOI] [PMC free article] [PubMed] [Google Scholar]
- Matsuo Y, Imagawa H, Nishizawa M, Shizuri Y. 2005. Isolation of an algal morphogenesis inducer from a marine bacterium. Science 307: 1598. [DOI] [PubMed] [Google Scholar]
- Maxwell K, Johnson GN. 2000. Chlorophyll fluorescence–a practical guide. Journal of Experimental Botany 51: 659–668. [DOI] [PubMed] [Google Scholar]
- Mus F, Dubini A, Seibert M, Posewitz MC, Grossman AR. 2007. Anaerobic acclimation in Chlamydomonas reinhardtii: anoxic gene expression, hydrogenase induction, and metabolic pathways. Journal of Biological Chemistry 282: 25475–25486. [DOI] [PubMed] [Google Scholar]
- Nedelcu AM. 2009. Environmentally induced responses co‐opted for reproductive altruism. Biology Letters 5: 805–808. [DOI] [PMC free article] [PubMed] [Google Scholar]
- Noirel J, Evans C, Salim M, Mukherjee J, Yen Ow S, Pandhal J, Khoa Pham T, A Biggs C, C Wright P. 2011. Methods in quantitative proteomics: setting iTRAQ on the right track. Current Proteomics 8: 17–30. [Google Scholar]
- Ohlrogge JB, Jaworski JG. 1997. Regulation of fatty acid synthesis. Annual Review of Plant Physiology and Plant Molecular Biology 48: 109–136. [DOI] [PubMed] [Google Scholar]
- Paerl RW, Bertrand EM, Allen AE, Palenik B, Azam F. 2015. Vitamin B1 ecophysiology of marine picoeukaryotic algae: strain‐specific differences and a new role for bacteria in vitamin cycling. Limnology and Oceanography 60: 215–228. [Google Scholar]
- Palmer J, Abeles R. 1979. The mechanism of action of S‐adenosylhomocysteinase. Journal of Biological Chemistry 7: 1217–1226. [PubMed] [Google Scholar]
- Pandhal J, Snijders APL, Wright PC, Biggs CA. 2008. A cross‐species quantitative proteomic study of salt adaptation in a halotolerant environmental isolate using 15N metabolic labelling. Proteomics 8: 2266–2284. [DOI] [PubMed] [Google Scholar]
- Panter S, Thomson R, de Bruxelles G, Laver D, Trevaskis B, Udvardi M. 2000. Identification with proteomics of novel proteins associated with the peribacteroid membrane of soybean root nodules. Molecular Plant–Microbe Interactions 13: 325–333. [DOI] [PubMed] [Google Scholar]
- Park Y, Je K‐W, Lee K, Jung S‐E, Choi T‐J. 2008. Growth promotion of Chlorella ellipsoidea by co‐inoculation with Brevundimonas sp. isolated from the microalga. Hydrobiologia 598: 219–228. [Google Scholar]
- Pfaffl MW. 2001. A new mathematical model for relative quantification in real‐time RT‐PCR. Nucleic Acids Research 29: e45. [DOI] [PMC free article] [PubMed] [Google Scholar]
- Saalbach G, Erik P, Wienkoop S. 2002. Characterisation by proteomics of peribacteroid space and peribacteroid membrane preparations from pea (Pisum sativum) symbiosomes. Proteomics 2: 325–337. [DOI] [PubMed] [Google Scholar]
- Saibil H. 2013. Chaperone machines for protein folding, unfolding and disaggregation. Nature Reviews. Molecular Cell Biology 14: 630–642. [DOI] [PMC free article] [PubMed] [Google Scholar]
- Schmollinger S, Mühlhaus T, Boyle NR, Blaby IK, Casero D, Mettler T, Moseley JL, Kropat J, Sommer F, Strenkert D et al 2014. Nitrogen‐sparing mechanisms in Chlamydomonas affect the transcriptome, the proteome, and photosynthetic metabolism. Plant Cell 26: 1410–1435. [DOI] [PMC free article] [PubMed] [Google Scholar]
- Shargool D, Jain J, McKay G. 1988. Ornithine biosynthesis, and arginine biosynthesis and degradation in plant cells. Phytochemistry 27: 1571–1574. [Google Scholar]
- Sher D, Thompson JW, Kashtan N, Croal L, Chisholm SW. 2011. Response of Prochlorococcus ecotypes to co‐culture with diverse marine bacteria. ISME Journal 5: 1125–1132. [DOI] [PMC free article] [PubMed] [Google Scholar]
- Song J, Wurtele ES, Nikolau BJ. 1994. Molecular cloning and characterization of the cDNA coding for the biotin‐containing subunit of 3‐methylcrotonoyl‐CoA carboxylase: identification of the biotin carboxylase and biotin‐carrier domains. Proceedings of the National Academy of Sciences, USA 91: 5779–5783. [DOI] [PMC free article] [PubMed] [Google Scholar]
- Tai CH, Burkhard P, Gani D, Jenn T, Johnson C, Cook PF. 2001. Characterization of the allosteric anion‐binding site of O‐acetylserine sulfhydrylase. Biochemistry 40: 7446–7452. [DOI] [PubMed] [Google Scholar]
- Thiel V, Brinkhoff T, Dickschat JS, Wickel S, Grunenberg J, Wagner‐Döbler I, Simon M, Schulz S. 2010. Identification and biosynthesis of tropone derivatives and sulfur volatiles produced by bacteria of the marine Roseobacter clade. Organic & Biomolecular Chemistry 8: 234–246. [DOI] [PubMed] [Google Scholar]
- Untergasser A, Cutcutache I, Koressaar T, Ye J, Faircloth BC, Remm M, Rozen SG. 2012. Primer3 – new capabilities and interfaces. Nucleic Acids Research 40: e115. [DOI] [PMC free article] [PubMed] [Google Scholar]
- Vizcaíno JA, Deutsch EW, Wang R, Csordas A, Reisinger F, Ríos D, Dianes JA, Sun Z, Farrah T, Bandeira N et al 2014. ProteomeXchange provides globally coordinated proteomics data submission and dissemination. Nature Biotechnology 32: 223–226. [DOI] [PMC free article] [PubMed] [Google Scholar]
- Wagner‐Döbler I, Ballhausen B, Berger M, Brinkhoff T, Buchholz I, Bunk B, Cypionka H, Daniel R, Drepper T, Gerdts G et al 2010. The complete genome sequence of the algal symbiont Dinoroseobacter shibae: a hitchhiker's guide to life in the sea. ISME Journal 4: 61–77. [DOI] [PubMed] [Google Scholar]
- Wienkoop S, Saalbach G. 2003. Proteome analysis. Novel proteins identified at the peribacteroid membrane from Lotus japonicus . Plant Physiology 131: 1080–1090. [DOI] [PMC free article] [PubMed] [Google Scholar]
- Xie B, Bishop S, Stessman D, Wright D, Spalding MH, Halverson LJ. 2013. Chlamydomonas reinhardtii thermal tolerance enhancement mediated by a mutualistic interaction with vitamin B12‐producing bacteria. ISME Journal 7: 1544–1555. [DOI] [PMC free article] [PubMed] [Google Scholar]
- Zhang Z, Shrager J, Jain M, Chang C‐W, Vallon O, Grossman AR. 2004. Insights into the Survival of Chlamydomonas reinhardtii during sulfur starvation based on microarray analysis of gene expression. Eukaryotic Cell 3: 1331. [DOI] [PMC free article] [PubMed] [Google Scholar]
Associated Data
This section collects any data citations, data availability statements, or supplementary materials included in this article.
Supplementary Materials
Please note: Wiley Blackwell are not responsible for the content or functionality of any Supporting Information supplied by the authors. Any queries (other than missing material) should be directed to the New Phytologist Central Office.
Fig. S1 Proteomics work flow.
Fig. S2 Growth over time of L. rostrata grown in axenic culture with B12 supplementation (100 ng l−1) versus in coculture with M. loti.
Fig. S3 Heat map of proteins identified from iTRAQ analysis.
Table S1 List of primers used for reverse transcriptase‐quantitative polymerase chain reaction (RT‐qPCR)
Table S2 Optimized values for MS analysis of amino acids
Methods S1 Amino acid analysis.