Abstract
Copper(II) ternary complex, [Cu(phen)(C-dmg)(H2O)]NO3 was evaluated against a panel of cell lines, tested for in vivo efficacy in nasopharyngeal carcinoma xenograft models as well as for toxicity in NOD scid gamma mice. The Cu(II) complex displayed broad spectrum cytotoxicity against multiple cancer types, including lung, colon, central nervous system, melanoma, ovarian, and prostate cancer cell lines in the NCI-60 panel. The Cu(II) complex did not cause significant induction of cytochrome P450 (CYP) 3A and 1A enzymes but moderately inhibited CYP isoforms 1A2, 2C9, 2C19, 2D6, 2B6, 2C8 and 3A4. The complex significantly inhibited tumor growth in nasopharyngeal carcinoma xenograft bearing mice models at doses which were well tolerated without causing significant or permanent toxic side effects. However, higher doses which resulted in better inhibition of tumor growth also resulted in toxicity.
Introduction
Resistance and toxicity of currently available chemotherapeutic agents remain major problems in cancer therapy. Therefore, new anticancer drugs with greater effectiveness but reduced toxic side effects would be most useful. Fewer platinum compounds are now entering clinical trials and this has been attributed to not only their inherent resistance, systemic toxicity and severe side effects but also due to a shift in the design and development of anticancer metallodrugs [1–5]. Hambley provides a basis of designing such metallodrugs, viz. via the function of the metal and ligand moieties [6]. These are (i) the metal complex is active in its inert form, (ii) the metal complex is active in its reactive form, (iii) the metal serves as a radiation enhancer, (iv) the compound contains a radioactive metal, (v) the metal or its biotransformation product is active, (vi) a ligand is biologically active, and (vii) only a fragment of the complex is active [6]. Another approach in designing metallodrugs is based on cancer genomics and this is directed at cell survival pathways, mechanism of resistance, metastasis, and drug-specificity arising from its pre-defined chemical and biological reactivity [7].
There is also a shift to exploring and developing anticancer metal-based drugs involving non-platinum metals like copper [1, 2, 8–10]. Copper complexes have been highlighted to be promising alternatives to platinum-based drugs due to the elevated need for copper by cancer tissues, established role of copper in tumor angiogenesis, and due to an altered metabolism of copper in many types of tumor [11, 12]. There is also increasing acceptance that the mechanism of action of copper complexes is distinctly different, thereby providing the possibility of circumventing the problems encountered by platinum drugs. Additionally, the copper complexes are also reported to have a broader spectrum of activities and lower toxicity, and are able to overcome inherited and/or acquired resistance to cisplatin.
The review by Santini et al. found extensive research on copper complexes with anticancer properties reported between the years 2008 and 2012 but more work is needed to establish clear correlation between the in vitro antitumor activity of these complexes with the oxidation state, coordination number, or geometry [9]. In spite of this shortcoming, recent anticancer screening of copper(II) complexes still shows promising in vitro results [13–15]. However, recent in vivo studies of copper compounds are few and the tested compounds are copper(II) schiff base derived from 3-(3-phenyl-allylidene)pentane-2,4-dione, copper(II) thiosemicarbazone, trinuclear CuSn2(Trp) complex, copper carbonate-folic conjugated nanoparticles and Casiopeína’s group of copper(II) complexes [16–20]. In vivo administration of a copper(II) thiosemicarbazone, Cu(GTSC) significantly inhibited tumor growth in HCT116 (colon cancer cell line) xenografts in nude mice [17].
Nasopharyngeal cancer (NPC) is prevalent in southern China, Southeast Asia and northern Africa [21]. Malaysia has the highest incidence rate of NPC in the world [22]. Among men, NPC is the fifth most common cancer in Malaysia and most patients present at late stage [23, 24]. NPC usually presents at late stage because early stage of NPC may be asymptomatic or present with apparently trivial signs [25]. Radiotherapy and/or concurrent chemo-radiotherapy (CRT) is the treatment modality for NPC. Late toxicities remain a concern in the management of NPC [26, 27].
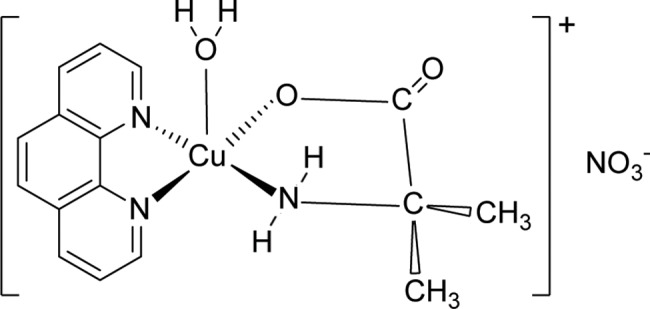
The current study is a continuation of our recent in vitro investigation of the anticancer property of a series of ternary copper(II) complexes, [Cu(phen)(aa)(H2O)]NO3∙xH2O (phen = 1,10-phenanthroline; aa = glycine, DL-alanine, sarcosine, α-dimethylglycine) [28, 29]. Here, we studied [Cu(phen)(C-dmg)(H2O)]NO3 (C-dmg = α-dimethylglycine) (Fig 1) (hereafter called Cu(II) complex), in which the chelated amino acid is non-proteinogenic. In vivo efficacy studies were performed using NOD scid gamma female mice (NSG) which were subcutaneously xenografted with nasopharyngeal carcinoma HK1 or C666-1-GFP-Luc2 cells. The mice were also evaluated for toxicity. We found that the Cu(II) complex could inhibit tumor growth at doses which was not associated with toxicity.
Fig 1. The structure of [Cu(phen)(C-dmg)(H2O)]NO3 with the Cu(II) complex as a square pyramidal cation and an uncoordinated nitrate anion.
Results and discussion
NCI60 five-dose screening
The [Cu(phen)(C-dmg)(H2O)]NO3 (Cu(II) complex) was submitted to the National Cancer Institute (NCI number S774845) for NCI60 human cell line screening. The panel consists of 60 human cancer cell lines from a variety of cancers, viz. leukemia, non-small cell lung (NSCLC), colon, central nervous system (CNS), melanoma, ovarian, renal, prostate and breast cancers. Five dose (0.01 μM -100 μM) antiproliferative and cytotoxicity analysis were done and the data was used to calculate 50% growth inhibition of tested cells (GI50), total growth inhibition (TGI), and lethal dose concentration inducing 50% cell death (LC50; raw values are available in (S1 Fig). Analysis of these data shows that the Cu(II) complex has a mean GI50 and LC50 values of 1.51 and 9.12 μM respectively. Comparison with those of cisplatin (with corresponding values of 1.49 and 44.00 μM; cisplatin NSC number 119875) reveals that this complex has equivalent activity based on 50% growth inhibition but is fivefold more cytotoxic.
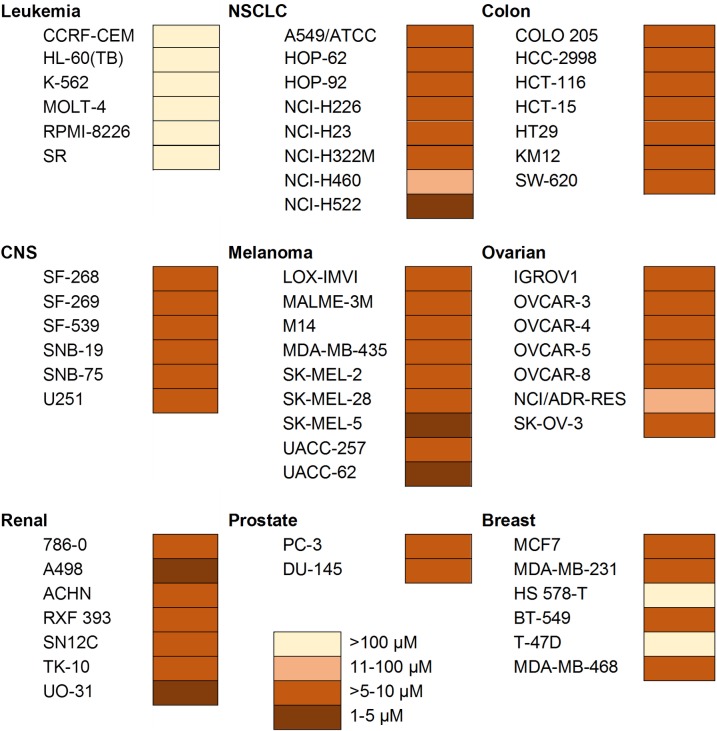
A heat map was constructed to visualize the Cu(II) complex LC50 concentrations for the cell lines in the NCI60 panel (Fig 2). In terms of LC50 values, the Cu(II) complex is cytotoxic (>5–10 μM) or strongly cytotoxic (1–5 μM) [30] towards a broad range of cell lines and most of the panel of cell lines (viz. NSCLC, colon, CNS, melanoma, ovarian, and prostate). This is the most striking feature and consequently, its anticancer effectiveness can be termed as broad spectrum. However, certain cell types appeared more resistant, suggesting that the Cu(II) complexes are not merely displaying general toxicity but have some selectivity. This is in concordance to our previous report in which the Cu(II) complexes were more toxic to cancer cells compared to non-cancer cells [28, 29]. Therefore, the mechanism of cell killing could be specific for certain cellular characteristics. The leukemia panel of cell lines tested (CCRF-CEM, HL-60(TB), K-562, MOLT-2, RPMI-8226, and SR) and breast cancer lines (T47D and HS578T) were resistant to the Cu(II) complex with LC50 values of more than 100 μM.
Fig 2. Heat map data representing LC50 concentrations of Cu(phen)(C-dmg)NO3 across the NCI-60 human cancer cell line panel.
Concentration ranges from most cytotoxic (1–5 μM) to least cytotoxic (>100 μM).
One of the causes of drug resistance is the overexpression of a family of 49 identified cell membrane transporter proteins which promote chemotherapeutic drug efflux [31]. Although not all have been thoroughly studied, some of these proteins have binding specificity to different substrates while others have overlapping substrate binding specificity. Multiple drug resistance 1 (MDR1; also called Pgp) and BCRP transporter proteins have been identified in leukemias and breast cancer, and they have been correlated or associated with chemoresistance in these cancer cell types respectively [32]. Most of the NCI leukemia cell lines were also reported to be resistant to [Cu(o-phthalate)(phenanthroline)] [30]. Strikingly, all renal cell lines were highly sensitive (LC50 values of 1–10 μM) to the present Cu(II) complex, in contrast to their resistance towards some Iridium(III) organometallic complexes [33]. The chemoresistance towards these Iridium(III) complexes was ascribed to the renal cell lines having a high abundance of multi-drug resistant MDR1 protein (Pgp) expression [32]. Taken together, this suggests that, the mechanism of resistance to copper complexes may be different from the mechanism of resistance to iridium (III) complexes. This also suggests that alteration of the design of metallodrug may be a possible approach to overcome drug resistance [31].
Cytotoxicity evaluation using rat primary hepatocytes
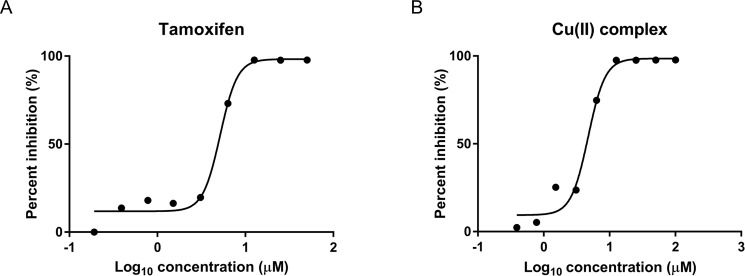
Drug-induced liver damage, i.e. hepatotoxicity, is a serious side effect of anticancer drugs. Among the in vitro models for testing hepatotoxicity, rat primary hepatocytes is one of the two types of cells that are extensively used [34]. Cytotoxicity assessment using rat primary hepatocytes was performed using a standard method which was reported to be a robust method in preclinical safety settings [34, 35]. Briefly, a series of wells, each containing 12.0 x 10³ viable hepatocytes in William’s medium, were incubated for 72 h at 37°C with decreasing concentrations of the Cu(II) complex (100, 50, 25, 12.5, 6.25, 3.125, 1.56, 0.78 and 0.39 μM) respectively. The percentage cytotoxicity was calculated as (100—viability) %. The Cu(II) complex exhibited cytotoxicity at concentrations over 3 μM (Fig 3) and the cytotoxic concentration that kills 50% of the cells (IC50) was found to be 4.7 μM. The IC50 of the anticancer drug, Tamoxifen (used as reference standard) was also determined and its value was 5.1 μM.
Fig 3. Cytotoxicity profile of tested compounds on rat primary hepatocytes.
Dose-response curve of hepatocytes exposed to Tamoxifen as standard (A) and Cu(II) complex (B) for 72 h. The viability was determined by resazurin assay and the IC50 of Cu(II) complex and tamoxifen are 4.7 μM and 5.1 μM respectively.
Assessment of CYP450 induction/inhibition
Assessment for potential drug-drug interaction is an important component of drug discovery and development [36]. About 25% of adverse drug reactions were caused by drug-drug interactions [36]. Most drug-drug interaction and drug metabolism occur in the hepatic cytochrome P450 (CYP) system [37]. CYP is a superfamily of metabolizing enzymes located primarily in hepatocytes. Inhibition or induction of CYP enzymes is a mechanism for drug-drug interaction. In the current work, the inhibition and induction of CYP enzymes were investigated. CYP induction assay was performed using rat primary hepatocytes for CYP 1A and 3A isoforms with dexamethasone (30 μM) and 3-methyl cholanthrene (1.0 μM) as probe substrates, respectively. Cytochrome CYP 3A enzymes are considered to be the most important enzymes catalyzing drug metabolism with broad substrate specificity while CYP 1A enzymes play key roles in the metabolic activation of aromatic hydrocarbons to carcinogenic metabolites [38–40]. In orally administered anticancer drug, gut wall CYP 3A enzyme is considered important for drug-drug interactions and xenobiotic interactions [37]. The results of the CYP 450 induction assay are tabulated in Table 1. The Cu(II) complex tested showed less than two folds of induction (<13% of positive control) in both tested CYP isoforms (enzymes) when compared to respective basal control (normal/untreated cells). Dexamethasone (potent inducer of rat CYP 3A) [39] and 3-methylcholanthrene (3-MC; potent inducer of CYP 1A) [40], which were used as reference standards (positive controls) showed more than 10 fold induction of both CYP 3A and 1A isoforms in comparison with basal controls (untreated cells), indicating validity of the assay. As the fold induction by the Cu(II) complex was not more than 40% of positive control [41], the results suggested that the Cu(II) complex did not cause significant induction of both CYP 3A and 1A isoforms under the tested conditions. This is favorable to the Cu(II) complex because induction of CYP 3A and CYP 1A is known to metabolize aromatic compounds into carcinogenic metabolites [40]. Nevertheless, further evaluation on human hepatocytes would be useful as there could be species-dependent metabolism [42].
Table 1. Induction of CYP enzymes CYP 1A and 3A by standard drugs and Cu(II) complex.
|
Compounds |
Fold induction | % of positive control | ||
|---|---|---|---|---|
| CYP3A | CYP1A | CYP3A | CYP1A | |
| Dexamethasone (30.0 μM)* | 27.3 | — | — | — |
| 3-Methyl cholanthrene (1.0 μM)* | — | 10.9 | — | — |
| Cu(II) complex (1.0 μM)** | 0.8 | 0.8 | 3.0 | 7.4 |
| Cu(II) complex (0.3 μM) | 1.2 | 1.4 | 4.3 | 13.0 |
| Cu(II) complex (0.1 μM) | 1.3 | 1.1 | 4.7 | 10.1 |
* Known reference standards (positive controls).
** Cell death observed (approximately 30%).
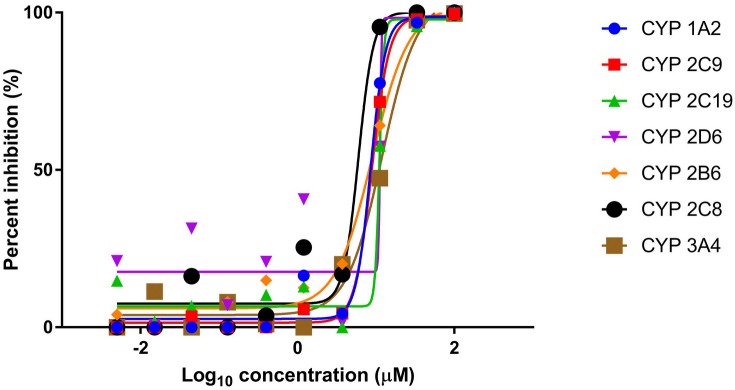
In the CYP inhibition assay, human liver microsomes were incubated with the Cu(II) complex or reference standard. The inhibitory effects of these compounds were investigated against the major CYP isoforms namely 1A2, 2C9, 2C19, 2D6, 2B6, 2C8 and 3A4 with their respective isoform probe substrates in one reaction mixture (pooled probe substrate format using LC-MS/MS). The percent inhibition curves against all the tested isoforms by the Cu(II) complex were plotted (Fig 4). The IC50 values of the Cu(II) complex were found to be approximately in the range 5–10 μM against all tested isoforms, showing that it may be a moderately potent inhibitor of these tested metabolic CYP enzymes (Table 2). The probe substrates of the reference standards have IC50 values of between 0.05–1.47 μM. This suggests that there could be inhibition of metabolism of drugs and endogenous compounds which are substrates of these CYP enzymes resulting in a potential drug-drug interaction.
Fig 4. Inhibition of CYP enzymes by Cu(II) complex: Plot of percent inhibition versus concentration of Cu(II) complex.
The inhibitory activity of Cu(II) complex was examined on seven CYP isoforms using pooled human liver microsomes and pooled probe substrate. The complex showed IC50 values of between 5 to 10 μM against the tested isoforms.
Table 2. IC50 values of CYP enzyme inhibition by Cu(II) complex and reference standards.
| IC50 (μM) | |||
|---|---|---|---|
| CYP Isoform | Cu(II) complex | Reference standards (Drugs) | |
| 1A2 | 8.01 | 0.16 | (Fluvoxamine) |
| 2C9 | 8.56 | 0.16 | (Sulfaphenazole) |
| 2C19 | 10.26 | 1.47 | (Fluoxamine) |
| 2D6 | 10.23 | 0.43 | (Quinidine) |
| 2B6 | 7.59 | 0.10 | (Ticlopidine) |
| 2C8 | 10.32 | 0.31 | (Quercetine) |
| 3A4 | 5.46 | 0.05 | (Ketoconazole) |
Acute in vivo toxicity of Cu(II) complex
Acute toxicity caused by the complex was tested on a method modified from the NCI single dose method [43]. The experiment was performed to find the maximum tolerated dose (MTD) for the calculation of doses for repeat-dose animal testing; the experiment was designed to minimize both the use of compound tested and the number of animals to be sacrificed. The MTD is defined as the maximum dose administered to the animal that does not result in drug-related lethality or body weight loss of equal or greater than 20 percent [44]. Five doses, viz. 35.0, 17.5, 12.5, 7.5 and 5.5 mg/kg body weight of the Cu(II) complex, were injected intraperitoneally as single doses into each mouse respectively and the mice were observed daily for 14 days for drug-induced toxicity. The findings of the acute toxicity study are listed in S1 Table. After 15 minutes of a single dose of 35 mg/kg of Cu(II) complex, the mouse showed signs of toxicity for the first 4 hours, such as immobility as well as unresponsiveness to provocation, and was found dead on the next day. Mice administered with 17.5 and 12.5 mg/kg doses displayed short-term signs of toxicity for the first 45 minutes such as staying at one corner of the cage but were responsive towards provocation and those signs resolved after 45 minutes. Mice that were dosed at 7.5 and 5.5 mg/kg did not show any remarkable clinical signs or abnormal behavior throughout the 14-day period. Therefore, the 50% of the lethal dose (LD50) of this compound was estimated to be 26.25 mg/kg whereas the MTD was estimated to be 17.5 mg/kg for a single dose treatment. Histopathological examination revealed that there were no significant morphological changes in all organs examined except for the 35 mg/kg dose, where the spleen of the mouse showed an increased in multinucleated giant cells, presence of hemosiderin-like pigment (yellow-greenish) and disappearance of clear demarcation between the white and red pulp due to congestion consistent with non-specific reactive changes.
Subacute toxicity
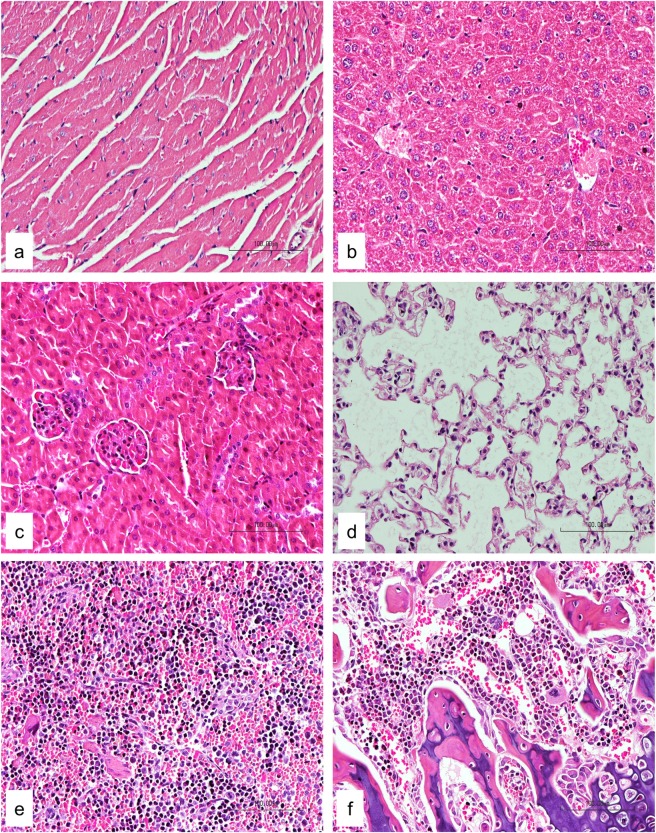
For subacute toxicity study, three groups of three NSG female mice each were used. Using the formula from NCI, the low dose and high dose were calculated from the MTD value (17.5 mg/kg estimated above) and these were 4 and 6 mg/kg respectively [43]. Mice in the first two groups were administered intraperitoneally with Cu(II) complex at doses of 4 and 6 mg/kg daily respectively for 14 days, while those in the control group received an equal volume of normal saline. The mice were observed for another 14 days to determine the delayed toxicity. No mortality was observed during the course of the study. All mice remained healthy with no obvious differences being noted in the general behavior, physical activities or clinical conditions with respect to the control group. The accumulative intraperitoneal doses administered in these groups were 56.0 and 84.0 mg/kg of the Cu(II) complex, respectively. There was no significant reduction of body weight observed during the treatment period (Fig 5) as well as throughout the whole study. The weight of vital organs was not significantly affected in treatment groups as compared to control group (Fig 6). The site of injections of mice showed some inflammation and induration but these disappeared during the 14-day observation after the last doses were given. Histopathological examination showed no significant morphological changes in all organs in mice treated with normal saline and the test compound (Fig 7). These results indicate that the Cu(II) complex did not cause significant systemic toxicity at the doses tested.
Fig 5. Subacute toxicity study: Mice body weight.
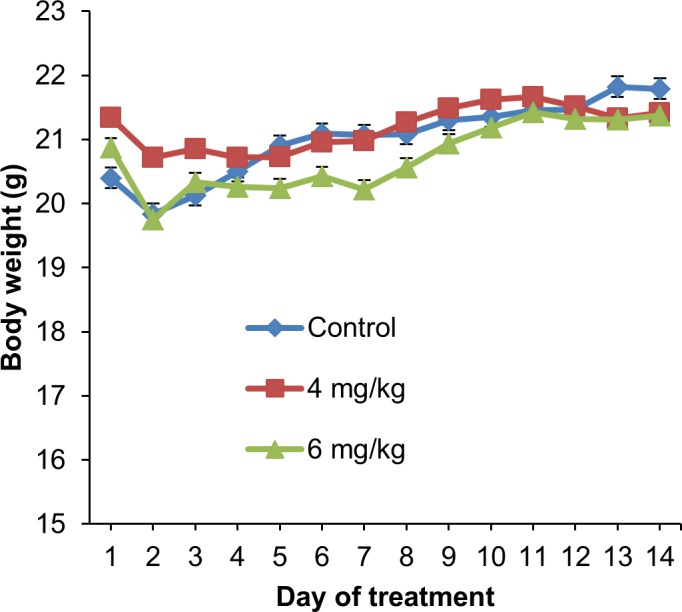
Daily monitoring of body weight of non-tumor bearing mice after intraperitoneal administration of normal saline (control group) or Cu(II) complex (4 and 6 mg/kg) daily for 14 days. The values are expressed as mean ± SEM of 3 animals per group.
Fig 6. Subacute toxicity study: Organ weight.
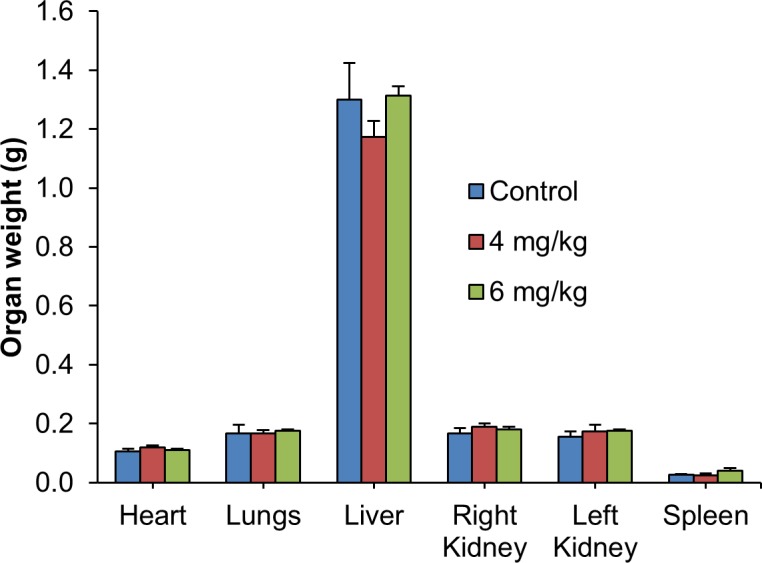
Weight of organs of non-tumor bearing mice after intraperitoneal administration of normal saline or Cu(II) complex (4 and 6 mg/kg) daily for 14 days. Organ weight measured at day 28 did not show any significant changes between the control and treatment groups. The values are expressed as mean ± SEM of 3 animals per group.
Fig 7. Subacute toxicity study: Histopathology examination of major organs.
Histological examination of heart (a), liver (b), kidney (c), lung (d), spleen (e) and femur (f) of 6 mg/kg group did not show any pathological changes (20x magnification).
Hematotoxicity evaluation
Hematotoxicity evaluation is important in the assessment of new anticancer drugs as this type of toxic side effect has limited the widespread use of cisplatin and other anticancer drugs. Values of hematological parameters of mice bearing C666-1-GFP-Luc2, an Epstein-barr virus (EBV) positive NPC cell line [45] xenografts which were treated with 4 and 5 mg/kg of the Cu(II) complex were compared with those from control groups (Table 3). The administration of the Cu(II) complex did not result in a significant reduction of total red blood cells (RBC), hemoglobin (Hb), packed cell volume (PVC) and thrombocytes. This indicated absence of anemia. However, mild leukocytosis due to increase-segmented neutrophils of marginal significance was observed in the 5 mg/kg group with a slight increase of total white blood cells (WBC) count (Table 3) as compared to the control group.
Table 3. Effects of Cu(II) complex on hematogical parameters in antitumor efficacy study on NPC.
| Treatment | |||||
|---|---|---|---|---|---|
| Unit | Control | 4 mg/kg | Control | 5 mg/kg | |
| RBC | (x1012/L) | 8.7 ± 0.2 | 7.8 ± 0.7 | 8.2 ± 0.3 | 7.8 ± 0.4 |
| Hemoglobin | (g/L) | 144.7 ± 2.9 | 126.8 ± 10.0 | 135.7 ± 4.3 | 133.7 ± 4.4 |
| PVC | (L/L) | 0.5 ± 0.0 | 0.4 ± 0.0 | 0.4 ± 0.0 | 0.4 ± 0.0 |
| MCV | (fL) | 53.0 ± 0.7 | 52.9 ± 1.2 | 52.9 ± 0.9 | 56.2 ± 1.8 |
| MCHC | (g/L) | 314.6 ± 4.5 | 308.5 ± 4.9 | 311.6 ± 4.1 | 308.3 ± 5.0 |
| WBC | (x109/L) | 2.2 ± 0.4 | 2.5 ± 0.5 | 2.3 ± 0.2 | 2.9 ± 0.3* |
| Band neutrophil | (x109/L) | 0.1 ± 0.0 | 0.1 ± 0.0 | 0.1 ± 0.0 | 0.1 ± 0.0 |
| Segmented neutrophil | (x109/L) | 1.7 ± 0.3 | 2.0 ± 0.4 | 1.8 ± 0.2 | 2.5 ± 0.2* |
| Lymphocytes | (x109/L) | 0.1 ± 0.0 | 0.2 ± 0.0 | 0.1 ± 0.0 | 0.1 ± 0.0 |
| Monocytes | (x109/L) | 0.3 ± 0.1 | 0.2 ± 0.1 | 0.2 ± 0.0 | 0.2 ± 0.0 |
| Eosinophils | (x109/L) | 0.0 ± 0.0 | 0.0 ± 0.0 | 0.0 ± 0.0 | 0.0 ± 0.0 |
| Basophils | (x109/L) | 0.0 ± 0.0 | 0.0 ± 0.0 | 0.0 ± 0.0 | 0.0 ± 0.0 |
| Thrombocytes | (x109/L) | 1353.7 ± 45.2 | 1659.0 ± 120.4 | 1506.3 ± 63.3 | 1288.2 ± 155.8 |
| Plasma protein | (g/L) | 65.3 ± 2.7 | 59.5 ± 2.2 | 62.4 ± 2.6 | 55.7 ± 2.5 |
The values were from the efficacy study on mice bearing C666-1-GFP-Luc2 xenograft. Data are expressed as mean ± SEM (group 4 mg/kg Cu(II) complex, n = 3–4; group 5 mg/kg, n = 6). Data for group 6 mg/kg Cu(II) complex was excluded due to insufficient sample size number of animals where only one out of four mice, had survived in the Cu(II) complex treated group.
*p<0.05 was considered significant using t-test. Asterisks denote significant difference compared to control.
Abbreviations: MCV, mean corpuscular volume; MCHC, mean corpuscular Hb concentration.
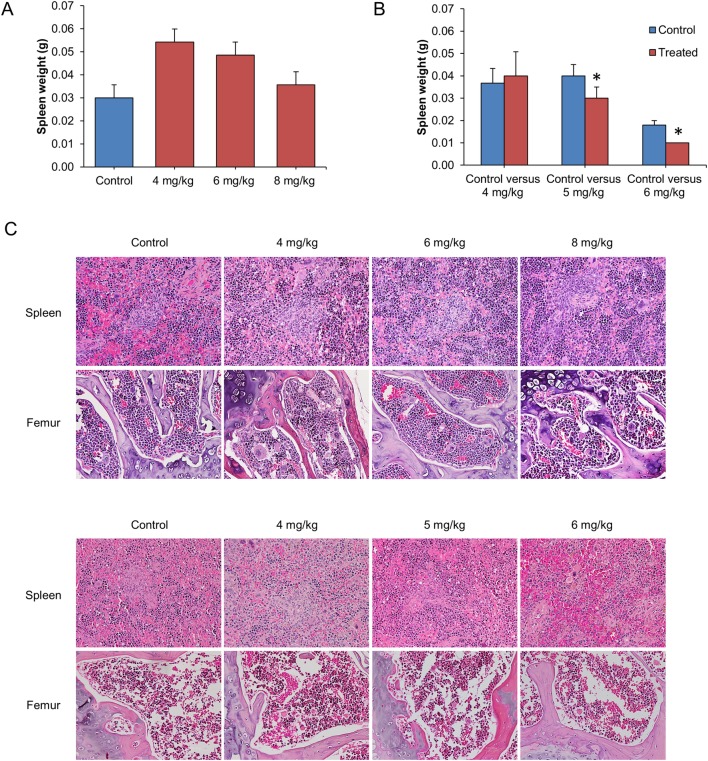
We further investigated the effects of Cu(II) complex on spleen and bone marrow (from femur) responses. Spleens from HK1 (a nasopharyngeal squamous carcinoma cell line) [46] bearing mice treated with Cu(II) complex (4, 6 and 8 mg/kg) did not show weight loss (Fig 8A) while those from C666-1-GFP-Luc2 bearing mice treated with 5 and 6 mg/kg groups were observed to have a significantly lower weight when compared with the control groups (Fig 8B). Histopathological analysis of spleen for both groups showed no significant pathological changes (Fig 8C). There was also no evidence of bone marrow suppression, a possible serious side effect of chemotherapy, found in all treated groups. In conclusion, taken together, the Cu(II) complex did not cause significant hematotoxicity in the 4 and 5 mg/kg regimes.
Fig 8. Toxicity study on hematopoietic and lymphoid systems in mice.
Hematotoxicity dose response by Cu(II) complex was evaluated by examining spleens and bone marrows (femurs) of mice from the efficacy studies. Weight of spleens from HK1 mice (A) and C666-1-GFP-Luc2 mice (B) treated with different doses of Cu(II) complex. No significant difference was observed in spleen weight except in mice with C666-1 (5 and 6 mg/kg group). (C) Histological examination of spleens and femurs (upper panel, HK1 mice; lower panel, C666-1 mice) did not show any significant pathological changes in all the treatment groups (20x magnification). The values are expressed as mean ± SEM of 3–6 animals per group. *p<0.05 was considered as statistical significant.
In vivo efficacy of Cu(II) complex in NPC xenograft models
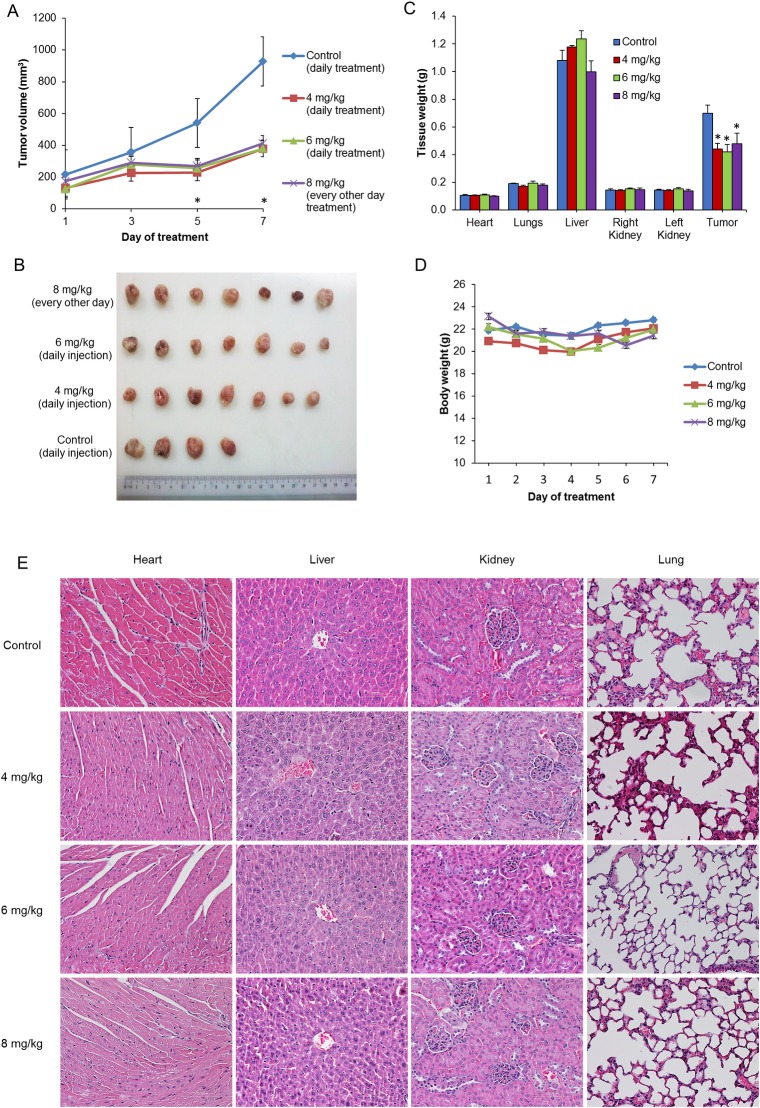
In our previous in vitro studies, we found that the current Cu(II) complex and other similar ternary Cu(II) complexes containing methylated glycine distinctively exerted greater antiproliferative activity towards and induced more apoptotic cell death in metastatic and cisplatin-resistant breast cancer cells (MDA-MB-231) than in non-tumorigenic (“normal”) breast epithelial cells (MCF10A) [28]. The Cu(II) complex was also found to be effective against cervical (HeLa), ovarian (SKOV3), lung (A549 and PC9), breast (MCF7), lymphoma (Namalwa), leukemia (HL60), and colorectal carcinoma (SW480, SW48, and HCT118) as well as NPC (HONE1, HK1, and C666-1) cell lines with IC50 values (24 h) in the 1.7–19.0 μM range. Recognizing the relative lack of treatment options for advanced NPC compared to other major cancers in Malaysia and based on our previous finding of the anticancer activity against NPC cells, we proceeded to validate the anticancer properties of the Cu(II) complex in vivo using NPC xenograft models. To test the compound in vivo in the preclinical models, two pilot studies were carried out using the Cu(II) complex. First, the effects of the Cu(II) complex were investigated on HK1 xenograft bearing mice at three different dosage regimens (4, 6 and 8 mg/kg). As shown in Fig 9A, the Cu(II) complex significantly inhibited the growth of HK1 tumor. The excised tumors of untreated and treated mice are shown in Fig 9B. The 4 and 6 mg/kg dose regimens were well tolerated with no significant body weight loss (Fig 9C). Even though treatment with Cu(II) complex at 8 mg/kg every other day up to 3 doses was effective, 2 out of 7 mice were found deadand the experiment had to be terminated. The weight of vital organs was not significantly affected in all treatment groups as compared to control group (Fig 9D). Histopathological examination of heart, liver, kidney and lung did not show any remarkable changes in all the groups (Fig 9E).
Fig 9. In vivo efficacy study on HKI xenograft mice treated with Cu(II) complex.
Treatments were given via intraperitoneal injections and the regimes were as described in the Materials and Methods. (A) Tumor volume, (B) excised tumors (C) tissue weight and (D) mice body weight were compared between control and treatment groups. Treatment with Cu(II) complex was found to suppress / inhibit tumor growth and reduce tumor weight. No significant changes were observed in body weight and vital organs. (E) Histological examination of heart, liver, kidney and lung also did not show any significant pathological changes in all the groups (20x magnification). Values are expressed as mean ± SEM of 4–7 animals per group. *p<0.05 compared to control.
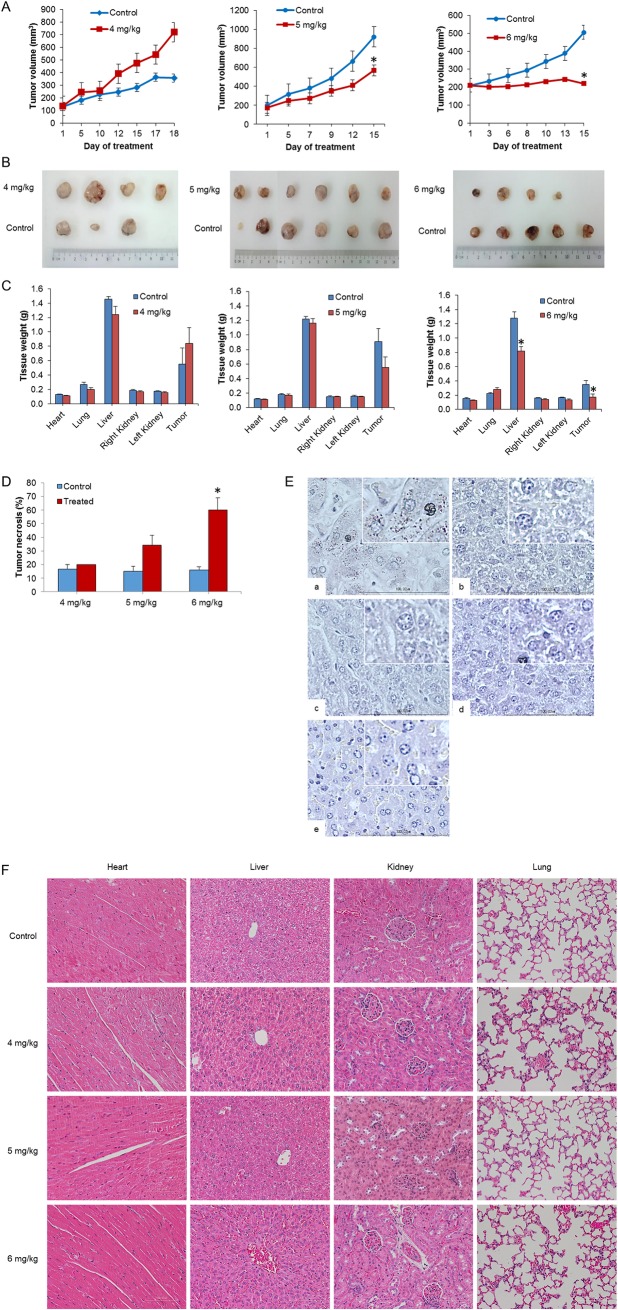
Next, we assessed the anticancer efficacy of the Cu(II) complex on another NPC xenograft, the EBV positive C666-1-GFP-Luc2 cells. As shown in Fig 10A, 4 mg/kg of Cu(II) complex was not effective at suppressing C666-1 tumor even though the treatment was extended to 18 days while 5 and 6 mg/kg treatment groups exhibited a significant tumor growth inhibition as compared to their control groups respectively. The relative sizes of the excised tumors of control mice versus treated mice, at termination of experiment, were consistent with the above results (Fig 10B) The 4 and 5 mg/kg dose regimens were well tolerated with none of experimental mice showing any signs and symptoms of toxicity. On the other hand, even though effective, only one mouse out of four mice in the 6 mg/kg group was well and survived throughout the experiment. Two mice in this group completed the 14 doses but died on the last day of the experiment while one mouse died on day 13 after receiving 12 doses of the Cu(II) complex. The treatment of Cu(II) complex or normal saline had little influence on the body weight of mice (S2 Fig). There were also no significant differences observed in the weight of vital organs except for liver in the 6 mg/kg group (Fig 10C). The Cu(II) complex treatment caused a higher percentage of necrotic area in the tumor xenografts of treated groups compared to control groups, and the percentage necrosis is concentration dependent (Fig 10D). Copper staining of liver sections from mice treated with the Cu(II) complex (4, 5 and 6 mg/kg) showed that all specimens were negative for copper deposits (Fig 10E). Harvested major organs sections stained with hematoxylin and eosin dyes were also examined. Histopathological examination of heart, liver, kidney and lung did not show any obvious abnormal changes in all the groups (Fig 10F). Therefore, no toxicity was found in mice carrying nasopharyngeal C666-1-GFP-Luc2 when treated with Cu(II) complexes at the doses of 4 mg/kg and 5 mg/kg. The underlying cause of death, presumed to be due to toxicity at the dose of 6 mg/kg, could not be ascertained conclusively because although the liver size was smaller in the treated group, the histopathology of the liver appeared normal and no other abnormalities were detected other than lower spleen size.
Fig 10. In vivo efficacy study on the EBV positive C666-1-GFP-Luc2 xenograft mice treated with Cu(II) complex.
(A) Tumor volume, (B) excised tumors and (C) tissue weight were compared between control and treatment groups. Only treatment with Cu(II) complex at 5 and 6 mg/kg were found to suppress/inhibit tumor growth and reduce tumor weight. No changes were observed in the weight of vital organs except for liver in the 6 mg/kg group. (D) Tumor treated with Cu(II) complex exhibited higher tumor necrotic percentage as compared to control groups. (E) Copper staining to stain for the presence of copper deposits in liver. (F) H&E staining of the major organs. Histological examination of heart, liver, kidney and lung did not show any significant pathological changes in all the groups (20x magnification). Values are expressed as mean ± SEM of 3–6 animals per group. *p<0.05 compared to control.
Growth inhibition of nasopharyngeal HK1 xenograft mice by the Cu(II) complex at 4 mg/kg was effective while that of EBV positive C666-1-GFP-Luc2 xenograft mice required higher doses (5 and 6 mg/kg). Previous work by others showed that a dicopper(II) complex at 4 mg/kg (weekly intraperitoneal injections) was also effective in reducing tumor growth in HepG2 xenograft BALB/c nu/nu nude mice [47]. Cu(II) complex of bis-thiosemicarbazone (GTSC) (5 mg/kg; daily intraperitoneal injection) significantly inhibited tumor growth in human colorectal HTC116 xenograft nude mice [17]. In comparison, a Ruthenium(II) complex, [Ru(dmb)2(salH)]PF6, significantly suppressed BGC823 (gastric cancer cells) xenograft growth in vivo at 5 mg/kg and exhibited insignificant nephrotoxicity and nephrotoxicity compared to cisplatin treatment at 4 mg/kg which was slightly less effective but induced considerable damage to liver and kidney [48].
These results suggest that Cu(II) complex displays potentially effective anticancer activity in vivo with some toxicity when tested at higher dosages.
Materials and methods
Materials and synthesis of Cu(II) complex
Materials and procedure for synthesis of theCu(II) complex was as reported previously [28].
Cell cultures
The NPC cell lines, HK1 and C666-1-GFP-Luc2 were maintained in an exponential growth phase in RPMI-1640 medium (Gibco, Life Technologies, Carlsbad, CA, USA) supplemented with 10% heat-inactivated fetal calf serum (FCS; Gibco), 100 U/ml penicillin (Gibco), 100 μg/ml streptomycin (Gibco), 0.25 μg/ml fungizone (Gibco) and 1X glutamax (Gibco) at 37°C in a 5% CO2 humidified atmosphere. HK1, an EBV-negative NPC cell line previously derived from a patient with a recurrent NPC [46] was kindly provided by Professor George SW Tsao (Hong Kong University, Hong Kong, China). C666-1 is an EBV-positive primary NPC cell line [45]. This C666-1 cell line was later transduced with a lentiviral carrying a green fluorescent protein (GFP) and a luciferase2 gene marker, a kind gift from Dr Marco Herold, Walter and Eliza Hall Institute of Medical Research, Australia [49]. Both cell lines were validated by DNA fingerprinting using AmpFISTR Identifiler Polymerase Chain Reaction (PCR) amplification kit (Applied Biosystems, Foster City, CA, USA) and confirmed free from mycoplasma contamination by using the e-Myco™ Mycoplasma PCR Detection Kit (iNtRON Biotechnology Inc., Seongnam, Korea).
Experimental animals
Six to eight weeks old, female NOD.Cg-PrkdcscidIl2rgtm1Wjl/SzJ or also known as NOD scid gamma (NSG, stock no. 005557) (Jackson Laboratory, Bar Harbor, Maine, USA) were used in the acute toxicity, subacute toxicity and in vivo efficacy studies. The mice were housed in individually ventilated cages with paper chips bedding (Pure-o’Cel, under specific pathogen-free environment with standard environmental conditions of temperature at 18°C—24°C, with a relative humidity of 45% - 65% and a 12 h dark-light cycle. The mice were allowed free access to acidified drinking water containing co-trimoxazole antibiotics (Xepa-Soul Pattinson Sdn. Bhd., Malacca, Malaysia) and standard pellet diet (Rodent NIH-31M Auto; Altromin Spezialfutter GmbH & Co. KG, Lage, Germany). All experimental protocols were approved by the Animal Care and Use Committee (ACUC) of the Ministry of Health, Malaysia (ACUC/KKM/02[5/2013]). Mice were monitored daily and if they showed any of the signs and symptoms of being unfit or moribund (even before the end point was reached), the mice would be sacrificed immediately.
For the ex-vivo experiments using primary hepatocytes, liver cells from Wistar rat were used. The procedures used were approved by the Institutional Animal Ethical Committee (IAEC) of Aurigene Discovery Technologies Limited based on the Committee for the Purpose of Control and Supervision on Experiments on Animals (CPCSEA) guidelines (Aurigene/IAEC/PCD/14 E-11/09-2014). Eight to ten weeks old male Wistar rats (originally from Charles River, USA) with a body weight range of 250–300 g were acclimatized for one-week to standard laboratory conditions. They were fed with standard rat diet (Teklad Global 14% protein diet, UK) and given water ad libitum.
Rat primary hepatocytes isolation and culturing
Rat primary hepatocytes were freshly isolated using a two-step collagenase method [50] under aseptic condition. Briefly, male rats were anesthetized by intramuscular administration of ketamine (90 mg/kg b.w.) and xylazine (10 mg/kg b.w.). Portal vein was cannulated for perfusion with washing buffer (contains 5 mM KCl, 136 mM NaCl, 25 mM NaHCO3, 1.2 mM Na2HPO4, 6 mM Glucose, 10 mM HEPES-Na, and 0.5 mM EGTA, pH 7.4) at flow rate of 30 ml/min for about 10–15 min until the liver turned into pale yellow when the inferior vena cava was cut for perfusate drainage. Then, the perfusion was switched to collagenase buffer (contains 2.5 mM CaCl2 and 0.04% collagenase IV in washing buffer) for about 10 min until the liver tissue became brittle. Carefully, the liver tissue was suspended in the remaining collagenase buffer and mashed gently with sterile blunt spatula to release the hepatocytes. The activity of the collagenase was stopped immediately by adding equal volume of William’s media containing fetal bovine serum (FBS). The cell suspension was filtered through a cell strainer with a 200 μM mesh into sterile 50 ml tubes and centrifuged for 3 min at 25 to 50 x g at 4°C (vital hepatocytes have the highest sedimentation rate and will therefore preferentially sediment). The cell pellet was gently resuspended with William’s medium and the suspension was filtered again through a cell strainer with a 100 μM mesh into new centrifugation tubes. The process mentioned above was repeated and the suspension was filtered through a cell strainer with a 60 μM mesh into new centrifugation tubes. After the third centrifugation, the cell pellet was resuspended in 20 ml of William’s media containing fetal bovine serum (FBS) and the viability was checked by trypan blue exclusion method.
Cytotoxicity in rat primary hepatocytes
12,000 viable rat liver cells in 100 μL growth medium per well were seeded into collagen-coated 96-well plate and incubated overnight at 37°C in a 5% CO2 humidified incubator. Prior to addition of compounds, the cells were washed and added with 90 μL of fresh William’s media containing 1% FBS. This was followed by the addition of 10 μL of compound working solution, prepared at 10X of the required concentration in William’s medium, to the respective wells (maximum allowable solvent percentage in this assay was 0.2% DMSO). The plate containing the liver cells was then incubated for 72 h at 37°C in 5% CO2 incubator. The liver cells were treated with Cu(II) complex at 100, 50, 25, 12.5, 6.25, 3.125, 1.56, 0.78 and 0.39 μM. In this assay, untreated cells with DMSO alone was used as negative control and cells treated with Tamoxifen as positive control. Four hours prior to the completion of the assay (3-day culture), the media in the wells were removed and the cells in the wells were washed with 1X PBS before finally adding 100 μL fresh PBS to each well. Then, 50 μL of 100 μg/ml resazurin solution was added to each well and the cells were incubated for 2 h at 37°C in CO2 incubator. The plate was finally scanned with a fluorescence plate reader (Spectramax Molecular Devices, USA; with excitation of 535 nm and emission wavelength of 590 nm) to determine the viability of the cells in each well.
Cytochrome P450 induction assay
5.0 x 10⁵ viable rat hepatocytes were seeded into collagen-coated 24 well plate in 500 μL William’s medium E (Sigma Aldrich) per well and they were incubated at 37°C in a 5% CO2 humidified incubator. After an overnight incubation, the medium in each designated well was replaced with 500 μL of fresh medium containing the specified concentration of Cu(II) complex (1.0, 0.3 and 0.1 μM), dexamethasone (30 μM), 3-methyl cholanthrene (1.0 μM) as reference standards (positive controls) or fresh medium alone (vehicle control). The cells were treated for 3 consecutive days with daily replacement of fresh medium containing compounds. After incubation, the cells were washed with 1X HBSS and the medium was replaced with 300 μL of probe substrates (Midazolam at 10 μM and Phenacetin at 100 μM; prepared in HBSS). The cells were then incubated for a further 20 min at 37°C with mild shaking. The reaction was terminated by adding 600 μL of cold acetonitrile followed by scraping of cells. The above mixture in each well was transferred to a tube, and these tubes were centrifuged at 10,000 rpm for 10 min. The concentration/level of metabolites in the supernatant was monitored by LC-MS/MS.
The extent of fold induction as well as percent of positive control was calculated relative to basal control (untreated) by using the following formula.
CYP450 inhibition assays
Pooled human liver microsomes (Sekisui Xeno Tech, LLC., Kansas City, KS, USA) were incubated with different concentrations of Cu(II) complex or reference standards in buffer containing 0.1% DMSO for 10 min at 37°C and the residual enzyme activity was measured using pooled probe substrates method by pooled LC-MS/MS. Briefly, incubation mixtures were prepared in a total volume of 200 μL with final component concentrations as follows: 0.1 M potassium phosphate buffer (pH 7.4), 1.5 mM NADPH, and 0.25 mg/ml HLM. Probe substrates used were phenacetin (50 μM) for CYP 1A2, bupropion (50 μM) for CYP 2B6, amodiaquine (0.1 μM) for CYP 2C8, tolbutamide (50 μM) for CYP 2C9, S-mephenytoin (120 μM) for CYP 2C19, dextromethorphan (5μM) for CYP 2D6 and midazolam (5 μM) for CYP 3A4. After 20 min of incubation, the reactions were terminated by addition of 200 μL ice-cold acetonitrile (Rankem, Avantor Performance Materials India Limited, Andhra Pradesh, India) containing telmisartan and carbamazepine as internal standards (all probe substrates and standards were from Sigma Aldrich). Each reaction mixture was centrifuged at 3,500 rpm for 5 min and the supernatant was subjected to LC-MS/MS analysis. The percent inhibition was calculated using the following equation:
NCI60 cell five-dose screen
The Cu(II) complex were submitted to the National Cancer Institute for screening on its panel of 60 cancer cell lines. The protocols used by the NCI have been described previously [51, 52]. Cells of each cell line were seeded in 96-well plates at densities ranging from 5,000–40,000 cells per well depending on the doubling time of individual cell lines. Briefly, cells were exposed to the Cu(II) complex at 0, 0.1, 1.0, 10 and, 100 μM and incubated for 48 h at 37°C in a humidified atmosphere containing 5% CO2. The cells were then fixed and stained with sulforhodamine B (SRB) solution to determine their viability, and subsequently calculate the GI50, TGI and LC50.
Acute toxicity
Determination of acute toxicity was carried out using a method adapted from the NCI [43]. Five mice were randomly separated into five cages. Five doses, i.e. 35.0, 17.5, 12.5, 7.5 and 5.5 mg/kg of body weight of Cu(II) complex were injected intraperitoneally as a single dose into each mouse respectively. After the drug administration, mice were observed hourly for any signs of toxicity, mortality, changes in general behavior and physical activities for the first 4 hours, then 4 hourly for 1 day followed by daily observation for 2 weeks. The signs which were monitored and recorded during this study included hypoactivity, lethargy, hypoapnoea, abnormal gait and posture, tremors, arching and rolling, convulsions, salivation and diarrhea. Mouse death during the period of observation was considered as death due to toxic effects of the test compound. The lethal dose and maximum tolerated dose (MTD) were determined during this study. At the end of the experiment, the survivors were sacrificed for necropsy. Gross and histopathological examinations were performed on the major internal organs including the heart, lung, liver, kidney and spleen.
Subacute toxicity
Mice were divided into three groups of 3 mice each. The Cu(II) complex was administered intraperitoneally at the doses of 4 and 6 mg/kg daily for 14 days, while the control group received an equal volume of normal saline. The mice were observed for another 14 days to determine the delayed toxicity. Signs of toxicity, mortality, body weight, food consumption and water intake were monitored and recorded daily. Adverse effects such as rapid or consistent body weight loss reaching 20%, blood stained discharges, labored breathing, paralysis, anemia, and other signs and symptoms mentioned in the acute toxicity study, was used as criteria for termination. At the end of the experiment, the mice were sacrificed and the major organs including the heart, lung, liver, kidney and spleen were examined for gross and histopathological changes.
NPC xenograft models and in vivo efficacy assay
2.0 x 10⁶ HK1 or C666-1-GFP-Luc2 cells in 100 μl RPMI media mixed with matrigel (BD Matrigel Basement Membrane Matrix; BD Biosciences, Bedford, MA, USA) was inoculated subcutaneously into the right lower flank of the NSG mice. Tumor growth was monitored and measured every other day using a digital caliper (Mitutoyo America Corporation, Aurora, Illinois, USA) until they reached 100–250 mm3. Then, the mice were randomly assigned into treatment groups. The mice bearing HK1 xenograft tumor were divided into 3 treatment groups and a control (normal saline) group. The first batch received normal saline (one injection daily for 5 days), 6 mg/kg (one injection daily for 5 days) and 8 mg/kg (one injection every other day for 3 doses) of Cu(II) complex while the second batch received normal saline (one injection daily for 4 days), 4 mg/kg (one injection daily for 4 days), 6 mg/kg (one injection daily for 4 days) and 8 mg/kg (one injection every other day for 2 doses) of Cu(II) complex via intraperitoneal route.
Subsequently, for the efficacy assay using mice bearing C666-1-GFP-Luc2 cells, 3 sets of control group versus experimental group were tested in three independent experiments. Mice were randomly assigned into 4, 5 or 6 mg/kg Cu(II) complex and their control groups respectively. Injections were given once daily for 12 to 18 days. Body weight change, food intake, signs of toxicity/morbidity as well as mortality were observed and recorded daily for the duration of the entire experiment. Tumor volumes were determined using a caliper thrice weekly. Tumor volumes were calculated according to the following formula: Tumor volume (mm3) = (length [mm] X width2 [mm2])/2. At the end point of the studies, mice were placed under anesthesia for blood collection via submandibular and cardiac puncture before they were sacrificed for histopathological investigations. Tumors were harvested, imaged, weighed and fixed in formalin.
Blood analysis
Blood samples were collected into BD Microtainer Tubes containing dipotassium EDTA (Becton, Dickinson and Company, New Jersey, USA) and submitted to the Veterinary Laboratory Services Unit, Faculty of Veterinary Medicine, Universiti Putra Malaysia, Serdang, Malaysia, for full blood count (FBC) analysis.
Histopathology
Major organs, bones and excised tumors were preserved in 10% neutral buffered formaldehyde solution (Leica Biosystems, Germany) for 24 to 48 h and subsequently processed into formalin-fixed paraffin-embedded tissue blocks following standard tissue processing protocol using Leica ASP300 S (Leica Biosystems, Nussloch, Germany). Fixed bones (skull, femur and tibia) were decalcified with Surgipath Decalcifier I (Leica Biosystems, Germany) for 4 to 6 h depending on size before tissue processing. After paraffin embedding, tissue blocks were sectioned (4 μM thick) using rotary microtome Microm HM340E (Thermo Scientific, Walldorf, Germany) and stained with hematoxylin and eosin (H&E) dyes using Leica Autostainer XL (Leica Biosystems, Nussloch, Germany) before histopathological examination.
Microscopy
All H&E-stained tissue section slides were examined under Nikon Eclipse Ni microscope (Nikon Instruments Inc., New York, USA) and microscopic images were taken using 20x and 40x objectives. For H&E tumor section slides, the percentage of tumor necrosis was determined qualitatively using microscope by the histopathologist in order to estimate the percentage of necrotic area induced by the Cu(II) complex in the tumors. For determination of femoral bone marrow suppression, low power (10x magnification) objective was used to scan the slides while 100x magnification to assess the degree of cellularity and amount of fat present.
Copper staining
To demonstrate copper deposits in tissue sections, Copper Stain Kit (Abcam, Cambridge, Massachusetts, USA) containing rhodamine stock solution, acetate buffer solution (pH 8.0) and hematoxylin was used. Firstly, 4 ml of rhodamine stock solution was combined with 46 ml of acetate buffer solution in order to prepare a working rhodamine solution. Tissue sections were prepared, deparaffinized and hydrated in distilled water. Then, a loosely capped staining jar containing working rhodamine was warmed in the microwave oven (Panasonic Corporation, Osaka, Japan). The slide with tissue section was placed in warmed working rhodamine solution and reheated using microwave oven. After that, the jar was capped, carefully agitated using a rotator and allowed to cool to room temperature for 15–20 min. Next, the slides were examined under Nikon Eclipse Ni microscope (Nikon Instruments Inc., New York, USA) for presence of copper deposits and repeated heating and cooling cycle until desired staining intensity was achieved. The slides were rinsed twice with acetate buffer solution for 1 min each, dipped for five times in hematoxylin solution and rinsed thrice with acetate buffer solution. Then the slides were dehydrated in absolute alcohol for 1 min each for three times and cleared in two changes of xylene prior to slide mounting.
Statistical analysis
Measurements were expressed as mean ± SEM and analyzed using GraphPad Prism 6 (GraphPad Software, San Diego, USA) and Microsoft Excel Version 2013 (Microsoft Corporation, Redmond, USA). A p-value of <0.05 between experimental and control groups was considered statistically significant. ANOVA was used to determine differences among different groups over treatment time, followed by post-hoc Tukey’s test. The Student’s t-test was also used for univariate analysis where p<0.05 was considered as statistical significance.
Conclusions
The anticancer efficacy evaluation on the NCI-60 cell lines shows that Cu(II) complex is broad spectrum. The Cu(II) complex did not cause significant induction of both cytochrome P450 (CYP) broad spectrum metabolizing 3A and aromatic hydrocarbon metabolizing 1A enzymes, suggesting it would not cause drug-drug interaction via microsomal enzyme induction. However, it moderately inhibited CYP isoforms 1A2, 2C9, 2C19, 2D6, 2B6, 2C8 and 3A4. The Cu(II) complex inhibited the growth of NPC xenografts at doses which did not result in significant toxicity. However, higher doses which resulted in even better inhibition of tumor growth was associated with toxicity. Further work would be useful for the development of these Cu(II) complexes as anticancer agents.
Supporting information
(TIF)
4 mg/kg group received 18 days daily treatment while 5 and 6 mg/kg groups received 14 days daily treatment. The values are expressed as mean ± SEM of 3–6 animals per group.
(TIF)
(DOCX)
Acknowledgments
We thank the Director General of Health Malaysia for his permission to publish this article and the Director of the Institute for Medical Research (IMR) for her support. The authors would like to thank the NCI Developmental Therapeutics Program, funded by National Cancer Institute, National Institutes of Health (NIH-NCI), for the 5-dose 60-cell line screening. We would also like to thank Sangamesh Badiger, Krishnamurthy Narisimha Rao and Bhavesh Choudhary of Aurigene Discovery Technologies Ltd, Bangalore, India; Nurul Ashikin MS, Norfazlina MN, Mohd Zaim Zawawi Y and other staff of Molecular Pathology Unit, IMR for their assistance and support. The Cu(II) complex used is covered by Patent MY-157886-A of which MA, CHN, ASBK are co-inventors [29].
Data Availability
All relevant data are within the paper and its Supporting Information files.
Funding Statement
This work was supported by Ministry of Health Malaysia (JPP 12-046; NMRR-13-898-17054) and Ministry of Science, Technology and Innovation eScience grants (02-02-SF0033; 02-02-09-SF0036). The funders did not have any role in the study design, data collection and analysis, decision to publish, or preparation of the manuscript. Aurigene Discovery Technologies Limited provided support in the form of salaries for author [DSS], but did not have any additional role in the study design, data collection and analysis, decision to publish, or preparation of the manuscript. The salaries of authors [MA, SNS, TLC, NAA, NKMK, KWL, CHN, ASBK] were through their respective institutes independent of the grants. The specific roles of these authors are articulated in the 'author contributions' section.
References
- 1.Zaki M, Arjmand F, Tabassum S. Current and future potential of metallo drugs: Revisiting DNA-binding of metal containing molecules and their diverse mechanism of action. Inorg Chim Acta. 2016;444:1–22. [Google Scholar]
- 2.Allardyce CS, Dyson PJ. Metal-based drugs that break the rules. Dalton Trans. 2016. February 28;45(8):3201–9. doi: 10.1039/c5dt03919c . [DOI] [PubMed] [Google Scholar]
- 3.Wheate NJ, Walker S, Craig GE, Oun R. The status of platinum anticancer drugs in the clinic and in clinical trials. Dalton Trans. 2010. September 21;39(35):8113–27. doi: 10.1039/c0dt00292e . [DOI] [PubMed] [Google Scholar]
- 4.El-Naga RN. Pre-treatment with cardamonin protects against cisplatin-induced nephrotoxicity in rats: impact on NOX-1, inflammation and apoptosis. Toxicol Appl Pharmacol. 2014. January 01;274(1):87–95. doi: 10.1016/j.taap.2013.10.031 . [DOI] [PubMed] [Google Scholar]
- 5.Knox RJ, Friedlos F, Lydall DA, Roberts JJ. Mechanism of cytotoxicity of anticancer platinum drugs: evidence that cis-diamminedichloroplatinum(II) and cis-diammine-(1,1-cyclobutanedicarboxylato)platinum(II) differ only in the kinetics of their interaction with DNA. Cancer Res. 1986. April;46(4 Pt 2):1972–9. . [PubMed] [Google Scholar]
- 6.Hambley TW. Developing new metal-based therapeutics: challenges and opportunities. Dalton Trans. 2007. November 21(43):4929–37. doi: 10.1039/b706075k . [DOI] [PubMed] [Google Scholar]
- 7.Sava G, Jaouen G, Hillard EA, Bergamo A. Targeted therapy vs. DNA-adduct formation-guided design: thoughts about the future of metal-based anticancer drugs. Dalton Trans. 2012;41(27):8226–34. doi: 10.1039/c2dt30075c [DOI] [PubMed] [Google Scholar]
- 8.Medici S, Peana M, Nurchi VM, Lachowicz JI, Crisponi G, Zorod MA. Noble metals in medicine: Latest advances. Coord Chem Rev. 2015;284:329–50. [Google Scholar]
- 9.Santini C, Pellei M, Gandin V, Porchia M, Tisato F, Marzano C. Advances in Copper Complexes as Anticancer Agents. Chem Rev. 2014;114(1):815–62. doi: 10.1021/cr400135x [DOI] [PubMed] [Google Scholar]
- 10.Spreckelmeyer S, Orvig C, Casini A. Cellular transport mechanisms of cytotoxic metallodrugs: an overview beyond cisplatin. Molecules. 2014. September 29;19(10):15584–610. doi: 10.3390/molecules191015584 . [DOI] [PMC free article] [PubMed] [Google Scholar]
- 11.Gandin V, Trenti A, Porchia M, Tisato F, Giorgetti M, Zanusso I, et al. Homoleptic phosphino copper(I) complexes with in vitro and in vivo dual cytotoxic and anti-angiogenic activity. Metallomics. 2015. November;7(11):1497–507. doi: 10.1039/c5mt00163c . [DOI] [PubMed] [Google Scholar]
- 12.Denoyer D, Masaldan S, La Fontaine S, Cater MA. Targeting copper in cancer therapy: 'Copper That Cancer'. Metallomics. 2015. November;7(11):1459–76. doi: 10.1039/c5mt00149h . [DOI] [PubMed] [Google Scholar]
- 13.Nagababu P, Barui AK, Thulasiram B, Devi CS, Satyanarayana S, Patra CR, et al. Antiangiogenic activity of mononuclear copper(II) polypyridyl complexes for the treatment of cancers. J Med Chem. 2015. July 09;58(13):5226–41. doi: 10.1021/acs.jmedchem.5b00651 . [DOI] [PubMed] [Google Scholar]
- 14.Qin QP, Liu YC, Wang HL, Qin JL, Cheng FJ, Tang SF, et al. Synthesis and antitumor mechanisms of a copper(II) complex of anthracene-9-imidazoline hydrazone (9-AIH). Metallomics. 2015. July;7(7):1124–36. doi: 10.1039/c5mt00027k . [DOI] [PubMed] [Google Scholar]
- 15.Křikavová R, Vančo J, Trávníček Z, Buchtík R, Dvořák Z. Copper(II) quinolinonato-7-carboxamido complexes as potent antitumor agents with broad spectra and selective effects. RSC Adv. 2016;6:3899–909. [Google Scholar]
- 16.Raman N, Jeyamurugan R, Senthilkumar R, Rajkapoor B, Franzblau SG. In vivo and in vitro evaluation of highly specific thiolate carrier group copper(II) and zinc(II) complexes on Ehrlich ascites carcinoma tumor model. Eur J Med Chem. 2010. November;45(11):5438–51. doi: 10.1016/j.ejmech.2010.09.004 . [DOI] [PubMed] [Google Scholar]
- 17.Palanimuthu D, Shinde SV, Somasundaram K, Samuelson AG. In vitro and in vivo anticancer activity of copper bis(thiosemicarbazone) complexes. J Med Chem. 2013. February 14;56(3):722–34. doi: 10.1021/jm300938r . [DOI] [PubMed] [Google Scholar]
- 18.Zaidi Y, Arjmand F, Zaidi N, Usmani JA, Zubair H, Akhtar K, et al. A comprehensive biological insight of trinuclear copper(II)-tin(IV) chemotherapeutic anticancer drug entity: in vitro cytotoxicity and in vivo systemic toxicity studies. Metallomics. 2014. August;6(8):1469–79. doi: 10.1039/c4mt00035h . [DOI] [PubMed] [Google Scholar]
- 19.Bravo-Gómez ME, Dávila-Manzanilla S, Flood-Garibay J, Muciño-Hernández MA, Mendoza A, García-Ramos JC, et al. Secondary Ligand Effects on the Cytotoxicity of Several Casiopeína’s Group II Compounds. J Mex Chem Soc. 2012;56(1):85–92. [Google Scholar]
- 20.Silva-Platas C, Guerrero-Beltran CE, Carranca M, Castillo EC, Bernal-Ramirez J, Oropeza-Almazan Y, et al. Antineoplastic copper coordinated complexes (Casiopeinas) uncouple oxidative phosphorylation and induce mitochondrial permeability transition in cardiac mitochondria and cardiomyocytes. J Bioenerg Biomembr. 2016. February;48(1):43–54. doi: 10.1007/s10863-015-9640-x . [DOI] [PubMed] [Google Scholar]
- 21.Tang LL, Chen WQ, Xue WQ, He YQ, Zheng RS, Zeng YX, et al. Global trends in incidence and mortality of nasopharyngeal carcinoma. Cancer Lett. 2016. April 28;374(1):22–30. doi: 10.1016/j.canlet.2016.01.040 . [DOI] [PubMed] [Google Scholar]
- 22.Ferlay J, Soerjomataram I, Dikshit R, Eser S, Mathers C, Rebelo M, et al. Cancer incidence and mortality worldwide: sources, methods and major patterns in GLOBOCAN 2012. Int J Cancer. 2015. March 01;136(5):E359–86. doi: 10.1002/ijc.29210 . [DOI] [PubMed] [Google Scholar]
- 23.Azizah AM, Norsaleha IT, Noor Hashimah A, Asmah ZA, Mastulu W. Malaysian National Cancer Registry Report 2007–2011. 2016.
- 24.Pua KC, Khoo AS, Yap YY, Subramaniam SK, Ong CA, Gopala Krishnan G, et al. Nasopharyngeal Carcinoma Database. Med J Malaysia. 2008. September;63 Suppl C:59–62. . [PubMed] [Google Scholar]
- 25.Khoo ASB, Pua KC. Diagnosis and clinical evaluation of nasopharyngeal carcinoma In: Busson P, editor. Nasopharyngeal Carcinoma: Keys for Translational Medicine and Biology (Advances in Experimental Medicine and Biology) 2013 ed: Springer, Landes Bioscience; 2013. p. 1–9. [Google Scholar]
- 26.Lee AW, Lin JC, Ng WT. Current management of nasopharyngeal cancer. Semin Radiat Oncol. 2012. July;22(3):233–44. doi: 10.1016/j.semradonc.2012.03.008 . [DOI] [PubMed] [Google Scholar]
- 27.Yom SS, Wee J. Clinical Insights: Nasopharyngeal Carcinoma–Management Strategies: Futute Medicine Ltd; 2014. [Google Scholar]
- 28.Ng CH, Kong SM, Tiong YL, Maah MJ, Sukram N, Ahmad M, et al. Selective anticancer copper(II)-mixed ligand complexes: targeting of ROS and proteasomes. Metallomics. 2014. April;6(4):892–906. doi: 10.1039/c3mt00276d . [DOI] [PubMed] [Google Scholar]
- 29.Ng CH, Kong SM, Khoo AS, Ahmad M, inventors. Copper(II)-Mixed Ligand Complexes with Anticancer Properties. Malaysia patent MY-157886-A. 2016.
- 30.Slator C, Barron N, Howe O, Kellett A. [Cu(o-phthalate)(phenanthroline)] Exhibits Unique Superoxide-Mediated NCI-60 Chemotherapeutic Action through Genomic DNA Damage and Mitochondrial Dysfunction. ACS Chem Biol. 2016. January 15;11(1):159–71. doi: 10.1021/acschembio.5b00513 . [DOI] [PubMed] [Google Scholar]
- 31.Holohan C, Van Schaeybroeck S, Longley DB, Johnston PG. Cancer drug resistance: an evolving paradigm. Nat Rev Cancer. 2013. October;13(10):714–26. doi: 10.1038/nrc3599 . [DOI] [PubMed] [Google Scholar]
- 32.Ma P, Dong X, Swadley CL, Gupte A, Leggas M, Ledebur HC, et al. Development of idarubicin and doxorubicin solid lipid nanoparticles to overcome Pgp-mediated multiple drug resistance in leukemia. J Biomed Nanotechnol. 2009. April;5(2):151–61. . Pubmed Central PMCID: 2805476. [DOI] [PMC free article] [PubMed] [Google Scholar]
- 33.Hearn JM, Romero-Canelon I, Qamar B, Liu Z, Hands-Portman I, Sadler PJ. Organometallic Iridium(III) anticancer complexes with new mechanisms of action: NCI-60 screening, mitochondrial targeting, and apoptosis. ACS Chem Biol. 2013;8(6):1335–43. doi: 10.1021/cb400070a . Pubmed Central PMCID: 3691721. [DOI] [PMC free article] [PubMed] [Google Scholar]
- 34.Soldatow VY, Lecluyse EL, Griffith LG, Rusyn I. In vitro models for liver toxicity testing. Toxicol Res (Camb). 2013. January 01;2(1):23–39. doi: 10.1039/C2TX20051A . Pubmed Central PMCID: 3593300. [DOI] [PMC free article] [PubMed] [Google Scholar]
- 35.Bonney RJ, Becker JE, Walker PR, Potter VR. Primary monolayer cultures of adult rat liver parenchymal cells suitable for study of the regulation of enzyme synthesis. In Vitro. 1974. May-Jun;9(6):399–413. . [DOI] [PubMed] [Google Scholar]
- 36.Tao X, Zheng L, Qi Y, Xu Y, Xu L, Yin L, et al. Inhibitory effects of dioscin on cytochrome P450 enzymes. RSC Adv. 2014;4(96):54026–31. [Google Scholar]
- 37.Beijnen JH, Schellens JH. Drug interactions in oncology. Lancet Oncol. 2004. August;5(8):489–96. doi: 10.1016/S1470-2045(04)01528-1 . [DOI] [PubMed] [Google Scholar]
- 38.Bjorkhem-Bergman L, Backstrom T, Nylen H, Ronquist-Nii Y, Bredberg E, Andersson TB, et al. Quinine compared to 4beta-hydroxycholesterol and midazolam as markers for CYP3A induction by rifampicin. Drug Metab Pharmacokinet. 2014;29(4):352–5. . [DOI] [PubMed] [Google Scholar]
- 39.Chr.’t Hoen PA, Commandeur JNM, Vermeulen NPE, Van Berkel TJC, Bijsterbosch MK. Selective induction of cytochrome P450 3A1 by dexamethasone in cultured rat hepatocytes: Analysis with a novel reverse transcriptase–polymerase chain reaction assay. Biochem Pharmacol. 2000;60(10):1509–18. [DOI] [PubMed] [Google Scholar]
- 40.Jiang W, Wang L, Zhang W, Coffee R, Fazili IS, Moorthy B. Persistent induction of cytochrome P450 (CYP)1A enzymes by 3-methylcholanthrene in vivo in mice is mediated by sustained transcriptional activation of the corresponding promoters. Biochem Biophys Res Commun. 2009. December 25;390(4):1419–24. doi: 10.1016/j.bbrc.2009.11.021 . Pubmed Central PMCID: 2787915. [DOI] [PMC free article] [PubMed] [Google Scholar]
- 41.U.S. Department of Health and Human Services, FDA, Center for Drug Evaluation and Research (CDER). Guidance for industry, drug interaction studies—study design, data analysis, implications for dosing, and labeling recommendations. 2012.
- 42.Lu C, Li AP. Species comparison in P450 induction: effects of dexamethasone, omeprazole, and rifampin on P450 isoforms 1A and 3A in primary cultured hepatocytes from man, Sprague-Dawley rat, minipig, and beagle dog. Chem Biol Interact. 2001. May 16;134(3):271–81. . [DOI] [PubMed] [Google Scholar]
- 43.Acute Toxicity Determination. Available from: https://dtp.cancer.gov/organization/btb/acute_toxicity.htm.
- 44.Cao S, Durrani FA, Toth K, Rustum YM. Se-methylselenocysteine offers selective protection against toxicity and potentiates the antitumour activity of anticancer drugs in preclinical animal models. Br J Cancer. 2014. April 02;110(7):1733–43. doi: 10.1038/bjc.2014.85 . Pubmed Central PMCID: 3974093. [DOI] [PMC free article] [PubMed] [Google Scholar]
- 45.Cheung ST, Huang DP, Hui AB, Lo KW, Ko CW, Tsang YS, et al. Nasopharyngeal carcinoma cell line (C666-1) consistently harbouring Epstein-Barr virus. Int J Cancer. 1999. September 24;83(1):121–6. . [DOI] [PubMed] [Google Scholar]
- 46.Huang DP, Ho JH, Poon YF, Chew EC, Saw D, Lui M, et al. Establishment of a cell line (NPC/HK1) from a differentiated squamous carcinoma of the nasopharynx. Int J Cancer. 1980. August;26(2):127–32. . [DOI] [PubMed] [Google Scholar]
- 47.Jia L, Xu J, Zhao X, Shen S, Zhou T, Xu Z, et al. Synthesis, characterization, and antitumor activity of three ternary dinuclear copper (II) complexes with a reduced Schiff base ligand and diimine coligands in vitro and in vivo. J Inorg Biochem. 2016. June;159:107–19. doi: 10.1016/j.jinorgbio.2016.02.033 . [DOI] [PubMed] [Google Scholar]
- 48.Hu P, Wang Y, Zhang Y, Song H, Gao F, Lin H, et al. Novel mononuclear ruthenium(II) complexes as potent and low-toxicity antitumour agents: synthesis, characterization, biological evaluation and mechanism of action. RSC Adv. 2016;6(36):29963–76 [Google Scholar]
- 49.Kelly GL, Grabow S, Glaser SP, Fitzsimmons L, Aubrey BJ, Okamoto T, et al. Targeting of MCL-1 kills MYC-driven mouse and human lymphomas even when they bear mutations in p53. Genes Dev. 2014. January 01;28(1):58–70. doi: 10.1101/gad.232009.113 . Pubmed Central PMCID: 3894413. [DOI] [PMC free article] [PubMed] [Google Scholar]
- 50.Seglen PO. Preparation of isolated rat liver cells. Methods Cell Biol. 1976;13:29–83. . [DOI] [PubMed] [Google Scholar]
- 51.Holbeck SL, Collins JM, Doroshow JH. Analysis of Food and Drug Administration-approved anticancer agents in the NCI60 panel of human tumor cell lines. Mol Cancer Ther. 2010. May;9(5):1451–60. doi: 10.1158/1535-7163.MCT-10-0106 . Pubmed Central PMCID: 2868078. [DOI] [PMC free article] [PubMed] [Google Scholar]
- 52.Shoemaker RH. The NCI60 human tumour cell line anticancer drug screen. Nat Rev Cancer. 2006. October;6(10):813–23. doi: 10.1038/nrc1951 . [DOI] [PubMed] [Google Scholar]
Associated Data
This section collects any data citations, data availability statements, or supplementary materials included in this article.
Supplementary Materials
(TIF)
4 mg/kg group received 18 days daily treatment while 5 and 6 mg/kg groups received 14 days daily treatment. The values are expressed as mean ± SEM of 3–6 animals per group.
(TIF)
(DOCX)
Data Availability Statement
All relevant data are within the paper and its Supporting Information files.


