Abstract
To address carbohydrates that are commonly used in biomedical applications with low binding affinities for boronic acid based detection systems, two chemical modification methods were utilized to increase sensitivity. Modified carbohydrates were analyzed using a two component fluorescent probe based on boronic acid-appended viologen–HPTS (4,4′-o-BBV). Carbohydrates normally giving poor signals (fucose, l-rhamnose, xylose) were subjected to sodium borohydride (NaBH4) reduction in ambient conditions for 1 h yielding the corresponding sugar alcohols from fucose, l-rhamnose and xylose in essentially quantitative yields. Compared to original aldoses, apparent binding affinities were increased 4–25-fold. The chlorinated sweetener and colon permeability marker sucralose (Splenda), otherwise undetectable by boronic acids, was dechlorinated to a detectable derivative by reactive oxygen and hydroxide intermediates by the Fenton reaction or by H2O2 and UV light. This method is specific to sucralose as other common sugars, such as sucrose, do not contain any carbon-chlorine bonds. Significant fluorescence response was obtained for chemically modified sucralose with the 4,4′-o-BBV–HPTS probe system. This proof of principle can be applied to biomedical applications, such as gut permeability, malabsorption, etc.
1. Introduction
Analysis of carbohydrates in solution continues to be an important aspect of several areas of research for the environmental,1 food,2 pharmaceutical,3 biomedical,4 and petrochemical5 industries. Biomedical application include gastrointestinal (GI) permeability and malabsorption. GI permeability assessment uses oral ingestion and subsequent analysis of combinations of sugars and sugar analogs in urine. Performing GI permeability assessment provides an alternative approach to screening for malnutrition and maladies associated with several gastrointestinal diseases.6 Existing analytical methods require the use of expensive instruments, such as HPLC coupled to mass spectrometry. Although sensitive, the labor-intensive nature of these methods and cost per analysis hinder the use of this method in large scale studies that require analysis of multiple samples per day.7 For permeability testing to advance to routine use, more rapid and cost-effective analyses of sugars and sugar alcohols in biological buffers, urine and blood are desirable.
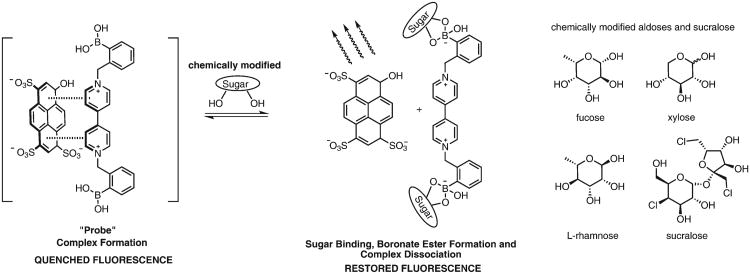
Methodologies developed over the past few years, for sugar analysis, can be divided into two main analytical categories: enzymatic or non-enzymatic techniques. The former is usually substrate specific and the latter method usually involves chromatographic techniques (HPLC, GC or CE). Since carbohydrates have no intrinsic chromophore, labeling them with a chromophore allows detection and characterization.8–10 Although effective, there are a few drawbacks that come with using chromatography. For biomedical facilities with limited resources to adapt assays such as permeability tests routinely, effective and user-friendly analytical procedures are needed. From this, non-enzymatic methods have been developed that take advantage of other chemistries, such as supramolecular and boronic acid chemistries; these techniques have developed into major research areas that focus on developing glucose sensors,11,12 and chemoreceptors for other carbohydrate targets.13 Supramolecular chemistry takes advantage of a host–guest type interaction through intermolecular forces upon interaction, the system produces a detectable change in a signal.14,15 In contrast, boronic acid recognition of saccharides displays reversible covalent bonding of diols in saccharides to form boronate esters.12,16 Boronic acid-based methodologies have utilized fluo-rescent17 or electrochemical18 means for quantifying the recognition event. Advantages of using boronic acid based chemo-receptors include ease of synthesis, ability to operate in a wide pH range, and ability to be designed around a plethora of possible reporter–recognition systems.19 Based on the intrinsic affinity of boronic acids to cis-1,2 or cis-1,3 diols, we devised a modular, two-component sensing system comprising the anionic fluorescent dye, 8-hydroxypyrene-1,3,6-trisulfonic acid trisodium salt (HPTS), and a boronic acid-appended viologen (4,4′-o-BBV). This two-component BBV system acts dually as a quencher and a receptor operating at neutral or physiological pH. In the absence of saccharide, a ground-state complex is formed by coulombic attraction between the anionic dye and cationic quencher, with a decrease of HPTS fluorescence intensity. Upon saccharide binding, the boronic acid moiety forms a tetrahedral anionic boronate ester. The negatively charged boronate ester then neutralizes the cationic viologen, diminishing the quenching efficacy of BBV, liberating de-quenched (i.e., fluorescent) HPTS. The strength of the fluorescent signal generated upon dissociation of the ground state complex is dependent on the saccharide concentration (Scheme 1). This system has been extensively studied by our group for the recognition of various saccharides and sugar alcohols (glycitols).20–22
Scheme 1.
Proposed mechanism of signal transduction for a two-component fluorescent probe based on boronic acid-appended viologens (left). Aldoses and sucralose to be chemically modified (right).
The present analytes were chosen because they have bio-medical applications, such as gut permeability,6 malabsorption, and plant physiology.23 While many sugars, such as lactulose and mannitol, give meaningful signals in our fluorescent probe based on boronic acid appended viologen (4,4′-o-BBV), many others do not. In this study, fucose, xylose, l-rhamnose and sucralose, which give weak or no signal, were modified to give increased binding (i.e., higher S/N). In general, boronic acids lack specificity and selectivity for alcohol groups on cyclic forms of carbohydrates, but can have high affinity to the corresponding reduced forms, such as sorbitol relative to glucose.24 Sugar alcohols can have multiple syn-1,2 and/or syn-1,3-diols where boronate ester formation occurs preferentially.24 It has been shown that certain acyclic sugar alcohols can have higher binding affinity towards boronic acids compared with the corresponding aldose or ketose forms. Moreover, boronic acids lack binding affinity to non-reducing, cyclic carbohydrates (aldoses and ketoses), such as sucrose and the artificial sweetener sucralose, as they lack the hemi acetal/ketal group essential for boronic acid binding.25,26 In these sugars and sugar derivatives, the C-1 hydroxyl (hemi acetal/ketal) group on the anomeric carbon is part of the glycosidic linkage and is unavailable for boronic acid binding. Consequently, no fluorescent signals are generated in our two-component system for sucrose and sucralose, important markers used in applications such as assessing gut permeability.27 To develop boronic acid-recognition of saccharides with low binding affinity that are commonly used as gut permeability markers, such as rhamnose, xylose, and sucralose, we needed to generate the signal through chemical modification of these sugars. Signal enhancement with a fluorescence-based boronic acid chemoreceptor has been reported where an amphiphilic, glucose-selective monoboronic acid exhibited an excimer emission enhancement upon aggregation.28 To our knowledge, chemically induced signal amplification of the saccharide boronic acid binding event has not been quantitatively measured. It is known that acyclic sugar alcohols can have higher binding affinity toward boronic acids compared to the corresponding aldose or ketose forms.22,29 We explored pre-treatment reactions for saccharides with low or no binding affinity (i.e., fucose, rhamnose, or xylose) by a simple reductive conversion to corresponding alditols. Aldoses can be reduced by sodium borohydride (NaBH4) in aqueous solution to generate corresponding sugar alcohols in moderate-to-good yields.30 Oligosaccharides can also be reduced by NaBH4 to corresponding alditols. Usually, enzymatic methods are used to quantify product alditols, such as d-mannitol and d-sorbitol.31,32 Our recent work has involved developing a non-enzymatic, multiwell fluorescent assay to quantify these sugar markers which are routinely used to monitor gut permeability.22,33 We were interested in quantifying xylose and l-rhamnose, as these aldoses have also been used to study intestinal permeability.34 Sucralose, a non-reducing trichlorinated sucrose, is used as a marker for colon permeability as it is resistant to fermentation by colonic bacteria.35,36 Carbon–chloride bonds in sucralose were converted into carbon–hydroxyl bonds by the Fenton reaction. This chemical modification is a proof of principle that will enable use of non-interacting carbohydrates that are used for gut permeability test (i.e. xylose, rhamnose, or sucralose). This modification was anticipated to make the product amenable for recognition by the boronic acid viologen (4,4′-o-BBV) in our two-component fluorescent system. In gut permeation studies, we have control on what kind of sugar is administered to the subjects. Consequently, we do not have to address the sugar selectivity problem. We can control this by giving only specific non-interfering sugars, such as lactulose and/or sucralose. Herein we report the quantification of mono- and disaccharides after chemical modifications to amplify the signal in our two-component fluorescent probe system.
2. Experimental
2.1. Chemicals and reagents
All reagents and saccharides were purchased from Sigma Aldrich Co. (USA). Sucralose was purchased from TCI Chemicals and used as received. Hydrogen peroxide (H2O2, 30% w/w) was purchased from Fisher Scientific International. All solvents were at least HPLC grade. Acetonitrile (MeCN) was obtained from a solvent purification system, sent to an ampoule under argon and stored no more than 4 weeks before use. Ultra-pure water (>14 MΩ cm−1) obtained from a Millipore water system was used for buffers and other solutions. The synthesis of 4,4′-o-BBV was performed as previously reported.21,22
2.2. Instrumentation
For multiwell fluorescence measurements, solutions were pipetted onto a 96-well plate (#3694, Corning, USA) and a fluorescence plate reader (Envision® 2103 Multi-label, PerkinElmer) was used (excitation filter, 405 nm; emission filter, 535 nm, emission aperture, normal, measurement height from the bottom, 6.5 mm; number of flashes, 10). A monochromator based plate reader was used to scan for optimal wavelengths for HPTS fluorescence and sucralose absorbance (Spark 10 M, Tecan, Austria).
2.3. Data analysis
Apparent binding constants were determined by non-linear curve fitting using the following equation.37,38
| (1) |
where F0 is the fluorescence intensity in the absence of analyte; F is the fluorescence intensity after the addition of analyte; Fmax is the fluorescence intensity at which no further signal is obtained with further analyte addition; Kb is the apparent binding constant and [A] is analyte concentration. Kb was solved using Origin lab software (OriginLab Corp, Northampton, MA, USA, was used to perform the calculation) following the Benesi–Hildebrand plot where it is assumed that a 1 : 1 binding stoichiometry is present.39,40 Binding constants were calculated to compare before and after modification of aldoses.
2.4. NaBH4 reduction of aldoses
To a 10 mL round bottom flask, the aldose sugar (0.1 mmol) and 0.05 M sodium phosphate-HEPES buffer (5 mL) was added and the aldose solution (20 mM) was stirred for 5 minutes. Then, NaBH4 (0.011 g, 0.3 mmol) was added, and the reaction mixture stirred for 1 h at 25 °C. The resulting solution was serially diluted with 0.05 M sodium phosphate-HEPES buffer to obtain the desired concentration points (10 mM–0.1 mM) for fluorescence measurements.
2.5. Dechlorination of sucralose by Fenton reaction
To a 25 mL round-bottomed flask, sucralose (0.0795 g, 0.2 mmol), FeSO4·7H2O (0.0278 g, 0.1 mmol), and deionized H2O (9.979 mL) were added and stirred for 5 min. Then, (21 μL, 0.2 mmol) of a 30% w/w solution of H2O2 (9.79 M) was added to the reaction mixture, producing a translucent bronze color; the mixture was then stirred for 1 h at 25 °C. The reaction mixture containing the dechlorinated sucralose was diluted in 0.1 M sodium phosphate buffer, pH 7.4 to obtain fluorescence intensity values for different concentrations (10 mM–0.1 mM). Samples were centrifuged at 2500 relative centrifugal force (RCF) for 5 min. Supernatants were pipetted onto a 96 well plate and analyzed for modified sucralose by the 4,4′-o-BBV–HPTS assay.
2.5.1 Dechlorination of sucralose by photooxidation
Serial diluted preparations of sucralose were prepared in 1 : 1 30% (w/w) H2O2 solution and deionized water. Sucralose was found to have an absorbance peak near 265 nm with no absorbance above 300 nm, whereas H2O2 had a narrow peak at 357 nm. A Spectroline TVC 312R/F transilluminator equipped with an 8 Watt lamp with a peak at 360 nm (negligible below 300 nm) was used to selectively photo-oxidize H2O2 of different sucralose dilutions, which were incubated for 2 h. Others were kept under ambient conditions. After UV treatment, 1 μg μL−1 catalase was added to the tubes and incubated for 5 min to sequester remaining H2O2. All the samples were vortexed and centrifuged at 2500 RCF for 10 min. Supernatants were pipetted onto a 96 well plate and analyzed for modified sucralose by the 4,4′-o-BBV–HPTS assay.
2.6. Fluorescence recovery measurements by BBV–HPTSprobe of chemically modified aldoses and sucralose
Ready-made plates were prepared by adding 10 μL of the 4,4′-o-BBV–HPTS probe solution as 4-fold concentrate (1.6 mM 4,4′-o-BBV and 16 μM HPTS) in 0.1 M sodium phosphate HEPES buffer pH 7.4 containing 0.04% Triton X-100 (4× buffer). At the time of running the assay, each well received 30 μL of sample in quadruplicate. Blank wells were given 10 μL 4× buffer with neither HPTS nor 4,4′-o-BBV. Baseline fluorescence wells contained 30 μL of buffer and 10 μL of probe solution. Fluorescence recovery of HPTS was measured on the plate reader. After blank subtraction, fluorescence intensity (F) for each analyte concentration relative to initial quenched (F0) HPTS (F/F0) ratio was calculated. Under these conditions, F0 is a non-zero value after background subtraction with about 20% of maximum fluorescence intensity of HPTS.
3. Results and discussion
3.1. Reduction of low affinity aldoses increases fluorescence signal in the BBV–HPTS system
The present analytes were chosen because they have bio-medical applications, such as gut permeability6 and malabsorption. While many sugars, such as lactulose and mannitol, give meaningful signals in our fluorescent probe based on boronic acid appended viologen (4,4′-o-BBV), many others do not. In this study, fucose, xylose, l-rhamnose, which give weak or no signal, were modified by sodium borohydride to give increased binding. Sodium borohydride is used widely in organic synthesis, using aprotic polar and aqueous solvent systems. To increase the aldose-boronic acid binding affinity, the aldoses fucose, l-rhamnose and xylose were reduced with NaBH4 in neutral buffer at ambient conditions. Resulting alditols were quantified using 4,4′-o-BBV–HPTS probe (Scheme 2).
Scheme 2.

Reaction scheme for the reduction of aldoses and quantification by the 4,4′-o-BBV–HPTS probe.
Using NaBH4 in an aqueous system can create an alkaline solution. The boronic acids in our two-component fluorescent probe are sensitive to pH changes of the medium and can generate false positive signals in pH > 8.41 This system has been extensively studied and we have determined that the two-component fluorescent probe is unaffected by borate salts or high salt concentration. To further prevent this false positive signal produced by increasing pH of the medium, optimization of NaBH4 equivalences and buffer system was conducted. It was determined that three equivalences of NaBH4 to the aldose sugar in 0.05 M sodium phosphate HEPES buffer was optimal to achieve an alditol specific fluorescent signal under the reaction conditions (Fig. S-1†). Finally, the strong buffering capacity of the 4× buffer in the wells clamps the pH at 7.4 during the fluorescence measurements. Compared to unreacted aldose, reduced aldoses provided significantly enhanced fluorescent signals with at least a 4-fold increase for fucose and up to 2-fold difference for reduced l-rhamnose at 10 mM concentration (Fig. 1A & B).
Fig. 1.
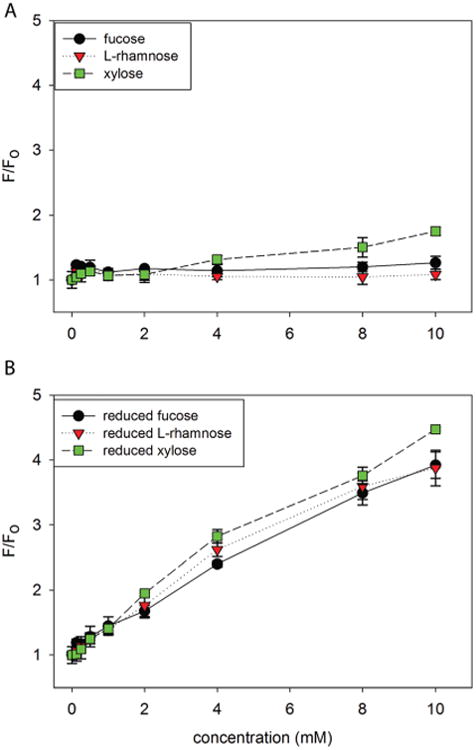
Normalized HPTS (4 μM final concentration) fluorescence recovery (F0 = initial baseline fluorescence, F = recovered fluorescence) with 4,4′-o-BBV as the boronic acid receptor of each aldose before and after NaBH4 reduction. A. Non-reduced B. reduced aldoses fucose, l-rhamnose, and xylose in 0.05 M sodium phosphate-HEPES buffer solution, pH 7.4. Error bars represent standard deviation of quadruplicate responses.
Similarly, the binding constants for each aldose versus reduced aldose provided a significant difference. Apparent binding constants for reduced aldoses provided 4, 7, and 25 times higher for reduced fucose, l-rhamnose, and xylose respectively (Table S-1 & Fig. S-2†). We observed the following order of apparent binding affinities: l-rhamnose > xylose > fucose. This demonstrates that the reduced forms of each aldose has a higher binding affinity for the boronic acid receptor 4,4′-o-BBV, reconfirming that sugar alcohols have higher binding affinities compared to their aldose form when comparing the diastereomers fucose and l-rhamnose, and xylose (Fig. S-3†). In addition, sensitivity for each sugar improved upon reduction, as indicated by lower detection limits (signal to noise ratio greater than 3 standard deviations of baseline values) (Table S-2†).
Because reduction is carried out under ambient temperature and near neutral pH, we suspected that these aldoses were reduced without any epimerization. Since xylitol is commercially available, the fluorescent signal for commercial xylitol and reduced xylose were compared to determine the extent of epimerization, if any, during the reduction step. The reduction of xylose was performed under the same conditions as previously described, and commercially available xylitol was used to compare the fluorescence recovery for both standard sugar alcohol solutions using 4,4′-o-BBV as the boronic acid receptor (Fig. 2).
Fig. 2.
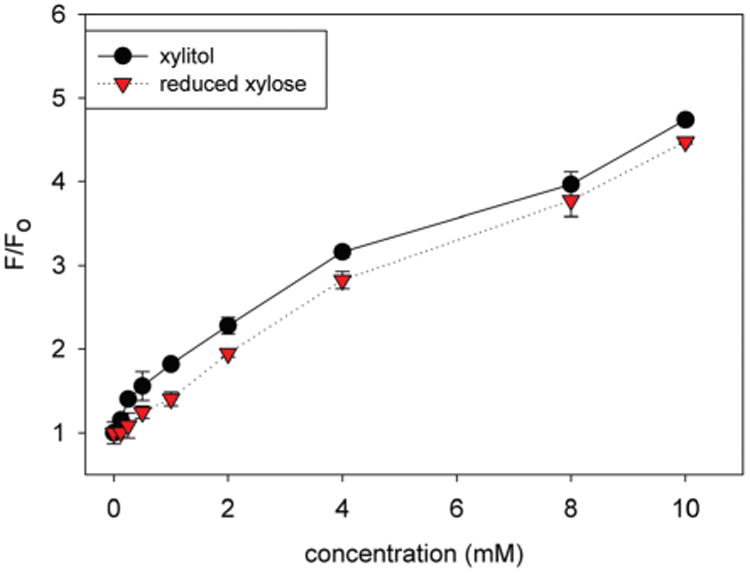
Normalized HPTS (4 μM final concentration) fluorescence recovery (F0 = initial baseline fluorescence, F = recovered fluorescence) with 4,4′-o-BBV as the boronic acid receptor comparing commercially available xylitol (black) to reduced xylose (red) in 0.05 M sodium phosphate-HEPES buffer, pH 7.4. Error bars represent standard error mean of quadruplicate responses.
The fluorescence signal for commercial and synthetic (reduced xylose) xylitol was up to 2-fold higher than xylose at 10 mM. Additionally, there was no difference in apparent binding constants (66 ± 8.6 M−1 versus 52.3 ± 12.2 M−1) for commercial xylitol and synthetic xylitol. It was concluded with high confidence that these reductions occur without any epimerization and afford mainly the corresponding alditols. It is also clear that the glycitol product can be readily quantified using boronic acid-based detection systems such as our two-component fluorescent probe (4,4′-o-BBV–HPTS).22
3.3. Fenton reaction and UV photooxidation of sucralose yields detectable analyte in BBV–HPTS system
Sucralose has become one of the most widely used artificial sweeteners in the food industry due to its poor metabolism and 600 times higher sweetness index than sucrose. When humans consume it, sucralose is excreted intact into the environment, being resistant to metabolic degradation; it even survives the wastewater treatment process.42 Consequently, sucralose has become an excellent gut permeability marker, in particular, for colon permeability due to gut diseases, such as IBD, IBS, Crohn's disease, colitis, and colon cancer. In gut permeation studies, we have control on what kind of sugar is administered to the subjects. Consequently, we do not have to address the sugar selectivity problem. We can control this by giving only specific non-interfering sugars, such as lactulose and/or sucralose. We envisaged that development of rapid, cost-effective, and reliable analytical methods for the in-field analysis of sucralose will continue to grow in importance. We were interested in quantifying sucralose by boronic acid based detection methods as it can provide a platform for low-cost, practical, and rapid gut permeation analysis compared to conventional methods, such as HPLC and MS. Sucralose is a non-reducing sugar; based on our earlier studies we have shown that the hemiacetal (or hemiketal) in reducing sugars is critical for boronic acid recognition. Consequently, sucralose could not be detected by our two-component HPTS–BBV system33 and warranted chemical modification induced signal amplification of sucralose. Therefore, sucralose was subjected to chemical modification by reactive oxygen intermediates generated in situ by the Fenton reaction using ferrous iron and H2O2 as the oxidant.43,44 Additionally, these reactive intermediates can be generated using photolysis of H2O2 by UV light, typically around 360 nm.45 Sucralose, which has real world applications, does not give a signal in this assay. The oxidation product, however, interacts with BBV's to give a measurable enhanced signal. Our intent in this work, in which mM concentrations were convenient, was to demonstrate a chemical process. Currently, a mixture of sugars, such as sucralose, lactulose, mannitol, is orally administered. Among these, only sucralose reaches the colon and escapes microbial fermentation. Consequently, we focused only on these “limited subset” of saccharides that are important for gut permeation studies.
Sucralose was dechlorinated using ferrous sulfate hepta-hydrate and 30% w/w H2O2 in water under ambient conditions for over an hour to obtain the hydroxylated product. The initially displaced chloride ions were confirmed by a qualitative AgNO3 test after one hour by observing precipitation of AgCl. Optimal amounts of FeSO4 and H2O2 were determined to eliminate false positives and to achieve optimal measurements of modified sucralose. The fluorescence signal for dechlorinated sucralose product was compared to unreacted sucralose and the control reaction (absence of sucralose), which ruled out false positive signals (Fig. 3).
Fig. 3.
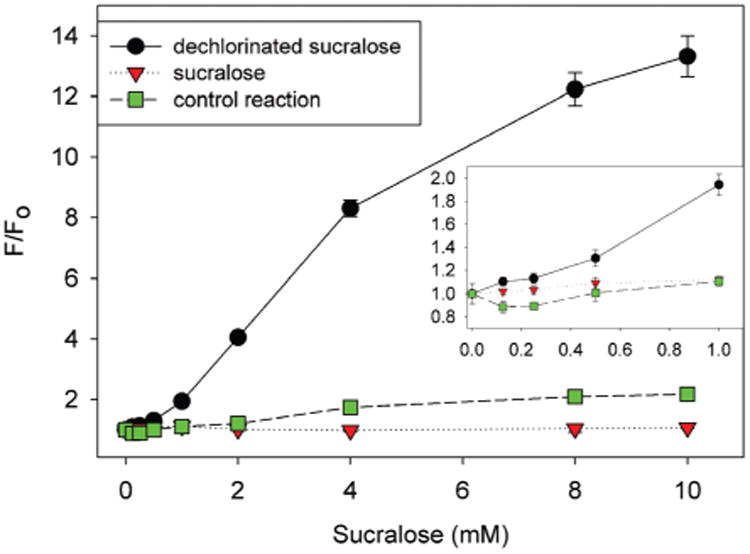
Normalized 4,4′-o-BBV–HPTS probe (4 μM HPTS final concentration) fluorescence recovery (F0 = initial quenched fluorescence, F = recovered fluorescence) for dechlorinated sucralose obtained by the Fenton reaction (black), sucralose (red), and control reaction (green) in 0.05 M sodium phosphate-HEPES pH 7.4 buffer. Inset is the fluorescence recovery in the lower range. Error bars represent standard error mean of quadruplicate responses.
For the dechlorinated sucralose, there was up to a 13-fold increase in fluorescence signal at 10 mM sucralose conversion product with an apparent binding constant of 52.5 ± 4.3 M−1 (HPTS spectral change Fig. S-4†). Untreated sucralose provided no fluorescence signal and hence its binding affinity was not determined. The reagents FeSO4 and H2O2 alone, in the absence of sucralose, gave small fluorescence signal above 4 mM concentration. Residual peroxide or hydroxyl radical can oxidize C–B bond and release free HPTS. However, this side reaction happens only at concentrations above 2 mM. Similarly, we sought to measure sucralose photooxidation of H2O2 by ultraviolet light to dechlorinate sucralose. This alleviated the need to use other reagents besides H2O2 and might be considered to be a milder approach (Fig. 4).
Fig. 4.
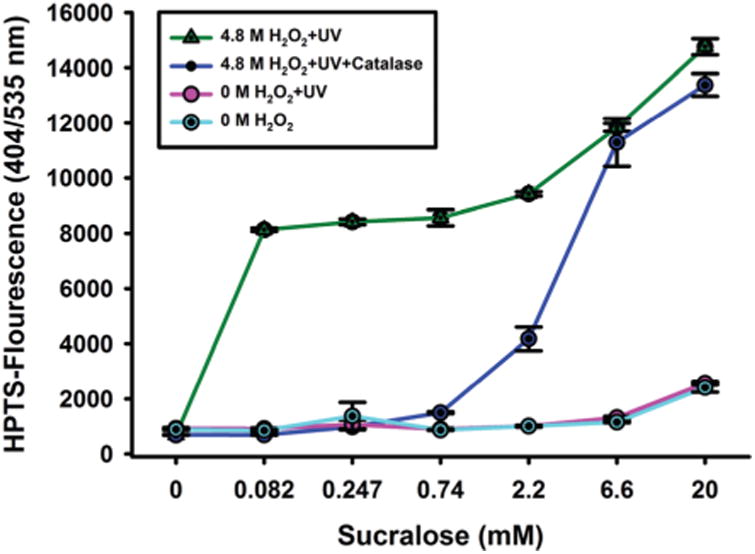
Fluorescence recovery of 4,4′-o-BBV–HPTS probe of sucralose recognition in the presence of H2O2 and UV light (green); H2O2, UV light and catalase (blue); in the absence of H2O2 with and without UV light (purple and cyan respectively). Error bars represent standard error mean for quadruplicate measurements.
Using this method, similar recoveries and detection limits were obtained, with limit of detection and quantification of 170 μM and 280 μM respectively. Having catalase to sequester unreacted H2O2 was critical for obtaining fluorescence measurements. H2O2 can oxidize the boronic acid moiety, which would affect the quenched ground state complex and subsequently generate a false positive signal. Elucidation of the modified sucralose has been previously demonstrated using mass spectrometry by photooxidation of H2O2 in the presence of UV light.46 Two dominant products were detected: isomers from dechlorination of the C-1 primary alkyl chloride carbon bond and those from dechlorination of the C-4 secondary alkyl chloride carbon bond. This gave m/z of 379 and 381 respectively. We anticipated, by analogy, that our chemical modification of sucralose would lead to more than one product as well. Given the significant fluorescence recovery, it is plausible that a sugar alcohol derivative was generated.
4. Conclusions
Some aldoses have low binding affinities to our two-component fluorescent probe based on boronic acid appended viologen (4,4′-o-BBV–HPTS). These sugars are converted to their glycitol form by NaBH4 reduction to increase HPTS fluorescence response. This modification provided good to excellent yields of the corresponding glycitols. Using the 4,4′-o-BBV–HPTS probe, glycitols were measured by HPTS fluorescence recovery. Compared to unreacted fucose, l-rhamnose, and xylose, reduced aldoses yielded at least 4-fold difference in binding affinity. Based on earlier findings, certain sugar alcohols have higher binding affinities for the boronic acid viologen receptor (4,4′-o-BBV) compared to the corresponding aldose forms.22,29 Further, in situ modification of sucralose using reactive oxygen and hydroxide intermediates generated by the Fenton reaction or by photooxidation of H2O2 by ultraviolet light is demonstrated. Compared to native sucralose, significantly increased fluorescence recovery was obtained by the dechlorination reaction. When utilizing boronic acid based detection methods for measuring aldose or sugar derivatives for gut permeation analysis, such as sucralose, xylose or l-rhamnose, simple chemically induced signal amplification can be achieved to circumvent the need for using conventional chromatographic methods for quantification of these sugars. This proof of principle method to increase the fluorescence signal for minimally binding or non-binding sugar gut markers that are not metabolized is a step closure for adapting gut permeability studies in low resource laboratories through the use of simple and effective boronic acid based fluorescent systems.
Supplementary Material
Acknowledgments
The authors thank Mary N. Wessling and Ritchie A. Wessling for proofreading and editing. A. R. also acknowledges the graduate research fellowship support from the Initiative for Maximizing Student Diversity (IMSD, grant 5R25GM058903). D.-L. W gratefully acknowledges support from Bengt Ihre's Foundation (SLS-411011, SLS-503061, SLS-591271 & SLS-594831), Swedish Medical Association (SLS-411921 & SLS-503131), RFR, Uppsala/Örebro region (RFR-476131), Gastroenterology Research Foundation Sweden, (SLS-504191), ALF funds 2015, Björklund's Foundation (SLS-589741) and OE and Edla Johansson's Science Foundation 2017.
Footnotes
Electronic supplementary information (ESI) available: Experimental procedures, characterization of boronic acid receptor (4,4′-o-BBV), and additional fluorescence data. See DOI: 10.1039/c7ob01893b
Conflicts of interest: There are no conflicts to declare.
References
- 1.Fukasawa Y, Tateno O, Hagiwara Y, Hirose D, Osono T. Ecol Res. 2012;27:735–743. [Google Scholar]
- 2.Golovchenko VV, Khramova DS, Ovodova RG, Shashkov AS, Ovodov YS. Food Chem. 2012;134:1813–1822. doi: 10.1016/j.foodchem.2012.03.087. [DOI] [PubMed] [Google Scholar]
- 3.da Cunha AL, de Oliveira LG, Maia LF, de Oliveira LFC, Michelacci YM, de Aguiar JAK. Carbohydr Polym. 2015;134:300–308. doi: 10.1016/j.carbpol.2015.08.006. [DOI] [PubMed] [Google Scholar]
- 4.Wang HC, Lee AR. J Food Drug Anal. 2015;23:191–200. doi: 10.1016/j.jfda.2014.12.001. [DOI] [PMC free article] [PubMed] [Google Scholar]
- 5.Fujieda T, Kitamura Y, Yamasaki H, Furuishi A, Motobayashi K. Biomass Bioenergy. 2012;44:135–141. [Google Scholar]
- 6.Bjarnason I, Macpherson A, Hollander D. Gastroenterology. 1995;108:1566–1581. doi: 10.1016/0016-5085(95)90708-4. [DOI] [PubMed] [Google Scholar]
- 7.Miki K, Butler R, Moore D, Davidson G. Clin Chem. 1996;42:71–75. [PubMed] [Google Scholar]
- 8.Lamari F, Theocharis A, Hjerpe A, Karamanos NK. J Chromatogr, B: Biomed Appl. 1999;730:129–133. doi: 10.1016/s0378-4347(99)00184-x. [DOI] [PubMed] [Google Scholar]
- 9.Anumula KR. Anal Biochem. 2014;457:31–37. doi: 10.1016/j.ab.2014.04.019. [DOI] [PubMed] [Google Scholar]
- 10.Andersen KE, Bjergegaard C, Sorensen H. J Agric Food Chem. 2003;51:7234–7239. doi: 10.1021/jf030329e. [DOI] [PubMed] [Google Scholar]
- 11.Hansen JS, Christensen JB. Biosensors. 2012;3:400–418. doi: 10.3390/bios3040400. [DOI] [PMC free article] [PubMed] [Google Scholar]
- 12.Zhai WL, Sun XL, James TD, Fossey JS. Chem – Asian J. 2015;10:1836–1848. doi: 10.1002/asia.201500444. [DOI] [PubMed] [Google Scholar]
- 13.Taylor MS. Acc Chem Res. 2015;48:295–305. doi: 10.1021/ar500371z. [DOI] [PubMed] [Google Scholar]
- 14.You L, Zha DJ, Anslyn EV. Chem Rev. 2015;115:7840–7892. doi: 10.1021/cr5005524. [DOI] [PubMed] [Google Scholar]
- 15.James TD, Shinkai S. Host-Guest Chemistry: Mimetic Approaches to Study Carbohydrate Recognition. 2002;218:159–200. [Google Scholar]
- 16.Bull SD, Davidson MG, Van den Elsen JMH, Fossey JS, Jenkins ATA, Jiang YB, Kubo Y, Marken F, Sakurai K, Zhao J, James TD. Acc Chem Res. 2013;46:312–326. doi: 10.1021/ar300130w. [DOI] [PubMed] [Google Scholar]
- 17.Wang W, Gao XM, Wang BH. Curr Org Chem. 2002;6:1285–1317. [Google Scholar]
- 18.Li M, Zhu WH, Marken F, James TD. Chem Commun. 2015;51:14562–14573. doi: 10.1039/c5cc04976h. [DOI] [PubMed] [Google Scholar]
- 19.Cao HS, Heagy MD. J Fluoresc. 2004;14:569–584. doi: 10.1023/b:jofl.0000039344.34642.4c. [DOI] [PubMed] [Google Scholar]
- 20.Schiller A, Wessling RA, Singaram B. Angew Chem, Int Ed. 2007;46:6457–6459. doi: 10.1002/anie.200701888. [DOI] [PubMed] [Google Scholar]
- 21.Gamsey S, Miller A, Olmstead MM, Beavers CM, Hirayama LC, Pradhan S, Wessling RA, Singaram B. J Am Chem Soc. 2007;129:1278–1286. doi: 10.1021/ja066567i. [DOI] [PubMed] [Google Scholar]
- 22.Resendez A, Panescu P, Zuniga R, Banda I, Joseph J, Webb DL, Singaram B. Anal Chem. 2016;88:5444–5452. doi: 10.1021/acs.analchem.6b00880. [DOI] [PMC free article] [PubMed] [Google Scholar]
- 23.Hanania U, Ariel T, Tekoah Y, Fux L, Sheva M, Gubbay Y, Weiss M, Oz D, Azulay Y, Turbovski A, Forster Y, Shaaltiel Y. Plant Biotechnol J. 2017;15:1120–1129. doi: 10.1111/pbi.12702. [DOI] [PMC free article] [PubMed] [Google Scholar]
- 24.Evans WJ, McCourtney EJ, Carney WB. Anal Biochem. 1979;95:383–386. doi: 10.1016/0003-2697(79)90743-7. [DOI] [PubMed] [Google Scholar]
- 25.Dowlut M, Hall DG. J Am Chem Soc. 2006;128:4226–4227. doi: 10.1021/ja057798c. [DOI] [PubMed] [Google Scholar]
- 26.Vilozny B, Schiller A, Wessling RA, Singaram B. Anal Chim Acta. 2009;649:246–251. doi: 10.1016/j.aca.2009.07.032. [DOI] [PubMed] [Google Scholar]
- 27.Al-Saffar A, Halim MA, Hall G, Hellstrom PM, Webb DL. Gastroenterology. 2016;150:S956–S956. [Google Scholar]
- 28.Huang YJ, Ouyang WJ, Wu X, Li Z, Fossey JS, James TD, Jiang YB. J Am Chem Soc. 2013;135:1700–1703. doi: 10.1021/ja311442x. [DOI] [PubMed] [Google Scholar]
- 29.Peters JA. Coord Chem Rev. 2014;268:1–22. [Google Scholar]
- 30.Abdelakher M, Hamilton JK, Smith F. J Am Chem Soc. 1951;73:4691–4692. [Google Scholar]
- 31.Berezenko S, Sturgeon RJ. Carbohydr Res. 1991;216:505–509. [Google Scholar]
- 32.Sturgeon RJ. Carbohydr Res. 1992;227:375–377. doi: 10.1016/0008-6215(92)85087-g. [DOI] [PubMed] [Google Scholar]
- 33.Resendez A, Abdul Halim M, Landhage CM, Hellstrom PM, Singaram B, Webb DL. Clin Chim Acta. 2015;439:115–121. doi: 10.1016/j.cca.2014.09.031. [DOI] [PMC free article] [PubMed] [Google Scholar]
- 34.Owczuk R, Dylczyk-Sommer A, Wojciechowski J, Paszkiewicz M, Wujtewicz M, Stepnowski P, Twardowski P, Sawicka W, Domzalski M, Wujtewicz MA. Anaesthesiol Intensive Ther. 2016;48:122–127. doi: 10.5603/AIT.a2016.0014. [DOI] [PubMed] [Google Scholar]
- 35.Shaikh M, Rajan K, Forsyth CB, Voigt RM, Keshavarzian A. Clin Chim Acta. 2015;442:24–32. doi: 10.1016/j.cca.2014.12.040. [DOI] [PMC free article] [PubMed] [Google Scholar]
- 36.van Wijck K, Verlinden TJM, van Eijk HMH, Dekker J, Buurman WA, Dejong CHC, Lenaerts K. Clin Nutr. 2013;32:245–251. doi: 10.1016/j.clnu.2012.06.014. [DOI] [PubMed] [Google Scholar]
- 37.Cooper CR, James TD. J Chem Soc, Perkin Trans. 2000;1:963–969. [Google Scholar]
- 38.Cordes DB, Gamsey S, Sharrett Z, Miller A, Thoniyot P, Wessling RA, Singaram B. Langmuir. 2005;21:6540–6547. doi: 10.1021/la050219x. [DOI] [PubMed] [Google Scholar]
- 39.Connors KA. Binding Constants-The Measurement of Molecular Complex Stability. John Wiley; New York: 1987. [Google Scholar]
- 40.Feryforgues S, Lebris MT, Guette JP, Valeur B. J Phys Chem. 1988;92:6233–6237. [Google Scholar]
- 41.Gamsey S, Baxter NA, Sharrett Z, Cordes DB, Olmstead MM, Wessling RA, Singaram B. Tetrahedron. 2006;62:6321–6331. [Google Scholar]
- 42.Torres CI, Ramakrishna S, Chiu CA, Nelson KG, Westerhoff P, Krajmalnik-Brown R. Environ Eng Sci. 2011;28:325–331. [Google Scholar]
- 43.Fenton HJH, Jones HO. J Am Chem Soc. 1900;77:69–76. [Google Scholar]
- 44.Lloyd RV, Hanna PM, Mason RP. Free Radical Biol Med. 1997;22:885–888. doi: 10.1016/s0891-5849(96)00432-7. [DOI] [PubMed] [Google Scholar]
- 45.Goldstein S, Aschengrau D, Diamant Y, Rabani J. Environ Sci Technol. 2007;41:7486–7490. doi: 10.1021/es071379t. [DOI] [PubMed] [Google Scholar]
- 46.Keen OS, Linden KG. Environ Sci Technol. 2013;47:6799–6805. doi: 10.1021/es304339u. [DOI] [PubMed] [Google Scholar]
Associated Data
This section collects any data citations, data availability statements, or supplementary materials included in this article.


